Article

Use of Heavy Metal Content and Modified Water Quality Index to Assess Groundwater Quality in a Semiarid Area

by
Ehsan Kamali Maskooni
1,2,
Mehran Naseri-Rad
1,*,
Ronny Berndtsson
1 and
Kei Nakagawa
3
1
Division of Water Resources Engineering and Centre for Middle Eastern Studies, Lund University, SE 221 00 Lund Box 118, Sweden
2
Department of Watershed Management and Engineering, University of Hormozgan, Bandar Abbas 79161-93145, Iran
3
Institute of Integrated Science and Technology, Nagasaki University, Nagasaki 852-8521, Japan
*
Author to whom correspondence should be addressed.
Water 2020, 12(4), 1115; https://doi.org/10.3390/w12041115
Submission received: 21 March 2020 / Revised: 2 April 2020 / Accepted: 12 April 2020 / Published: 14 April 2020
(This article belongs to the Section Water Quality and Contamination)

Abstract

:
Groundwater is a major source of drinking and agricultural water supply in arid and semiarid regions. Poor groundwater quality can be a threat to human health especially when it is combined with hazardous pollutants like heavy metals. In this study, an innovative method involving entropy weighted groundwater quality index for both physicochemical and heavy metal content was used for a semiarid region. The entropy weighted index was used to assess the groundwater’s suitability for drinking and irrigation purposes. Thus, groundwater from 19 sampling sites was used for analyses of physicochemical properties (electrical conductivity—EC, pH, K+, Ca2+, Na+, SO42−, Cl, HCO3, TDS, NO3, F, biochemical oxygen demand—BOD, dissolved oxygen—DO, and chemical oxygen demand—COD) and heavy metal content (As, Ca, Sb, Se, Zn, Cu, Ba, Mn, and Cr). To evaluate the overall pollution status in the region, heavy metal indices such as the modified heavy metal pollution index (m-HPI), heavy metal evaluation index (HEI), Nemerow index (NeI), and ecological risks of heavy metals (ERI) were calculated and compared. The results showed that Cd concentration plays a significant role in negatively affecting the groundwater quality. Thus, three wells were classified as poor water quality and not acceptable for drinking water supply. The maximum concentration of heavy metals such as Cd, Se, and Sb was higher than permissible limits by the World Health Organization (WHO) standards. However, all wells except one were suitable for agricultural purposes. The advantage of the innovative entropy weighted groundwater quality index for both physicochemical and heavy metal content, is that it permits objectivity when selecting the weights and reduces the error that may be caused by subjectivity. Thus, the new index can be used by groundwater managers and policymakers to better decide the water’s suitability for consumption.

1. Introduction

Groundwater plays a major role in supplying water for drinking, agricultural, and industrial uses [1,2,3]. For arid and semiarid regions, groundwater resources are especially important in terms of quantity and quality. Under these climatic conditions, groundwater overconsumption has led to decreased quality or contamination that may impose hazards to society [4,5]. Especially, heavy metals are important to monitor due to their toxicity.
There are various methods for dealing with heavy metal pollution in groundwater resources. These could be pumped and treated [6], be absorbed [7] by various kinds of absorbents [8], captured by nanoparticles [9] in micromixers [10,11], and removed by more natural solutions like wetlands [12]. However, implementing any remedy measure needs sufficient understanding of the situation and a reliable inclusive assessment of the potential risk. Evaluating water quality is of paramount importance in this sense.
Many methods such as multivariate statistical techniques (e.g., cluster analysis, principal component analysis, and factor analysis) [13,14], hydro-geochemical evaluation [15,16], heavy metal indices (e.g., heavy metal pollution index, degree of contamination, heavy metal evaluation index, contamination factor, and health risk assessment) [17,18,19], and water evaluation indices [13] have been developed for assessing water quality considering physicochemical parameters. Grading water quality indicators largely depends on indicator concentration and the rate of relative toxicity. One of the most applicable methods is Water Quality Index (WQI) that summarizes the quality of water for drinking and other purposes [3,20,21]. This index provides a single number as a measure of overall water quality at a specific location and time. However, WQI needs weights for the different chemical elements. These are usually assigned subjectively by experts [15,22]. Additionally, various water quality indices have been proposed for evaluation of water quality based on heavy metals [23,24]. One of these indices is heavy metal pollution index (HPI). This method considers maximum desirable limit and maximum permissible limit of each heavy metal for water quality characterization. According to recent regulatory guidelines, a number of heavy metals are now being considered under the nonrelaxation category [25]. Hence, HPI cannot be calculated using the latest regulatory guidelines. However, a modified heavy metal pollution index (m-HPI) method [26] overcomes this and other limitations of previous methods. This index is based on only highest desirable concentration (Ii) and does not depend on the maximum permissible concentration (Si). Furthermore, similar indices are the heavy metal evaluation index (HEI), the Nemerow index (NeI), and the ecological risks of heavy metals in groundwater [23,25,26,27].
Although several studies have assessed the groundwater quality based on heavy metal pollution for different purposes [4,23,28,29,30,31], there are only a few studies in arid and semiarid regions [22,24,32]. Considering this, the main objective of the current study is to test an innovative method involving entropy weighted groundwater quality index (EWQI) for both physicochemical and heavy metal content in a semiarid region that can be used by decision and policymakers for improving water resources management. Thus, the EWQI was used and compared to other pollution indices such as m-HPI, HEI, NeI, and ERI to evaluate the status of the overall pollution level of groundwater in the study area with respect to physicochemical properties (electrical conductivity—EC, pH, K+, Ca2+, Na+, SO42−, Cl, HCO3, TDS, NO3, F, biochemical oxygen demand—BOD, dissolved oxygen—DO, and chemical oxygen demand—COD) and nine important heavy metals (As, Ca, Sb, Se, Zn, Cu, Ba, Mn, and Cr). The outcomes provide essential information on the suitability of the water source for different uses. The results can be used by decision-makers as a guide for managing the aquifer from both quantitative and qualitative viewpoints.

2. Materials and Methods
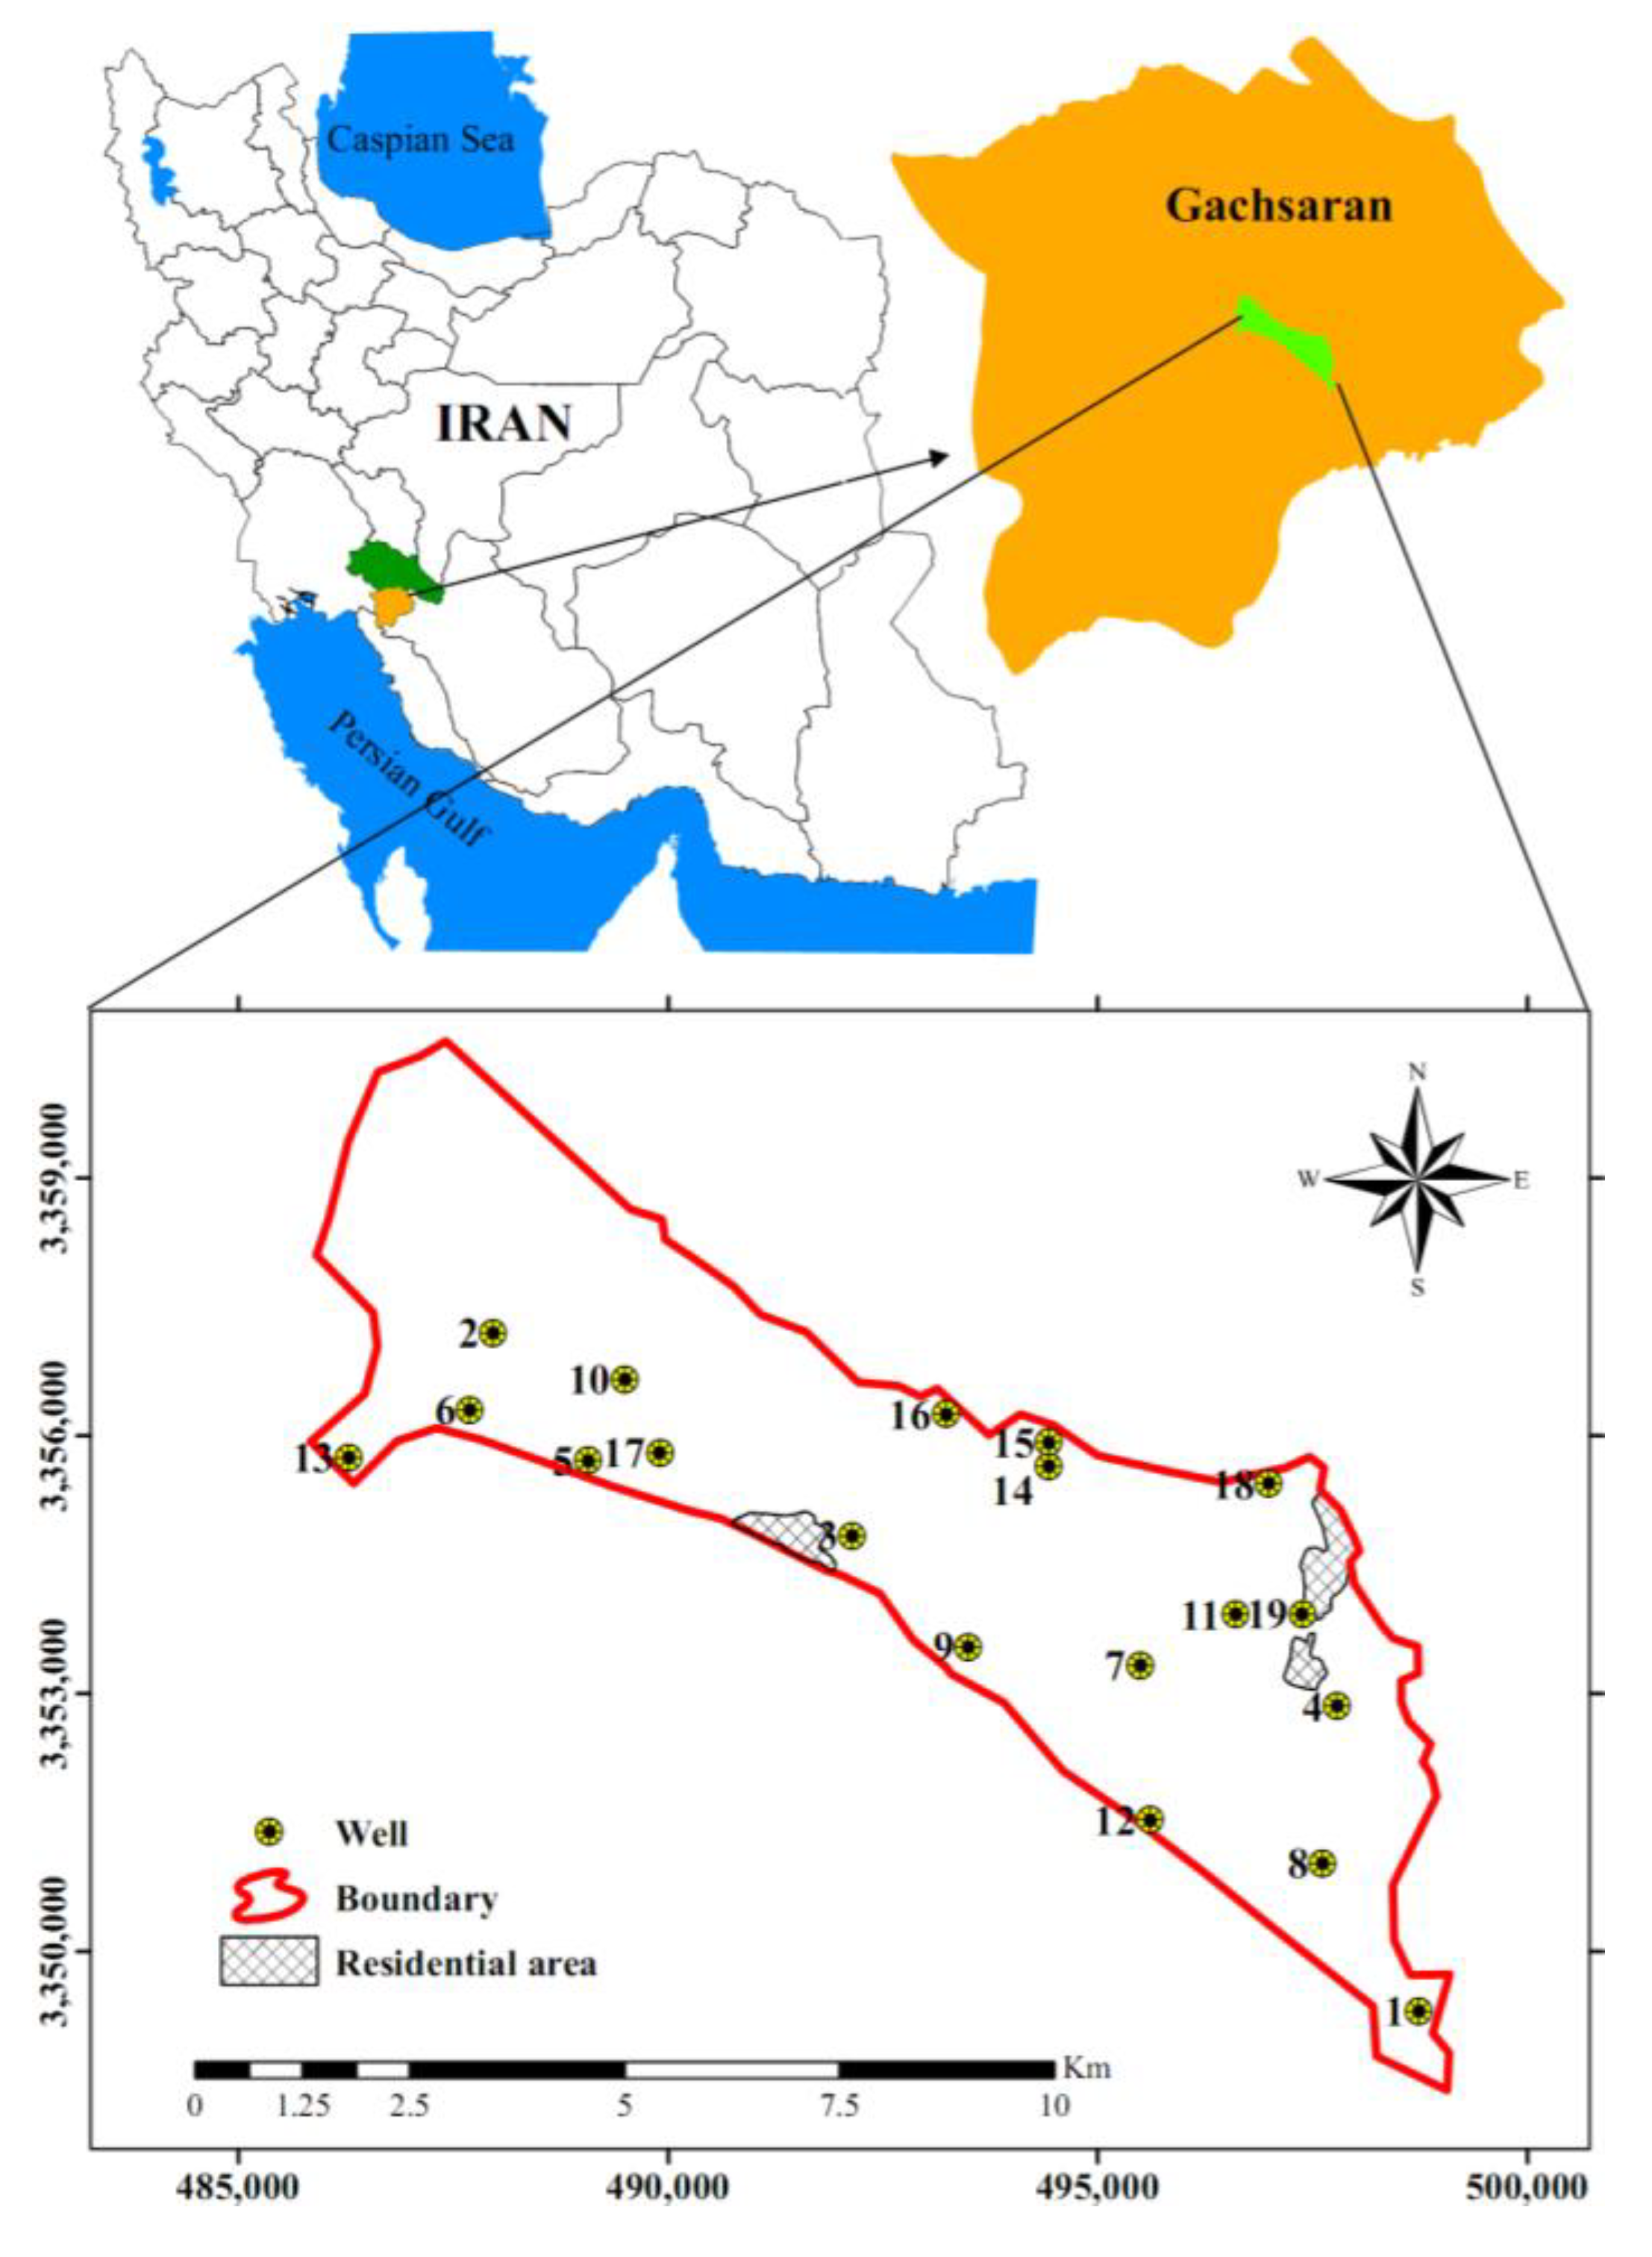
2.1. Study Area

The Imam Zadeh Jafar Aquifer is located in Gachsaran City, southwest Iran, between longitude 50°50′ and 51°09′ E and latitude 30°13′ and 30°28′ N (Figure 1). The average elevation of the area is 720 m above mean sea level. The mean annual precipitation and temperature are 395 mm and 23 °C, respectively. The average thickness of the aquifer is approximately 80 m. The geological material is composed of course material like cobblestone, sandstone, gravel, and sand in the northern parts, gravel, and sand in central parts, and finer material like silt and clay in the southern parts [33]. There are no clay lenses within this unconfined aquifer.
Generally, groundwater is the only resource of water for drinking and irrigation purposes in the study area. However, there are several industrial pollution sources such as slaughterhouses, industrial parks, and beverage and asphalt plants in the study area. Another important contaminant source in the area is agriculture. The intense agricultural activity has led to overuse of pesticides, herbicides, and fertilizers. Groundwater polluted with heavy metals may have severe effects on public health. Hence, monitoring and studying the potential sources of water pollution from metal sources are necessary in the study area.

2.2. Sample Collection and Analytical Procedure

In 2009, nineteen existing wells were selected in the region and sampled for different groundwater quality parameters. The wells are used for drinking, irrigation, and industrial purposes depending on location in the region (Figure 1). Electrical conductivity (EC) and pH were measured on site. Other parameters such as potassium (K+), calcium (Ca2+), magnesium (Mg2+), sodium (Na+), sulfate (SO42−), chloride (Cl), bicarbonate (HCO3), total dissolved solids (TDS), nitrate (NO3), fluoride (F), biochemical oxygen demand (BOD), dissolved oxygen (DO), chemical oxygen demand (COD), arsenic (As), cadmium (Cd), antimony (Sb), selenium (Se), zinc (Zn), copper (Cu), barium (Ba), manganese (Mn), and chromium (Cr) were analyzed in the laboratory. Additionally, the concentration of other heavy metals such as Pb, Ni, Hg, and Fe was analyzed as well; however, the content of these was insignificant or close to zero. Hence, these elements were not included in the study. The analytical method for each chemical parameter is presented in Table 1. The accuracy of the chemical analysis was validated by calculating charge balance errors (CBE) using:
CBE =   cations   anions   cations +   anions × 100
where CBE is in percent and concentration of all cations and anions are in meq/L. The ion balance error for all groundwater samples ranged from 1 to 6.2%.

2.3. Water Quality Index (WQI) and Entropy Weight Method

Water Quality Index (WQI) is a useful method that has been widely used for assessing groundwater quality for drinking water use, with reference to hydro-geochemical parameters and heavy metal pollution [34]. The index provides a single number that is considered as an overall quality index of a sampled water. This can provide insights for deciding if the water needs to be used with special care or caution or if it needs treatment [28,35]. Herein, World Health Organization (WHO) standards (2011) [36] were used to compute quality rate of the hydro-geochemical parameters and heavy metals.
An essential step for using WQI is to assign weights. A common way to assign these weights is to allocate them subjectively based on experience [22] or reference literature [37]. This can lead to over or underemphasizing some parameters and affecting the outcome. In order to avoid subjectivity, entropy-weighted water quality index (EWQI) is employed in this paper [15,22]. Improving objectivity results in reduction of errors that may be caused by subjectivity when choosing the weights [38].
The entropy method was first proposed by Shannon [39] for reducing subjectivity in allocating weights to parameters of different nature. Shannon entropy expresses the degree of uncertainty concealed in a probabilistic or uncertain event [22]. When a parameter is precisely predicted and shows little change, the Shannon entropy weight will be small. Hence, a large change in concentration of a parameter will lead to a larger Shannon weight. This is especially important in water quality assessment when sudden changes occur in the water quality. Otherwise, the natural situation for aquifer water quality is to be almost constant [40,41].
Calculation of entropy weighted water quality index (EWQI) follows four steps according to the below. The first step is to construct the performance matrix. The initial matrix X shows a summary of chemical analysis data when m (i = 1, 2, …, m) wells are monitored to evaluate the water quality, and each well has n measured parameters (j = 1, 2, …, n). Then, x i j represents the value of parameter j in the ith well. The matrix X can be obtained as:
X = [ x 11 x 12 x 21 x 22 x 1 n x 2 n x m 1 x m 2 x m n ]
The second step is to normalize the performance matrix. This step is essential for eliminating errors when there are different units of measurement for different parameters and different quantity grades [22]. To do so, in normalized matrix of νij, each array is divided by the sum of arrays for each column:
v i j = x i j i = 1 m x i j
The third step is to calculate the entropy value. The entropy value of the jth measured parameter is calculated as [42]:
z j = 1 ln ( m ) i = 1 m v i j ln ( v i j )
where zj is the entropy value of the jth parameter.
The fourth step is to calculate the objective weights of each parameter using:
W j = 1 z j i = 1 n 1 z j
where Wj is the weight for the jth parameter. Another quality scaling factor according to [36] is:
q j = [ V j V i d S j V i d ] × 100
where q j is the quality rating for the jth water parameter, V j is the measured jth parameter, Sj is the standard permissible value for the jth parameter assigned by WHO [43], and Vid is the ideal value of jth parameter in pure water (i.e., 0 for all other parameters except for pH = 7). The overall water quality index can thus be estimated by combining the quality scaling factor with the unit entropy weight using:
EWQI = i = 1 n W j × q j
Based on the results of EWQI, water quality can be classified into five classes for drinking water purposes (Table 2).

2.4. Evaluation of Groundwater Quality for Irrigation Purposes

We examined irrigation water suitability of the sampled groundwater for Sodium Adsorption Ratio (SAR; in association with electrical conductivity), sodium percentage (Na%), total dissolved solids (TDS), permeability index (PI), total hardness (TH), and magnesium ratio (MR) as calculated by the following formulas,
  • The Sodium Adsorption Ratio (SAR) was calculated by [44]:
    SAR = Na + ( Ca 2 + + Mg 2 + ) 2 meq / l
  • The sodium percentage is computed with respect to relative proportions of cations present in water using:
    Na % = ( Na + + K + ) ( Ca 2 + + Mg 2 + + Na + + K + ) meq l × 100
  • Doneen [45] classified irrigated water based on permeability index (PI) according to:
    PI = Na + + HCO 3 Ca 2 + + Mg 2 + Na + meq / l × 100
  • Total hardness (TH) was calculated by [46]:
    TH   ( as   CaCO 3 ) mg / L   = ( Ca 2 + + Mg 2 + ) meq / l   × 50
  • Magnesium Ratio (MR) was calculated by [46]:
    MR = Mg 2 + Ca 2 + + Mg 2 + meq l × 100
We used ArcGIS software (10.3) (Esri, Redlands, CA, USA) to demarcate sampling locations and spatial distribution of groundwater quality indices throughout the study area. Inverse distance weighting was applied for interpolation [47].

2.5. Heavy Metal Pollution Indices

2.5.1. Modified Heavy Metal Pollution Index (m-HPI)

To improve the shortcomings of the heavy metal pollution index (HPI) and heavy metal evaluation index (HEI), Chaturvedi et al. [26] defined a modified heavy metal pollution index (m-HPI) for better evaluating water quality for drinking purposes. The m-HPI is calculated as:
m - HPI = i = 1 n m - HPI i
where n is the number of heavy metals considered in the evaluation. The m-HPIi is the modified heavy metal pollution index for ith heavy metal ion defined as:
m - HPI i = ω i Q i
where ωi is the relative weightage factor defined as:
ω i = W i i = 1 n W i
where Wi is the unit weighting factor defined as:
W i = 1 I i
where Ii is maximum permissive level of ith heavy metal concentration (WHO standard). Sub index Qi for the ith heavy metal is defined as:
Q i = M i I i I i
where Mi is the observed concentration of the ith heavy metal. The m-HPI can be divided into metals exceeding or not exceeding maximum permissible level. The former m-HPI is called positive index (PI of m-HPI) and the latter, negative index (NI of m-HPI). Thus, a pair of indices may be computed for each water sample. Based on both of indices, each sample’s water quality related to heavy metal pollution is classified as follows: excellent (−1 ≤ NI ≤ 0 and PI = 0), very good (−1 < NI ≤ 0 and 0 < PI ≤ UL/2), good (−1 < NI ≤ 0 and UL/2 < PI ≤ UL), and unacceptable (NI ≤ 0 and PI > UL), where UL is upper limit of positive index.

2.5.2. Heavy Metal Evaluation Index (HEI)

As for m-HPI, HEI provides an overview of the water quality with respect to heavy metals. The HEI index is calculated based on maximum permissible concentration (MAC) for each target heavy metal using:
HEI = i = 1 n HEI i
where HEIi is the pollution index corresponding to ith heavy metal calculated as:
HEI i = M i H mac i
where Himac is the maximum permissible concentration of ith heavy metal. This method divides the water quality into three classes to demarcate the different level of contamination including: low (HEI < 10), medium (HEI = 10–20), and high (HEI > 20).

2.5.3. Nemerow Index (NeI)

This method is a multifactorial and integrated assessment approach where the index is calculated using [48,49]:
NeI = [ { ( M i / I i ) mean 2 + ( M i / I i ) max 2 } n ] 1 2
where (Mi/Ii)mean is the average value of (Mi/Ii) of all target heavy metals of a water sample and (Mi/Ii)max is the maximum value of (Mi/Ii) among all target heavy metals detected in the water sample. This method classifies the water quality into four categories: insignificant (NeI < 1), slightly (1 ≤ NeI < 2.5), moderately (2.5 ≤ NeI < 7), and heavily (NeI ≥ 7) contaminated.

2.5.4. Ecological Risks of Heavy Metals in Groundwater

We used the ecological risk index (ERI) [50,51] to evaluate the potential ecological hazards associated with heavy metals in groundwater. The ecological risk index was calculated as:
ERI = i = 1 n [ T i × ( M i I i ) ]
where Ti is the biological toxicity factor of the ith target heavy metal. The toxic-response factor of heavy metals is given as: As = 10; Cd = 30; Sb = 7; Cu = 5; Cr = 2; and Zn and Mn = 1 [52,53]. The index classifies the groundwater quality into four groups, low (ERI < 110), moderate (110 ≤ ERI < 200), considerable (200 ≤ ERI < 400), and very high (ERI ≥ 400) risk.

3. Results and Discussions

In the below, we group results in three main parts following a general statistical analysis. The first and second demonstrate the sustainability of groundwater for drinking and irrigation purposes, respectively. In the third, heavy metal pollution indices were used to identify status of the overall pollution level of groundwater resources in the study area.

3.1. Statistical Analysis

Descriptive statistics for observed water quality data are presented in Table 3. The table presents minimum, maximum, mean, standard deviation, permissible limits for drinking water set by World Health Organization, and entropy weight for each parameter used for EWQI assessment. Groundwater in this area is slightly alkaline to neutral, as the recorded pH ranges from 7.1 to 8.3, with a mean of 7.8. The pH is within the permissible limits (6.5–8.5) set by WHO standards for all samples. Electrical conductivity (EC) of the groundwater samples varied from 350 to 3270, with a mean of 1085. The total dissolved solids varied between 165 and 3440 mg/L. The order of cation occurrence was Ca2+ > Na+ > Mg2+ > K+ and the order of anions HCO3 > SO42− > Cl > NO3. The average concentration of HCO3, Ca2+, SO42−, Cl, Na+, Mg2+, NO3, and K+ were 259, 150, 140, 130, 54, 42, 20, and 1 mg/L, respectively. Furthermore, the maximum concentration of Mg2+, Ca2+, HCO3, Cl, SO42−, NO3, F, BOD, and COD was 99.6, 732, 360, 355, 453, 46, 1.4, 7.8, and 7.1 mg/L, respectively. The maximum value exceeded the desirable limits for Mg2+ (30 mg/L), Ca2+ (75 mg/L), HCO3 (300 mg/L), Cl (250 mg/L), SO42− (250 mg/L), NO3 (45 mg/L), F (1 mg/L), BOD (5 mg/L), and COD (5 mg/L) concentration for drinking purpose.
Table 3 illustrates that mean concentration of heavy metals As, Cd, Sb, Se, Zn, Cu, Ba, Mn, and Cr was 10, 3, 20, 10, 500, 50, 700, 100, and 50 µg/L, respectively. The maximum value of Cd, Sb, and Se was above the permissible limits for drinking water purposes.

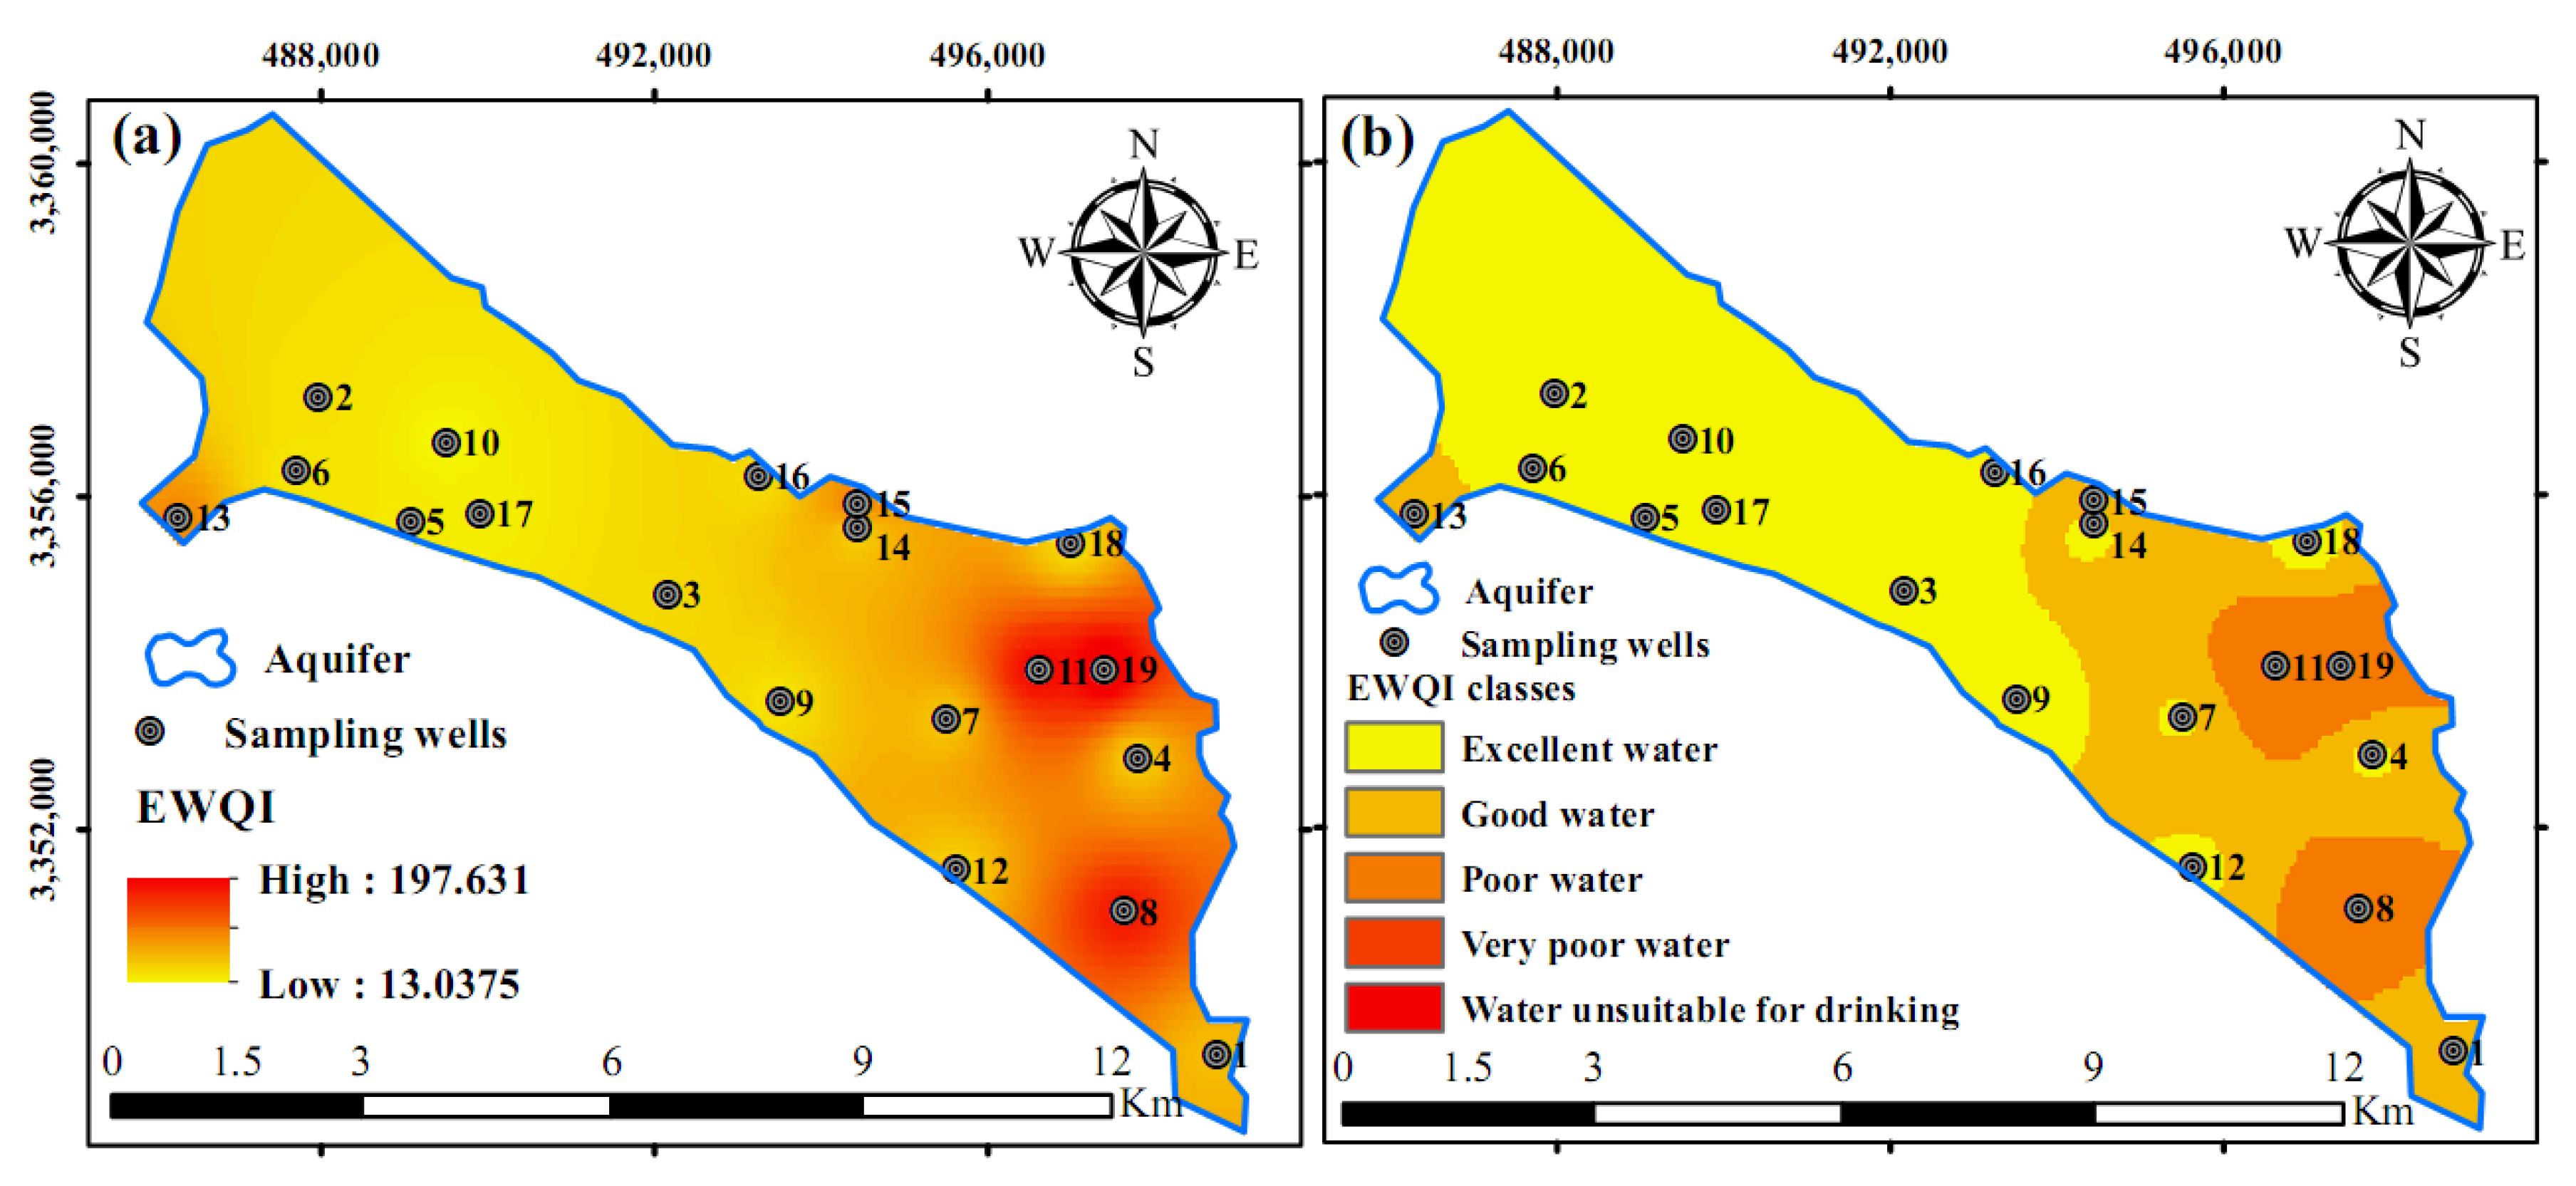
3.2. Suitability of Groundwater for Drinking Use

Entropy Weighted Water Quality Index (EWQI)

To assess the groundwater quality, some researchers have used the EWQI [54,55,56]. The EWQI is an innovative tool that tests multivariable water quality data against specified water quality standards determined by the user [56]. Entropy weight improves WQI since it does not rely on subjective judgement in assigning weights. The entropy weights of hydro-chemical parameters show that the concentrations of Cd play the leading role in affecting the groundwater quality based on WQI index in the study area. EWQI range and type of water are presented in Table 4 and Figure 2. In total, 24 water quality variables were used for the EWQI. The calculated EWQI range was between 13 and 198. Among these, Table 4 illustrates that most of the samples were classified as excellent water (68%). Three wells were classified in the category good water for drinking purposes. However, as shown in Table 4 and Figure 2, the WQI for wells 8, 11, and 19 is classified as poor water. This figure represents the eastern part of the study area (Figure 2), whereas the value of chemical parameters such as Mg2+, Ca2+, HCO3, Cl, SO42−, NO3, F, BOD, and COD, which were greater than the permissible limits for drinking purpose, belonged to the other samples. This indicates that heavy metals such as Cd, Sb, and Se play a major role in the groundwater quality assessment.

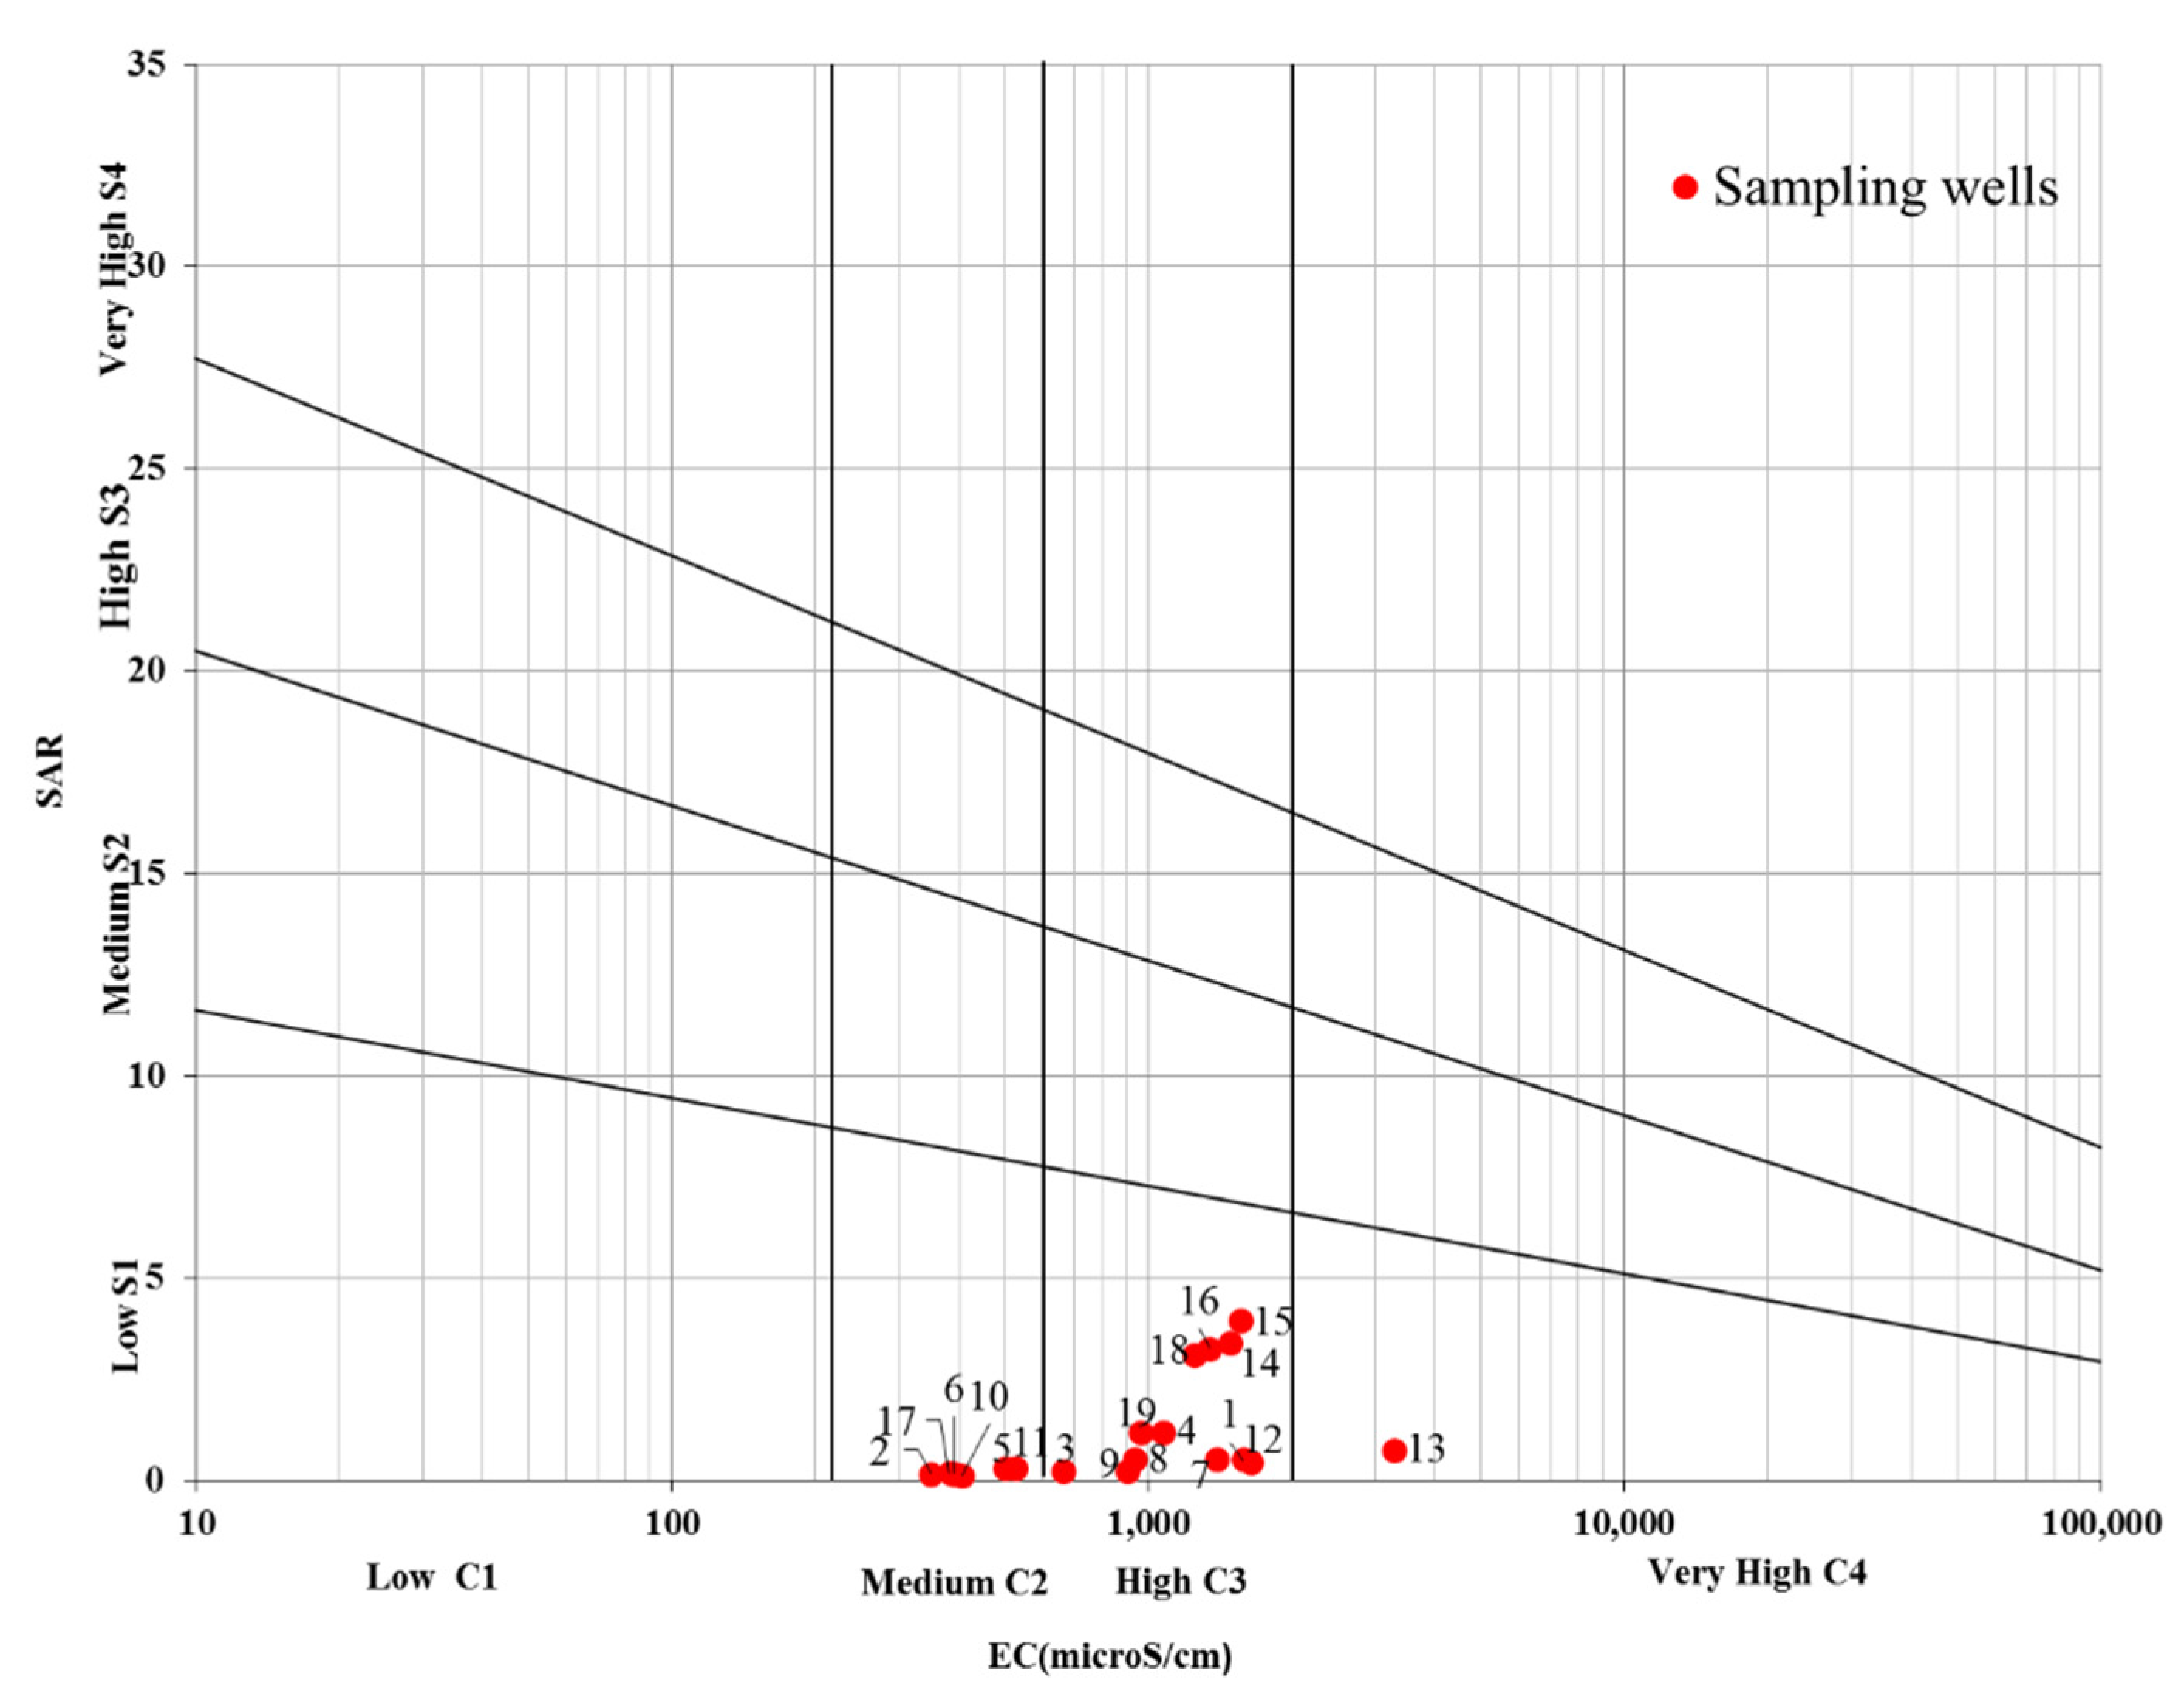
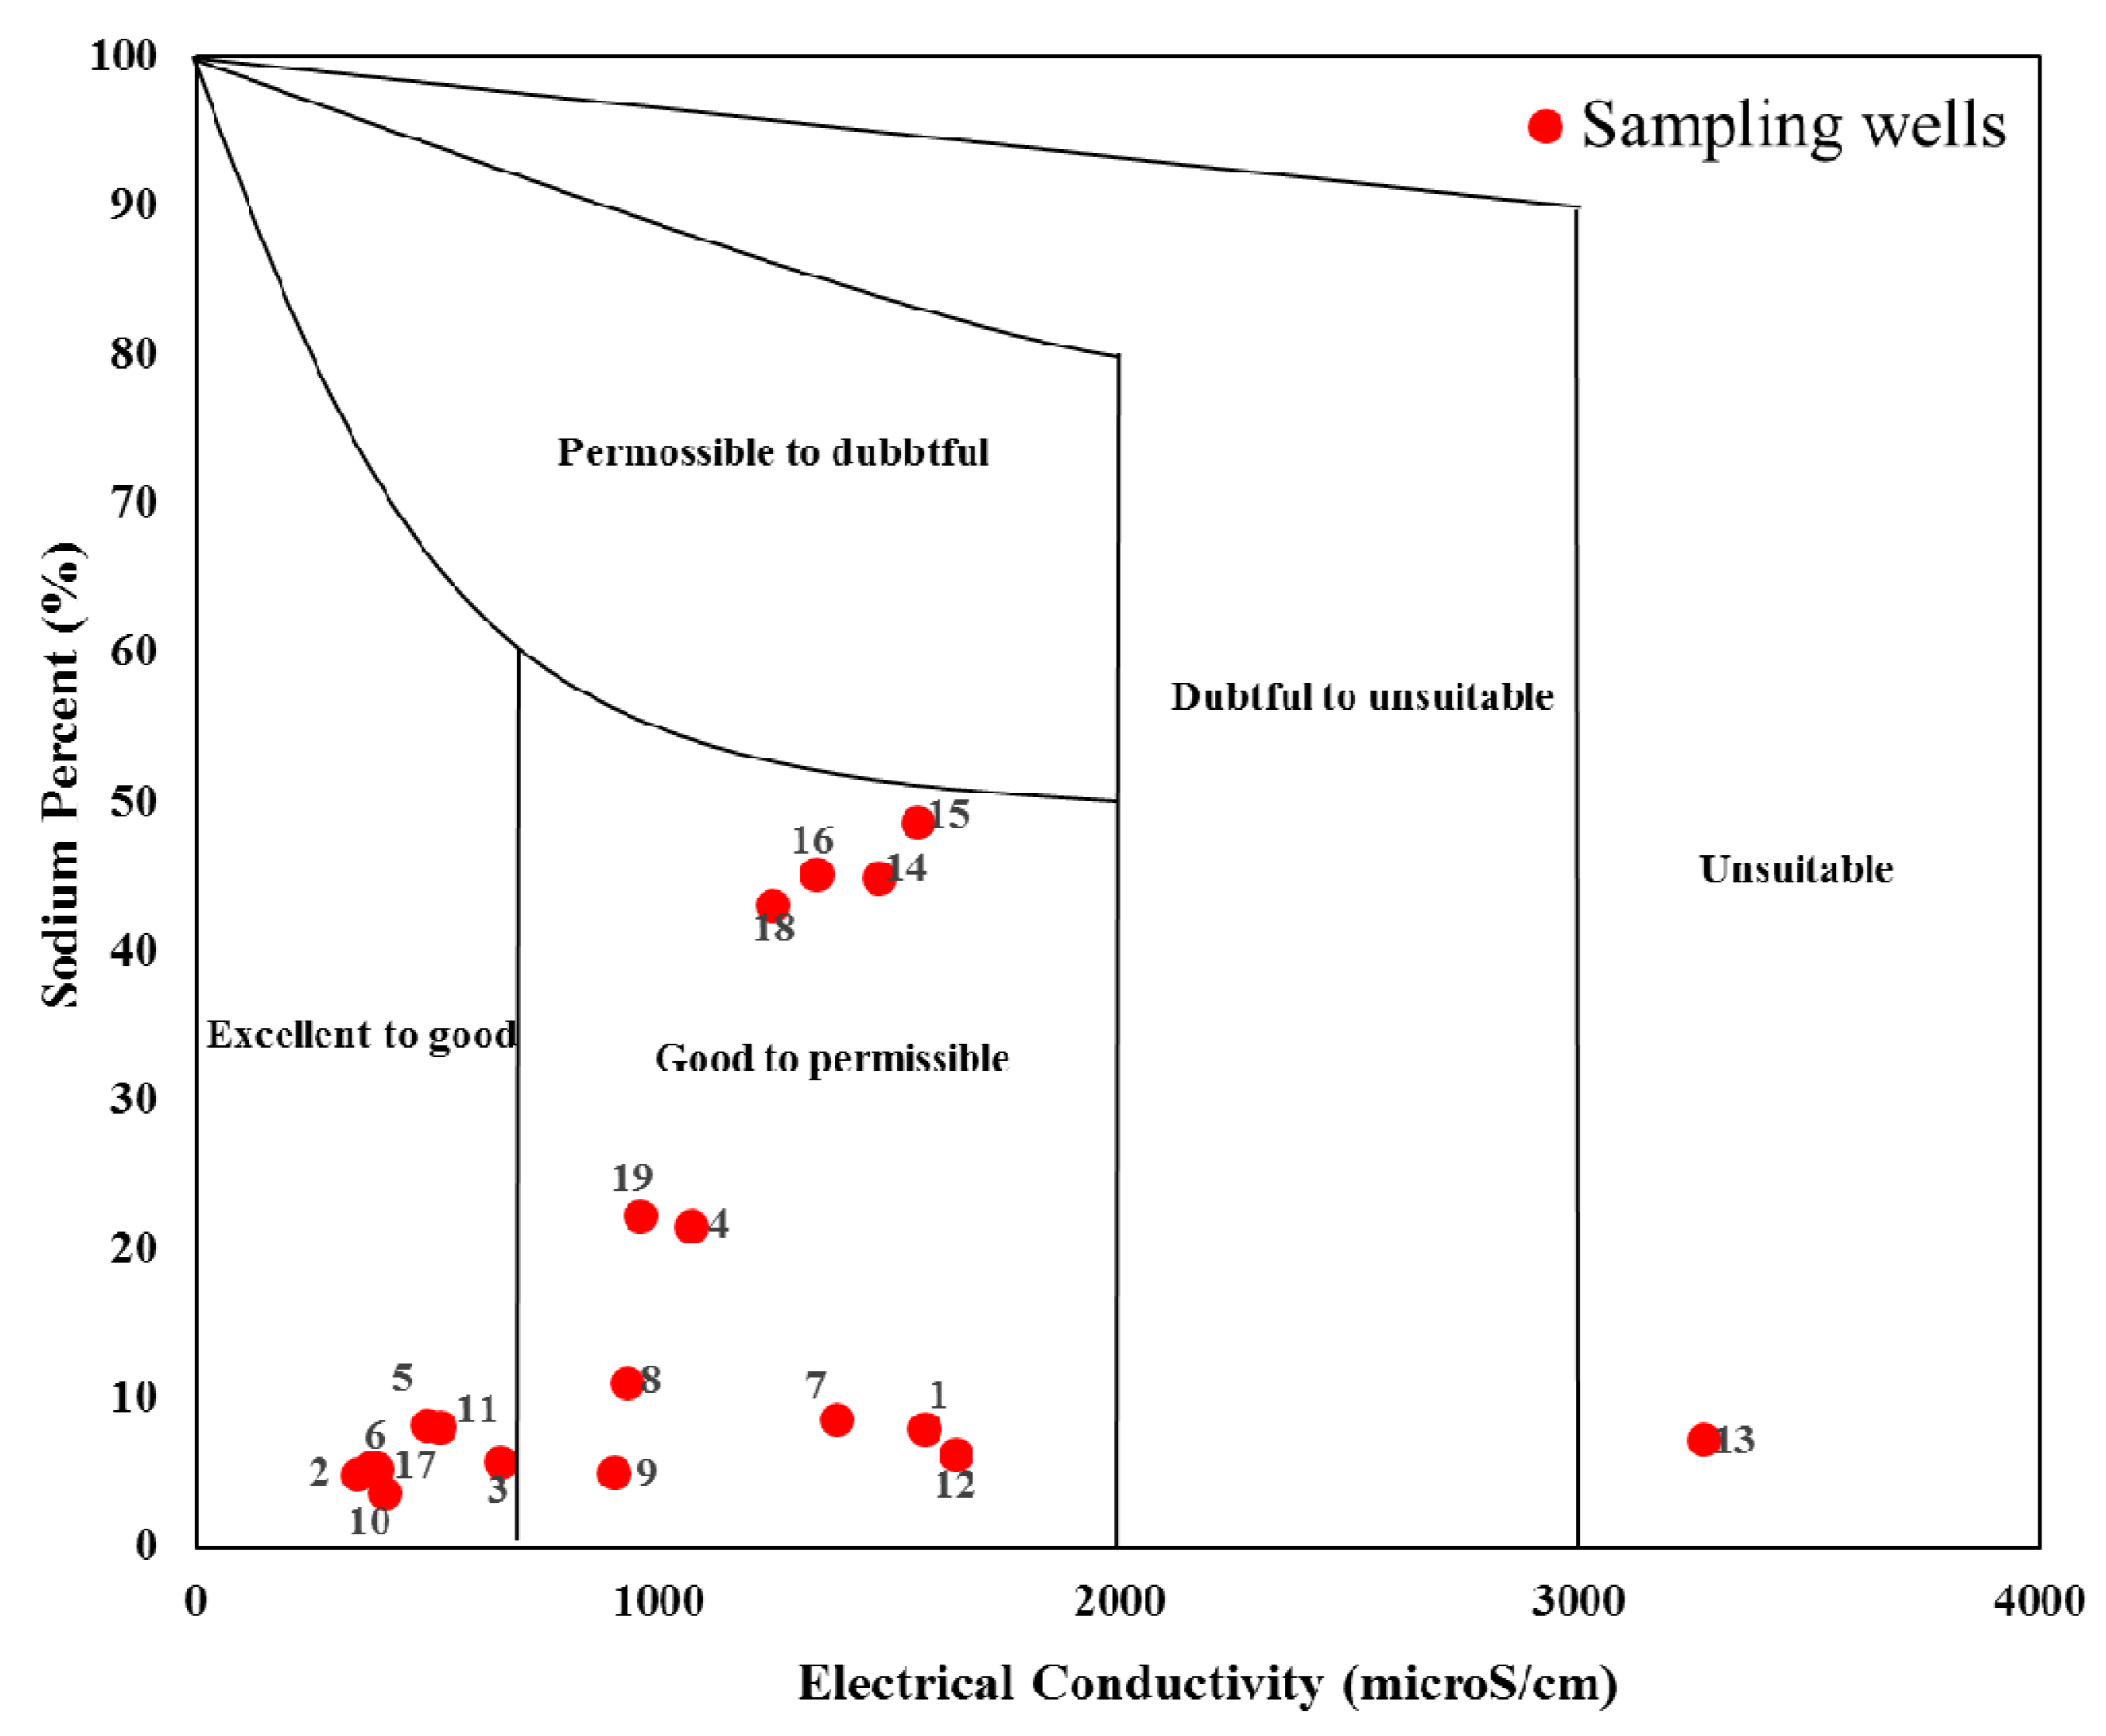
3.3. Suitability of Groundwater for Irrigation

3.3.1. The US Salinity Laboratory’s Diagram and Sodium Percentage (Na%)

The SAR is a characterization of sodium hazards; it is an important parameter for determining the suitability of groundwater for irrigation purposes [1,57]. The rating of groundwater samples in relation to salinity hazard and sodium hazard can be explained by plotting the chemical data in a U.S. Salinity Laboratory (USSL) diagram. The plot of conductivity versus SAR in the Wilcox log diagram shows that out of the 19 samples, five samples fall in the medium salinity and low alkalinity (C2S1) category, which are suitable for irrigation purposes (Figure 3). Thirteen samples belong to the high salinity and low alkalinity (C3S1) category, which moderately fit irrigation purposes. This indicates that when using the water, attention should be paid on having proper drainage system and selecting proper crops that can tolerate salt, otherwise crops and soil may be damaged (Figure 3). Only one sample is categorized as very high salinity and low alkalinity (C4S1). Hence, this water is not suitable for irrigation.
The sodium percentage is an indicator to demonstrate the sodium hazard for irrigation purposes. Irrigation with a high Na content may deteriorate the soil structure and reduce its aeration and permeability, causing adverse impacts on crop growth. As shown in Figure 4, most of the groundwater samples fall in the excellent to good category, while well 13 (similar to the USSL), belongs to the unsuitable category for irrigation purposes.

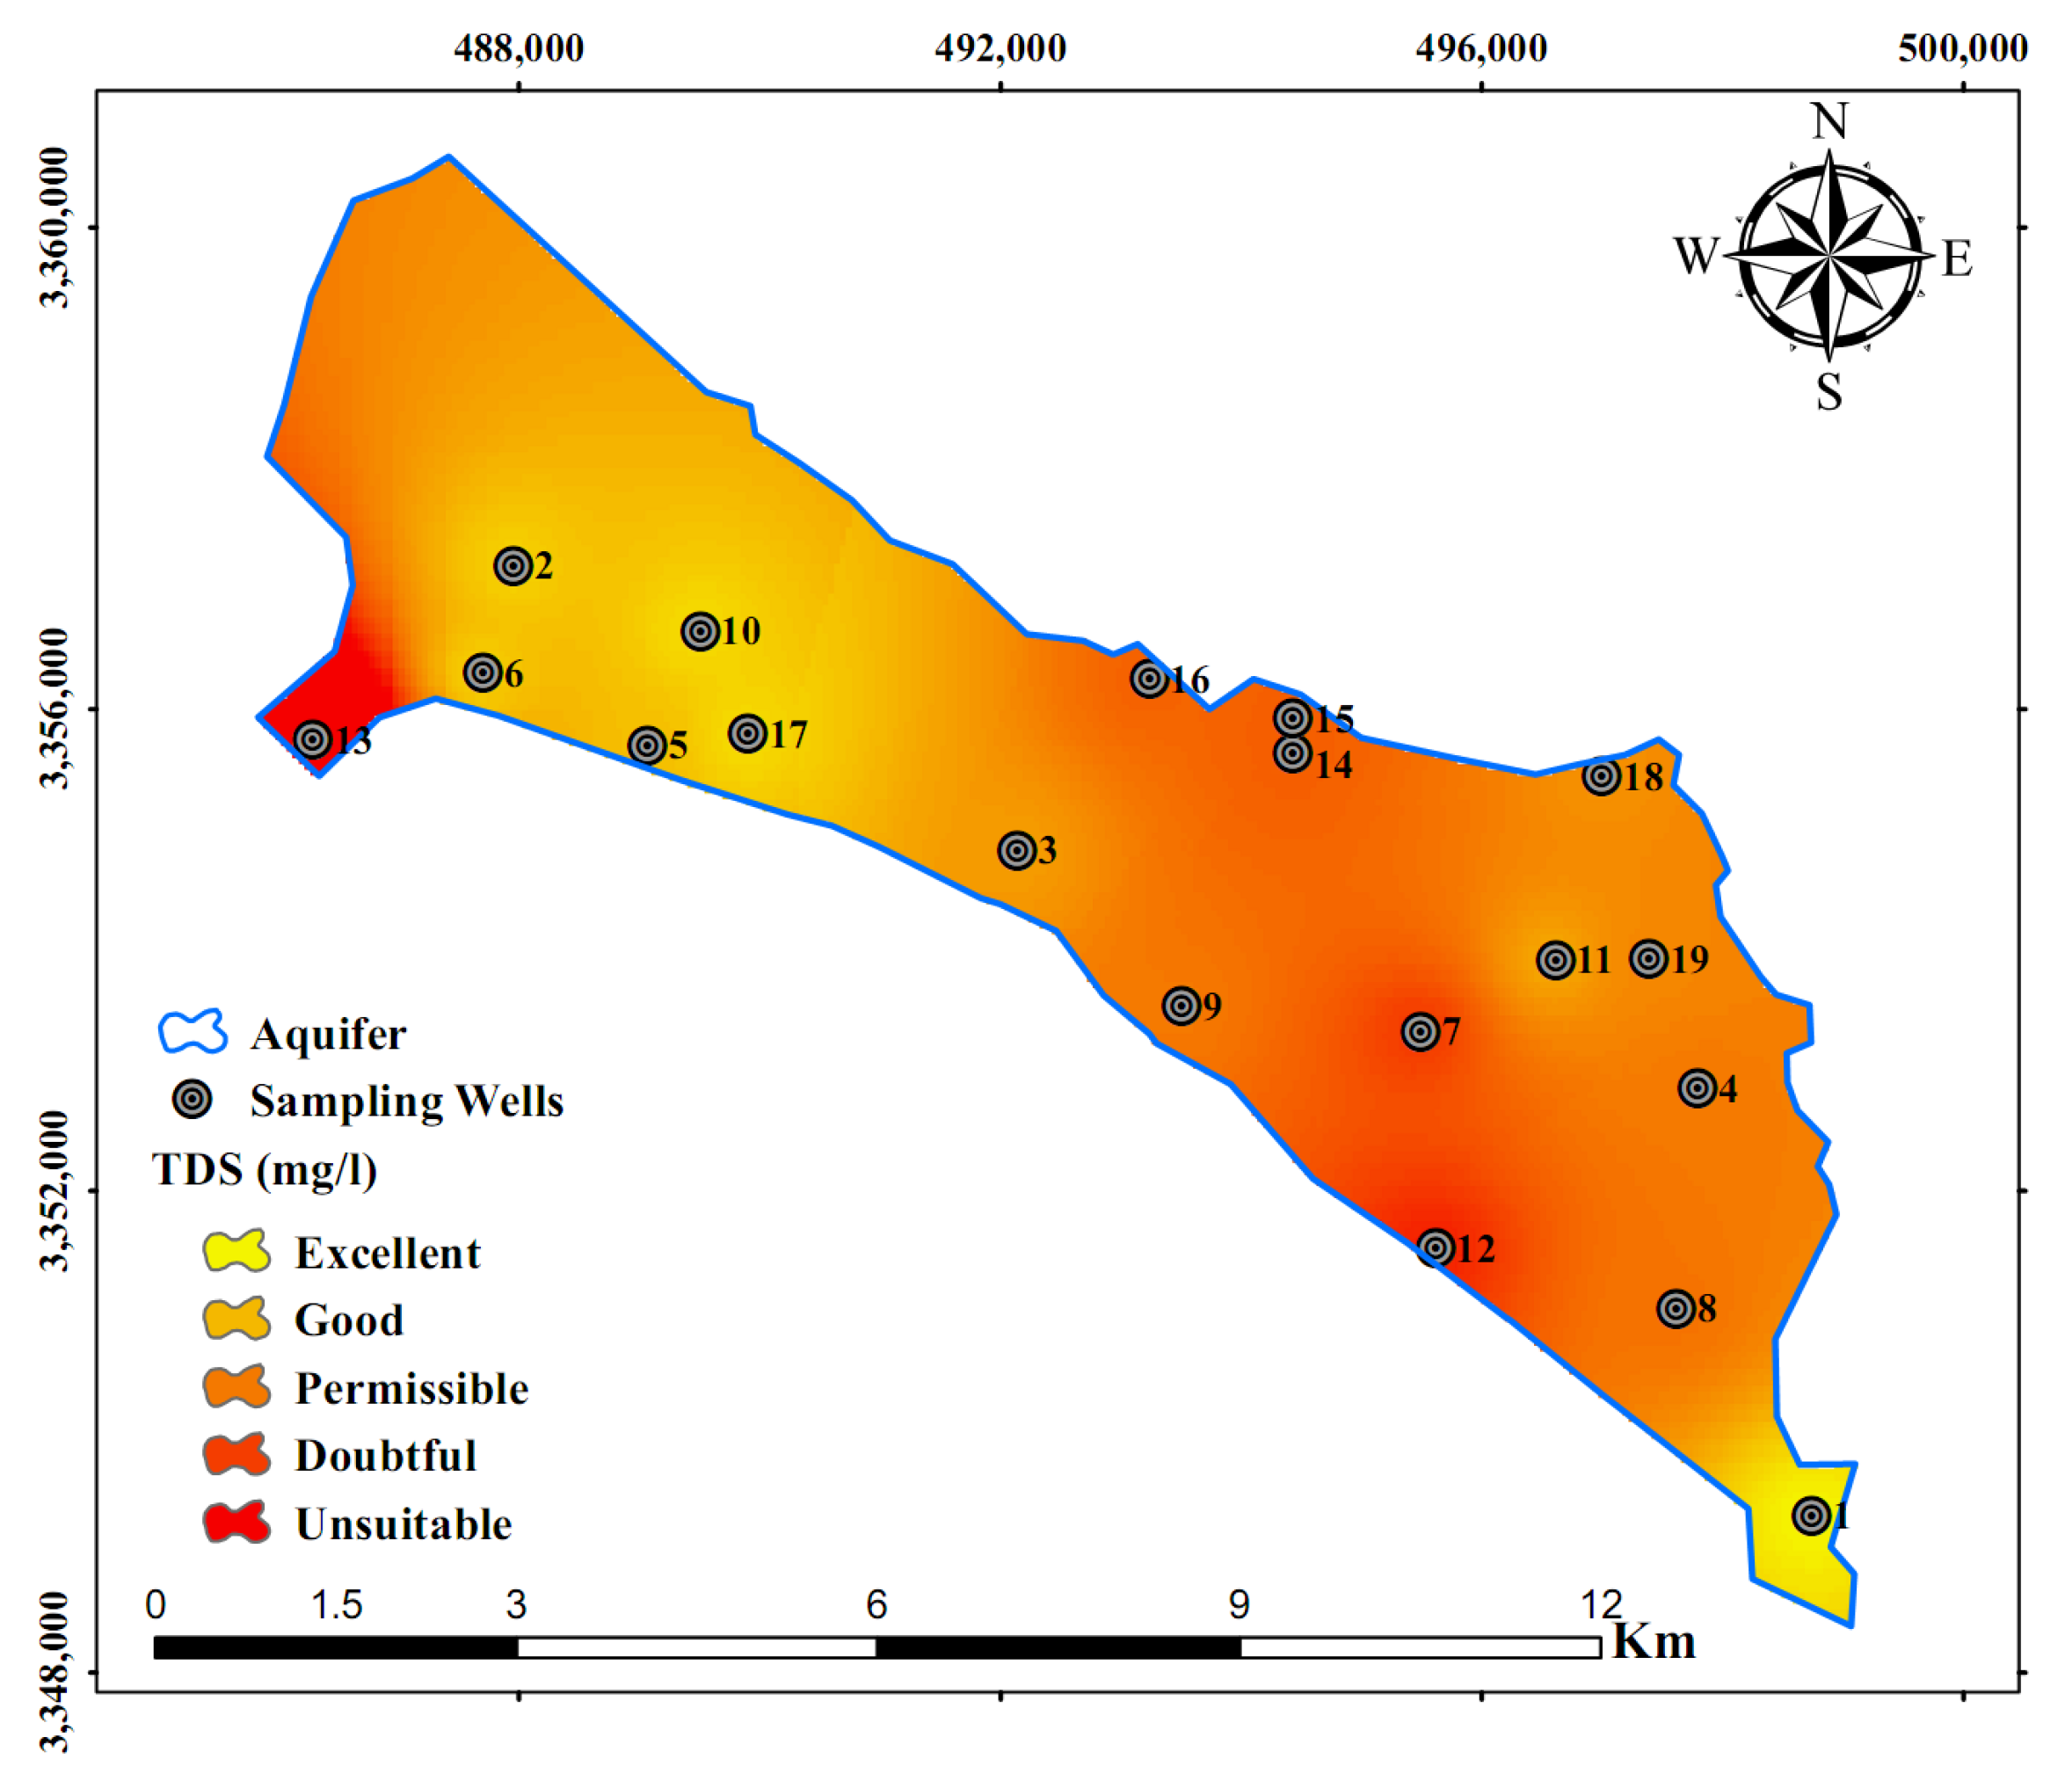
3.3.2. Total Dissolved Solids (TDS)

A salinity problem exists if salt accumulates in the crop root zone to a concentration that causes a loss in yield. In irrigated areas, these salts often originate from a saline soil, high water table, or from salts in the applied water [58]. Yield reductions occur when salt accumulates in the root zone to such an extent that the crop is no longer able to extract sufficient water from the salty soil solution, resulting in a water stress for a significant period. If water uptake is reduced, the plant slows its rate of growth [59].
Groundwater in the study area shows a variation of TDS from 165 to 3440 mg/L. The spatial classification of TDS based on irrigation purposes is shown in Figure 5. Wells 12 and 13 are classified as unsuitable and questionable for irrigation, respectively. Wells 1, 2, 5, 6, 10, and 17 are classified as good to excellent. Other wells are classified as permissible for irrigation.

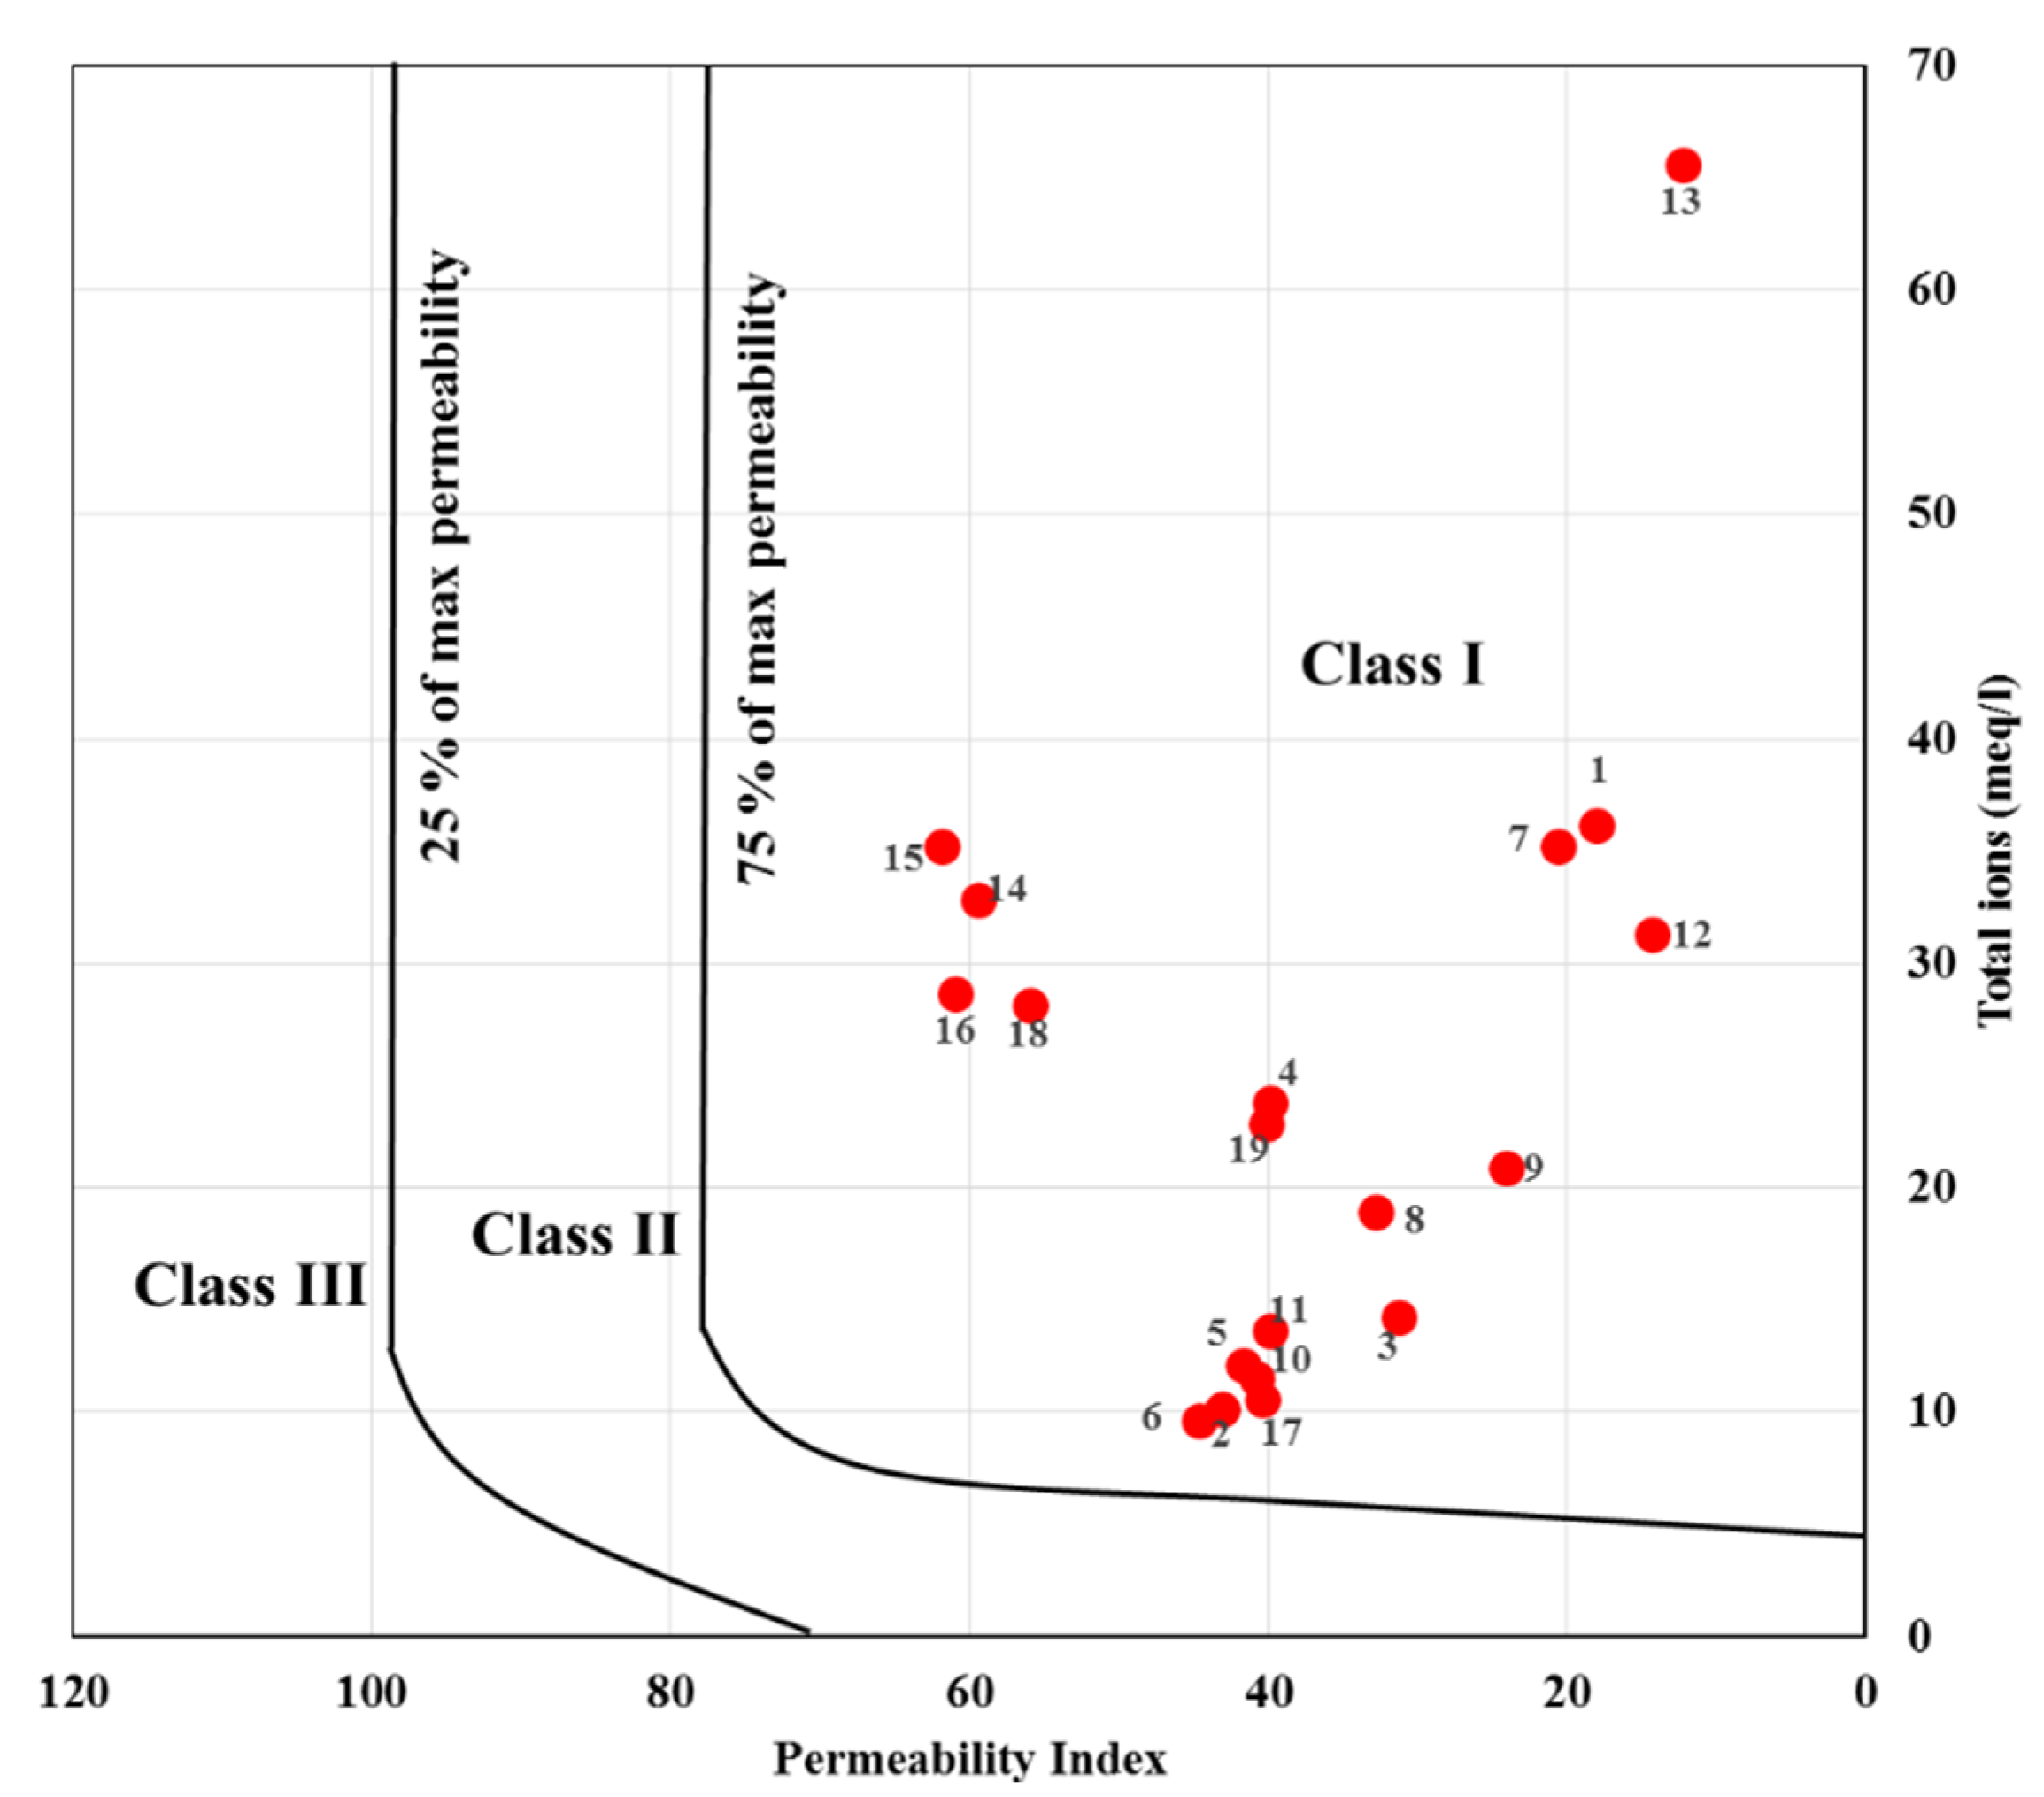
3.3.3. Permeability Index (PI)

Permeability index (PI) is an important parameter for groundwater use in agriculture. Sodium, bicarbonate, calcium, and magnesium concentrations in the soil may influence soil permeability [15]. In the study, the suitability of groundwater for irrigation based on PI was determined. This criterion categorizes the water into three classes. Based on the classification, water with PI > 75% (Class I) is good, 25–75% (Class II) is suitable, and PI < 25% (Class III) is unsuitable for irrigation [15]. As can be seen in Figure 6, all samples fall in Class I. This indicates that all wells are suitable for irrigation based on PI in the study area.

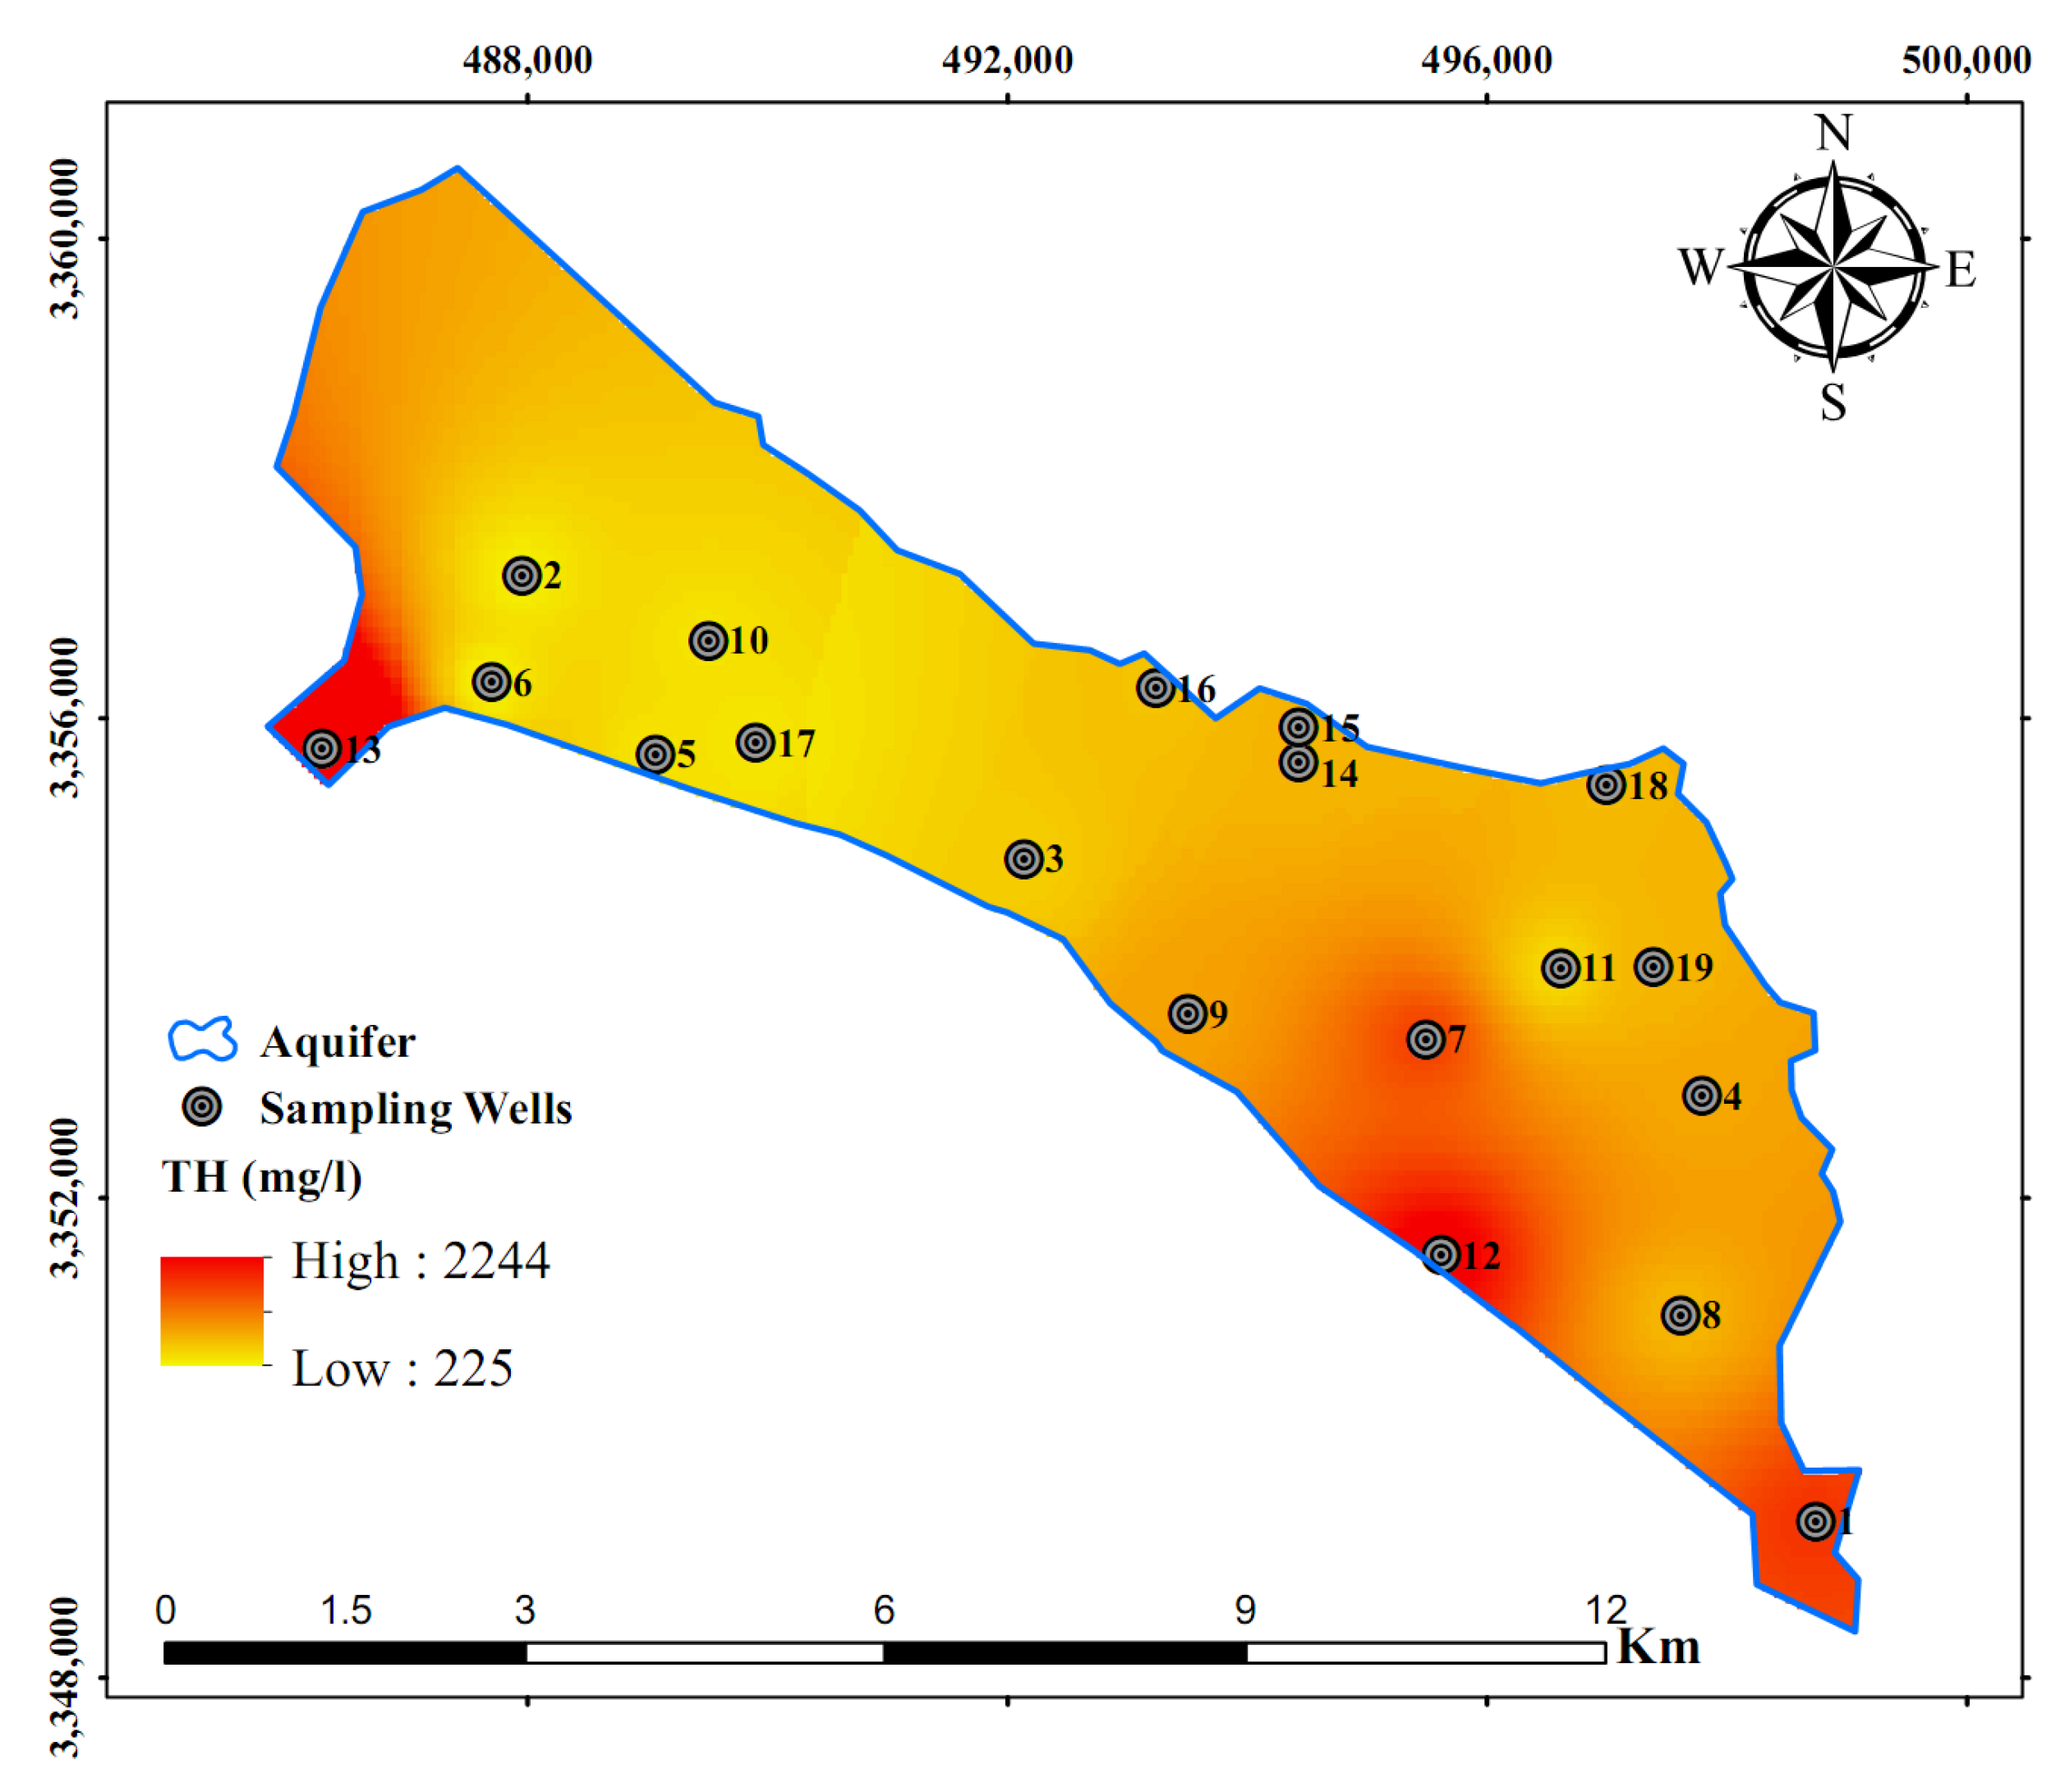
3.3.4. Total Hardness (TH)

Total hardness (TH) is caused primarily by the presence of cations such as calcium and magnesium and anions such as carbonate and bicarbonate [60]. The maximum permissible limit of TH for drinking purposes is 500 mg/L and the most desirable limit is 100 mg/L as per the WHO standard (2011). However, for irrigation purposes, up to 1000 mg/L of hardness is accepted [61].
Total hardness is commonly classified in terms of degree of hardness as (1) soft: 0–75 mg/L; (2) moderate: 75–150 mg/L; (3) hard: 150–300 mg/L; and very hard >300 mg/L. In the groundwater samples, TH varied from 225 to 2245 mg/L with an average of 551 mg/L. Figure 7 shows the spatial distribution of total hardness in the studied aquifer. As seen from the figure, TH in well 12 and 13 is classified as unacceptable for irrigation. In addition, the TH in wells 1 and 7 is more than 500 mg/L. A high level of TH in water can cause cardiovascular diseases, stunted growth, reproductive failure, and many more diseases due to the prevalence of magnesium and calcium in water [62].

3.3.5. Magnesium Ratio (MR)

Magnesium ratio is important for assessing suitability of water for irrigation. Magnesium damages soil structure when water contains a lot of sodium and high salinity [63]. If magnesium ratio exceeds 50, the water is considered to be harmful to crops and hence it is unsuitable for irrigation [64]. The residual Mg/Ca ratio [65] and the method established by Szabolcs and Darab (1964) [66] can be used to estimate the magnesium ratio (MR) for irrigation. According to this indicator, water with an MR greater than 50% is not suitable for irrigation [67]. The MR values obtained in this study ranged from 18 to 47%. This indicates that all wells are suitable for irrigation.

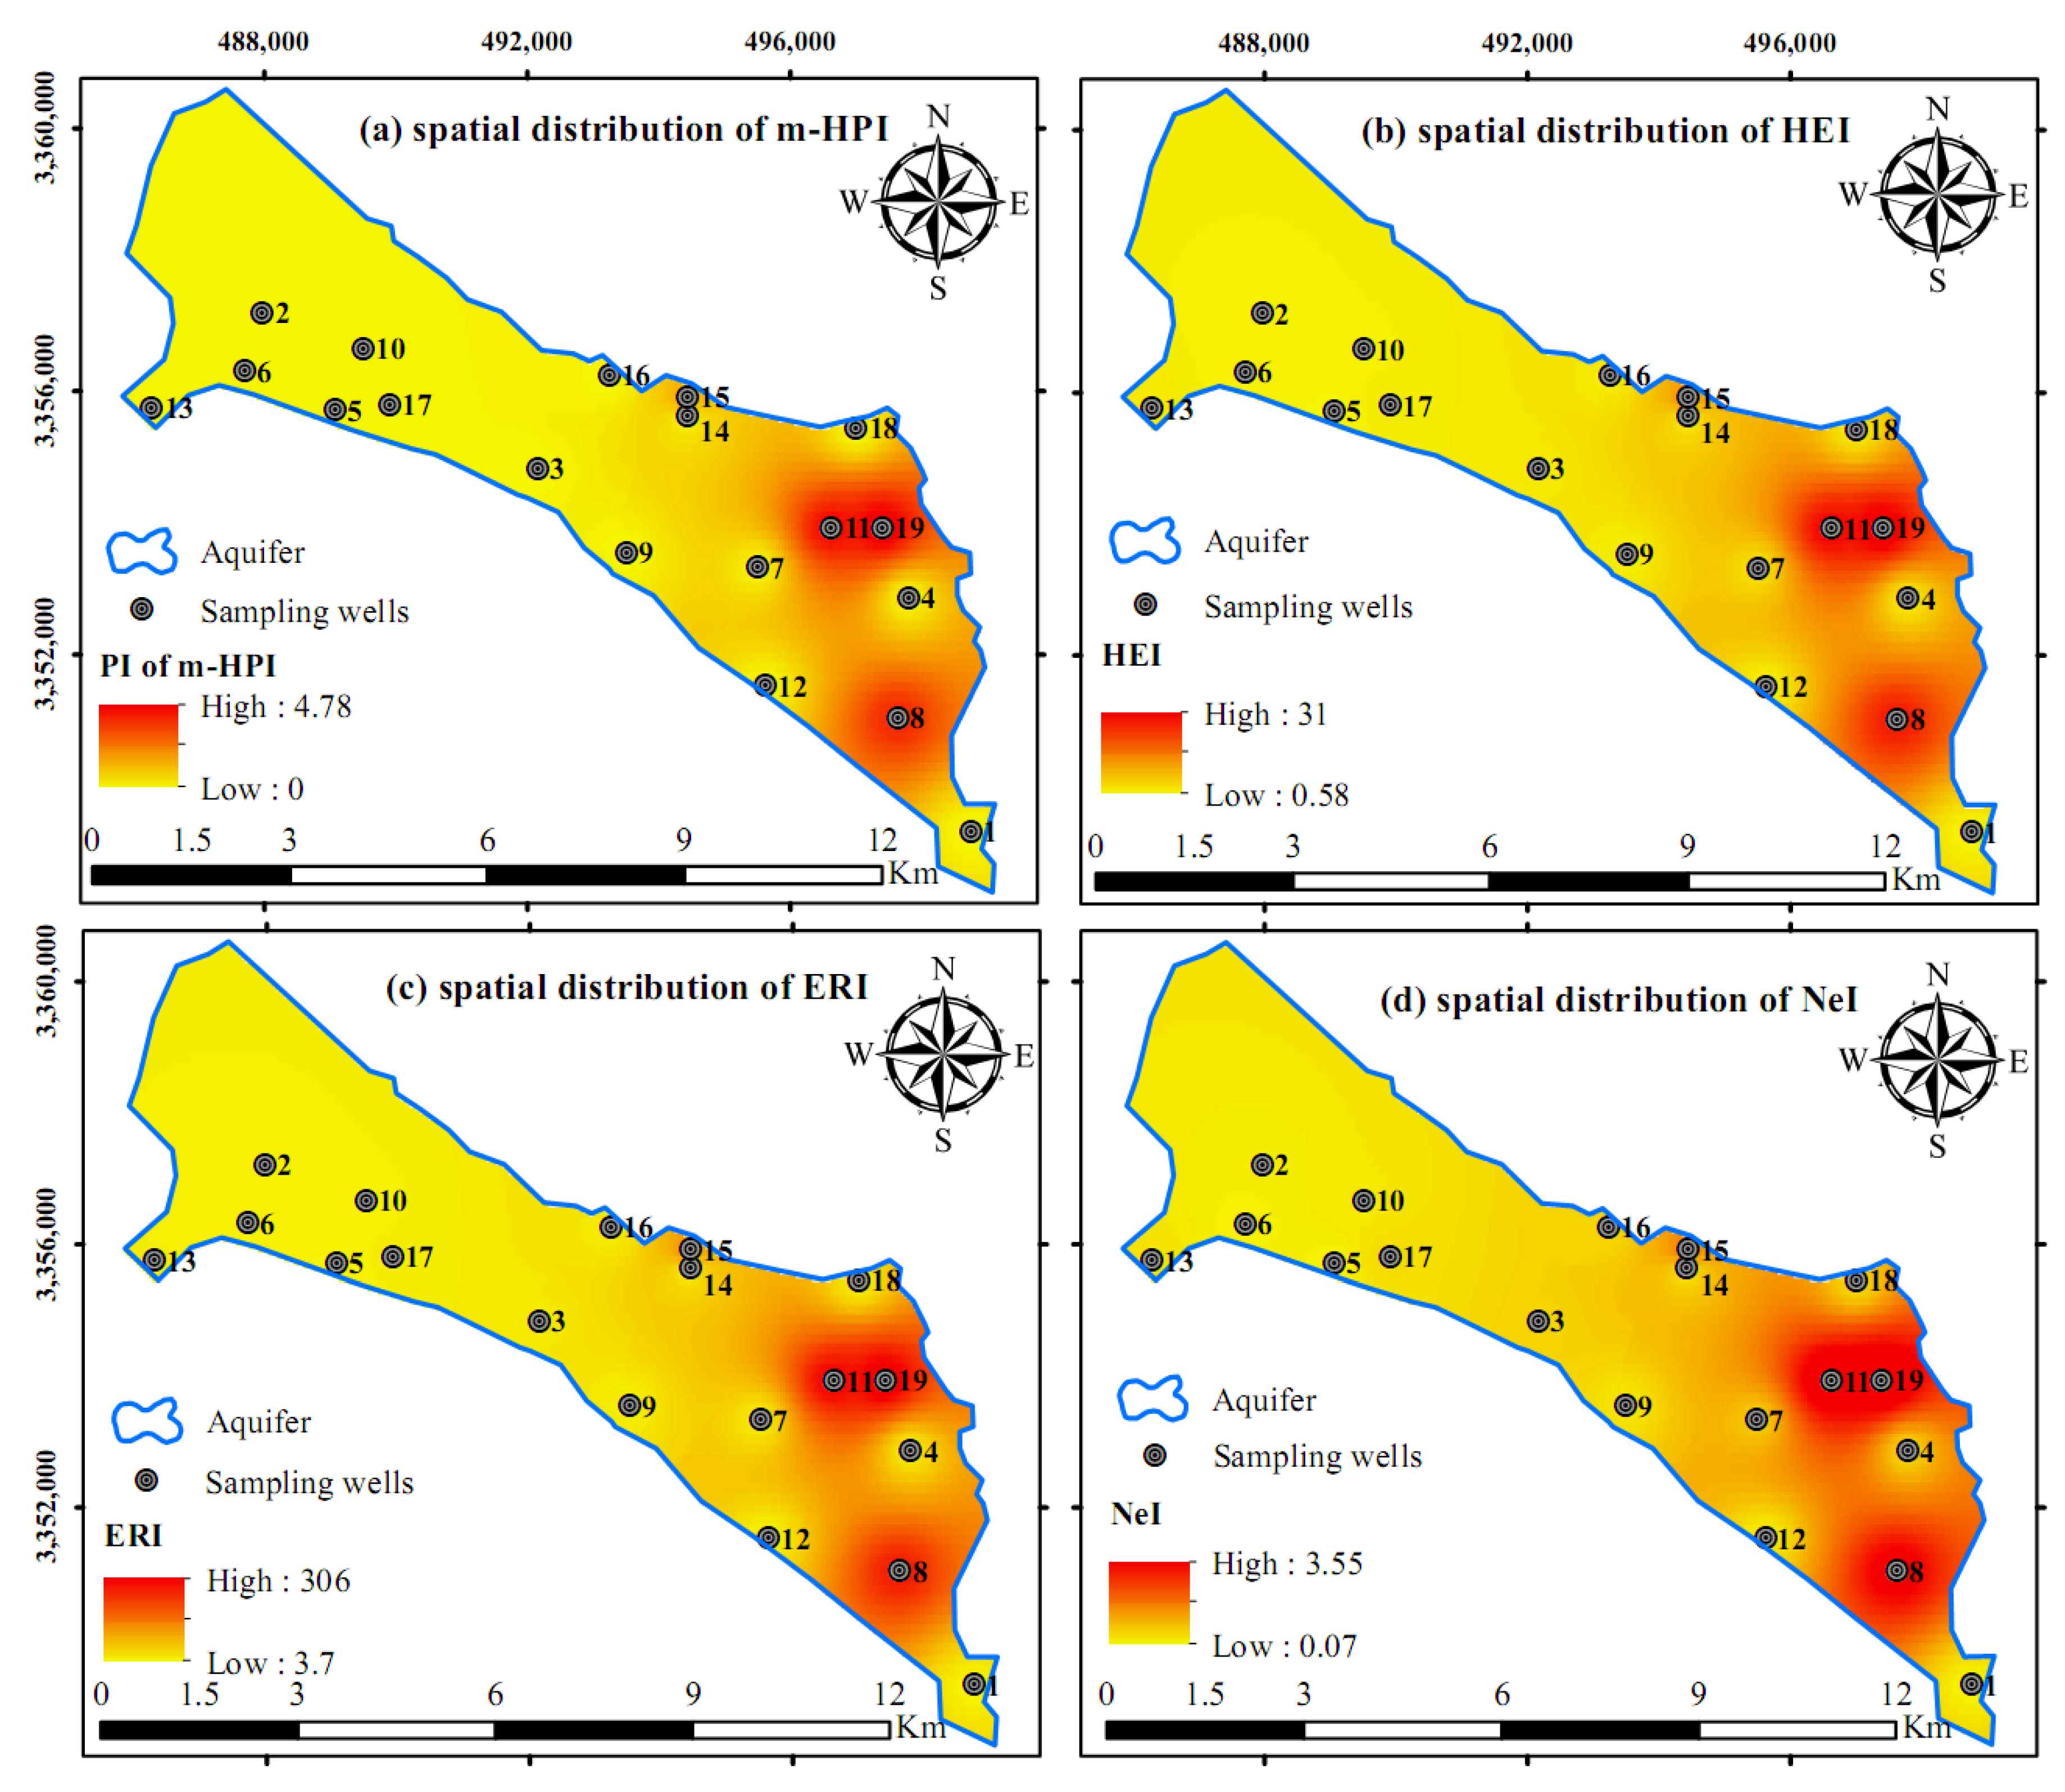
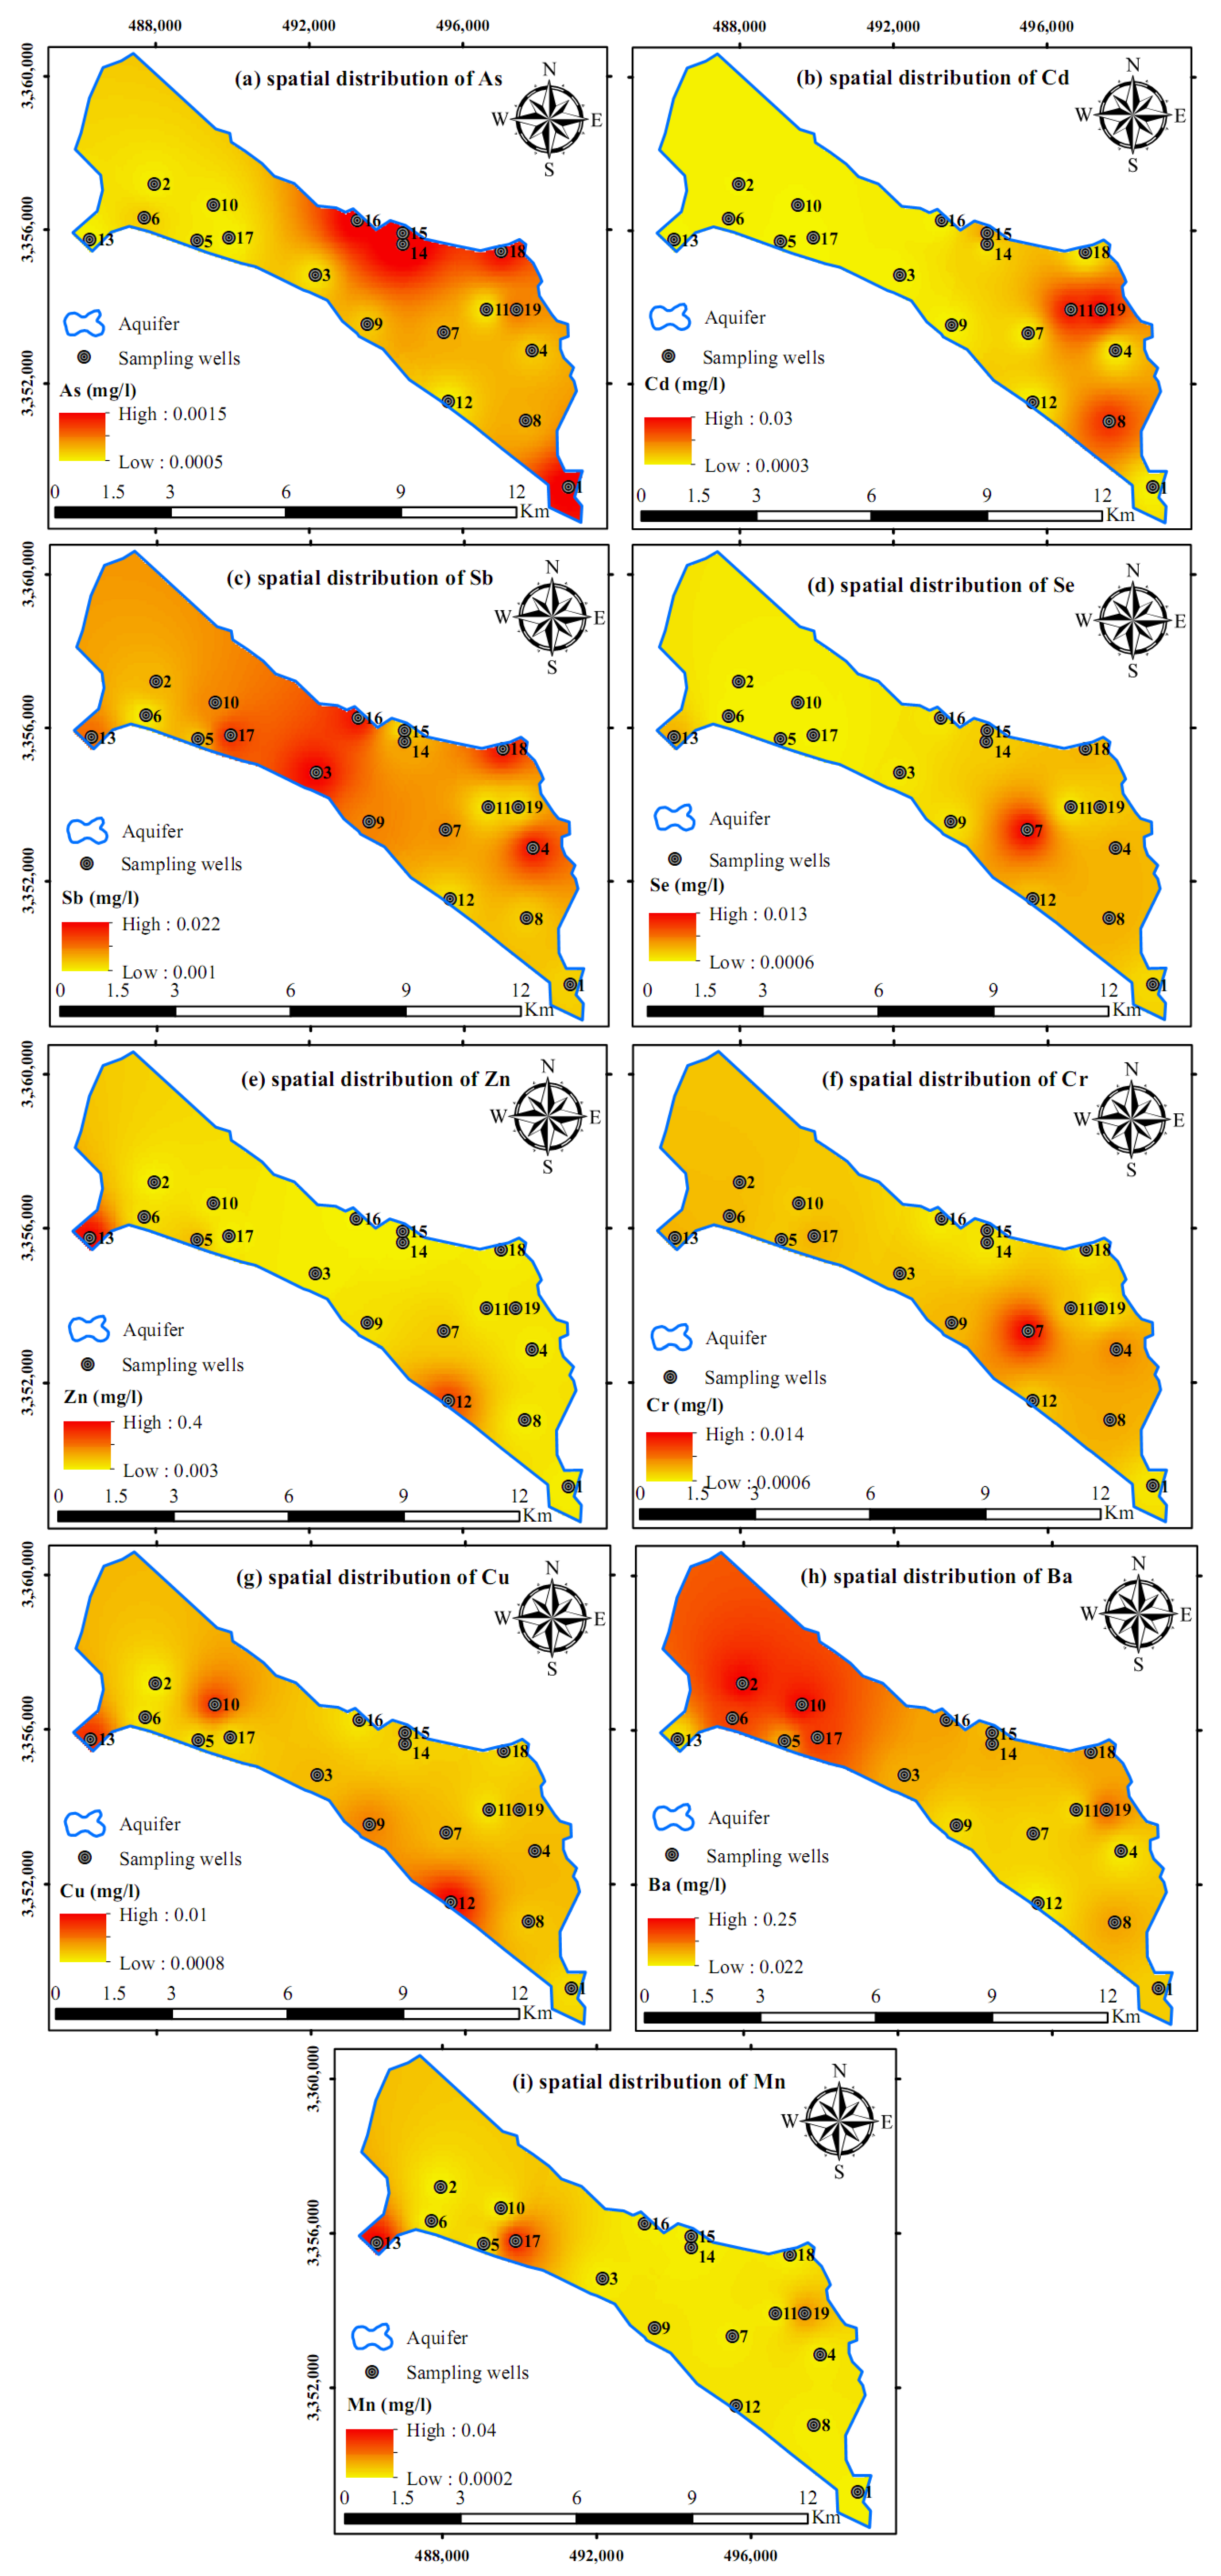
3.4. Heavy Metal Pollution Assessment

All m-HPI, HEI, NeI, and ERI indices were used to evaluate heavy metal pollution in groundwater samples for the study area. The values and spatial distribution of indices are presented in Table 5 and Figure 8, respectively. Heavy metal pollution evaluated by m-HPI method indicated more serious contamination than that of EWQI method. The values of m-HPI based on PI were in the range of 0–4.78 in the study area (Figure 8a). Based on the m-HPI water quality scale, nearly 16% of the samples were unacceptable for drinking whereas approximately 5–52% of samples were ranked as excellent to very good in the study area. The worst pollution status was recorded for wells 8, 11, and 19, which are in the eastern part of the area. The high m-HPI may be due to wastewater from industrial activities and domestic sewage. The m-HPI values of the samples in the western part of the study area were found below the critical pollution index (excellent to very good).
Additionally, the HEI, NeI, and ERI indices were used for a better understanding of the pollution status. The HEI, and NeI values ranged from 0.58 to 31 and 0.07 to 3.55 with mean of 6.11 and 0.76, respectively (Figure 8b,d). Based on water quality classification of HEI, approximately 79%, 16%, and 5% of sampling wells were classified as low, medium, and high heavy metal pollution, respectively. Based on the NeI index, one, three, and fifteen wells were categorized as slight, moderate, and insignificant heavy metal pollution, respectively.
The potential ecological risk of groundwater in the study area in terms of ecosystem services was assessed using the ERI method. The ERI values of the study area varied from 4 to 308 with a mean of 59 (Figure 8c). Like the HEI index, about 79% of sampling wells from the area were found to expose low ecological risk to the groundwater system. However, the other samples were classified in the category of moderate to considerable ecological risks. Due to higher occurrence and biological toxicity, Cd and Sb were the dominant contributors to the risk with an average contribution of nearly 91% and 6%, respectively.
The spatial distribution of each heavy metal is depicted in Figure 9. It shows that higher concentration of Cd occurred in wells 8, 11, and 19, with 0.024, 0.027, and 0.030 mg/L, respectively, which are used as agricultural, industrial, and drinking purposes, respectively (Figure 9b). The permissible limit of Cd for drinking purposes is 0.003 mg/L based on WHO standards (2011). These areas are contaminated with sewage water as well as industrial effluents. Exposure to high concentration of Cd may cause liver and kidney damage as well as producing acute health effects [68,69].
Furthermore, high concentration of Sb is exhibited in wells 3 and 4 with agricultural use and in wells 16 and 18 with drinking water use that is much higher than 0.02 mg/L, which is the permissible limit of Sb for drinking purposes as recommended by WHO (2011). However, the highest Se concentration was found in well 7 with 0.013 mg/L, which is used for agricultural purposes, while the permissible limit for drinking purposes is 0.01 mg/L. Although all wells 3, 4, 7, 16, and 18 based on WQI, m-HPI, HEI, NeI, and ERI indices are classified as excellent, very good, low, insignificant, and low, respectively, the concentration of Sb and Se was above the permissible limits for drinking purposes. Antimony is a dangerous substance with chronic toxicity and potential carcinogenicity [70]. Sb poisoning can cause liver cirrhosis, muscle necrosis, nephritis, and pancreatitis. According to this fact, monitoring the concentration of these heavy metals is an essential measure to protect residents who use these sources of groundwater.

4. Conclusions

In this study, an innovative method involving entropy weighted groundwater quality index for both physicochemical and heavy metal content was used for a semiarid region. Using this index, the suitability of the groundwater for drinking and irrigation purposes was assessed for the Imam Zadeh Jafar Aquifer in southwestern Iran. We used the entropy method for assigning weights to water quality parameters in the WQI calculation to prevent subjectivity. This provides more reliability for the final output from the WQI. The entropy weights showed that concentration of Cd plays a substantial role in affecting the groundwater quality. Based on the EWQI, well 8, 11, and 19 were classified as poor water, while other wells were classified as excellent for drinking purposes.
Regarding water quality for irrigation, EC and SAR results reveal that all samples except for well 13 fall in C3S1 followed by C2S1 category. This denotes that the water is well suited for irrigation. However, MR and PI outcomes indicate that all samples are suitable for irrigation purposes. The results of TDS and TH show that well 12 and 13 are unsuitable for irrigation.
Heavy metal pollution indices, m-HPI, HEI, NeI, and ERI, showed that a majority of investigated wells have medium level of pollution in the study area. However, the values of these four indices in most parts of the area were below the critical levels. Wells 8, 11, and 19, are classified as unsuitable for drinking purposes due to an excessive amount of Cd. Additionally, well 7 was polluted by Se, while concentration of Sb in wells 3, 4, 16, and 18 showed higher than the permissible limits. According to the results, the regional groundwater system is most likely impacted by anthropologic and industrial activities in the area. Heavy metal pollution indices showed reliability in characterizing the groundwater pollution with respect to heavy metals. Entropy weights helped with avoiding personal judgement in calculating the weights in all stages that could lead to more transparency and reliability of the results. However, continuous monitoring of groundwater quality with respect to heavy metals is needed. Monitoring is especially important here due to a sharp increase in population.
The current study shed light on a potentially vital problem. Groundwater is under pressure in many parts of the world, especially in arid and semiarid regions. It is important to develop methods that reduce the complexity of data to clearly understandable numbers that managers and decision makers can readily use. Evaluating performance of remediation technologies is beyond the scope of this paper. However, this study can help with further planning of potential future remediation measures. Besides remediation measures, regulative processes are important to develop, especially in the developing world. However, this study may be used as a basis for further managerial actions in the field.

Author Contributions

Conceptualization and methodology by E.K.M.; formal analysis by E.K.M. and M.N.-R.; writing—original draft preparation, E.K.M., M.N.-R., K.N., and R.B.; resources by M.N.-R.; supervision by R.B.; writing—review and editing by E.K.M., M.N.-R., K.N. and R.B. All authors have read and agreed to the published version of the manuscript.

Funding

This research was funded by the Ministry of Science, Research and Technology of the Islamic Republic of Iran, which provided scholarships to the main authors; and partly funded by Center for Middle Eastern Studies (CMES) at Lund University. And The APC was funded by Lund University.

Acknowledgments

Authors would like to express their gratitude to Marzieh Lori-Goini for introducing the site and Hossein Hashemi at CMES for his support during the study. The authors also thank two anonymous reviewers and the journal editor for constructive comments on the manuscript.

Conflicts of Interest

The authors declare no conflict of interest.

References

  1. Rao, K.N.; Latha, P.S. Groundwater quality assessment using water quality index with a special focus on vulnerable tribal region of Eastern Ghats hard rock terrain, Southern India. Arab. J. Geosci. 2019, 12, 1–16. [Google Scholar] [CrossRef]
  2. Maharjan, A.K.; Kamei, T.; Amatya, I.M.; Mori, K.; Kazama, F.; Toyama, T. Ammonium-Nitrogen (NH4+-N) Removal from Groundwater by a Dropping Nitrification Reactor: Characterization of NH4+-N Transformation and Bacterial Community in the Reactor. Water 2020, 12, 599. [Google Scholar] [CrossRef] [Green Version]
  3. Nurtazin, S.; Pueppke, S.; Ospan, T.; Mukhitdinov, A.; Elebessov, T. Quality of Drinking Water in the Balkhash District of Kazakhstan’s Almaty Region. Water 2020, 12, 392. [Google Scholar] [CrossRef] [Green Version]
  4. Sahoo, M.M.; Swain, J.B. Modified heavy metal Pollution index (m-HPI) for surface water Quality in river basins, India. Environ. Sci. Pollut. Res. 2020. [Google Scholar] [CrossRef]
  5. Kim, S.; Eom, S.; Kim, H.-J.; Lee, J.J.; Choi, G.; Choi, S.; Kim, S.; Kim, S.Y.; Cho, G.; Kim, Y.D.; et al. Association between maternal exposure to major phthalates, heavy metals, and persistent organic pollutants, and the neurodevelopmental performances of their children at 1 to 2 years of age- CHECK cohort study. Sci. Total Environ. 2018, 624, 377–384. [Google Scholar] [CrossRef]
  6. Fetter, C.W.; Boving, T.; Kreamer, D. Contaminant Hydrogeology, 3rd ed.; Waveland Press, Inc.: Long Grove, IL, USA, 2018; ISBN 9781478632795. [Google Scholar]
  7. Wołowiec, M.; Komorowska-kaufman, M.; Pruss, A.; Rzepa, G.; Bajda, T. Removal of heavy metals and metalloids from water using drinking water treatment residuals as adsorbents: A review. Minerals 2019, 9, 487. [Google Scholar] [CrossRef] [Green Version]
  8. Joseph, L.; Jun, B.-M.; Flora, J.R.V.; Park, C.M.; Yoon, Y. Removal of heavy metals from water sources in the developing world using low-cost materials: A review. Chemosphere 2019, 229, 142–159. [Google Scholar] [CrossRef]
  9. Liosis, C.; Karvelas, E.G.; Karakasidis, T.; Sarris, I.E. Numerical study of magnetic particles mixing in wastewater under an external magnetic field. Water Supply Res. Technol. 2020. [Google Scholar] [CrossRef]
  10. Karvelas, E.; Liosis, C.; Benos, L.; Karakasidis, T.; Sarris, I. Micromixing efficiency of particles in heavy metal removal processes under various inlet conditions. Water 2019, 11, 1135. [Google Scholar] [CrossRef] [Green Version]
  11. Karvelas, E.G.; Lampropoulos, N.K.; Karakasidis, T.E.; Sarris, I.E. A computational tool for the estimation of the optimum gradient magnetic field for the magnetic driving of the spherical particles in the process of cleaning water. Desalin. Water Treat. 2017, 99, 27–33. [Google Scholar] [CrossRef]
  12. Ranieri, E.; Gorgoglione, A.; Montanaro, C.; Iacovelli, A.; Gikas, P. Removal capacity of BTEX and metals of constructed wetlands under the influence of hydraulic conductivity. Desalin. Water Treat. 2015, 56, 1256–1263. [Google Scholar] [CrossRef]
  13. Bodrud-Doza, M.; Islam, A.R.M.T.; Ahmed, F.; Das, S.; Saha, N.; Rahman, M.S. Characterization of groundwater quality using water evaluation indices, multivariate statistics and geostatistics in central Bangladesh. Water Sci. 2016, 30, 19–40. [Google Scholar] [CrossRef] [Green Version]
  14. Gulgundi, M.S.; Shetty, A. Groundwater quality assessment of urban Bengaluru using multivariate statistical techniques. Appl. Water Sci. 2018, 8, 43. [Google Scholar] [CrossRef] [Green Version]
  15. Chen, J.; Huang, Q.; Lin, Y.; Fang, Y.; Qian, H.; Liu, R.; Ma, H. Hydrogeochemical characteristics and quality assessment of groundwater in an irrigated region, Northwest China. Water 2019, 11, 96. [Google Scholar] [CrossRef] [Green Version]
  16. Ndoye, S.; Fontaine, C.; Gaye, C.B.; Razack, M. Groundwater quality and suitability for different uses in the Saloum area of Senegal. Water 2018, 10, 1837. [Google Scholar] [CrossRef] [Green Version]
  17. Zhang, X.; Hu, B.; Wang, P.; Chen, J.; Yang, L.; Xiao, K.; Zhang, X. Hydrogeochemical evolution and heavy metal contamination in groundwater of a reclaimed land on Zhoushan Island. Water 2018, 10, 316. [Google Scholar] [CrossRef] [Green Version]
  18. Wang, H.; Nie, L.; Xu, Y.; Du, C.; Zhang, T.; Wang, Y. Effects of highway-related pollutant on the qroundwater quality of turfy swamps in the Changbai Mountain Area. Int. J. Environ. Res. Public Health 2018, 15, 1652. [Google Scholar] [CrossRef] [PubMed] [Green Version]
  19. Withanachchi, S.; Ghambashidze, G.; Kunchulia, I.; Urushadze, T.; Ploeger, A. Water quality in surface water: A preliminary assessment of heavy metal contamination of the Mashavera River, Georgia. Int. J. Environ. Res. Public Health 2018, 15, 621. [Google Scholar] [CrossRef] [Green Version]
  20. Reyes-Toscano, C.A.; Alfaro-Cuevas-Villanueva, R.; Cortés-Martínez, R.; Morton-Bermea, O.; Hernández-Álvarez, E.; Buenrostro-Delgado, O.; Ávila-Olivera, J.A. Hydrogeochemical characteristics and assessment of drinking water quality in the urban area of Zamora, Mexico. Water 2020, 12, 556. [Google Scholar] [CrossRef] [Green Version]
  21. Liang, B.; Han, G.; Liu, M.; Yang, K.; Li, X.; Liu, J. Distribution, sources, and water quality assessment of dissolved heavy metals in the Jiulongjiang river water, Southeast China. Int. J. Environ. Res. Public Health 2018, 15, 2752. [Google Scholar] [CrossRef] [Green Version]
  22. Amiri, V.; Rezaei, M.; Sohrabi, N. Groundwater quality assessment using entropy weighted water quality index (EWQI) in Lenjanat, Iran. Environ. Earth Sci. 2014, 72, 3479–3490. [Google Scholar] [CrossRef]
  23. Chaturvedi, A.; Bhattacharjee, S.; Mondal, G.C.; Kumar, V.; Singh, P.K.; Singh, A.K. Exploring new correlation between hazard index and heavy metal pollution index in groundwater. Ecol. Indic. 2019, 97, 239–246. [Google Scholar] [CrossRef]
  24. Rezaei, A.; Hassani, H.; Hassani, S.; Jabbari, N.; Fard Mousavi, S.B.; Rezaei, S. Evaluation of groundwater quality and heavy metal pollution indices in Bazman basin, southeastern Iran. Groundw. Sustain. Dev. 2019, 9, 100245. [Google Scholar] [CrossRef]
  25. Mukherjee, I.; Singh, U.K.; Singh, R.P.; Kumari, D.; Jha, P.K.; Mehta, P. Characterization of heavy metal pollution in an anthropogenically and geologically influenced semi-arid region of east India and assessment of ecological and human health risks. Sci. Total Environ. 2020, 705, 135801. [Google Scholar] [CrossRef]
  26. Chaturvedi, A.; Bhattacharjee, S.; Singh, A.K.; Kumar, V. A new approach for indexing groundwater heavy metal pollution. Ecol. Indic. 2018, 87, 323–331. [Google Scholar] [CrossRef]
  27. Sawut, R.; Kasim, N.; Maihemuti, B.; Hu, L.; Abliz, A.; Abdujappar, A.; Kurban, M. Pollution characteristics and health risk assessment of heavy metals in the vegetable bases of northwest China. Sci. Total Environ. 2018, 642, 864–878. [Google Scholar] [CrossRef] [PubMed]
  28. Boateng, T.K.; Opoku, F.; Acquaah, S.O.; Akoto, O. Groundwater quality assessment using statistical approach and water quality index in Ejisu-Juaben Municipality, Ghana. Environ. Earth Sci. 2016, 75, 1–14. [Google Scholar] [CrossRef]
  29. Manikandan, S.; Chidambaram, S.; Prasanna, M.V.; Ganayat, R.R. Assessment of Heavy Metals Pollution and Stable Isotopic Signatures in Hard Rock Aquifers of Krishnagiri District, South India. Geosciences 2019, 9, 200. [Google Scholar] [CrossRef] [Green Version]
  30. Belkhiri, L.; Tiri, A.; Mouni, L. Assessment of Heavy Metals Contamination in Groundwater: A Case Study of the South of Setif Area, East Algeria. In Achievements and Challenges of Integrated River Basin Management; InTech: London, UK, 2018. [Google Scholar]
  31. Belkhiri, L.; Mouni, L.; Sheikhy Narany, T.; Tiri, A. Evaluation of potential health risk of heavy metals in groundwater using the integration of indicator kriging and multivariate statistical methods. Groundw. Sustain. Dev. 2017, 4, 12–22. [Google Scholar] [CrossRef]
  32. Rezaei, H.; Jafari, A.; Kamarehie, B.; Fakhri, Y.; Ghaderpoury, A.; Karami, M.A.; Ghaderpoori, M.; Shams, M.; Bidarpoor, F.; Salimi, M. Health-risk assessment related to the fluoride, nitrate, and nitrite in the drinking water in the Sanandaj, Kurdistan County, Iran. Hum. Ecol. Risk Assess. Int. J. 2019, 25, 1242–1250. [Google Scholar] [CrossRef]
  33. Azizi, F.; Mohammadzadeh, H. Aquifer vulnerability and evaluation of groundwater quality spatial variations in GhachsaranEmamzadehJaafar plain using DRASTIC model and GWQI index. Water Eng. 2012, 5, 1–14. [Google Scholar]
  34. Liu, F.; Zhao, Z.; Yang, L.; Ma, Y.; Li, B.; Gong, L.; Liu, H. Phreatic Water Quality Assessment and Associated Hydrogeochemical Processes in an Irrigated Region Along the Upper Yellow River, Northwestern China. Water 2020, 12, 463. [Google Scholar] [CrossRef] [Green Version]
  35. Akter, T.; Jhohura, F.T.; Akter, F.; Chowdhury, T.R.; Mistry, S.K.; Dey, D.; Barua, M.K.; Islam, M.A.; Rahman, M. Water Quality Index for measuring drinking water quality in rural Bangladesh: A cross-sectional study. J. Heal. Popul. Nutr. 2016, 35, 1–12. [Google Scholar] [CrossRef] [Green Version]
  36. WHO. Guidelines for Drinking-Water Quality, 4th ed. Available online: http://www.who.int/water_sanitation_health/publications/dwq_guidelines/en/# (accessed on 30 March 2016).
  37. Olasoji, S.; Oyewole, N.; Abiola, B.; Edokpayi, J. Water quality assessment of surface and groundwater sources Using a water quality index method: A case study of a Peri-Urban Town in Southwest, Nigeria. Environments 2019, 6, 23. [Google Scholar] [CrossRef] [Green Version]
  38. Peiyue, L.I.; Jianhua, W.U.; Hui, Q. Groundwater quality assessment based on entropy weighted osculating value method. Int. J. Environ. Sci. 2010, 1, 621–630. [Google Scholar]
  39. Shannon, C.E. A Mathematical Theory of Communication. Bell Syst. Tech. J. 1948, 27, 379–423. [Google Scholar] [CrossRef] [Green Version]
  40. Kawachi, T.; Maruyama, T.; Singh, V.P. Rainfall entropy for delineation of water resources zones in Japan. J. Hydrol. 2001, 246, 36–44. [Google Scholar] [CrossRef]
  41. Ozkul, S.; Harmancioglu, N.B.; Singh, V.P. Entropy-based assessment of water quality monitoring networks. J. Hydrol. Eng. 2000, 5, 90–100. [Google Scholar] [CrossRef] [Green Version]
  42. Li, H.; Wang, W.; Fan, L.; Li, Q.; Chen, X. A novel hybrid MCDM model for machine tool selection using fuzzy DEMATEL, entropy weighting and later defuzzification VIKOR. Appl. Soft Comput. 2020, 91, 1–14. [Google Scholar] [CrossRef]
  43. Vasanthavigar, M.; Srinivasamoorthy, K.; Vijayaragavan, K.; Rajiv Ganthi, R.; Chidambaram, S.; Anandhan, P.; Manivannan, R.; Vasudevan, S. Application of water quality index for groundwater quality assessment: Thirumanimuttar sub-basin, Tamilnadu, India. Environ. Monit. Assess 2010, 171, 595–609. [Google Scholar] [CrossRef]
  44. Richards, L.A. Diagnosis and Improvement of Saline and Alkali Soils; United States Department of Agriculture: Washington, DC, USA, 1954. [Google Scholar]
  45. Doneen, L. Notes on water quality in agriculture. In Water Science and Engineering Paper 4001; Department of Water Sciences and Engineering, University of California: Oakland, CA, USA, 1964. [Google Scholar]
  46. Raghunath, I.I.M. Groundwater, 2nd ed.; Wiley Eastern Ltd.: New Delhi, India, 1987. [Google Scholar]
  47. Sarath Prasanth, S.V.; Magesh, N.S.; Jitheshlal, K.V.; Chandrasekar, N.; Gangadhar, K. Evaluation of groundwater quality and its suitability for drinking and agricultural use in the coastal stretch of Alappuzha District, Kerala, India. Appl. Water Sci. 2012, 2, 165–175. [Google Scholar] [CrossRef] [Green Version]
  48. Liu, S.; Zhang, Y.; Bi, S.; Zhang, X.; Li, X.; Lin, M.; Hu, G. Heavy metals distribution and environmental quality assessment for sediments off the southern coast of the Shandong Peninsula, China. Mar. Pollut. Bull. 2015, 100, 483–488. [Google Scholar] [CrossRef] [PubMed]
  49. Vu, C.T.; Lin, C.; Shern, C.-C.; Yeh, G.; Le, V.G.; Tran, H.T. Contamination, ecological risk and source apportionment of heavy metals in sediments and water of a contaminated river in Taiwan. Ecol. Indic. 2017, 82, 32–42. [Google Scholar] [CrossRef]
  50. Sharifi, Z.; Hossaini, S.M.T.; Renella, G. Risk assessment for sediment and stream water polluted by heavy metals released by a municipal solid waste composting plant. J. Geochem. Explor. 2016, 169, 202–210. [Google Scholar] [CrossRef]
  51. Wen, X.; Lu, J.; Wu, J.; Lin, Y.; Luo, Y. Influence of coastal groundwater salinization on the distribution and risks of heavy metals. Sci. Total Environ. 2019, 652, 267–277. [Google Scholar] [CrossRef]
  52. Wang, N.; Wang, A.; Kong, L.; He, M. Calculation and application of Sb toxicity coefficient for potential ecological risk assessment. Sci. Total Environ. 2018, 610–611, 167–174. [Google Scholar] [CrossRef]
  53. Hakanson, L. An ecological risk index for aquatic pollution control.a sedimentological approach. Water Res. 1980, 14, 975–1001. [Google Scholar] [CrossRef]
  54. Bhardwaj, K.S.P.R. Water quality index and fractal dimension analysis of water parameters. J. Environ. Sci. Technol. 2013, 10, 151–164. [Google Scholar]
  55. Rabeiy, R.E. Assessment and modeling of groundwater quality using WQI and GIS in Upper Egypt area. Environ. Sci. Pollut. Res. 2018, 25, 30808–30817. [Google Scholar] [CrossRef]
  56. Gnanachandrasamy, G.; Dushiyanthan, C.; Jeyavel Rajakumar, T.; Zhou, Y. Assessment of hydrogeochemical characteristics of groundwater in the lower Vellar river basin: Using Geographical Information System (GIS) and Water Quality Index (WQI). Environ. Dev. Sustain. 2020, 22, 759–789. [Google Scholar] [CrossRef]
  57. Maskooni, E.K.; Kompanizare, M.; Afzali, S.F. Chemical assessment of dam water irrigation effects on groundwater qualities in Bigherd plain, Fars Province, Iran. Environ. Earth Sci. 2017, 76, 238. [Google Scholar] [CrossRef]
  58. Salifu, M.; Aidoo, F.; Hayford, M.S.; Adomako, D.; Asare, E. Evaluating the suitability of groundwater for irrigational purposes in some selected districts of the Upper West region of Ghana. Appl. Water Sci. 2015, 7, 653–662. [Google Scholar] [CrossRef]
  59. Ayers, R.; Westcott, D. Water Quality for Agriculture (No. 29); Food and Agriculture Organization of the United Nations: Rome, Italy, 1985. [Google Scholar]
  60. Schroeder, H.A. Relations between hardness of water and death rates from certain chronic and degenerative diseases in the United States. J. Chronic Dis. 1960, 12, 586–591. [Google Scholar] [CrossRef]
  61. Selvakumar, S.; Chandrasekar, N.; Kumar, G. Hydrogeochemical characteristics and groundwater contamination in the rapid urban development areas of Coimbatore, India. Water Resour. Ind. 2017, 17, 26–33. [Google Scholar] [CrossRef]
  62. Banerji, S.; Mitra, D. Geographical information system-based groundwater quality index assessment of northern part of Kolkata, India for drinking purpose. Geocarto Int. 2018, 6049, 1–16. [Google Scholar] [CrossRef]
  63. Chidambaram, S.; Bala Krishna Prasad, M.; Manivannan, R.; Karmegam, U.; Singaraja, C.; Anandhan, P.; Prasanna, M.V.; Manikandan, S. Environmental hydrogeochemistry and genesis of fluoride in groundwaters of Dindigul district, Tamilnadu (India). Environ. Earth Sci. 2013, 68, 333–342. [Google Scholar] [CrossRef]
  64. Lakshmanan, E.; Kannan, R. Major Ion Chemistry And Identification Of Hydrogeochemical Processes Of Ground Water In A Part Of Kancheepuram District; Tamil Nadu, India. Environ. Geosci. 2003, 10, 157–166. [Google Scholar] [CrossRef]
  65. Nazzal, Y.; Ahmed, I.; Al-Arifi, N.S.N.; Ghrefat, H.; Zaidi, F.K.; El-Waheidi, M.M.; Batayneh, A.; Zumlot, T. A pragmatic approach to study the groundwater quality suitability for domestic and agricultural usage, Saq aquifer, northwest of Saudi Arabia. Environ. Monit. Assess. 2014, 186, 4655–4667. [Google Scholar] [CrossRef]
  66. Szabolcs, I.; Darab, C. The influence of irrigation water of high sodium carbonate content of soils. In Proceedings of the 8th International Congress of ISSS, Trans, II, Bucharest, Romania, 31 August 1964. [Google Scholar]
  67. Raihan, F.; Alam, J.B. Assessment of groundwater quality in sunamganj of bangladesh. Iran. J. Environ. Heal. Sci. Eng. 2008, 5, 155–166. [Google Scholar]
  68. Boateng, T.K.; Opoku, F.; Acquaah, S.O.; Akoto, O. Pollution evaluation, sources and risk assessment of heavy metals in hand-dug wells from Ejisu-Juaben Municipality, Ghana. Environ. Syst. Res. 2015, 4, 1–12. [Google Scholar] [CrossRef] [Green Version]
  69. Vetrimurugan, E.; Brindha, K.; Elango, L.; Ndwandwe, O.M. Human exposure risk to heavy metals through groundwater used for drinking in an intensively irrigated river delta. Appl. Water Sci. 2017, 7, 3267–3280. [Google Scholar] [CrossRef] [Green Version]
  70. Li, J.; Zheng, B.; He, Y.; Zhou, Y.; Chen, X.; Ruan, S.; Yang, Y.; Dai, C.; Tang, L. Antimony contamination, consequences and removal techniques: A review. Ecotoxicol. Environ. Saf. 2018, 156, 125–134. [Google Scholar] [CrossRef] [PubMed]
Figure 1. The Imam Zadeh Jafar Aquifer located in Gachsaran City, southwest Iran.
Water 12 01115 g001
Figure 2. (a) Spatial distribution of EWQI score and (b) Classification of EWQI in the study area.
Water 12 01115 g002
Figure 3. Wilcox log diagram of groundwater for the Imam Zadeh Jafar Aquifer.
Water 12 01115 g003
Figure 4. Rating of groundwater samples based on electrical conductivity (EC) and Na content.
Water 12 01115 g004
Figure 5. Spatial distribution of total dissolved solids (TDS) in the study area.
Water 12 01115 g005
Figure 6. USSL Classification of irrigation water in study area, based on permeability index.
Water 12 01115 g006
Figure 7. Total hardness (TH) in groundwater samples in study area.
Water 12 01115 g007
Figure 8. Spatial distribution of heavy metal indices: (a) modified heavy metal pollution index (m-HPI); (b) heavy metal evaluation index (HEI); (c) ecological risks of heavy metals (ERI) (d) negative index (NI) in the study area.
Water 12 01115 g008
Figure 9. Spatial distribution of heavy metals for samples collected in the study area.
Water 12 01115 g009
Table 1. Water quality parameters, associated units, and analytical method used.
ParametersUnitAnalytical Method
Potassiummg/LFlame photometer
Sodiummg/LFlame photometer
Magnesiummg/LTitrimetric
Calciummg/LTitrimetric
Sulfatemg/LSpectrophotometric
Chloridemg/LTitrimetric
Bicarbonatemg/LTitrimetric
pHpH unitpH meter
ECµS/cmElectrometric
Total dissolved solidsmg/LElectrometric
Nitratemg/LSpectrophotometric
Fluoridemg/LSpectrophotometric
Biochemical oxygen demandmg/LDichromate method
Dissolved oxygenmg/LWinkler method
Chemical oxygen demandmg/LWinkler’s aside method
Arsenicmg/LAtomic Absorption Spectrophotometer
Cadmiummg/LAtomic Absorption Spectrophotometer
Antimonymg/LAtomic Absorption Spectrophotometer
Seleniummg/LAtomic Absorption Spectrophotometer
Zincmg/LAtomic Absorption Spectrophotometer
Coppermg/LAtomic Absorption Spectrophotometer
Bariummg/LAtomic Absorption Spectrophotometer
Manganesemg/LAtomic Absorption Spectrophotometer
Chromiummg/LAtomic Absorption Spectrophotometer
Table 2. Classification of groundwater quality according to entropy weighted groundwater quality index (EWQI) range.
RangeType of Water
<50Excellent
50–99.99Good
100–199.99Poor
200–299.99Very poor
>300Unsuitable for drinking
Table 3. Descriptive statistics of chemical content in the groundwater samples.
ParametersUnitMinMaxMeanSDWHO Standard (2011)Entropy Weight
(Wi)
ECµS/cm35032701085698.715000.01980
pHpH units7.017.687.360.186.5–8.50.00004
TDSmg/L1653440916.05712.865000.02545
K+mg/L0.391.951.030.42120.00835
Na+mg/L4.83190.2154.9060.882000.05965
Mg2+mg/L21.699.642.1322.38300.01288
Ca2+mg/L52732150.32156.72750.03761
HCO3mg/L213.5359.9259.0941.543000.00134
Clmg/L28.4355130.42116.512500.04106
SO42−mg/L12.96453.12140.93126.972500.03831
NO3mg/L24620.3212.13450.02167
Fmg/L0.551.410.800.2110.00341
BODmg/L07.81.892.7050.10412
CODmg/L01.20.710.37100.01681
DOmg/L2.57.14.961.1050.00272
Asµg/L4.615.07.94.01000.01282
Cdµg/L0.3303.650.1103.5300.17146
Sbµg/L10.6223.796.675.02000.03357
Seµg/L6.0133.025.928.91000.04521
Znµg/L37.04060.0559.11073.550,0000.11664
Cuµg/L8.0101.031.827.75000.03329
Baµg/L219.52436.5983.5699.870000.02528
Mnµg/L1.7402.756.5116.810000.13860
Crµg/L6.0138.033.729.05000.02990
Table 4. EWQI for groundwater in the study area.
Well NumberEWQI ValueClassification
150.0Good water
226.1Excellent water
330.7Excellent water
439.9Excellent water
521.6Excellent water
623.1Excellent water
744.3Excellent water
8159.7Poor water
924.9Excellent water
1013.0Excellent water
11172.5Poor water
1237.7Excellent water
1385.9Good water
1431.6Excellent water
1597.1Good water
1629.3Excellent water
1718.2Excellent water
1830.2Excellent water
19197.9Poor water
Table 5. Pollution evaluation indices of well water samples in the study area.
Well Numberm-HPIPINI (m-HPI)ClassificationHEIClassificationNeIClassificationERIClassification
1−0.920.000−0.92Excellent0.68Low0.07Insignificant5.94Low
2−0.930.000−0.93Excellent0.83Low0.13Insignificant5.93Low
3−0.860.009−0.87Very good1.62Low0.39Insignificant14.78Low
4−0.840.003−0.84Very good1.74Low0.37Insignificant16.10Low
5−0.950.000−0.95Excellent0.57Low0.08Insignificant4.33Low
6−0.890.000−0.89Excellent0.88Low0.09Insignificant6.82Low
7−0.670.052−0.73Very good2.61Low0.47Insignificant23.76Low
83.313.692−0.38Unacceptable25.00High2.82Moderately248.49Considerable
9−0.910.000−0.91Excellent1.02Low0.19Insignificant8.62Low
10−0.930.000−0.93Excellent1.08Low0.19Insignificant7.83Low
113.884.324−0.44Unacceptable28.07High3.25Moderate279.84Considerable
12−0.910.000−0.91Excellent0.99Low0.12Insignificant7.34Low
13−0.860.000−0.86Excellent1.95Low0.24Insignificant13.14Low
14−0.880.000−0.88Excellent1.10Low0.16Insignificant9.90Low
151.091.496−0.41Good12.13Medium1.35Slight120.32Moderate
16−0.870.002−0.87Very good1.44Low0.36Insignificant13.35Low
17−0.900.000−0.90Excellent1.66Low0.32Insignificant11.44Low
18−0.830.002−0.83Very good1.69Low0.36Insignificant15.81Low
194.384.787−0.41Unacceptable31.14High3.56Moderate308.54Considerable

