Impact of Cruise Activity on Freshwater Use in the Port of Palma (Mallorca, Spain)

 , ,
, ,  , and
, and
Abstract
1. Introduction
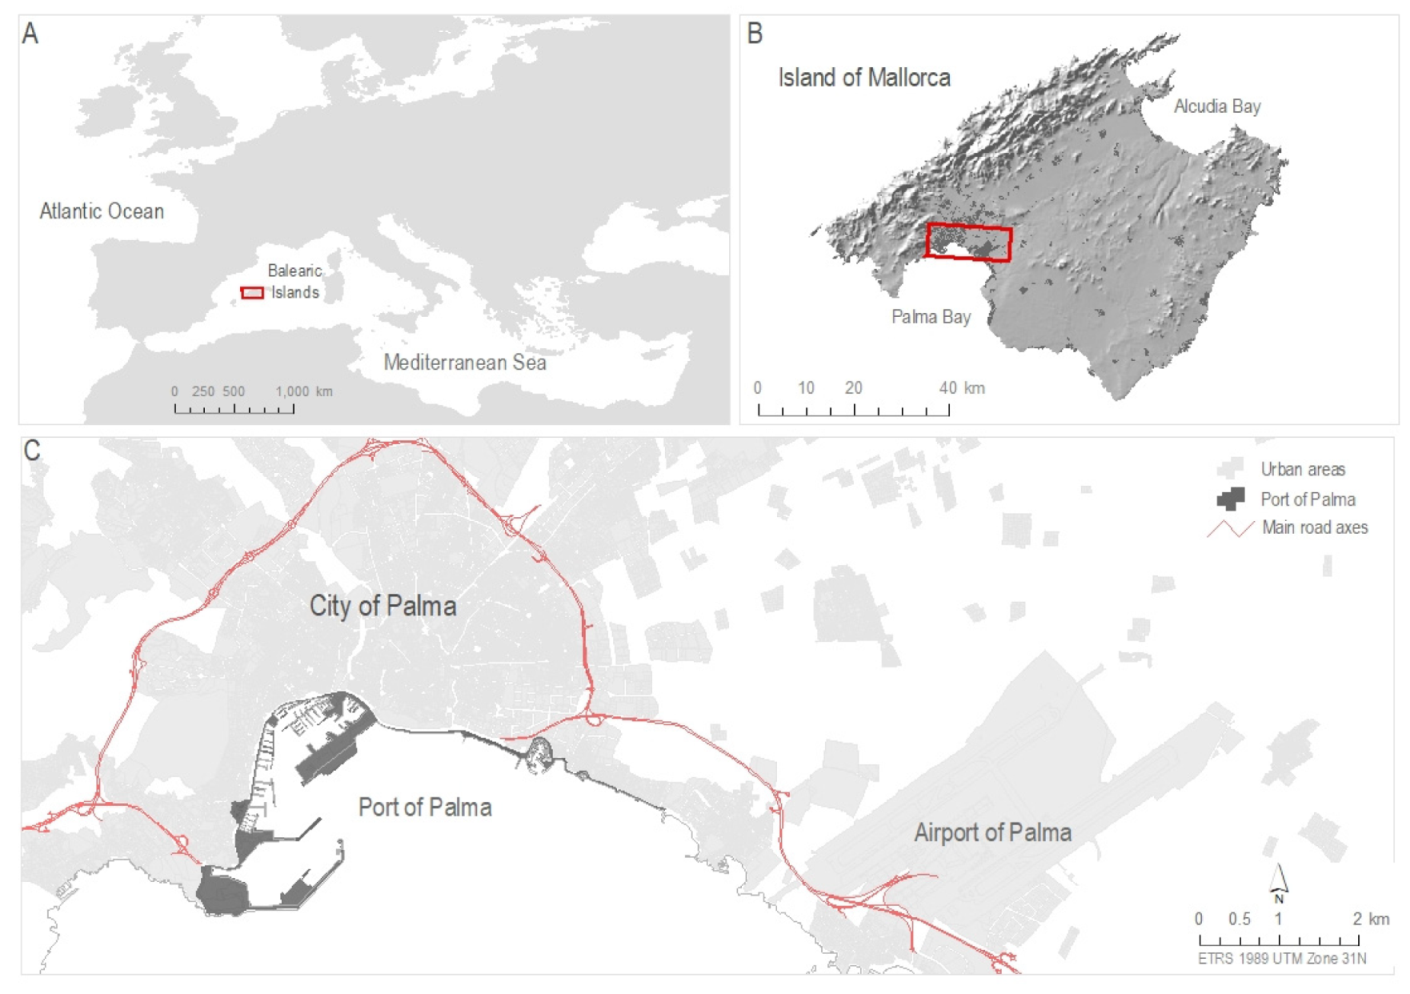
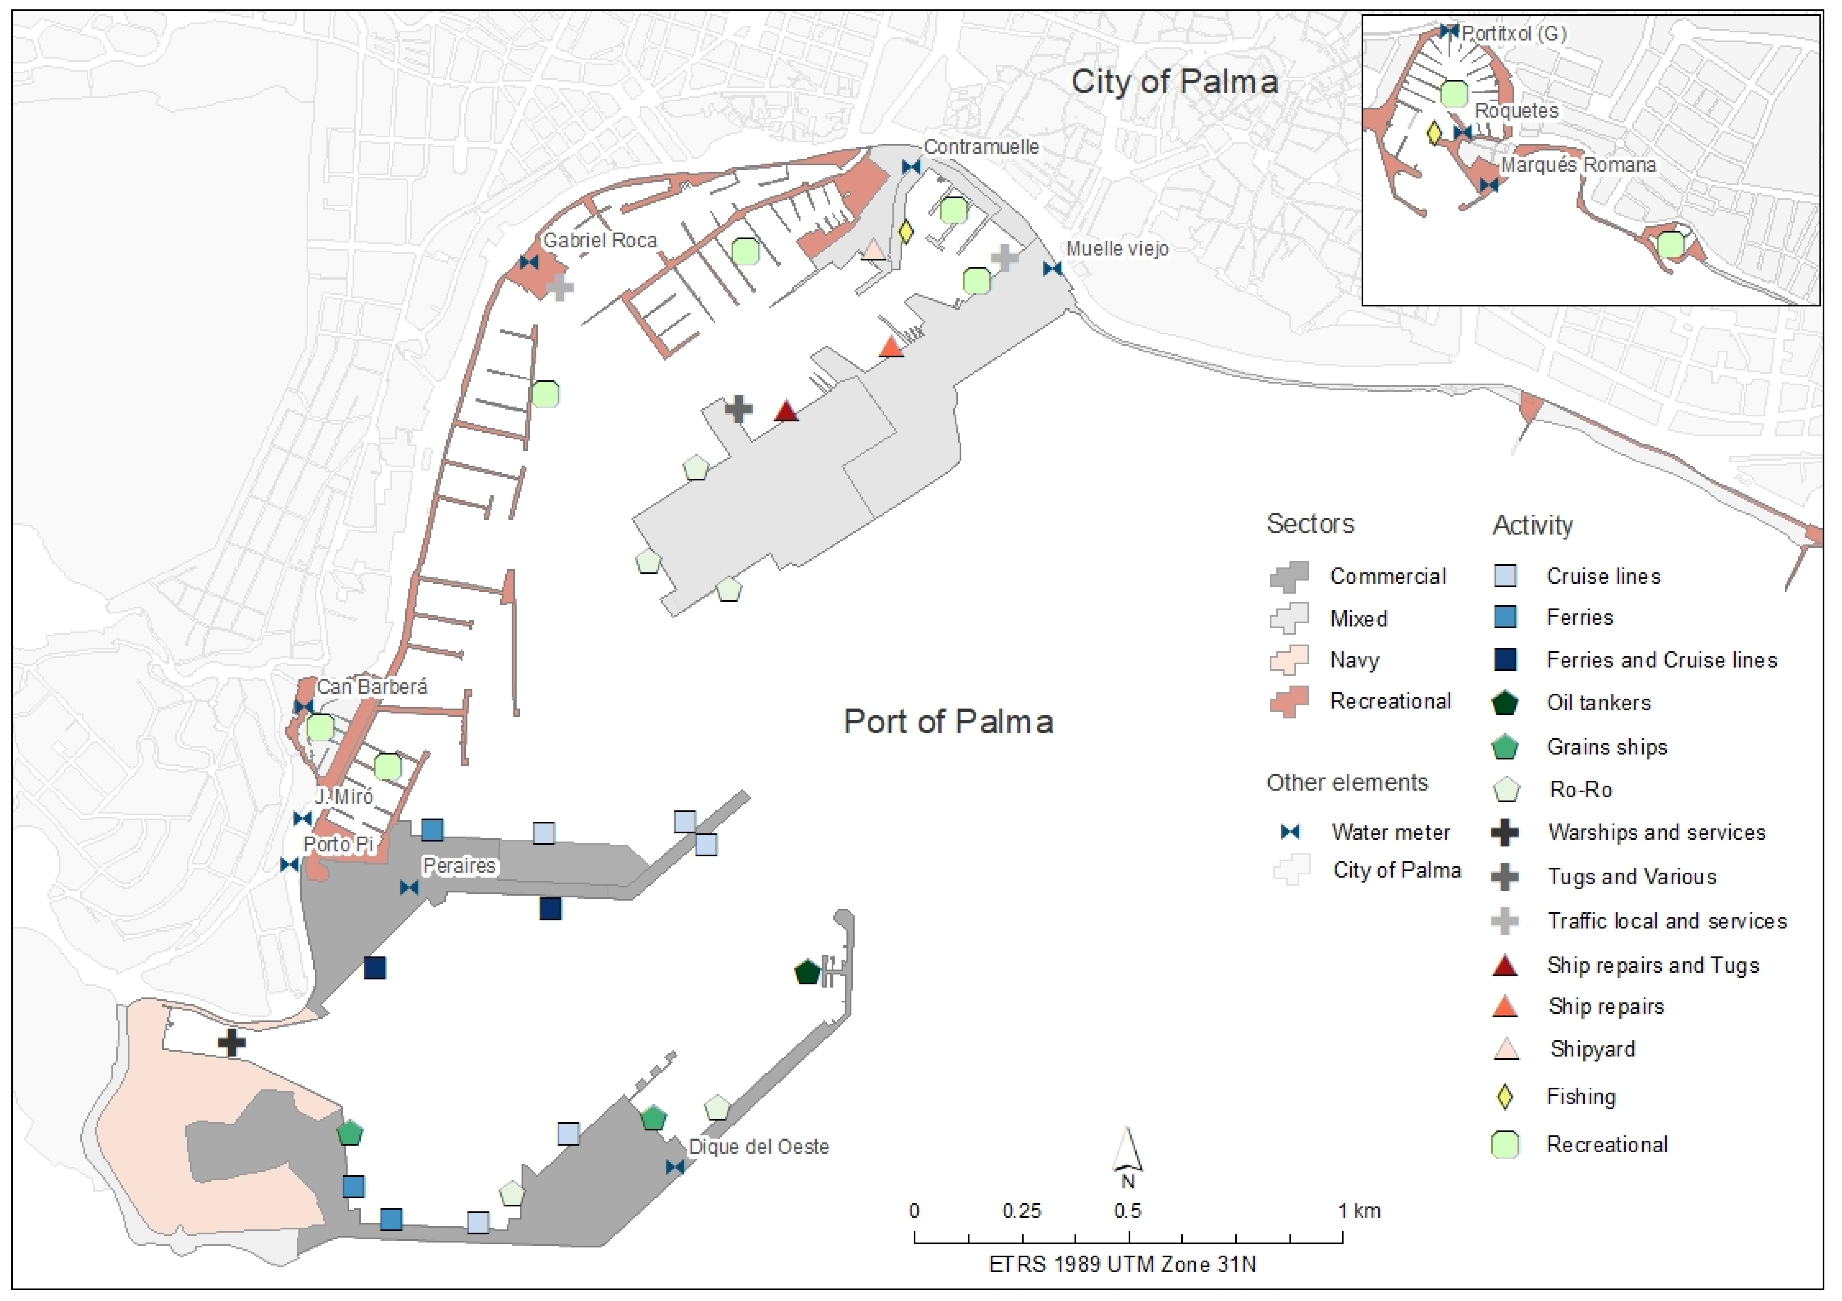
2. Study Area
3. Materials and Methods
4. Results
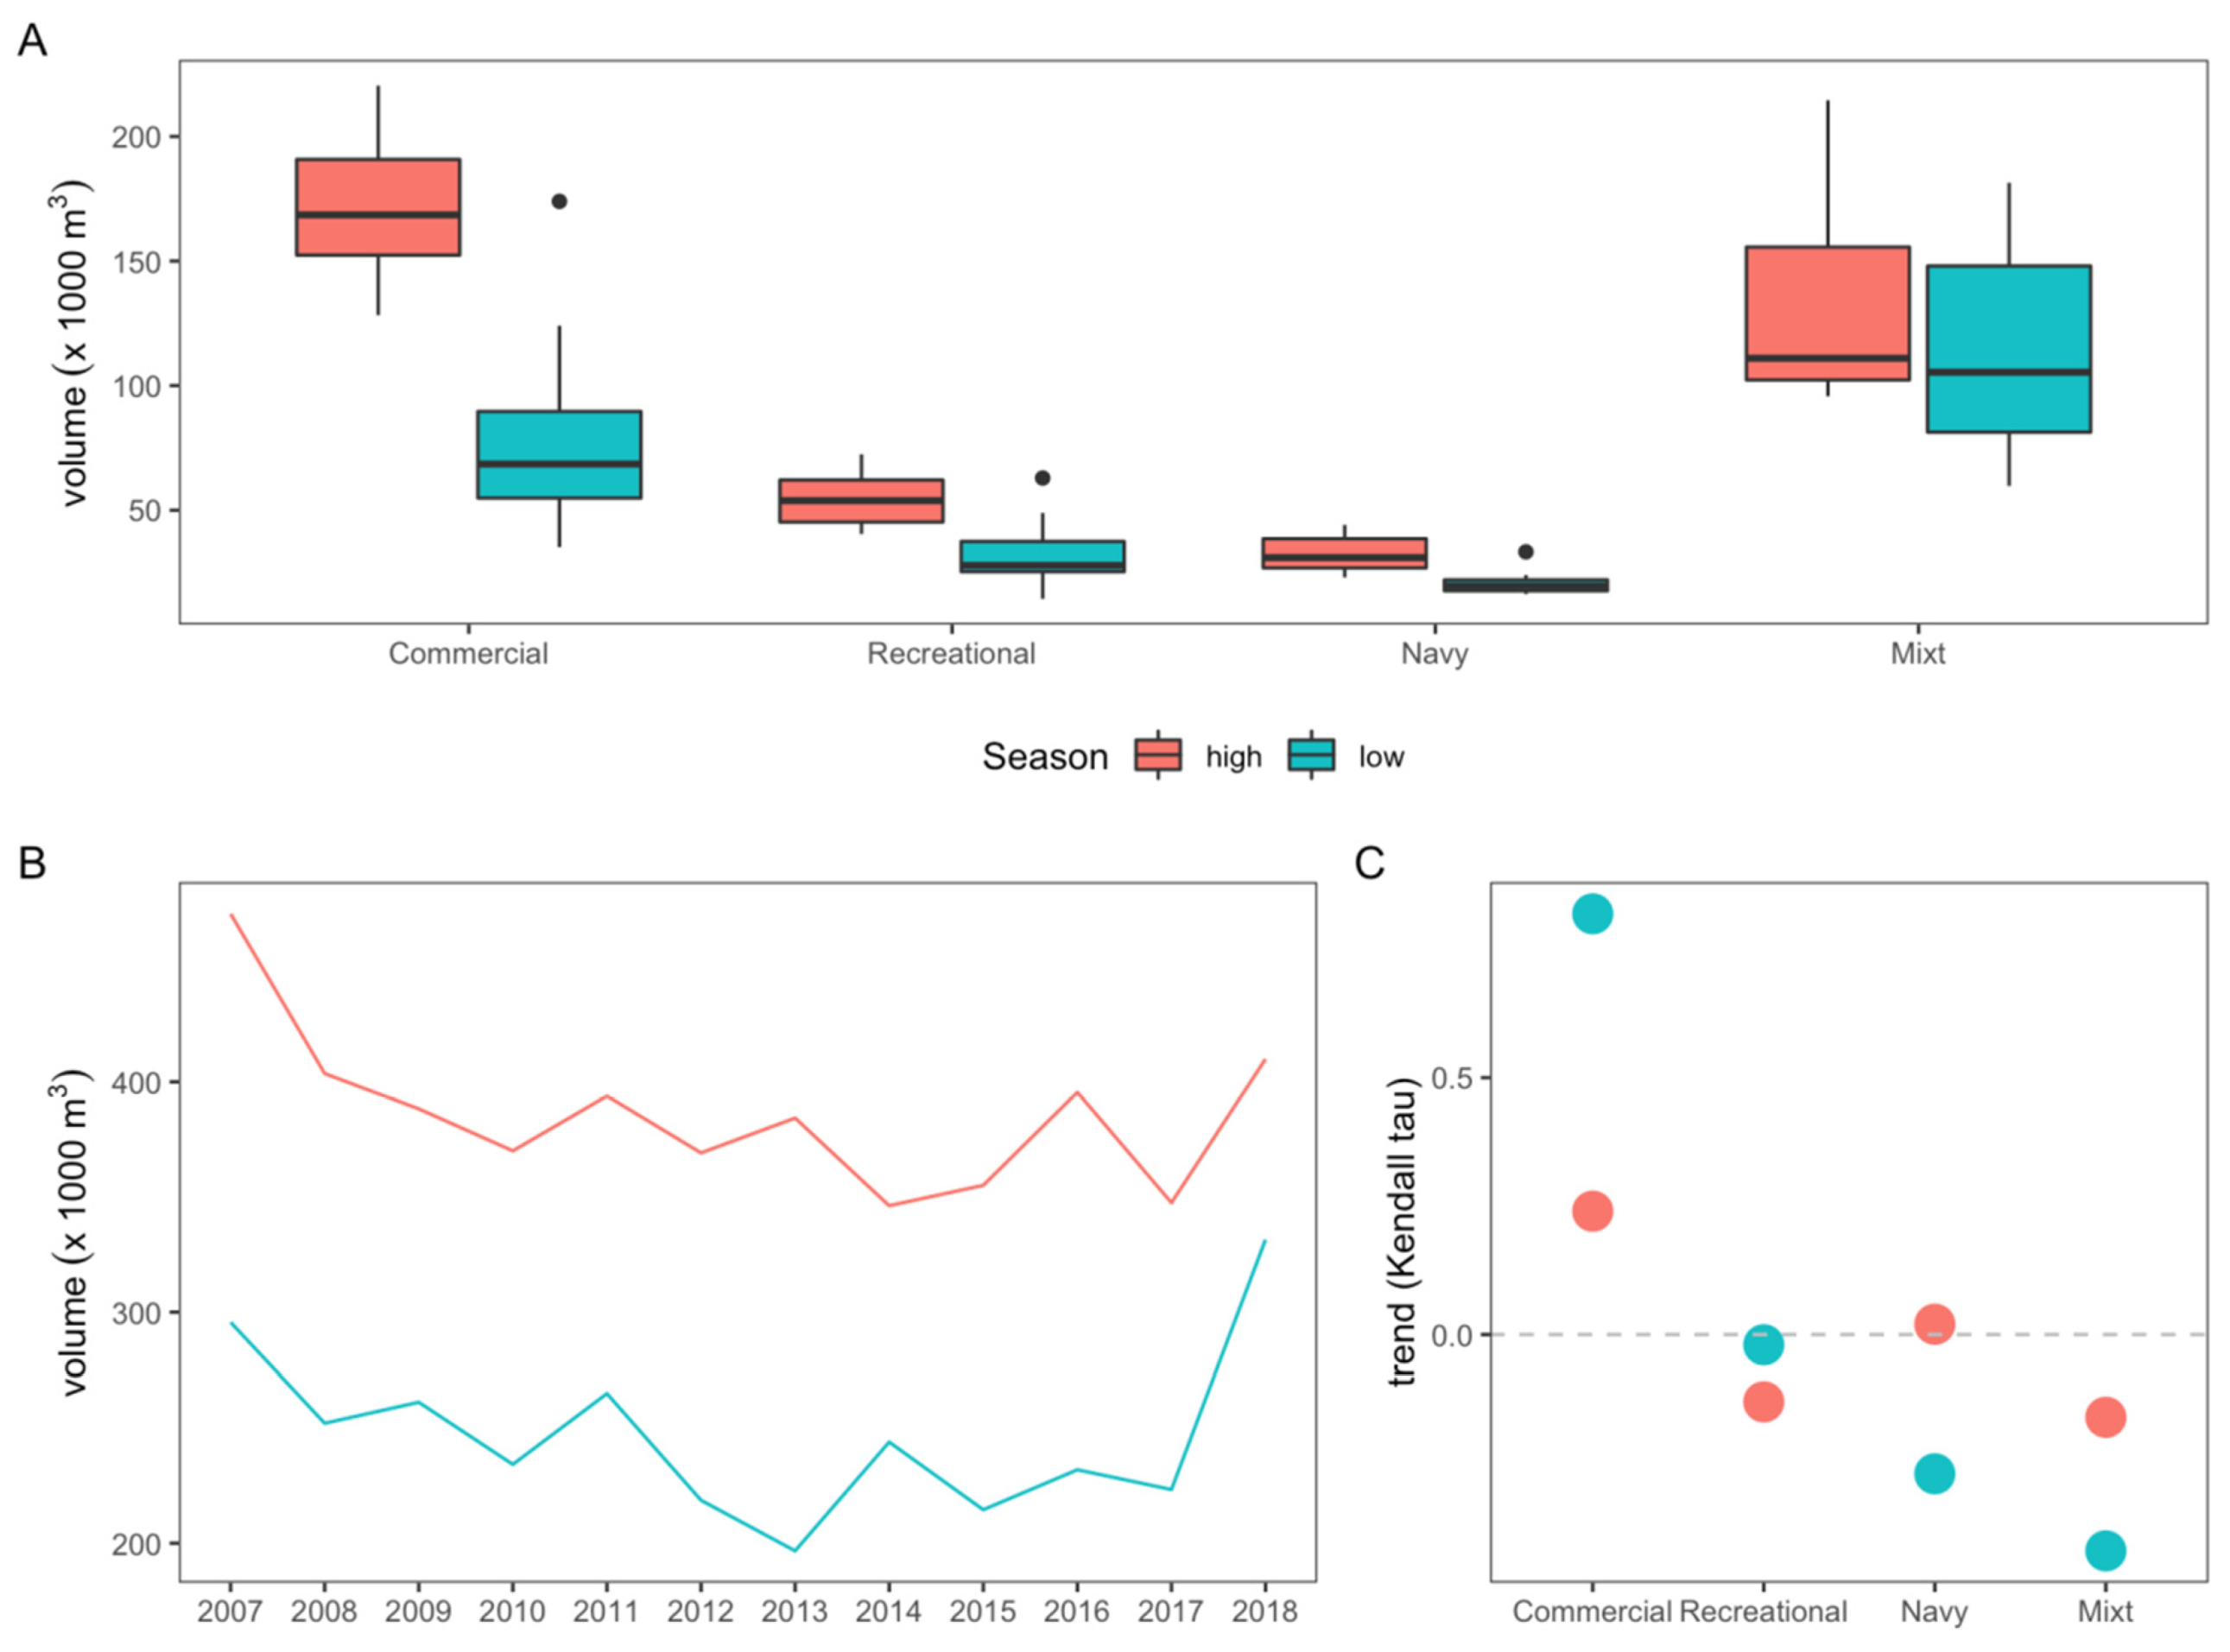
4.1. Evolution of Water Use in the Port of Palma by Sectors
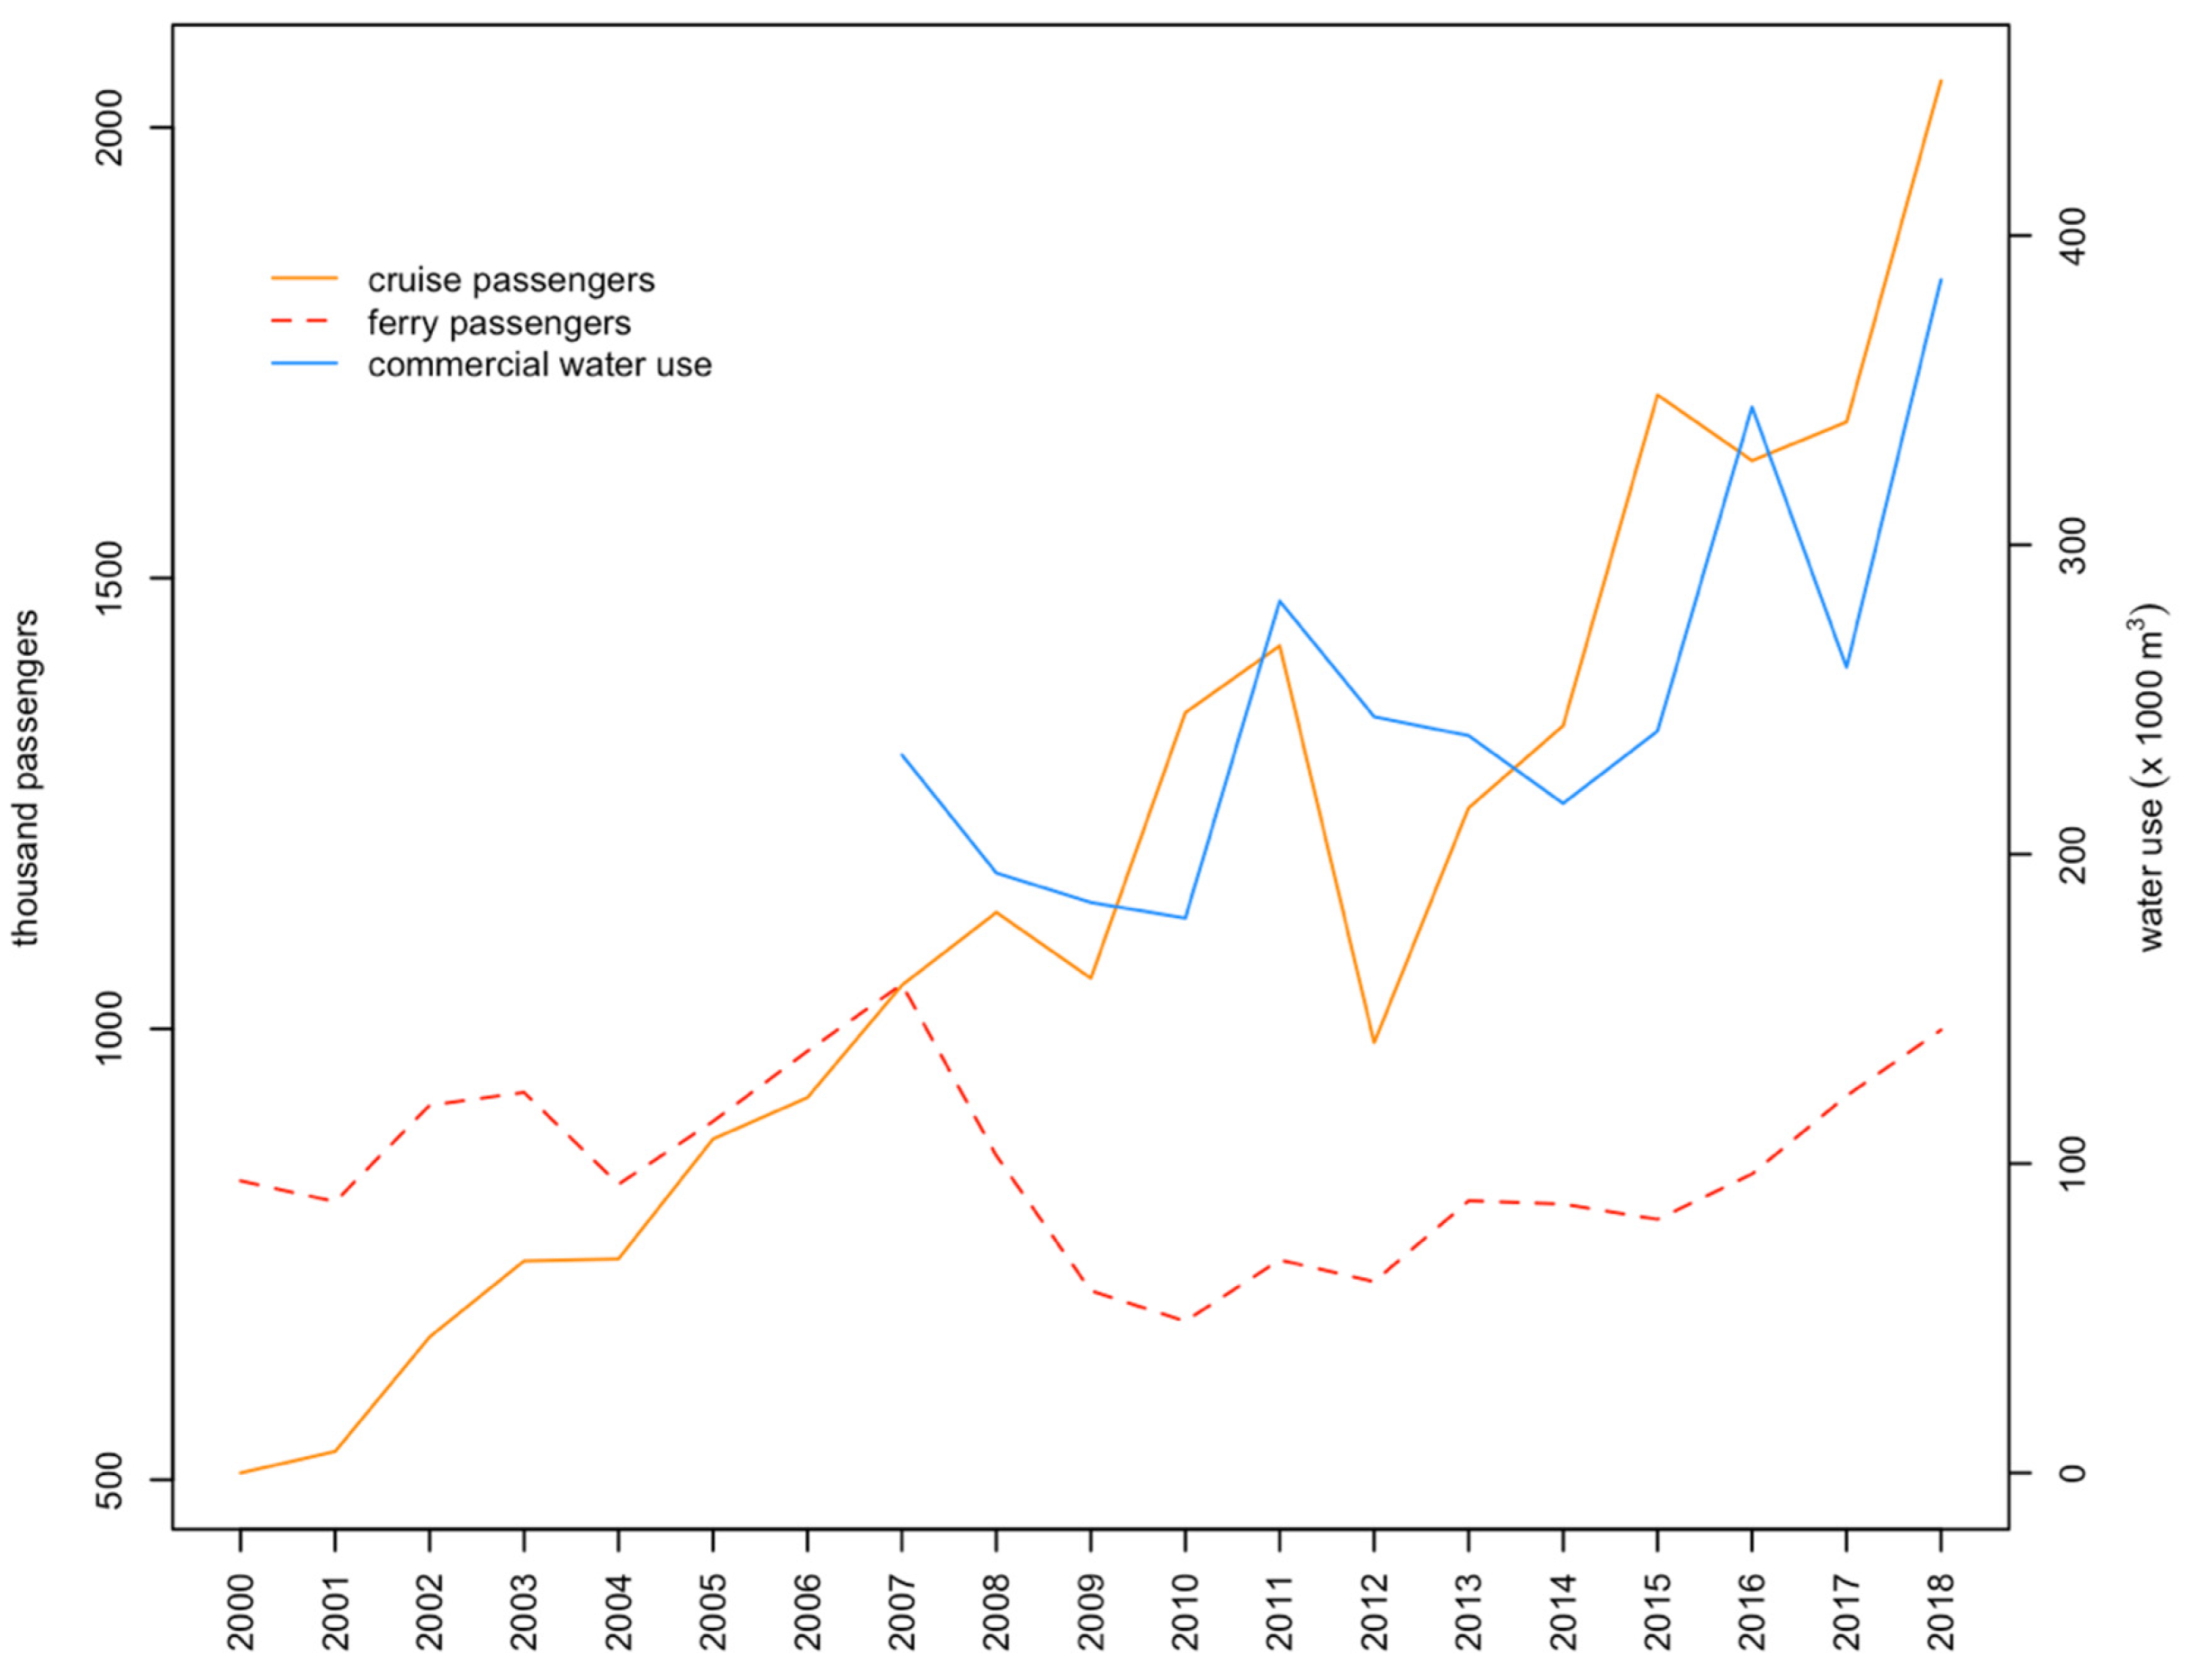
4.2. Water Withdrawal by Cruise Ships
5. Discussion and Implications
Author Contributions
Funding
Acknowledgments
Conflicts of Interest
References
- ESPO Environmental Report 2018. EcoPortsinSights 2018. Available online: https://www.espo.be/media/ESPOEnvironmentalReport2018.pdf (accessed on 10 March 2020).
- Puig, M.; Wooldridge, C.; Michail, A.; Darbra, R.M. Current status and trends of the environmental performance in European ports. Environ. Sci. Policy 2015, 48, 57–66. [Google Scholar] [CrossRef]
- Esteve-Perez, J.; Garcia-Sanchez, A. Dynamism patterns of western mediterranean cruise ports and the coopetition relationships between major cruise ports. Polish Marit. Res. 2018, 25, 51–60. [Google Scholar] [CrossRef]
- Carić, H. Cruising Tourism Environmental Impacts: Case Study of Dubrovnik, Croatia. J. Coast. Res. 2011, 61, 104–113. [Google Scholar] [CrossRef]
- Legoupil, T. Los conflictos que genera el turismo de cruceros en Barcelona y otros puertos Mediterráneos. Biblio 3W. Rev. Bibliogr. Geogr. Cienc. Soc. 2013, 18, 13. [Google Scholar]
- Dragović, B.; Tzannatos, E.; Tselentis, V.; Meštrović, R.; Škurić, M. Ship emissions and their externalities in cruise ports. Transp. Res. Part D Transp. Environ. 2018, 61, 289–300. [Google Scholar] [CrossRef]
- Carić, H. Challenges and prospects of valuation—Cruise ship pollution case. J. Clean. Prod. 2016, 111, 487–498. [Google Scholar] [CrossRef]
- Deidun, A.; Vella, P. Marine Ecological Impact Considerations for Cruise Liner Facility Development at Two Coastal Sites in the Maltese Islands. J. Coast. Res. 2011, 61, 114–122. [Google Scholar] [CrossRef]
- Asero, V.; Skonieczny, S. Cruise Tourism and Sustainability in the Mediterranean. Destination Venice. In Mobilities, Tourism and Travel Behavior—Contexts and Boundaries; InTechOpen limited: London, UK, 2018; pp. 93–106. [Google Scholar]
- Marques, M. The Cruise Industry in the World. In Managing, Marketing, and Maintaining Maritime and Coastal Tourism; Mónica Morais de Brito, D.A., Patuleia, M., Eds.; IGI Global: Hershey, PA, USA, 2020; pp. 223–232. [Google Scholar]
- Rosa-Jiménez, C.; Perea-Medina, B.; Andrade, M.J.; Nebot, N. An examination of the territorial imbalance of the cruising activity in the main Mediterranean port destinations: Effects on sustainable transport. J. Transp. Geogr. 2018, 68, 94–101. [Google Scholar] [CrossRef]
- Medcruise Cruise Activities in MedCruise Ports. Statistics Report 2018; MedCruise Association: Santa Cruz de Tenerife, Spain, 2019. [Google Scholar]
- Karlis, T.; Polemis, D. Cruise homeport competition in the Mediterranean. Tour. Manag. 2018, 68, 168–176. [Google Scholar] [CrossRef]
- Vega-Muñoz, A.; Arjona-Fuentes, J.M.; Ariza-Montes, A.; Han, H.; Law, R. In search of ‘a research front’ in cruise tourism studies. Int. J. Hosp. Manag. 2019, 102353. [Google Scholar] [CrossRef]
- Papathanassis, A.; Beckmann, I. Assessing the “poverty of cruise theory” hypothesis. Ann. Tour. Res. 2011, 38, 153–174. [Google Scholar] [CrossRef]
- Véronneau, S.; Roy, J. Global service supply chains: An empirical study of current practices and challenges of a cruise line corporation. Tour. Manag. 2009, 30, 128–139. [Google Scholar] [CrossRef]
- Bonilla-Priego, M.J.; Font, X.; del Pacheco-Olivares, M.R. Corporate sustainability reporting index and baseline data for the cruise industry. Tour. Manag. 2014, 44, 149–160. [Google Scholar] [CrossRef]
- TOUI Group 2018 Sustainability Report. Available online: https://www.tuigroup.com/damfiles/default/tuigroup-15/de/nachhaltigkeit/berichterstattung-downloads/2019/nachhaltigkeitsbericht-de-en/TUI_CSR18_EN.pdf-1e195dc4f0aff3763334c790e5417049.pdf (accessed on 9 March 2020).
- Stefanidaki, E.; Lekakou, M. Cruise carrying capacity: A conceptual approach. Res. Transp. Bus. Manag. 2014, 13, 43–52. [Google Scholar] [CrossRef]
- Viola, F.; Sapiano, M.; Schembri, M.; Brincat, C.; Lopez, A.; Toscano, A.; Diamadopoulos, E.; Charalambous, B.; Molle, B.; Zoumadakis, M.; et al. The state of water resources in major Mediterranean islands. Water Resour. 2014, 41, 639–648. [Google Scholar] [CrossRef]
- Lorenzo-Lacruz, J.; Moran-Tejeda, E. Spatio-temporal patterns of meteorological droughts in the Balearic Islands (Spain). Geogr. Res. Lett. 2016, 42, 49. [Google Scholar] [CrossRef]
- Lorenzo-Lacruz, J.; Garcia, C.; Morán-Tejeda, E. Groundwater level responses to precipitation variability in Mediterranean insular aquifers. J. Hydrol. 2017, 552. [Google Scholar] [CrossRef]
- Hof, A.; Blázquez-Salom, M. Changing tourism patterns, capital accumulation, and urban water consumption in Mallorca, Spain: A sustainability fix? J. Sustain. Tour. 2015, 23, 770–796. [Google Scholar] [CrossRef]
- Deyà-Tortella, B.; Garcia, C.; Nilsson, W.; Tirado, D. Analysis of Water Tariff Reform on Water Consumption in Different Housing Typologies in Calvi. Water 2017, 9, 425. [Google Scholar] [CrossRef]
- Garcia, C.; Servera, J. Impacts of tourism development on water demand and beach degradation on the island of Mallorca (Spain). Geogr. Ann. Ser. A-Phys. Geogr. 2003, 85, 287–300. [Google Scholar] [CrossRef]
- Giorgi, F.; Lionello, P. Climate change projections for the Mediterranean region. Glob. Planet. Chang. 2008, 63, 90–104. [Google Scholar] [CrossRef]
- García-Ruiz, J.M.; López-Moreno, J.I.; Vicente-Serrano, S.M.; Lasanta-Martínez, T.; Beguería, S. Mediterranean water resources in a global change scenario. Earth-Sci. Rev. 2011, 105, 121–139. [Google Scholar] [CrossRef]
- Diffenbaugh, N.S.; Pal, J.S.; Giorgi, F.; Gao, X. Heat stress intensification in the Mediterranean climate change hotspot. Geophys. Res. Lett. 2007, 34, 1–6. [Google Scholar] [CrossRef]
- Memoria de Sostenibilidad. Available online: https://www.portsdebalears.com/es/memoria-sostenibilidad-2018 (accessed on 27 January 2020).
- IBESTAT Indicador de Pressió Humana. Available online: https://ibestat.caib.es/ibestat/estadistiques/poblacio/estudis-demografics/indicador-pressio-humana-iph/e91ffb58-6bdd-457c-bd25-ed2a201f57ae (accessed on 10 March 2020).
- Gui, L.; Paolo Russoz, A. Cruise ports: A strategic nexus between regions and global lines-evidence from the mediterranean. Marit. Policy Manag. 2011. [Google Scholar] [CrossRef]
- IGN Plan Nacional de Ortofotografía Aérea. Available online: https://pnoa.ign.es/ortofotos (accessed on 27 January 2020).
- Yue, S.; Pilon, P.; Phinney, B. Canadian streamflow trend detection: Impacts of serial and cross-correlation. Hydrol. Sci. J. 2003, 48, 51–64. [Google Scholar] [CrossRef]
- Bagis, O.; Dooms, M. Turkey’s potential on becoming a cruise hub for the East Mediterranean Region: The case of Istanbul. Res. Transp. Bus. Manag. 2014, 13, 6–15. [Google Scholar] [CrossRef]
- Pino, G.; Peluso, A.M. The development of cruise tourism in emerging destinations: Evidence from Salento, Italy. Tour. Hosp. Res. 2018, 18, 15–27. [Google Scholar] [CrossRef]
- Castillo-Manzano, J.I.; Fageda, X.; Gonzalez-Laxe, F. An analysis of the determinants of cruise traffic: An empirical application to the Spanish port system. Transp. Res. Part E 2014, 66, 115–125. [Google Scholar] [CrossRef]
- Boulben el Ghachaoui, S. Análisis Económico y Comparativo de la Producción de Agua Dulce Mediante un Generador a Bordo de un Buque Mercante; Universitat Politècnica de Catalunya: Barcelona, Spain, 2013. [Google Scholar]
- EMAYA Water Tariffs. Available online: http://www.caib.es/eboibfront/es/2016/10595/589329/publicacion-nuevas-tarifas-de-emaya-2017 (accessed on 31 January 2020).
- Ramis, C.; Romero, R.; Homar, V.; Alonso, S.; Jansà, A.; Amengual, A. On the drought in the Balearic Islands during the hydrological year 2015–2016. Nat. Hazards Earth Syst. Sci. 2017, 17, 2351–2364. [Google Scholar] [CrossRef]


| Month | Total Water Withdrawals Port of Palma, m3 | Total Water Withdrawals by Merchants Ships (Mixt and Commercial Sectors), m3 | Number of Merchant Ships | Average Water Withdrawals by Merchant Ship, m3 | Total Water Withdrawals by Cruise Ship, m3 | Number of Transit Cruises | Total Water Withdrawals by Transit Cruise, m3 | Average Water Withdrawals by Transit Cruise, m3 | Number of Homeport Cruises | Total Water Withdrawals by Homeport Cruise, m3 | Average Water Withdrawals by Homeport Cruise, m3 |
|---|---|---|---|---|---|---|---|---|---|---|---|
| Jan | 47,080 | 40,969 | 162 | 252.9 | 0 | 8 | 0 | 0 | |||
| Feb | 22,870 | 14,324 | 165 | 86.8 | 2400 | 11 | 2400 | 218.2 | 0 | ||
| March | 29,850 | 19,228 | 178 | 108.0 | 2930 | 16 | 2930 | 183.1 | 0 | ||
| April | 25,200 | 12,753 | 182 | 70.1 | 6780 | 33 | 1870 | 56.7 | 12 | 4910 | 409.2 |
| May | 46,390 | 14,871 | 182 | 81.7 | 19,760 | 42 | 4070 | 96.9 | 24 | 15,690 | 653.8 |
| June | 57,700 | 27,852 | 202 | 137.9 | 18,320 | 28 | 2820 | 100.7 | 22 | 15,500 | 704.5 |
| July | 74,810 | 38,402 | 213 | 180.3 | 19,300 | 38 | 2590 | 68.2 | 21 | 16,710 | 795.7 |
| Aug | 62,770 | 29,223 | 204 | 143.3 | 19,630 | 41 | 5100 | 124.4 | 22 | 14,530 | 660.5 |
| Sept | 98,710 | 69,699 | 181 | 385.1 | 14,550 | 41 | 3250 | 79.3 | 20 | 11,300 | 565.0 |
| Oct | 55,050 | 23,845 | 170 | 140.3 | 20,710 | 48 | 870 | 18.1 | 32 | 19,840 | 620.0 |
| Nov | 73,720 | 63,859 | 169 | 377.9 | 2780 | 32 | 330 | 10.3 | 4 | 2450 | 612.5 |
| Dec | 33,150 | 27,432 | 163 | 168.3 | 0 | 7 | 0 | 0 | |||
| 627,300 | 382,457 | 177.7 | 127,160 | 26,230 | 95.6 | 100,930 | 627.6 | ||||
| Standard deviation | 107.4 | 62.7 | 104.8 |
© 2020 by the authors. Licensee MDPI, Basel, Switzerland. This article is an open access article distributed under the terms and conditions of the Creative Commons Attribution (CC BY) license (http://creativecommons.org/licenses/by/4.0/).
Share and Cite
Garcia, C.; Mestre-Runge, C.; Morán-Tejeda, E.; Lorenzo-Lacruz, J.; Tirado, D. Impact of Cruise Activity on Freshwater Use in the Port of Palma (Mallorca, Spain). Water 2020, 12, 1088. https://doi.org/10.3390/w12041088
Garcia C, Mestre-Runge C, Morán-Tejeda E, Lorenzo-Lacruz J, Tirado D. Impact of Cruise Activity on Freshwater Use in the Port of Palma (Mallorca, Spain). Water. 2020; 12(4):1088. https://doi.org/10.3390/w12041088
Chicago/Turabian StyleGarcia, Celso, Christian Mestre-Runge, Enrique Morán-Tejeda, Jorge Lorenzo-Lacruz, and Dolores Tirado. 2020. "Impact of Cruise Activity on Freshwater Use in the Port of Palma (Mallorca, Spain)" Water 12, no. 4: 1088. https://doi.org/10.3390/w12041088
APA StyleGarcia, C., Mestre-Runge, C., Morán-Tejeda, E., Lorenzo-Lacruz, J., & Tirado, D. (2020). Impact of Cruise Activity on Freshwater Use in the Port of Palma (Mallorca, Spain). Water, 12(4), 1088. https://doi.org/10.3390/w12041088