Risk Assessment of Agricultural Drought Disaster on the Huaibei Plain of China Based on the Improved Connection Number and Entropy Information Diffusion Method


Abstract
1. Introduction
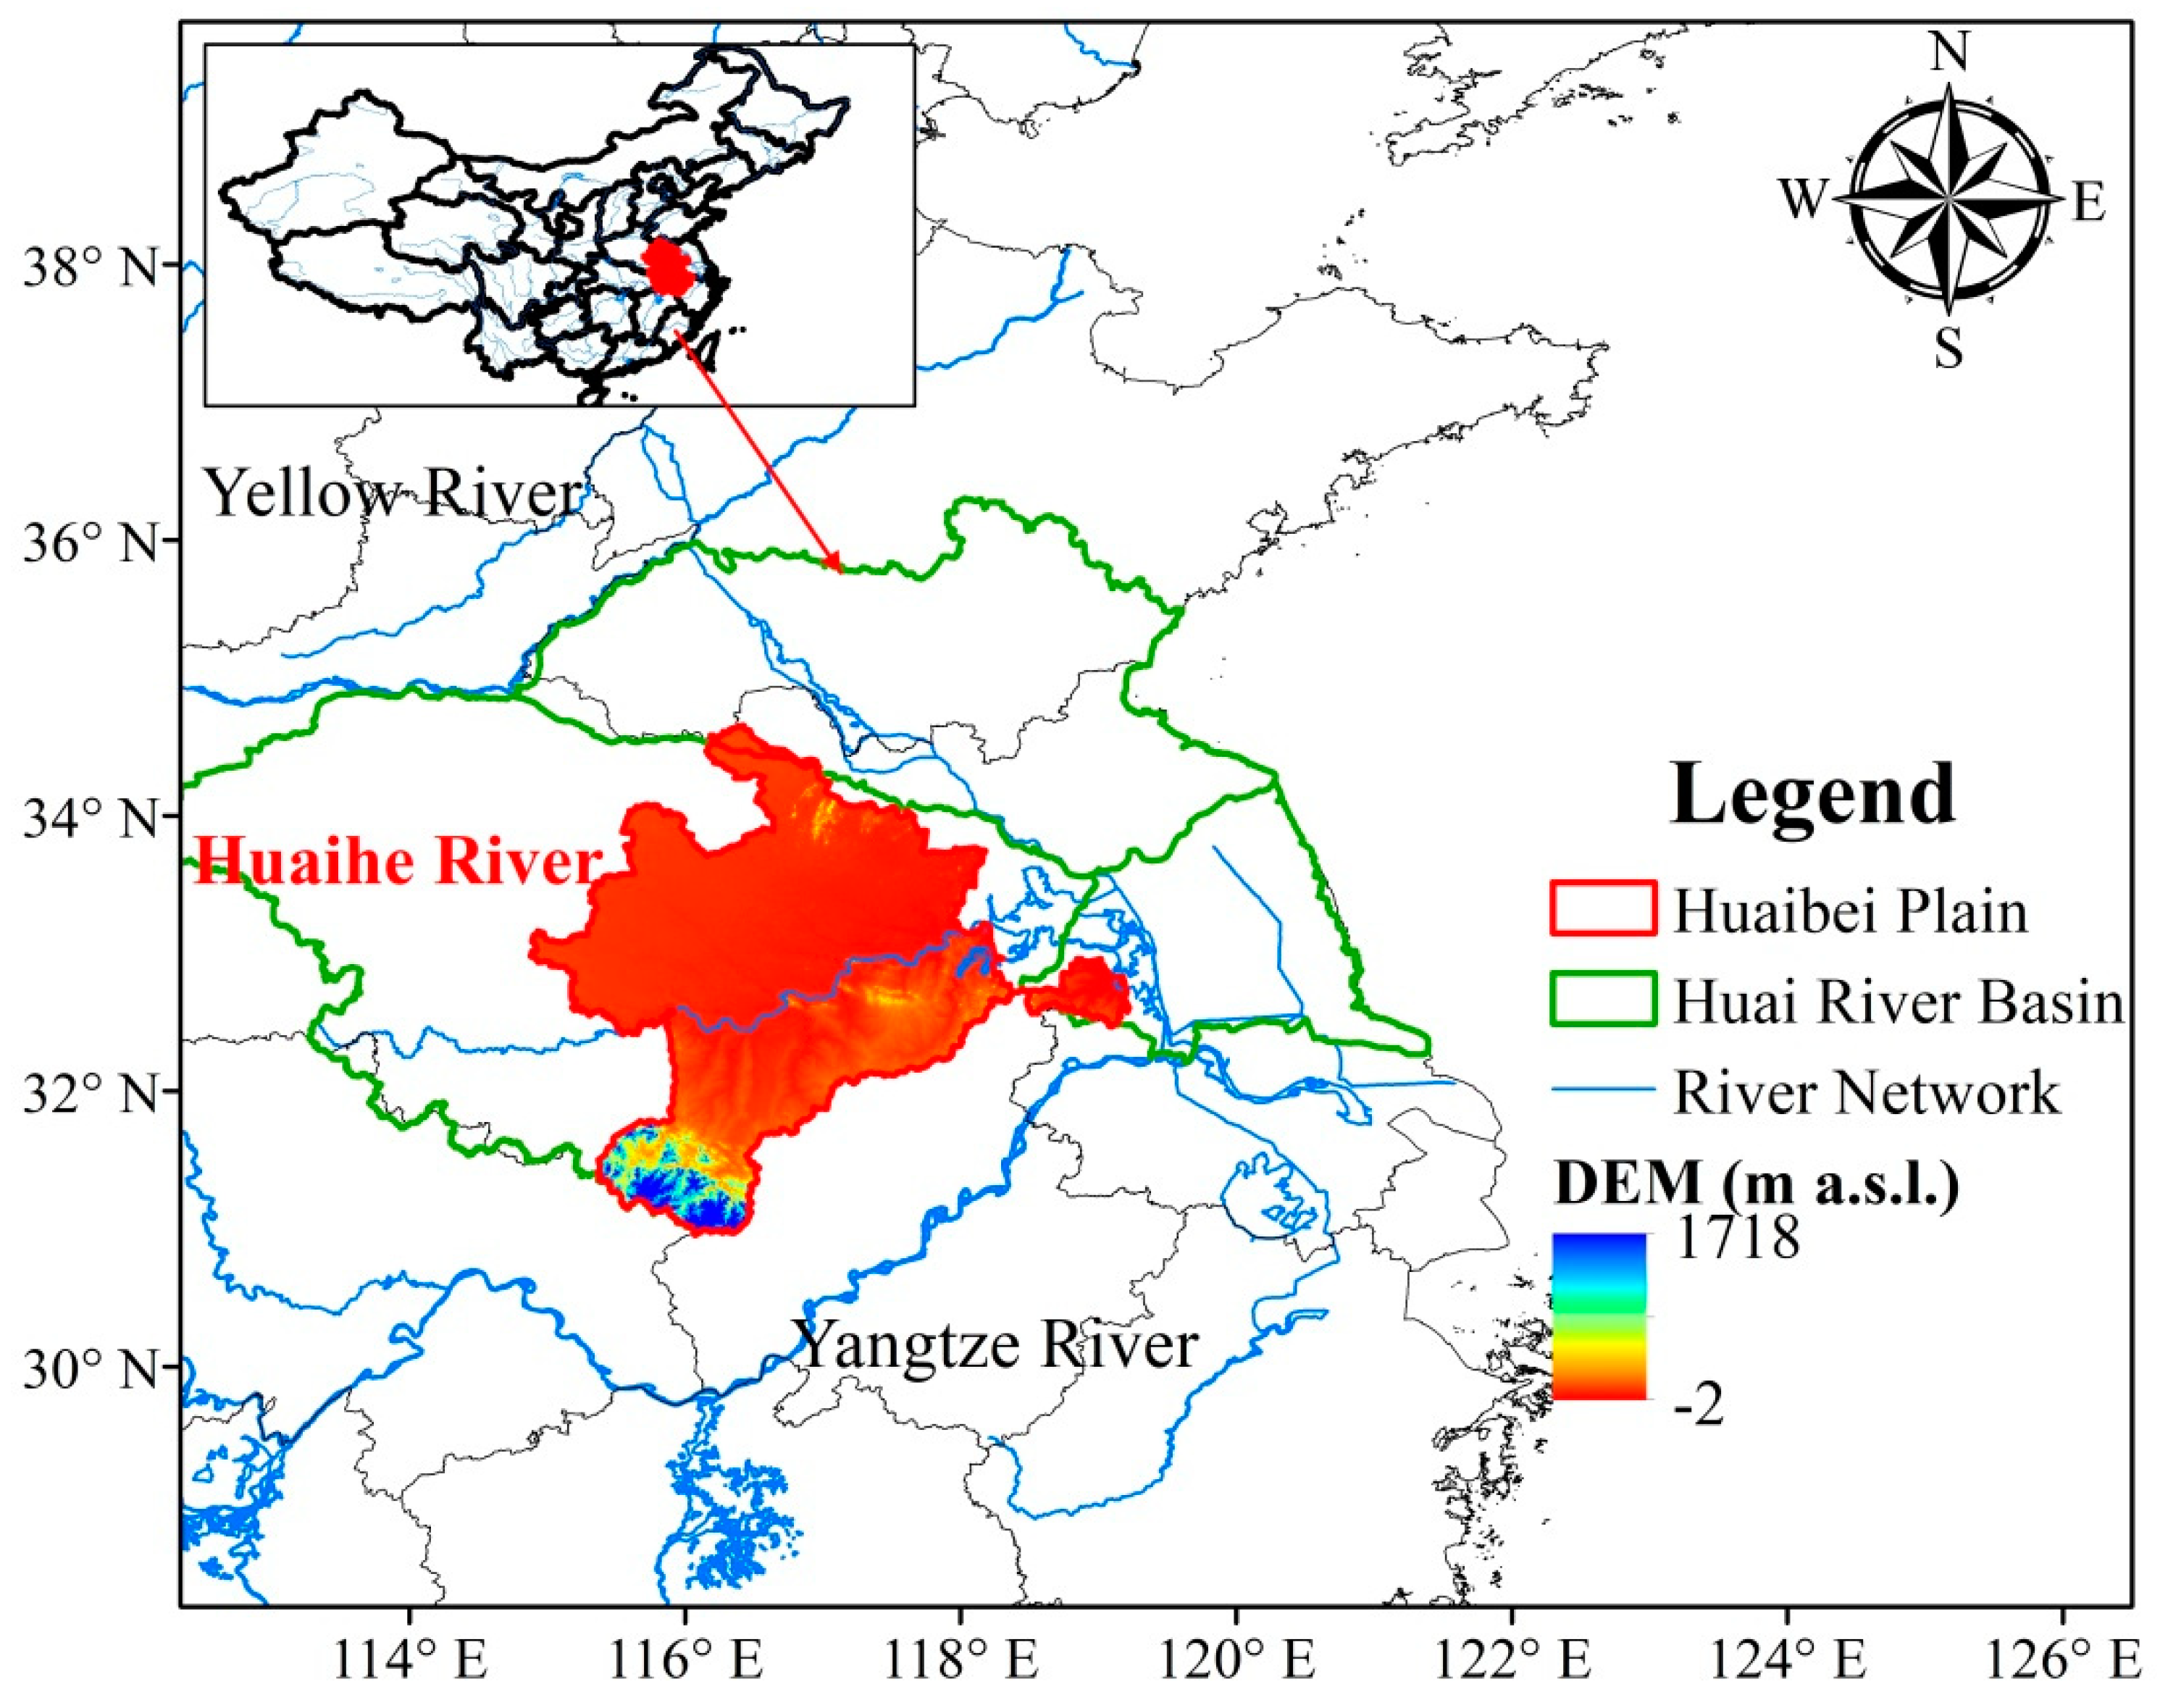
2. Study Area
3. Methodology
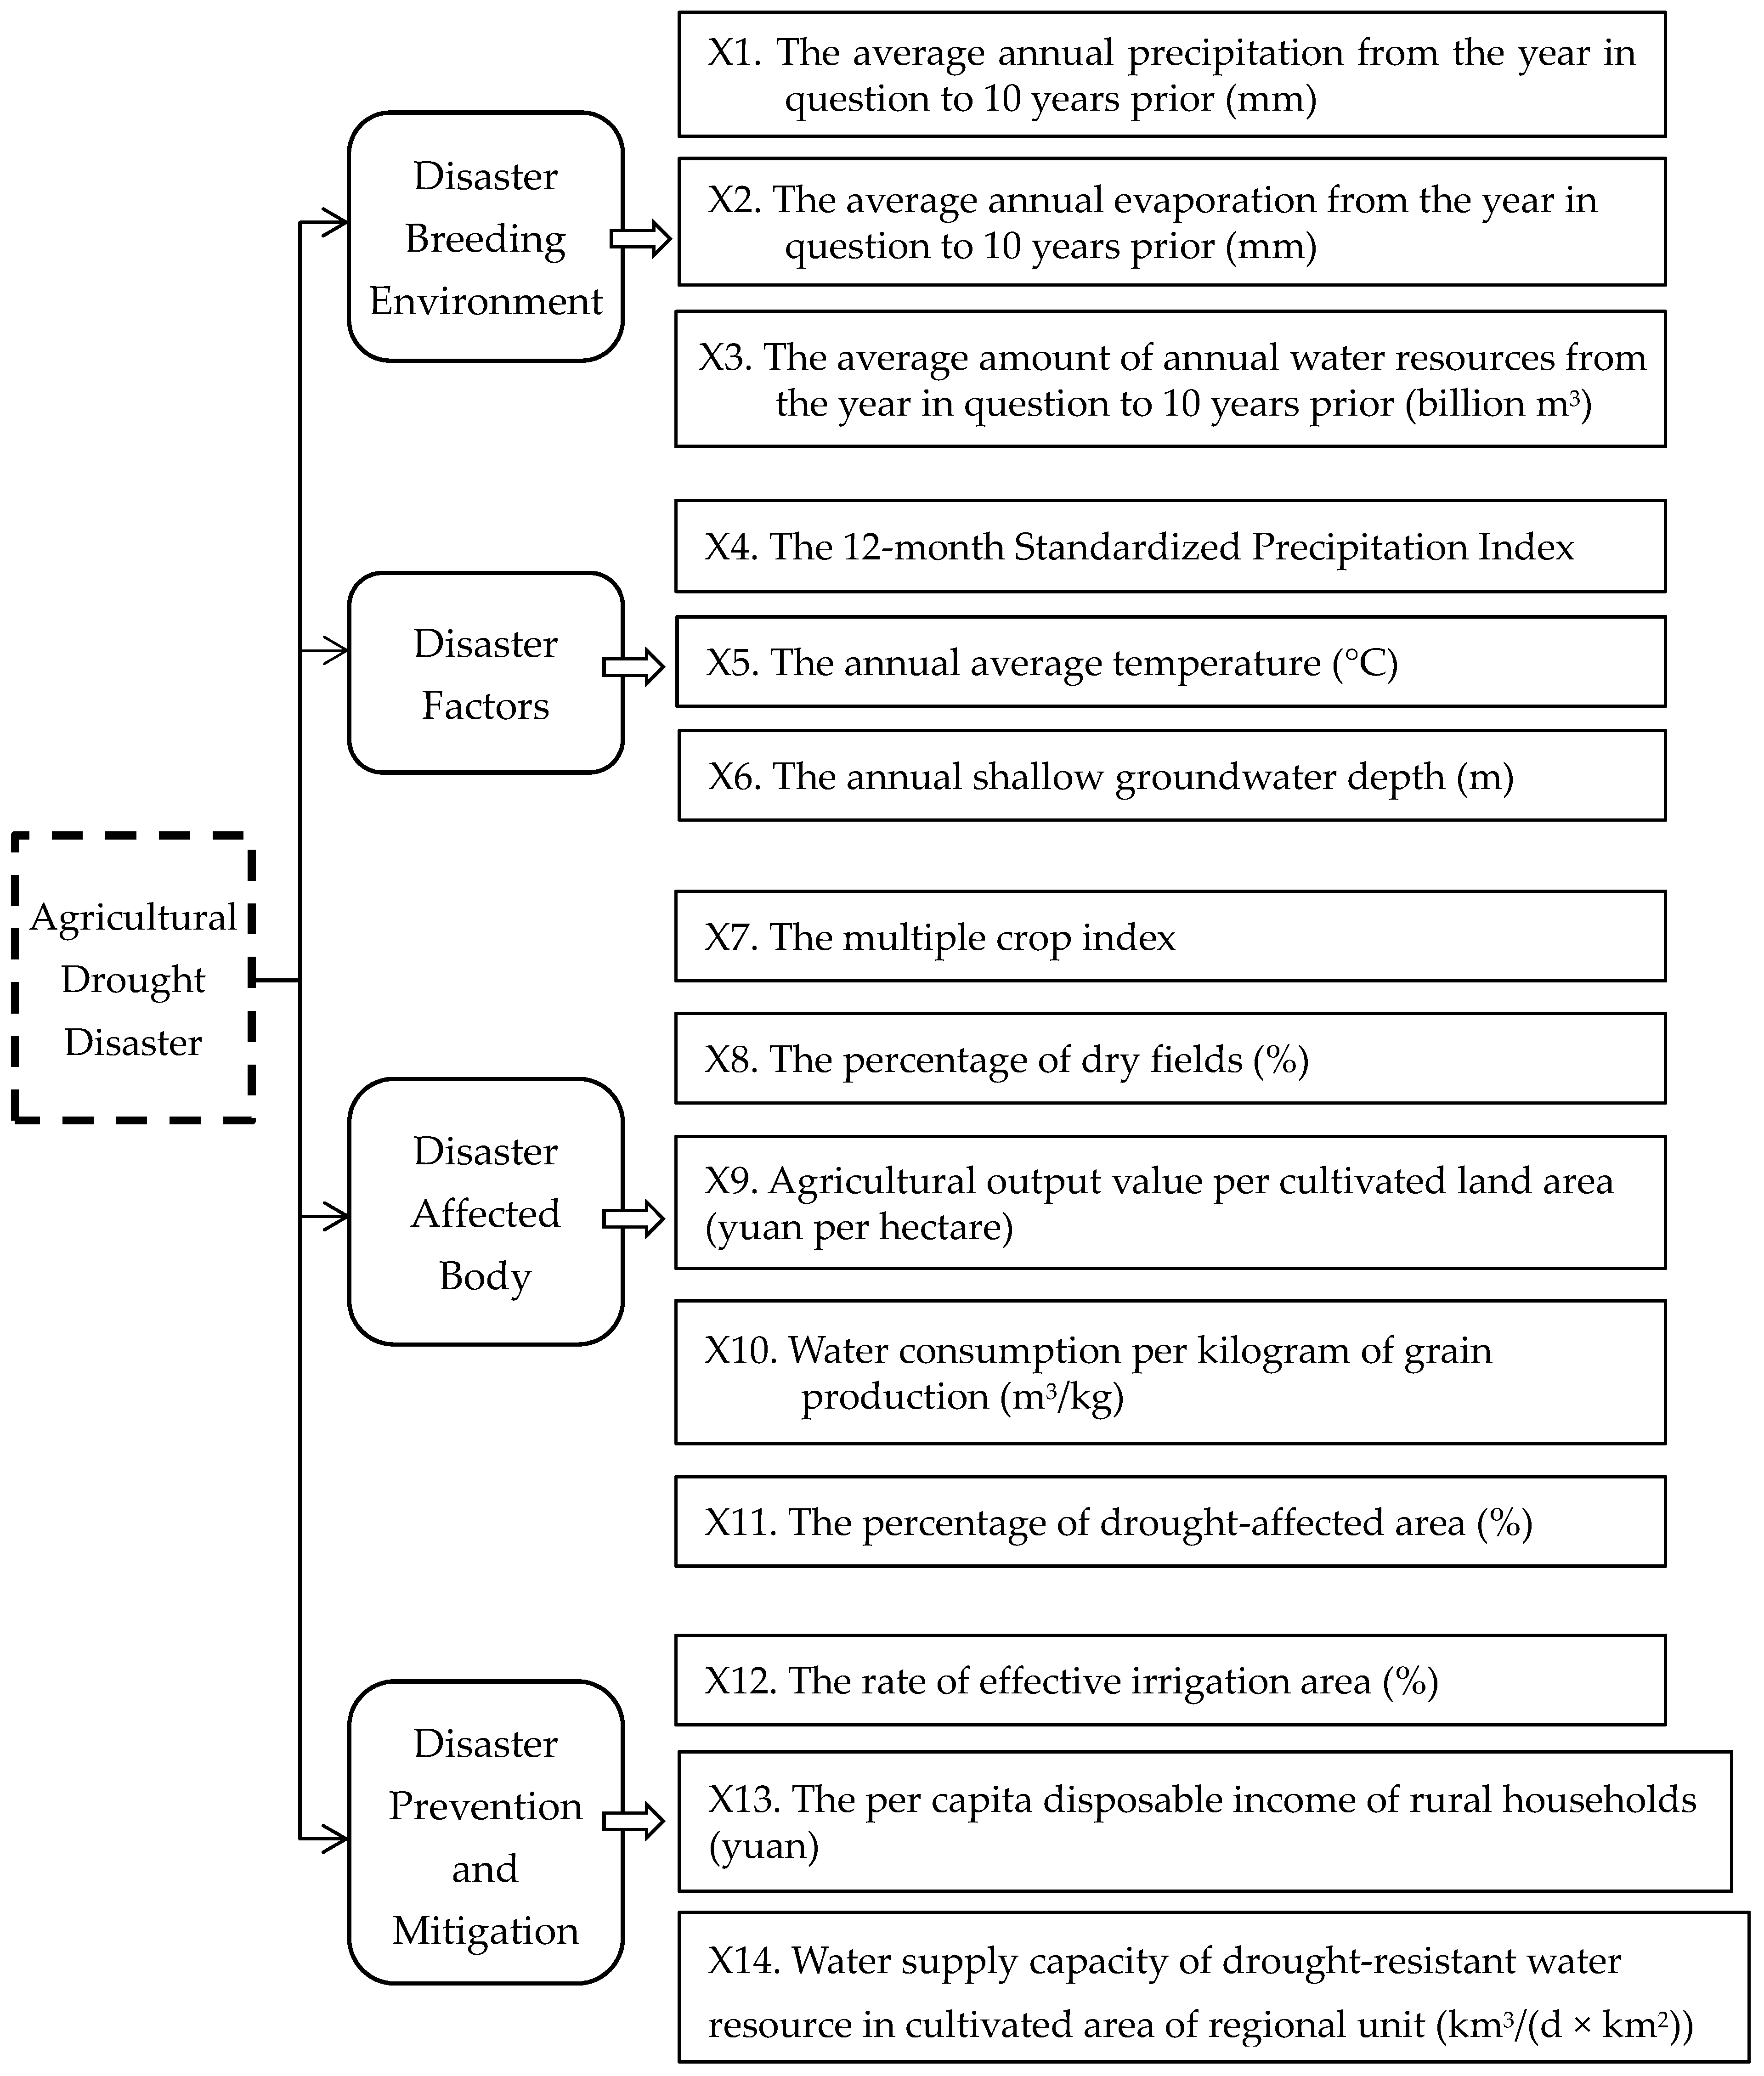
3.1. Development of an Evaluation Indicator System
- The disaster breeding environment, including precipitation, evaporation, and amount of water resources. It is the average value from the year in question to 10 years prior.
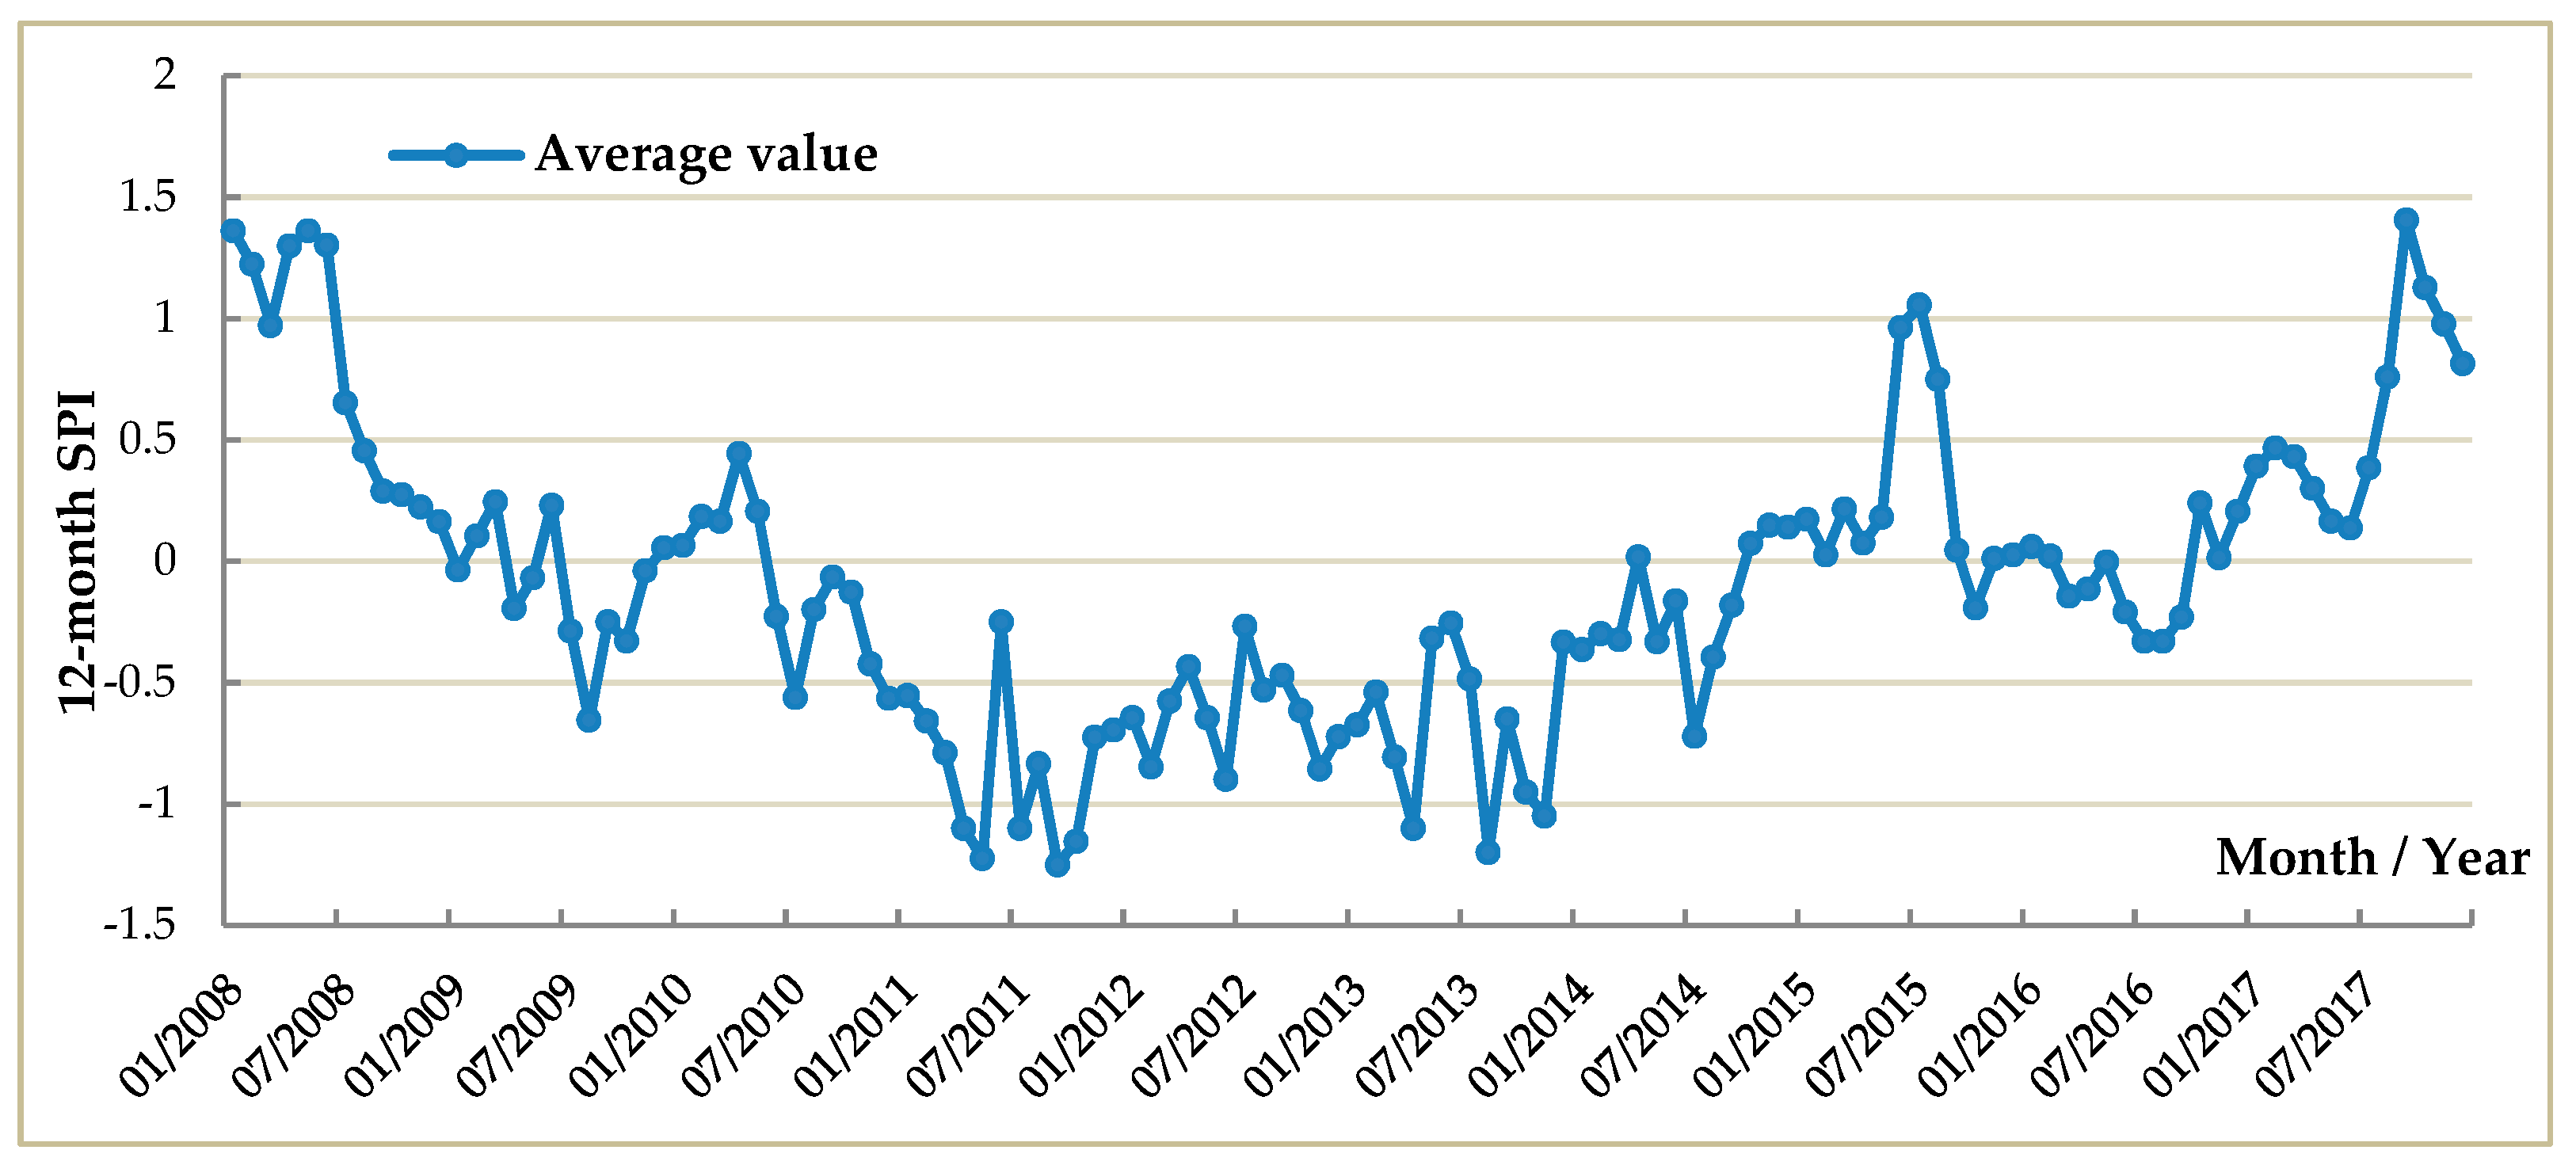
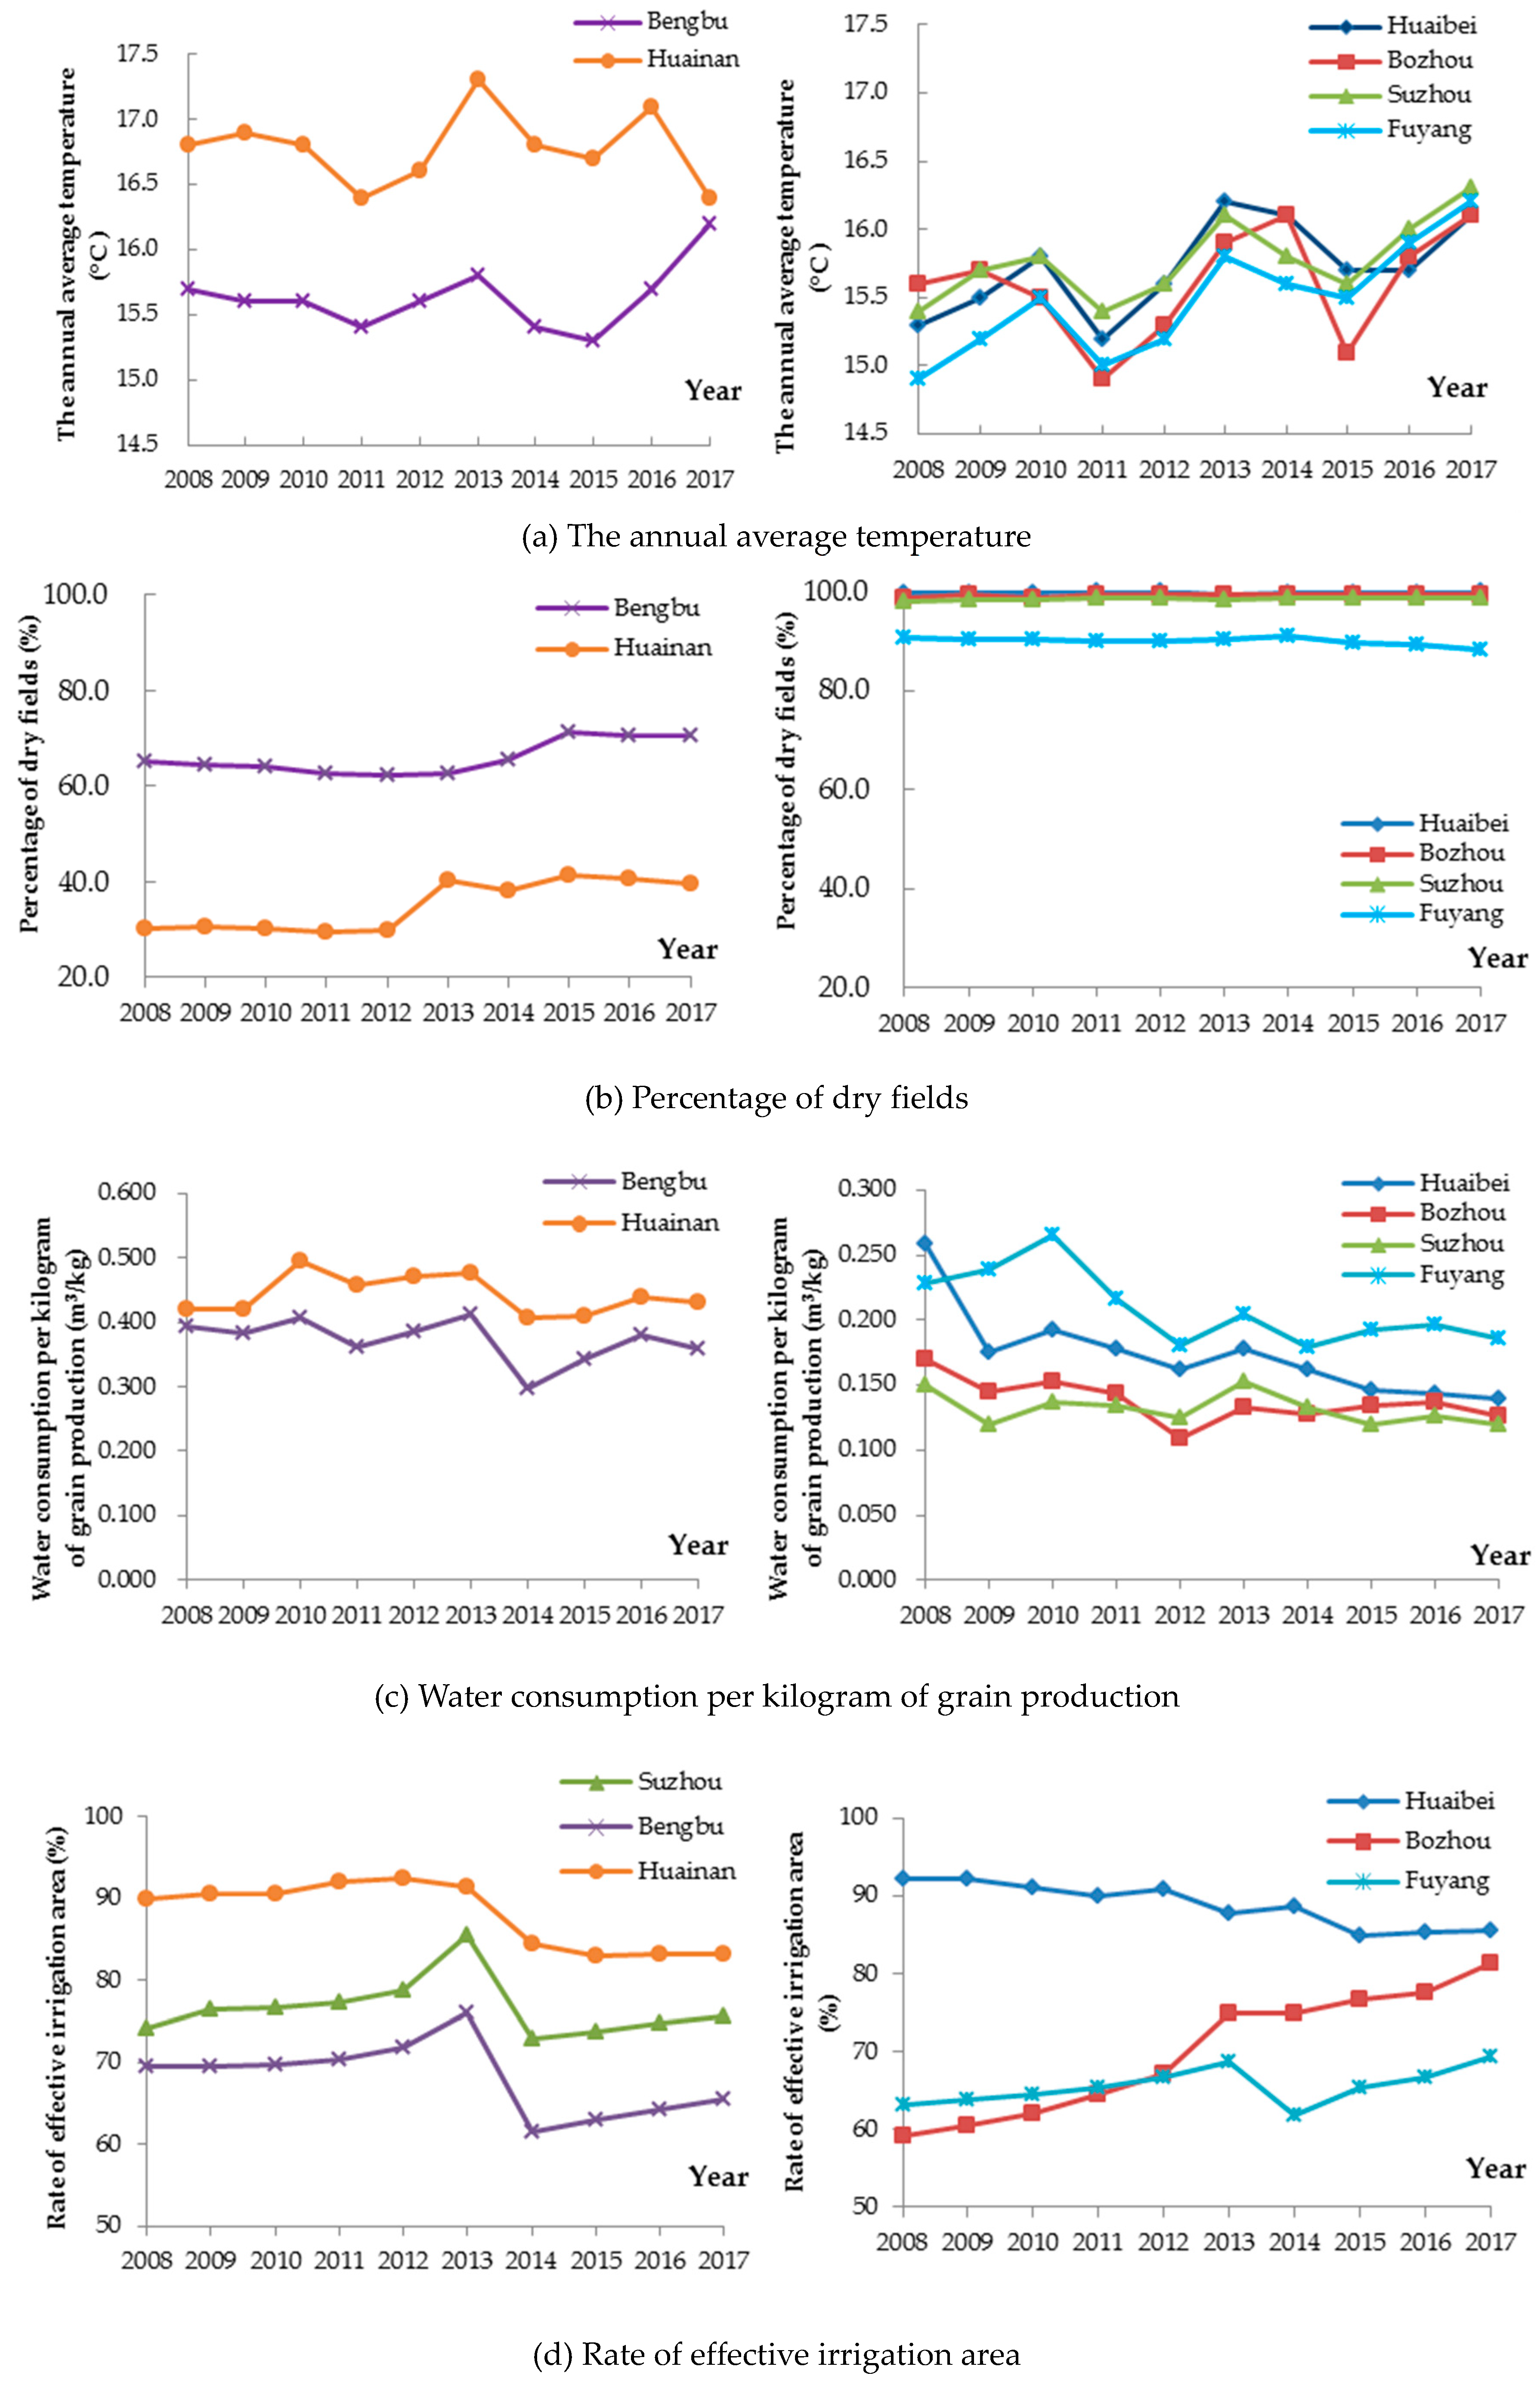
- The disaster factors, including annual average temperature and shallow groundwater depth. The 12-month Standardized Precipitation Index (SPI) was calculated using monthly rainfall data from 1983 to 2017 provided by the six national weather stations located in the six cities.
- The disaster affected body, including the area of grain planting, cultivated land, dry land, and drought-affected land, along with the value of agricultural production, agricultural water consumption, and total grain output.
- Disaster prevention and mitigation measures, including the area of effective irrigated land, per capita disposable income of rural households, and water supply capacity for drought-resistant water sources.
3.2. Evaluation Method
3.2.1. Determination of the Weight of the Agricultural Drought Evaluation Indicators
3.2.2. Assessment of Agricultural Drought Disaster
3.2.3. Risk Assessment of Agricultural Drought Disaster
4. Results
4.1. Weight Analysis of Evaluation Indicators of ADD of the Huaibei Plain in Anhui Province
4.2. Assessment of Agricultural Drought Disaster of the Huaibei Plain
4.3. Risk Assessment of Agricultural Drought Disaster for the Huaibei Plain
5. Discussion
6. Conclusions
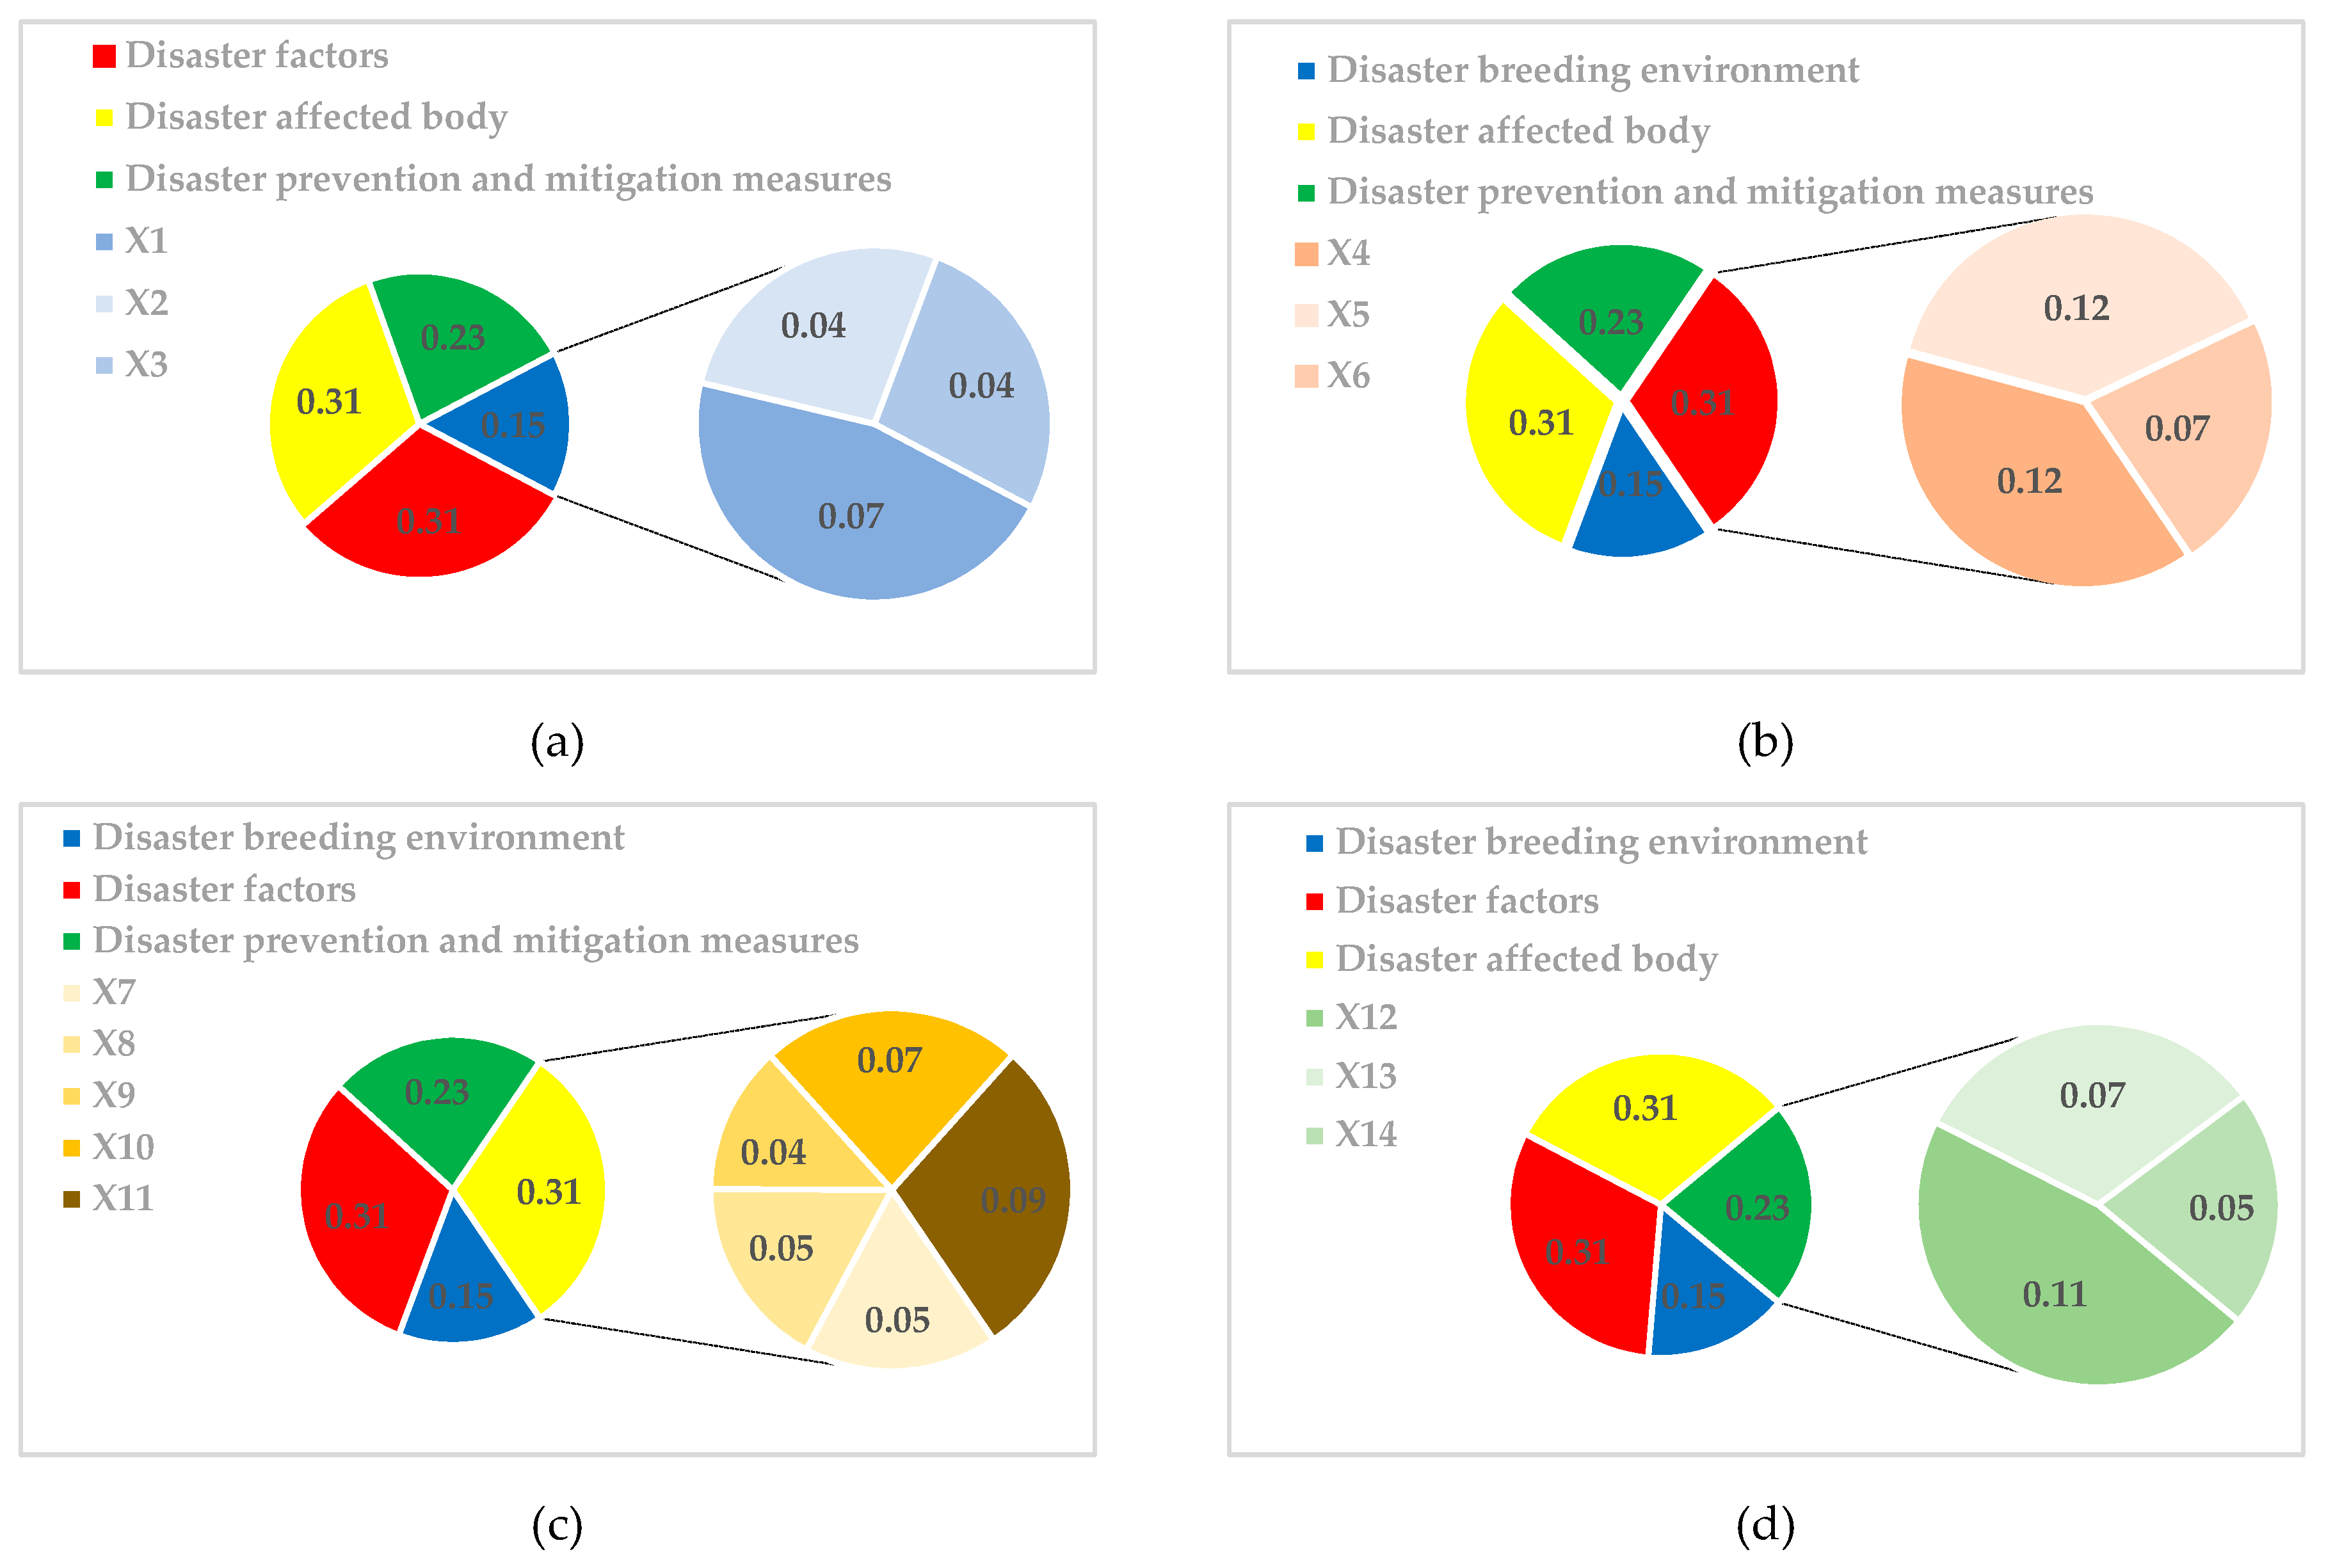
- Using weight analysis, the disaster factors and the disaster affected body were found to be key elements of the agricultural drought disaster system in small units such as the Huaibei Plain. It was also found that the average annual precipitation from the year in question to 10 years prior (X1), 12-month SPI (X4), the annual average temperature (X5), water consumption per kilogram of grain production (X10), percentage of drought-affected area (X11), and rate of effective irrigation area (X12) are more important than other indicators in their corresponding subsystems.
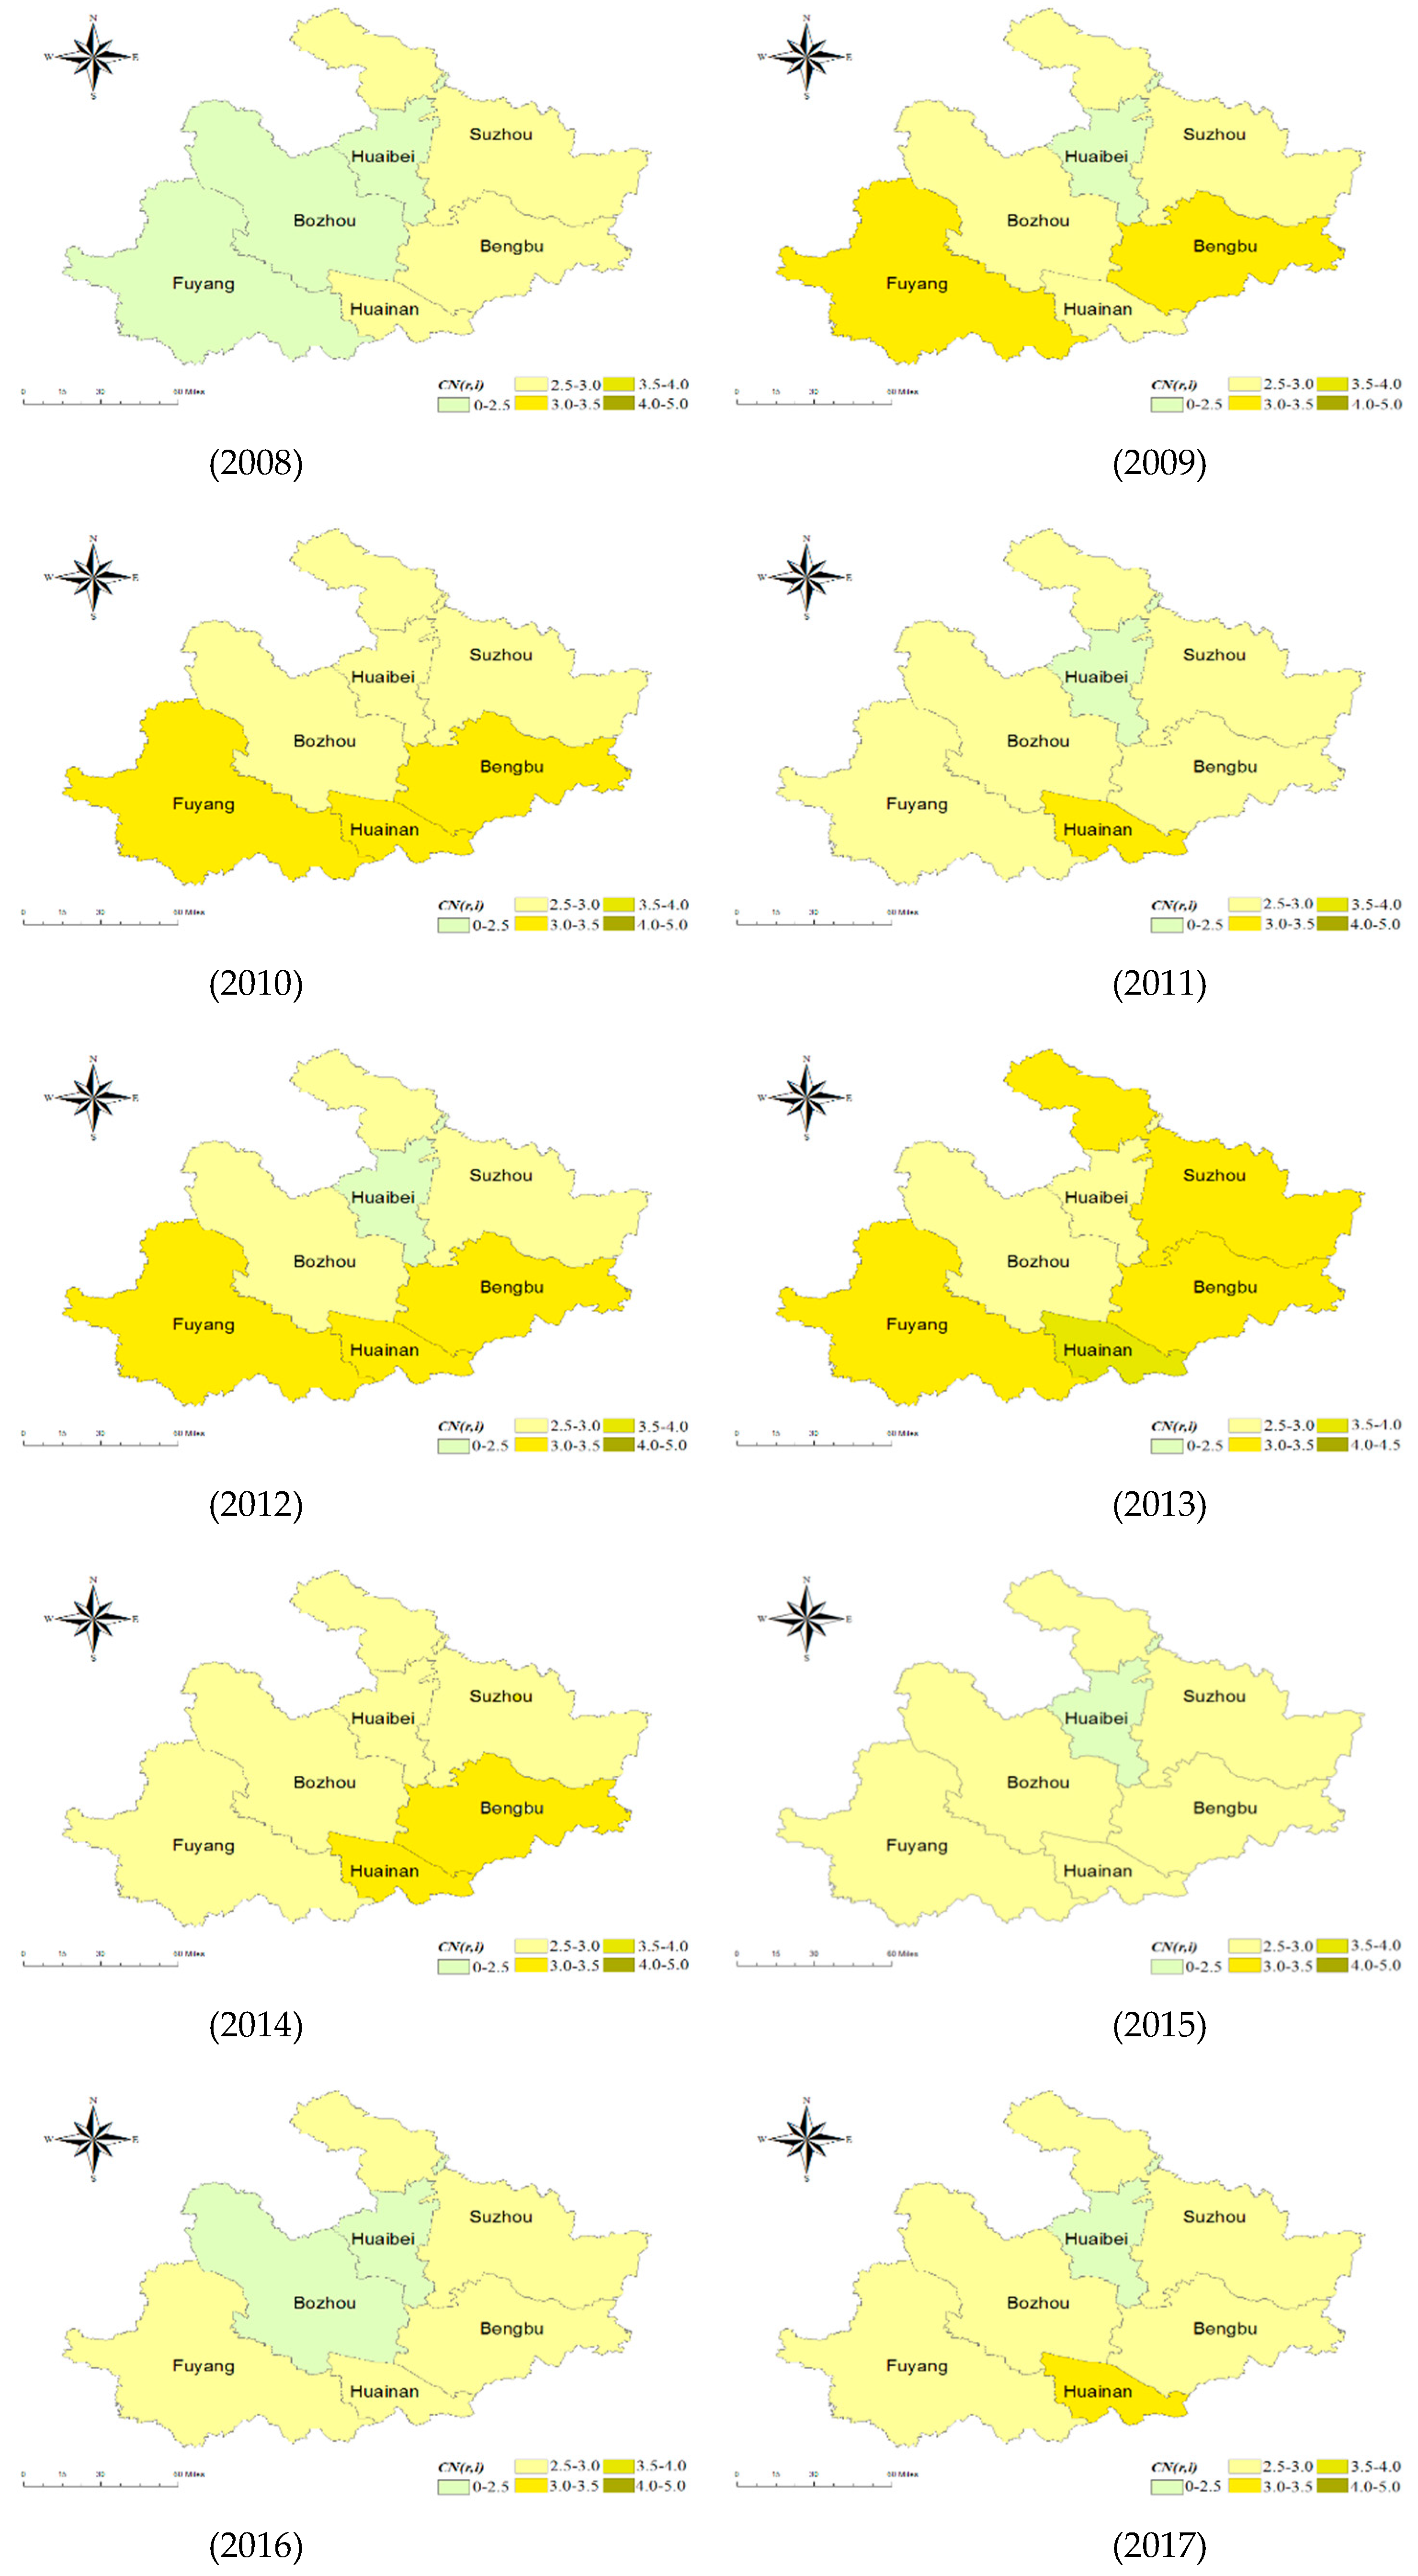
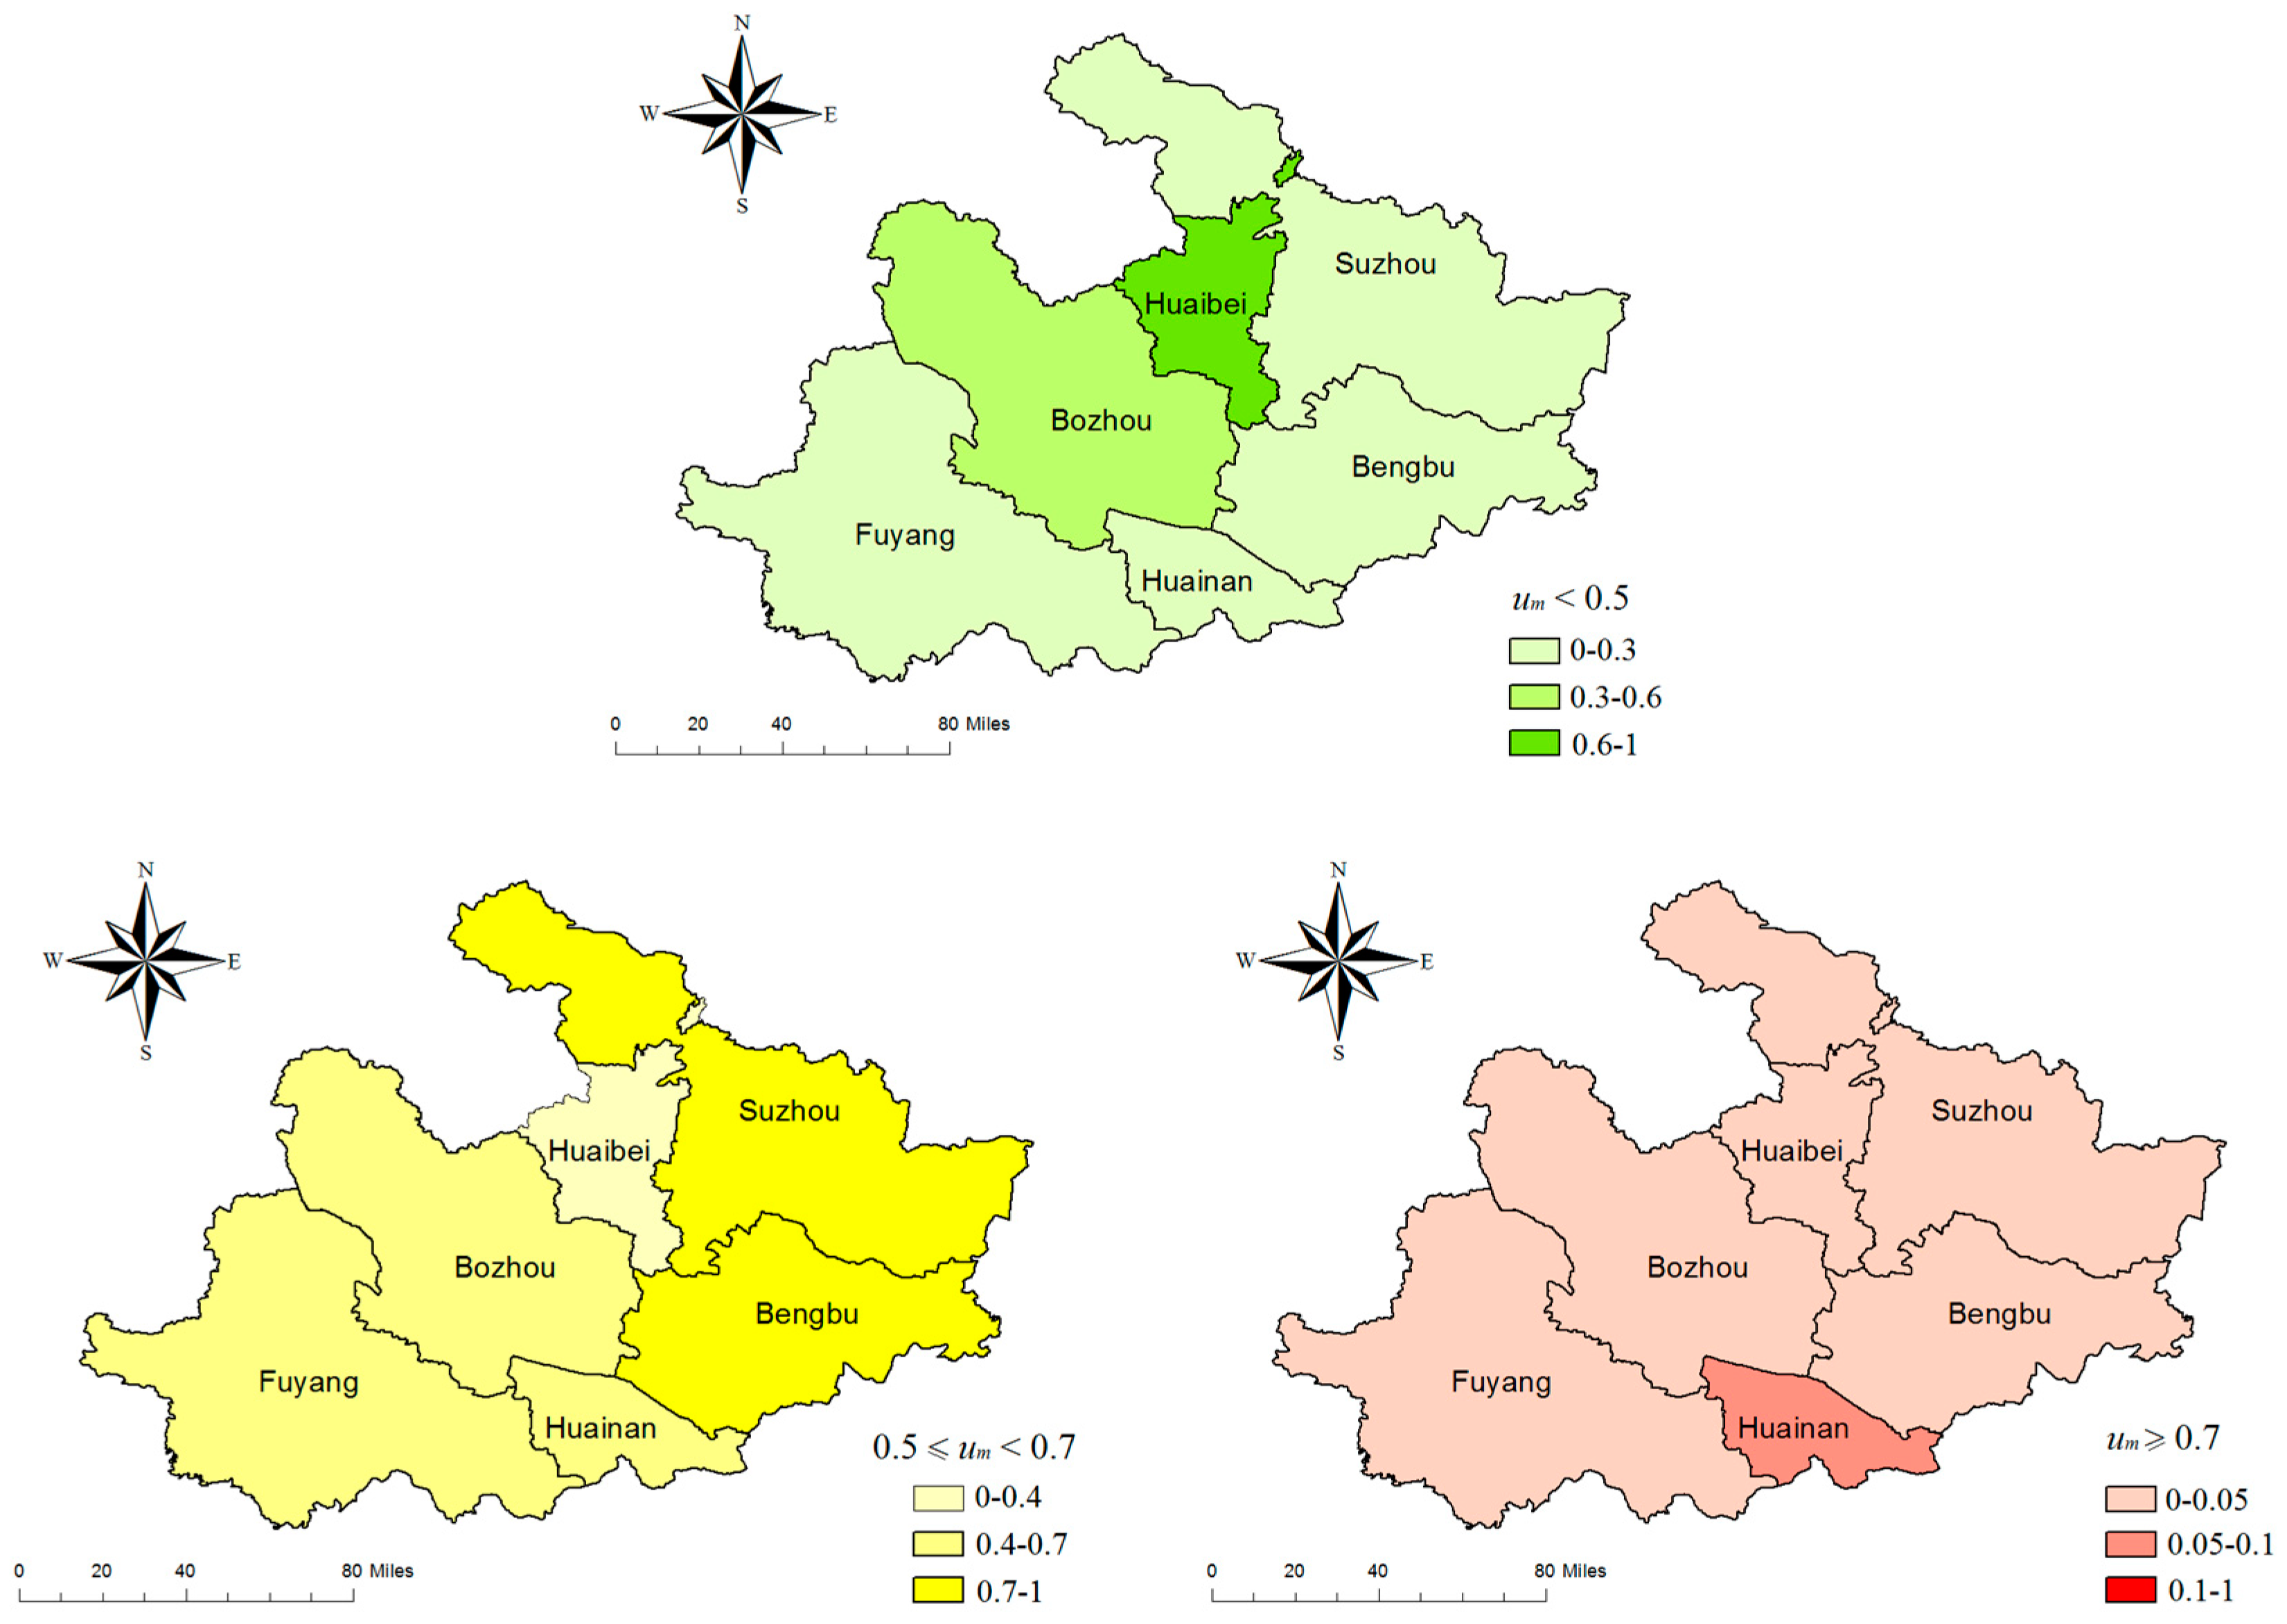
- Based on a comprehensive analysis of the connection numbers CN (r, i) for the Huaibei Plain from 2008 to 2017, five cities (except Huaibei) had a mild to moderate degree of ADD in the period assessed. The conditions during 2011–2013 were relatively serious, especially in 2013. The chance of ADD in the southern area, represented by Fuyang, Huainan, and Bengbu, was greater than in the northern area, represented by Bozhou and Huaibei. Furthermore, ADD in the southern region was more serious than in the north.
- The frequency of ADD for each city is mainly once every 1–3 years, and, with an increased agricultural drought disaster index value, the frequency is significantly reduced. The frequency of severe and above-grade ADD is once every 10–30 years. The risk of ADD for the Huaibei Plain is characterized by frequent, mainly mild to moderate risk, making prevention and control measures key for effective risk management of natural disasters in the future.
- The southern region of the study area was found to be nearly twice as likely to be struck by ADD as the northern region. Meanwhile, the eastern region has a higher frequency of severe and above-grade events than the western region. The frequency of ADD is once every 2.8 years for Huaibei, which is lower than the average value of the southern four cities. Huainan, in contrast, has a frequency of severe and above-grade ADD of once every 11 years. Based on the risk assessment results above, the cities of the Huaibei Plain were ranked from high to low risk as: Huainan > Bengbu > Suzhou > Fuyang > Bozhou > Huaibei.
- In this study, some suggestions were proposed for ADD prevention and mitigation based on the analysis of risk assessment results and the background of disaster formation. It is necessary for high-risk cities in the study area, such as Huainan and Bengbu, to improve the resilience of their agricultural systems in the future by optimizing planting structures and enhancing irrigation water efficiency. These results confirm overall that the proposed method is feasible and effective and that the results are reasonable.
Author Contributions
Funding
Conflicts of Interest
References
- Maybank, J.; Bonsal, B.; Jones, K.; Lawford, R.G.; O′Brien, E.G.; Ripley, E.A.; Wheaton, E. Drought as a natural disaster. Atmos. Ocean 1995, 33, 195–222. [Google Scholar] [CrossRef]
- Song, Y.L.; Elisabeth, S.; Chen, D.L.; Dong, W.J. Influence of Climate Change on Winter Wheat Growth in North China during 1950–2000. J. Meteorol. Res. 2005, 19, 501–510. [Google Scholar] [CrossRef]
- Ying, G.U.; Jing, N.L.; Jin, L. Analysis on characteristics and situation of drought disasters during past 60 years in China. Water Resour. Hydropower Eng. 2010, 41, 71–74. [Google Scholar] [CrossRef]
- Ye, T.; Shi, P.J.; Wang, J.A.; Liu, L.Y.; Fan, Y.D.; Hu, J.F. China′s drought disaster risk management: Perspective of severe droughts in 2009–2010. Int. J. Disaster Risk Sci. 2012, 3, 84–97. [Google Scholar] [CrossRef]
- Zhang, Q.; Han, L.Y.; Zhang, L.Y.; Wang, J.S. Analysis on the Character and Management Strategy of Drought Disaster and Risk under the Climatic Warming. Adv. Earth Sci. 2014, 29, 80–91. [Google Scholar]
- Motha, R.P. Disaster reduction planning and response: The example of national drought policy in USA. Nat. Disasters Extrem. Events Agric. 2005, 179–193. [Google Scholar] [CrossRef]
- Mishra, A.K.; Singh, V.P. A review of drought concepts. J. Hydrol. (Amst.) 2010, 391, 202–216. [Google Scholar] [CrossRef]
- Liu, L.; Liu, S.; Liu, P. Synthetic analysis and quantitative estimation of the agricultural vulnerability to drought disaster in Hunan province. J. Nat. Disasters 2002, 11, 78–83. [Google Scholar] [CrossRef]
- Qu, Y.P.; Gao, H.; Lü, J.; Su, Z.; Cheng, X.; Sun, H. Agricultural drought disaster risk assessment in China based on the regional disaster system theory. J. Hydraul. Eng. 2015, 46, 908–917. [Google Scholar] [CrossRef]
- Dalezios, N.R.; Blanta, A.; Spyropoulos, N.V.; Tarquis, A.M. Risk identification of agricultural drought for sustainable Agroecosystems. Nat. Hazards Earth Syst. Sci. 2014, 14, 2435–2448. [Google Scholar] [CrossRef]
- He, B.; Wu, J.; Lü, A.; Cui, X.; Zhou, L.; Liu, M.; Zhao, L. Quantitative assessment and spatial characteristic analysis of agricultural drought risk in China. Nat. Hazards 2012, 66, 155–166. [Google Scholar] [CrossRef]
- Krishna, V. Risk, vulnerability, and asset-based approach to disaster risk management. Int. J. Sociol. Soc. Policy 2004, 24, 1–48. [Google Scholar] [CrossRef]
- Xu, K.; Xu, X.Y.; Li, A.H.; Yang, D.W. Assessing agricultural drought disaster risk in Chengde city using stochastic method. Trans. Chin. Soc. Agric. Eng. 2013, 29, 139–146. [Google Scholar] [CrossRef]
- Potopová, V.; Štěpánek, P.; Možný, M.; Türkott, L.; Soukup, J. Performance of the standardised precipitation evapotranspiration index at various lags for agricultural drought risk assessment in the Czech Republic. Agric. For. Meteorol. 2015, 202, 26–38. [Google Scholar] [CrossRef]
- Qu, Y.P.; Sun, H.Q.; Su, Z.C. Dynamic assessment of agricultural drought disasters risk based on crop growth model. Agric. Res. Arid Areas 2013, 31, 231–236. [Google Scholar]
- Sun, Z.Y.; Zhang, J.Q.; Yan, D.H.; Wu, L.; Guo, E.L. The impact of irrigation water supply rate on agricultural drought disaster risk: A case about maize based on EPIC in Baicheng City, China. Nat. Hazards 2015, 78, 23–40. [Google Scholar] [CrossRef]
- Zhao, H.Y.; Gao, G.; Yan, X.D.; Zhang, Q. Risk assessment of agricultural drought using the CERES-Wheat model: A case study of Henan plain, China. Clim. Res. 2011, 50, 247–256. [Google Scholar] [CrossRef]
- Huang, C.F.; Liu, X.L.; Zhou, G.X.; Li, X.J. Agricultural natural disaster risk assessment method according to the historic disaster data. J. Nat. Disasters 1998, 7, 1–9. [Google Scholar]
- Feng, L.H.; Luo, G.Y. Flood risk analysis based on information diffusion theory. Hum. Ecol. Risk Assess. 2008, 14, 1330–1337. [Google Scholar] [CrossRef]
- Liu, J.F.; Li, S.; Wu, J.; Liu, X.J.; Zhang, J.Q. Research of influence of sample size on normal information diffusion based on the Monte Carlo method: Risk assessment for natural disasters. Environ. Earth Sci. 2018, 77, 480. [Google Scholar] [CrossRef]
- Li, M.G.; Zhou, C.S.; Lian, L. Agricultural flood and drought risk Assessment in China based on entropy information diffusion theory. J. Nat. Resour. 2017, 32, 620–631. [Google Scholar] [CrossRef]
- Yu, X.B.; Yu, X.R.; Ji, Z.H.; Lu, Y.Q. Risk assessment of typhoon disaster in China′s South-East coastal areas-based on information diffusion theory. J. Catastr. 2019, 34, 73–77. [Google Scholar] [CrossRef]
- Chen, M.L.; Ning, S.W.; Cui, Y.; Jin, J.L.; Zhou, Y.L.; Wu, C.G. Quantitative Assessment and Diagnosis for Regional Agricultural Drought Resilience Based on Set Pair Analysis and Connection Entropy. Entropy 2019, 21, 373. [Google Scholar] [CrossRef]
- Anhui Municipal Bureau of Statistics. Anhui Statistical Yearbook, 2009–2018; China Statistics Press: Beijing, China, 2018.
- Department of Water Resources of Anhui Province. Anhui Water Resources Bulletin, 2008–2017; China Water & Power Press: Beijing, China, 2017.
- Cui, Y.; Feng, P.; Jin, J.L.; Liu, L. Water resources carrying capacity evaluation and diagnosis based on set pair analysis and improved the entropy weight method. Entropy 2018, 20, 359. [Google Scholar] [CrossRef]
- Lu, Y.J. Weight calculation method of fuzzy analytical hierarchy process. Fuzzy Syst. Math. 2002, 16, 79–85. [Google Scholar]
- Song, G.X.; Yang, D.L. Methods for identifying and improving the consistency of fuzzy judgment matrix. Syst. Eng. 2003, 21, 110–116. [Google Scholar]
- Jin, J.L.; Wu, K.Y.; Li, R.Z. Region water security evaluation method based on information entropy and improved fuzzy analytic hierarchy process. J. Hydroelectr. Eng. 2007, 26, 61–66. [Google Scholar]
- Zhao, K.Q. Set Pair Analysis and its Preliminary Application; Zhejiang Science and Technology Press: Hangzhou, China, 2000; pp. 1–180. [Google Scholar]
- Liu, P.J.; Zhao, Z.L.; Yan, X. Grey relational analysis on the effects of rainfall factors on runoff and sediment in the sloping farmland with different plants in the central south of Shandong province. Meteorol. Environ. Res. 2011, 2, 52–55. [Google Scholar]
- Kose, E.; Burmaoglu, S.; Kabak, M. Grey relational analysis between energy consumption and economic growth. Grey Syst. Theory Appl. 2013, 3, 291–304. [Google Scholar] [CrossRef]
- Yu, H.; Zhang, K. The application of grey relational analysis model in the performance evaluation of agricultural product logistics companies. Appl. Mech. Mater. 2014, 687, 5165–5168. [Google Scholar] [CrossRef]
- Jin, J.L.; Fu, J.; Wei, Y.M.; Jiang, S.M.; Zhou, Y.L.; Liu, L.; Wang, Y.Z.; Wu, C.G. Integrated risk assessment method of waterlog disaster in Huaihe River Basin of China. Nat. Hazards 2015, 75, 155–178. [Google Scholar] [CrossRef]
- Hao, L.; Zhang, X.; Liu, S. Risk assessment to China’s agricultural drought disaster in county unit. Nat. Hazards 2011, 61, 785–801. [Google Scholar] [CrossRef]
- Liu, Y.Q.; You, M.; Zhu, J.L.; Wang, F.; Ran, R.P. Integrated risk assessment for agricultural drought and flood disasters based on entropy information diffusion theory in the middle and lower reaches of the Yangtze River, China. Int. J. Disaster Risk Reduct. 2019, 38, 1–14. [Google Scholar] [CrossRef]
- Kaplan, S.; Garrick, B.J. On the quantitative definition of risk. Risk Anal. 1981, 1, 11–27. [Google Scholar] [CrossRef]
- Jin, J.L.; Li, J.Q.; Zhou, Y.L.; Fei, Z.Y.; Jiang, S.M.; Yuan, X.C.; He, J. Theoretical framework of drought risk assessment. J. Catastr. 2014, 29, 1–10. [Google Scholar] [CrossRef]
- He, B.; Wu, J.J.; Lu, A.F. New advances in agricultural drought risk study. Prog. Geogr. 2010, 29, 557–564. [Google Scholar]


| Evaluation Indicator | Connection Numbers | Agricultural Drought Disaster Index | Agricultural Drought Disaster |
|---|---|---|---|
| g | CN (r, i) | si | |
| 1 | [0, 2.5] | [0, 0.5] | No drought |
| 2 | (2.5, 3] | (0.5, 0.6] | Grade I (mild drought) |
| 3 | (3, 3.5] | (0.6, 0.7] | Grade II (moderate drought) |
| 4 | (3.5, 4] | (0.7, 0.8] | Grade III (severe drought) |
| 5 | [4, 5] | [0.8, 1] | Grade IV (extremely severe drought) |
| Huaibei | Bozhou | Suzhou | Bengbu | Fuyang | Huainan | |
|---|---|---|---|---|---|---|
| u*r(i, 1) | 0.317 | 0.186 | 0.146 | 0.156 | 0.189 | 0.069 |
| u*r(i, 2) | 0.306 | 0.253 | 0.223 | 0.234 | 0.234 | 0.200 |
| u*r(i, 3) | 0.183 | 0.236 | 0.269 | 0.263 | 0.226 | 0.323 |
| u*r(i, 4) | 0.125 | 0.202 | 0.248 | 0.234 | 0.227 | 0.224 |
| u*r(i, 5) | 0.069 | 0.123 | 0.113 | 0.114 | 0.125 | 0.184 |
| si | City | um | ||||||||||
|---|---|---|---|---|---|---|---|---|---|---|---|---|
| 0.5 | 0.52 | 0.54 | 0.56 | 0.58 | 0.6 | 0.62 | 0.64 | 0.66 | 0.68 | 0.7 | ||
| Year return | Huaibei | 2.8a | 2.9a | 2.9a | 3.2a | 4.0a | 5.2a | 6.4a | 8.1a | 14.4a | 18.5a | 30.4a |
| Bozhou | 1.8a | 1.8a | 1.9a | 2.1a | 2.3a | 2.5a | 3.4a | 6.2a | 12.4a | 14.7a | 25.8a | |
| Suzhou | 1.2a | 1.3a | 1.5a | 1.7a | 1.9a | 2.3a | 2.9a | 5.1a | 11.0a | 13.0a | 21.3a | |
| Bengbu | 1.2a | 1.2a | 1.4a | 1.5a | 1.6a | 1.9a | 2.7a | 4.2a | 8.2a | 11.0a | 20.7a | |
| Fuyang | 1.4a | 1.5a | 1.7a | 1.9a | 2.1a | 2.7a | 3.6a | 6.2a | 12.8a | 14.5a | 24.8a | |
| Huainan | 1.1a | 1.1a | 1.1a | 1.2a | 1.3a | 1.5a | 1.8a | 2.2a | 3.8a | 5.0a | 9.8a | |
| Average | 1.6a | 1.6a | 1.8a | 1.9a | 2.2a | 2.7a | 3.5a | 5.3a | 10.3a | 12.8a | 22.1a | |
© 2020 by the authors. Licensee MDPI, Basel, Switzerland. This article is an open access article distributed under the terms and conditions of the Creative Commons Attribution (CC BY) license (http://creativecommons.org/licenses/by/4.0/).
Share and Cite
Chen, M.; Ning, S.; Jin, J.; Cui, Y.; Wu, C.; Zhou, Y. Risk Assessment of Agricultural Drought Disaster on the Huaibei Plain of China Based on the Improved Connection Number and Entropy Information Diffusion Method. Water 2020, 12, 1089. https://doi.org/10.3390/w12041089
Chen M, Ning S, Jin J, Cui Y, Wu C, Zhou Y. Risk Assessment of Agricultural Drought Disaster on the Huaibei Plain of China Based on the Improved Connection Number and Entropy Information Diffusion Method. Water. 2020; 12(4):1089. https://doi.org/10.3390/w12041089
Chicago/Turabian StyleChen, Menglu, Shaowei Ning, Juliang Jin, Yi Cui, Chengguo Wu, and Yuliang Zhou. 2020. "Risk Assessment of Agricultural Drought Disaster on the Huaibei Plain of China Based on the Improved Connection Number and Entropy Information Diffusion Method" Water 12, no. 4: 1089. https://doi.org/10.3390/w12041089
APA StyleChen, M., Ning, S., Jin, J., Cui, Y., Wu, C., & Zhou, Y. (2020). Risk Assessment of Agricultural Drought Disaster on the Huaibei Plain of China Based on the Improved Connection Number and Entropy Information Diffusion Method. Water, 12(4), 1089. https://doi.org/10.3390/w12041089