Article

The Response of Groundwater Level to Climate Change and Human Activities in Baotou City, China

1
State Key Laboratory of Simulation and Regulation of Water Cycle in River Basin, Department of Water Resources for Pastoral Area, China Institute of Water Resources and Hydropower Research, Hohhot 010020, China
2
Power China Beijing Engineering Corporation Limited, Beijing 100024, China
*
Author to whom correspondence should be addressed.
Water 2020, 12(4), 1078; https://doi.org/10.3390/w12041078
Submission received: 18 March 2020 / Revised: 1 April 2020 / Accepted: 8 April 2020 / Published: 10 April 2020
(This article belongs to the Special Issue Climate Change Impacts on Water Resources)

Abstract

:
The response mechanism of groundwater to climate change and human activities in cities within arid and semi-arid regions, such as the Urban Planning Area of Baotou City (UPABC), northern China, is a complicated problem to understand. We analyzed the climate change relationships, including precipitation and temperature, and analyzed changes in human activities, such as groundwater consumption, and then statistically analyzed the main factors affecting groundwater depth. Furthermore, cross-wavelet and wavelet coherence methods were used to analyze the response relationship and hysteresis of groundwater depth to precipitation to better understand the groundwater depth response law. The results showed that the annual precipitation in the UPABC reduction rate was 3.3 mm/10 yr, and the annual average temperature increase rate was 0.43 °C/10 yr, from 1981 to 2017. The unconfined water decrease rate was 0.50 m/yr, and the confined water decrease rate was 0.7 m/yr. The unconfined and confined water depths were affected by precipitation and groundwater exploitation, respectively, with correlation coefficients of 0.58 and 0.57, respectively. The hysteresis of groundwater depth to precipitation was about 9–14 months. However, changes in groundwater depth, especially confined water depth, were greatly affected by groundwater exploitation. This reflected the imbalance in consumption and recharges in the UPABC, highlighting the long-term risk in areas relying on access to this resource. Therefore, arid inland zones of northern China, such as the UPABC, should pay more attention to the rational development of groundwater and strengthen the management and protection of groundwater resources.

1. Introduction

Groundwater is an almost ubiquitous source of generally high-quality freshwater. These characteristics have promoted its widespread exploitation and utilization, which can be scaled and localized to demand, removing the need for substantial infrastructure [1]. Globally, groundwater is the source of one-third of all freshwater exploitation, supplying an estimated 36%, 42%, and 27% of the water used for domestic, agricultural, and industrial purposes, respectively [2]. In recent decades, the increasing use of groundwater for human consumption and irrigation has resulted in the lowering of groundwater levels in large parts of the world [3,4,5]. Surface water resources are scarce in arid and semi-arid regions, and, therefore, groundwater resources are particularly valuable [6,7]. Huang et al. (2012) found that the total depletion of groundwater in sub-humid to arid regions in an area of the Loess Plateau of China had increased from 126 km3·year−1 in 1960 to 283 km3·year−1 in 2000 [8].
The Intergovernmental Panel on Climate Change (IPCC) estimates that the global mean surface temperature has increased 0.6 ± 0.2 °C since 1861 and predicts an increase of 2–4 °C over the next 100 years [9]. Research on the impact of climate change began in the 1970s and drew attention from the international hydrology community until the 1980s. With the occurrence of extreme climates, such as drought, floods, high-temperature heat waves, and cold damage, scientists have gradually become aware of the importance of the influence of climate change on water resources and have focused on its impact on the water cycle [10,11,12]. As a “hidden resource”, it is more complicated to establish or demonstrate the impact of climate change and climate variability for groundwater than for surface water [13]. For example, groundwater residence times can range from days to tens of thousands of years, which delays and disperses the effects of climate and challenges efforts to detect responses in the groundwater to climate variability and change [14]. Renewable groundwater is directly tied to near-surface hydrological processes and is, thus, intricately tied to the overall hydrological cycle, and thus could be directly affected by climatic change [15]. However, nonrenewable groundwater supplies are usually derived from deep earth sediments deposited long ago and, therefore, have little climatic linkage [16]. In Tokyo, Japan, Green et al. [17] observed a 3 °C temperature increase in shallow aquifers to a depth of 20 m because of the warming of ground surfaces and increased urbanization. Several studies relating to the effect of climate change on surface water bodies and groundwater in the entire basin have been undertaken, but there has been little research on the potential effects of climate change on groundwater in the city in arid and semi-arid regions [6,7,9,10,12,18], even though groundwater is the major source of drinking water across much of the world and plays a vital role in maintaining the ecological value of an area.
Climate variability and change influence groundwater systems both directly through replenishment by recharge and indirectly through changes in groundwater use [19,20,21]. These impacts can be further modified by human activities, such as land-use change. Groundwater levels are among the most fundamental and critical baseline data that underpin the understanding of groundwater systems. They are used to infer groundwater flow patterns and aquifer inter-connectivity. The response of groundwater levels to precipitation is an important indicator to study the connectivity between surface water and groundwater systems [22,23,24]. Besides, groundwater levels (together with the steady flow) are the most typical observations used to calibrate numerical groundwater models [25].
Many studies have analyzed groundwater dynamics using various methods and explored the relationships between rainfall and groundwater levels [26,27]. Some of these have involved the use of satellite data [28,29]. However, the study on the dynamic evolution mechanism of groundwater in arid and semi-arid regions, especially in urban planning areas, is relatively rare. In these regions, groundwater is an essential water resource for environmental protection [30,31], and the groundwater-dependent ecosystems are mainly distributed in areas in which water can be extracted by natural plants from aquifers or the capillary fringe above the water table [32,33]. Because of population concentration and economic and social development, groundwater is the best resource in the context of a decline in both quantity and quality of domestic surface water in urban planning areas in arid and semi-arid regions [34]. However, with the development of human society, the dependence of water resources, especially groundwater resources, has increased. It is important to determine whether groundwater resources can be used as sustainable water resources for long-term use. This requires a study of whether groundwater consumption and recharge are balanced. Groundwater depth is an important indicator, and its dynamic changes and its response to climate change and human activities are crucial for addressing the above problems. Therefore, the groundwater table depth is one of the most important parameters in the study of groundwater management [35] and is often used as an important indicator of groundwater withdrawal control in urban planning areas in arid and semiarid regions [36].
However, water table dynamics and the relationship between groundwater and climate and human activities in urban planning areas in arid and semiarid regions have not yet been extensively studied. As a result, the mechanisms of the water cycle and water safety and the long-term risk in areas relying on access to this resource in cities in arid regions have not received much attention. This paper examined the dynamics of urban groundwater in arid areas to identify the main influencing factors of groundwater levels on water safety in Baotou City, northern China and proposed some improvement measures to ensure the sustainable use of water resources in arid areas. As a city in an arid area where surface water is scarce and groundwater resources are over-relied on, the sustainable use of groundwater in Baotou is not only related to the development of the city but also to the protection of the ecologically fragile grassland of the surrounding areas. In recent years, some rivers in the Urban Planning Area of Baotou City (UPABC) have almost dried out because of the construction of water conservancy projects upstream and declining groundwater levels [37]. The main objectives of this study were to determine the typical patterns of the groundwater level and temperature variations in the UPABC and to delineate the main factors that influence each pattern of groundwater dynamics in ecologically fragile grassland in arid and semi-arid areas. This study would provide an important insight into the hydrological processes that control the groundwater dynamics in cities in the arid region and ecologically fragile grassland, a location where monitoring data are limited. These results could be used as a reference for the sustainable utilization and management of groundwater resources in the UPABC.

2. Materials and Methods

2.1. Study Area

The UPABC (109°15′–110°26′ E, 40°15′–42°43′ N) is located in the southwestern part of Baotou City, northern China (Figure 1). It is distributed in a narrow east–west strip. It faces the Yellow River in the south, with the Ordos located across the river. The total area of the UPABC is 1901 km2, accounting for less than one-tenth of the total area of the city, but it contains almost all major transportation hubs, economic resources, and educational resources for Baotou City.
The UPABC belongs to semi-arid (also known as grassland type) continental monsoon climate, with four distinct seasons (cold winter, warm summer, and a dry spring and autumn), and the mean temperature difference of 34.4 °C within the year (maximum temperature in July, 39.2 °C; lowest temperature, −31.4 °C in January, average annual temperature 2–10 °C). Precipitation is scarce in the UPABC with an average annual rainfall of 305 mm, and precipitation from July to September accounts for 66% of the annual precipitation. The maximum and minimum precipitation over the studied period (1981–2017) is 465.2 and 161.2 mm, respectively. The area is becoming increasingly dry, with a large amount of evaporation. The average annual evaporation is 2273.8 mm, which is mostly concentrated in May–June; the frost-free period is 130–140 days; the average wind speed is 3.2 m/s, and the maximum wind speed is 22.3 m/s. There has been an increase in dust storms in recent years (Table 1).
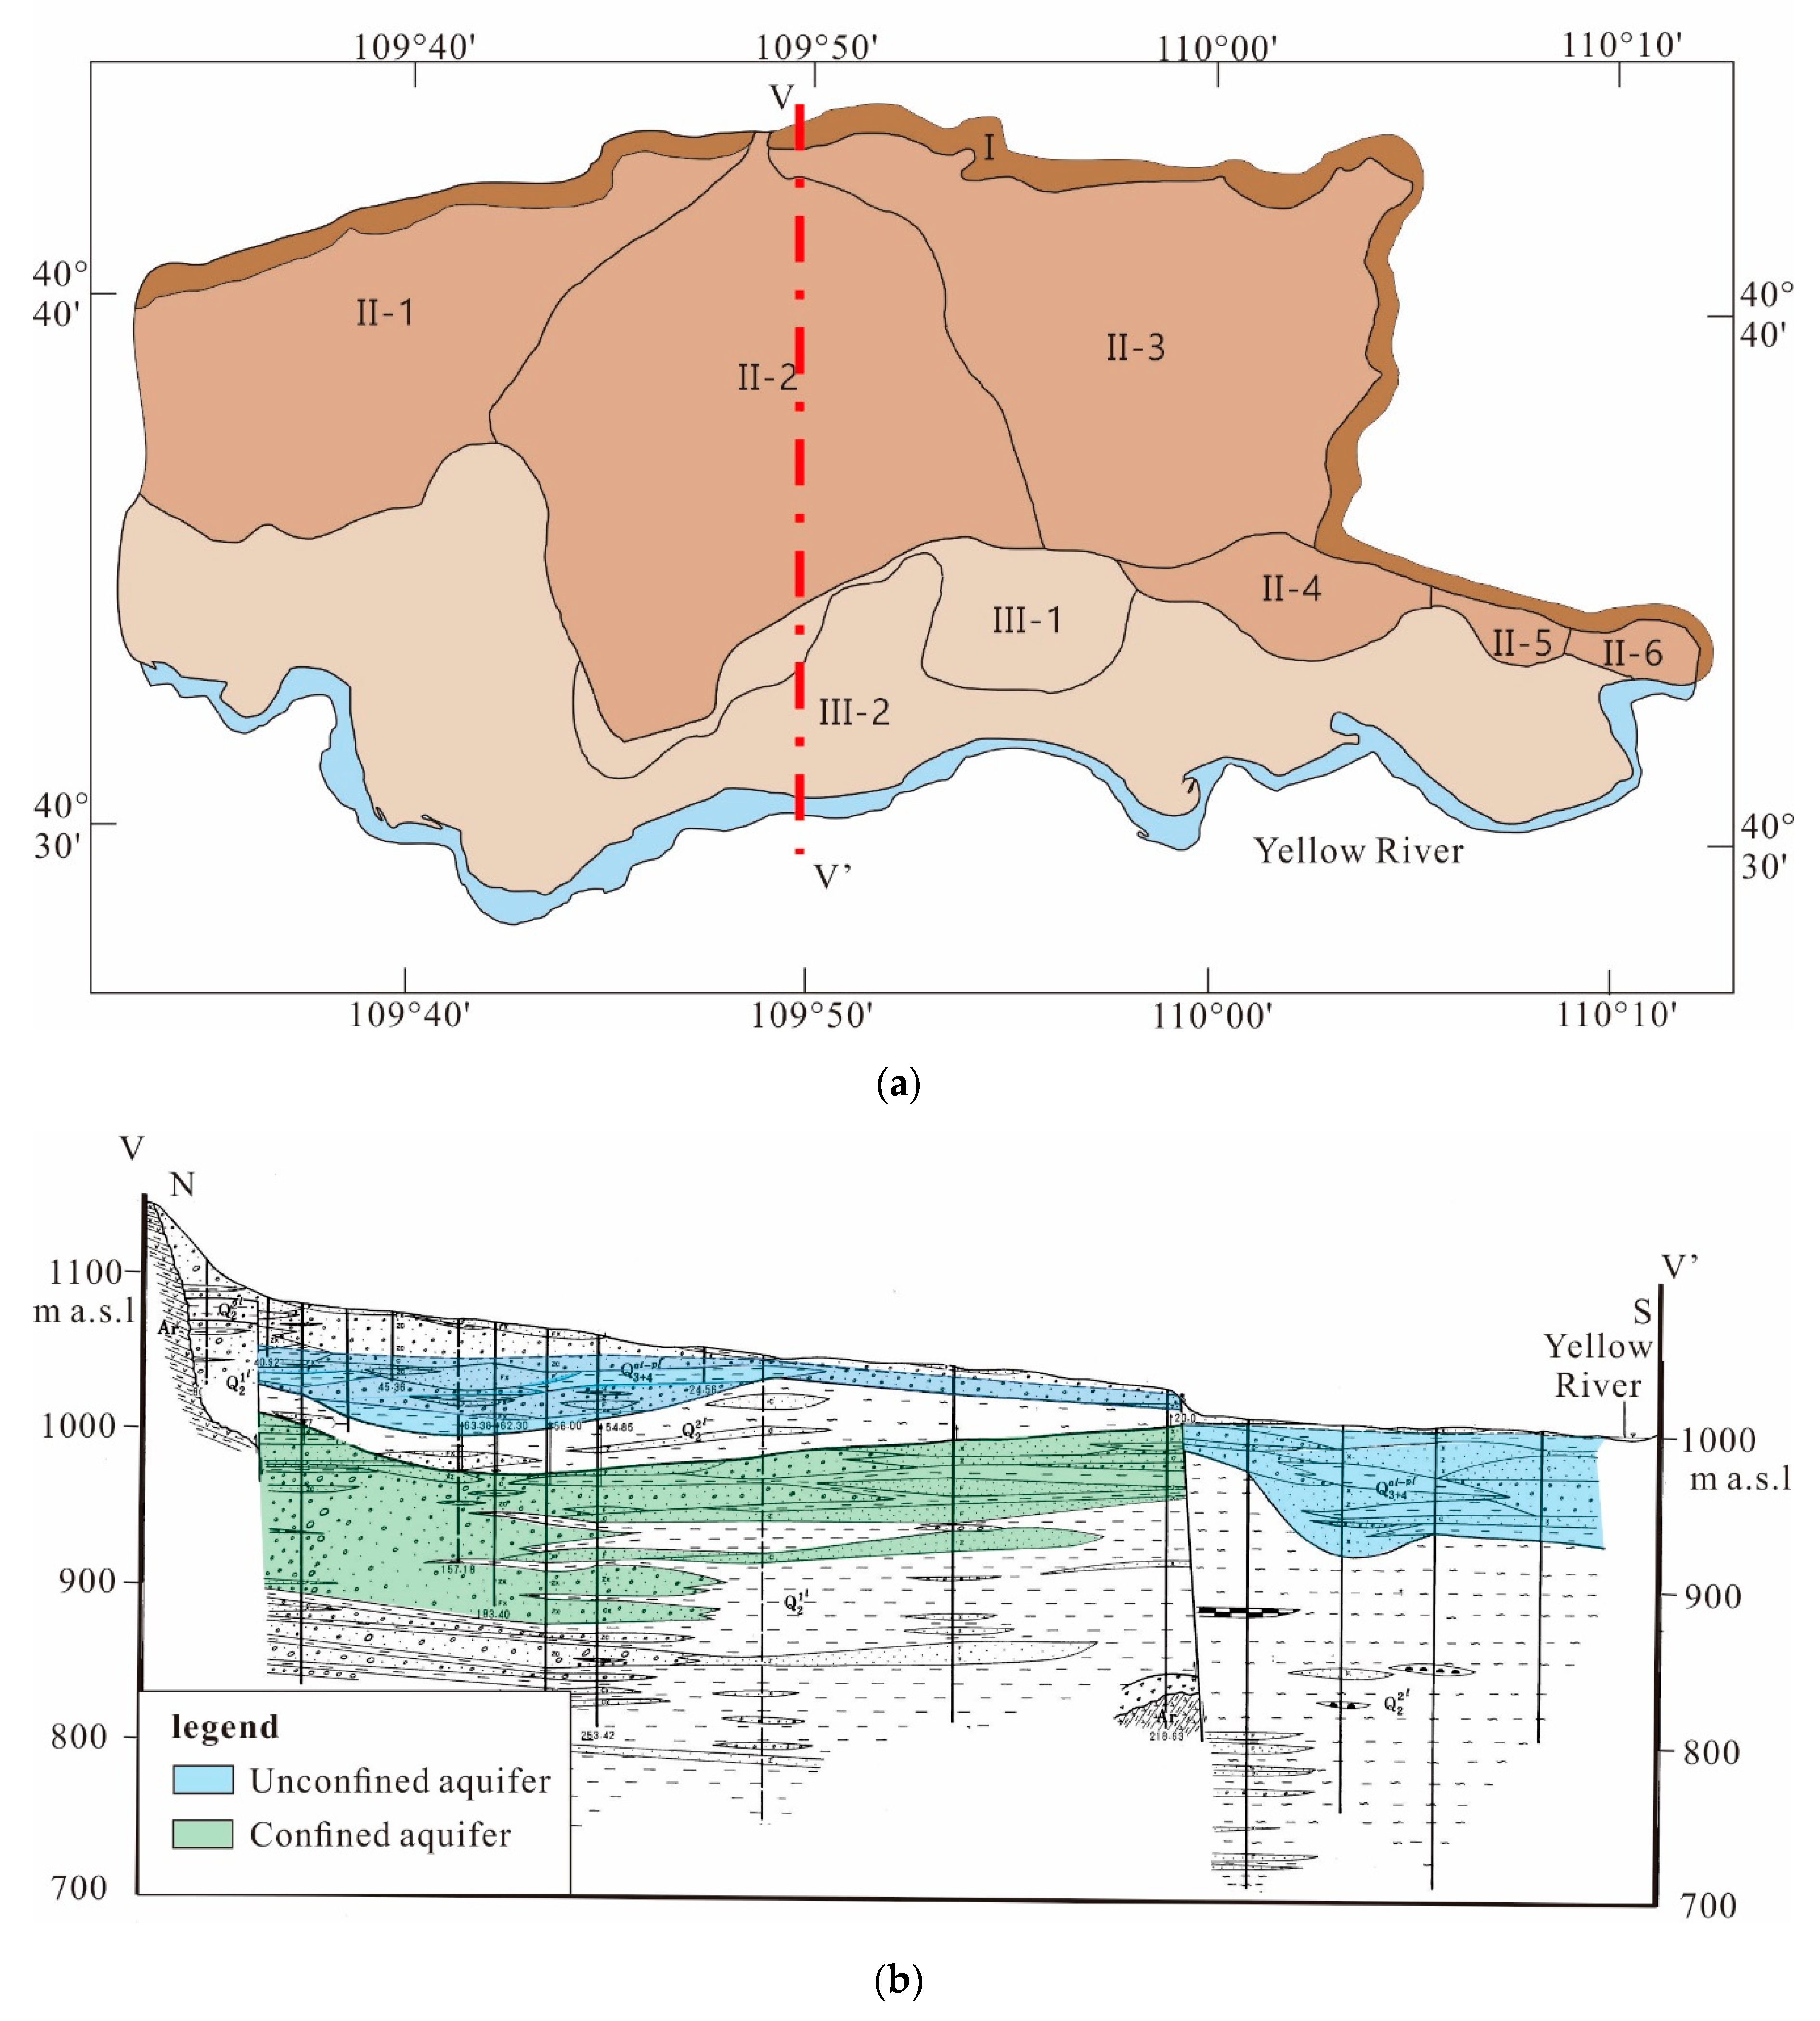
The location of the study area is in the middle of the Daqingshan Piedmont active fault zone and the Yellow River. The study area is within the hydrogeological region of the Hetao Plain and is mainly composed of two geological units: the Piedmont Alluvial Plain (Figure 2a II-1, II-2, II-3, II-4, II-5, and II-6) and the Alluvial Plain of the Yellow River (Figure 2a III-1 and III-2). The Quaternary loose rocks are widely distributed in the geological units of the study area, and the aquifers have high pore-water content. There are two main aquifer groups: the first aquifer group (water-bearing group) is mainly gravel and contains mainly Pleistocene to the Holocene strata (Table 2). The groundwater of this aquifer group is mostly unconfined or semi-confined. The second aquifer group (Q12 water-bearing group), also known as the confined aquifer group, is mainly sand gravel, and the strata are from the Middle Pleistocene (Q22), which has high thickness and wide distribution. This is a confined aquifer (Figure 2b).

2.2. Data

2.2.1. Hydrological and Climate Data

In this study, annual precipitation, annual average temperature, and Yellow River runoff data were used to quantitatively analyze the climate change in Baotou and then to determine the impact of hydrological and climate change on the groundwater level.
Annual precipitation and annual average temperature data were taken from Monthly Dataset of China’s Surface Climate Data (1951 to the present) comprising daily data for 613 basic and reference surface meteorological observation stations and automatic stations in China. Although there is only one weather station in the study area, the long series of data is complete. We chose daily precipitation and temperature data for the Baotou meteorological observatory (40°40′ N, 109°51′ E) from the above dataset and processed the data as monthly and annual data to analyze the trending changes in precipitation and temperature. This data set has undergone strict quality control and inspection. The monthly, annual average, and the total value of each element were calculated from the corresponding elements of the daily value. There was no error data for each element of the monthly value.
The Yellow River runoff data were taken from the “Yellow River Water Resources Bulletin” on Toudaoguai Hydrological Station, which is the closest large hydrological station on the Yellow River to the study area. In this paper, the Yellow River annual runoff was used to analyze whether changes in the groundwater level would be affected by hydrological factors.

2.2.2. Groundwater Table Data

Groundwater level data for the study area (up to December 2017) were sourced from actual measurement data by the Baotou Water Affairs Bureau. We collected daily and monthly data from 2007 to 2017 for 49 groundwater observation wells. According to the observation position and use of observation wells, these data were divided into 29 unconfined aquifer monitoring wells and 20 confined aquifer observation wells. The frequencies of the observation wells ranged from 24 h to 30 days. While conducting quality control, we processed the data into monthly data and annual data series. Then, we analyzed the influence of groundwater level on precipitation temperature and human activities.

2.3. Statistical Analysis

2.3.1. Trend-Free Pre-Whitening (TFPW)-Mann–Kendall Test

The evolution law of climate elements refers to the change of time and space in related climatic factors, including precipitation and temperature, and their influencing factors. Moreover, it is usually studied using some statistical methods [38,39]. We calculated and analyzed the basic information of the data sequence, such as sequence mean, maximum, minimum, and coefficient of variation. We then used conventional statistical methods, such as linear regression, and 5-year moving average to analyze the trend of precipitation and temperature in the UPABC during the whole study period and part of the study period, and the Mann–Kendall test [40,41] to check abrupt change points of the results and data series, to better study the changes of climatic conditions in regional and their abrupt change point time for finding possible causes of change and exploring the relationship between climate change and dynamic groundwater level.
As a climate diagnosis and prediction technique, the Mann–Kendall test can be used to determine whether there is a climate change in the climate sequence. If such a change exists, the time of the abrupt change point can be determined. The Mann–Kendall test is a non-parametric method, which is also called the non-distribution test. The advantage of the non-parametric method is that it does not need the sample to follow a certain distribution and is not influenced by a few abnormal values. Therefore, it is suitable for type variables and order variables, and the calculation is relatively simple.
Considering the effect of the autocorrelation of the waiting detection sequence on the detection results, we used trend-free pre-whitening (TFPW) to adjust the Mann–Kendall test. The TFPW-Mann–Kendall test method is a pre-removal type Mann–Kendall test method to address the autocorrelation problem of the test sequence. The program before the statistical Mann–Kendall test includes two processes: detrending and presetting. The process can effectively reduce the influence of autocorrelation in the sequence on the test results and thus avoid distortion. The specific steps are as follows [41,42,43]:
Y k = X k β × k ,
Y k = Y k r a × Y k 1 ,
Y k = Y k + β × k ,
β = M e d i a n ( X j X i j i ) i < j ,
where X i , X j are the sequence data of precipitation, temperature, and groundwater depth, respectively; k is the serial number of the precipitation, temperature, and groundwater depth series; n is the total number of sequence data; r a is the first-order autocorrelation coefficient of Y k ; Y k is the residual sequence after deducting the trend; Y k is the independent white noise sequence after removing the autocorrelation term; Y k is the new sequence obtained after TFPW processing; β is the slope of the sequence to be tested.
In this paper, the TFPW-Mann–Kendall test was used in two main ways. The first was to calculate the trend of the time series, and the second was to calculate whether there is an abrupt change point in this time series. Identification of an abrupt change point would imply that precipitation or temperature is affected by some reason and begins to change.
The abrupt change test was then calculated as:
U F k = i = 1 k s i k ( k 1 ) / 4 k ( k 1 ) ( 2 k + 5 ) / 72 ( k = 1 , 2 , , n )
where
s i = { 1 , X i > X j 0 , X i < X j , ( j = 1 , 2 , , i ;   i = 1 , 2 , , n ) ,
and U B k is calculated by repeating the above method in the inverse sequence and negating the calculated value as follows:
U B k = U F n + 1 k , ( k = 1 , 2 , , n )
When a given level of significance is exceeded, it indicates that the trend of the sequence is significant. If the intersection of the curve of U F k and the curve of U B k is between the significant horizontal lines, the intersection is the starting moment of the sequence abrupt change point, and we can regard it as the beginning of an abrupt change point.

2.3.2. Pearson Correlation Coefficient

Correlation analysis and regression analysis are used to calculate the Pearson correlation coefficient between precipitation, temperature, groundwater exploitation, and the groundwater level, to quantify the impact of different factors, including climate and human activities, on the groundwater level.
The Pearson correlation coefficient ( r ) is an effective tool for measuring the proximity of two random variables X and Y . The range of r is −1 to 1. The value greater than 0 indicates a positive correlation, and less than 0 indicates a negative correlation. The correlation is greater when the absolute value is close to 1 [44].
r = i = 1 n ( X i X ¯ ) ( Y i Y ¯ ) i = 1 n ( X i X ¯ ) 2 i = 1 n ( Y i Y ¯ ) 2
where r is the correlation coefficient of variables X and Y ; X i is the groundwater depth every month; Y i is other data (precipitation, temperature, and groundwater consumption) related to groundwater depth each month; X ¯ and Y ¯ are the means of X and Y , respectively; n is the sample size.

2.3.3. Cross Wavelet Transform (XWT)

The XWT method, based on wavelet transform and cross-spectrum analysis, aims to compare the traditional wavelet analysis with a comprehensive way to test the connection between two-time series [45]. The XWT method can not only detect the correlation between two-time series but also reflect their phase structure and local characteristics in the time and frequency domains. The XWT method reveals a region with a high common power value, using a cross-wavelet spectrum to detect the cyclic characteristics of covariation in the underlying time series. The coordinated changes of the two-time series indicate the existence of a connection between the underlying processes and the fact that information from one process can predict the other [46]. This is useful when finding processes that have a correlation (or strong correlation) with the target time series. X and Y of two-time series of XWT are defined as:
W n X Y = W n X × W n Y
where * indicates complex conjugate, and W n X and W n Y are continuous wavelets of X and Y , respectively. The cross-wavelet power can further explain the local relative phase between the components of the two-time series in time–frequency space.

2.3.4. Wavelet Transform Coherence (WTC)

WTC is a tool that identifies possible relationships between two processes by searching for frequency bands and the time interval in which they coexist. It can characterize the degree of coherence of XWT in time–frequency space [47]. WTC is a time–frequency domain cross-correlation between an input time series X and an output time series Y using a continuous wavelet transform and quantitatively detects delayed response (i.e., lead-lag relationship) and phase change (i.e., correlation). In other words, WTC can enhance linear correlation analysis and help reveal the correlation between two phenomena.

3. Results

3.1. Climate Change

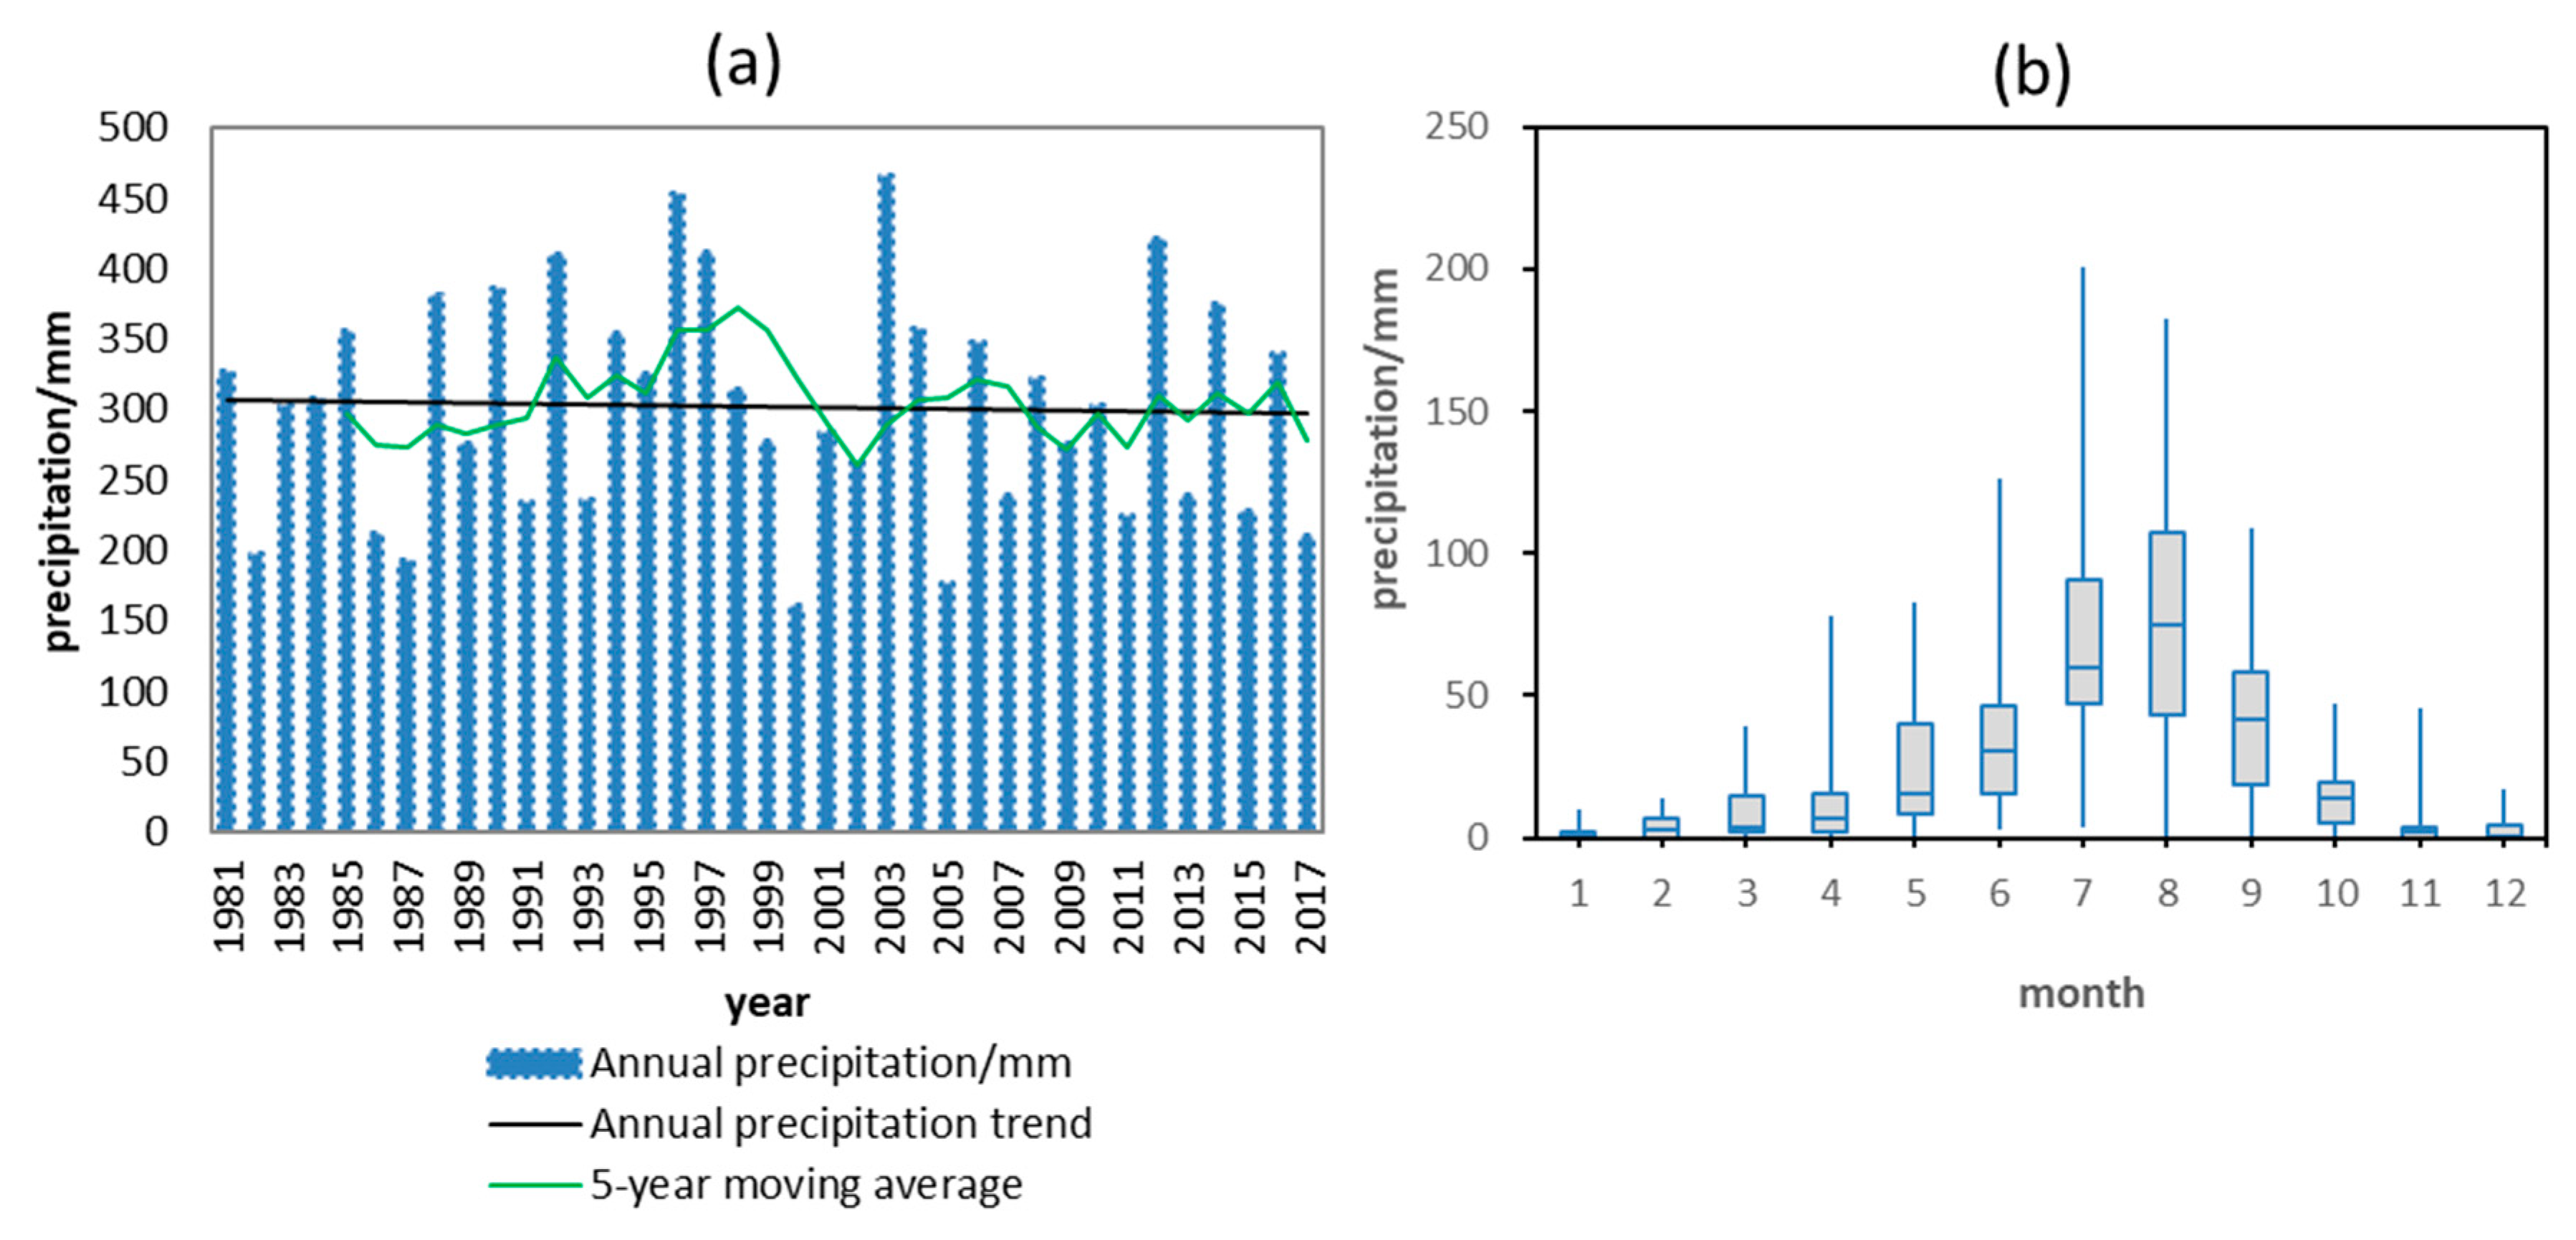
The annual precipitation, 5-year average precipitation, and annual precipitation change trend of Baotou Station are shown in Figure 3a. The average annual precipitation of Baotou Station from 1981 to 2017 was 305.9 mm, the standard deviation was 79.7 mm, the coefficient of variation was 0.3, and the annual precipitation change rate was 3.3 mm/10 yr. The annual precipitation changed slowly, and the overall trend showed an increasing trend. The maximum precipitation in Baotou Station was 465.2 mm in 2003, which was 52% more than the average for the whole period; the minimum was 161.2 mm in 2000, which was 47% less than the average year. The 5-year sliding average for Baotou Station showed an increasing trend from 1981 to 2017, but it showed a significant downward trend in 1998–2002. The 5-year annual precipitation fluctuated between 2006 and 2017, and the overall trend was rising gently.
Multi-year precipitation was calculated according to monthly averages, and the results showed that maximum precipitation in July and August and January and December had the smallest average (Figure 3b). This was consistent with the continental climate characteristics of the northern hemisphere. However, the difference between the maximum and minimum values was also the largest in July and August. This means that the interannual variation of precipitation during the same period was very large. Furthermore, we found that although the median precipitation in August was greater than July, the maximum and minimum values of precipitation in July were greater than those in August. This further illustrated the existence of individual amounts of precipitation that were considerably larger than the average.
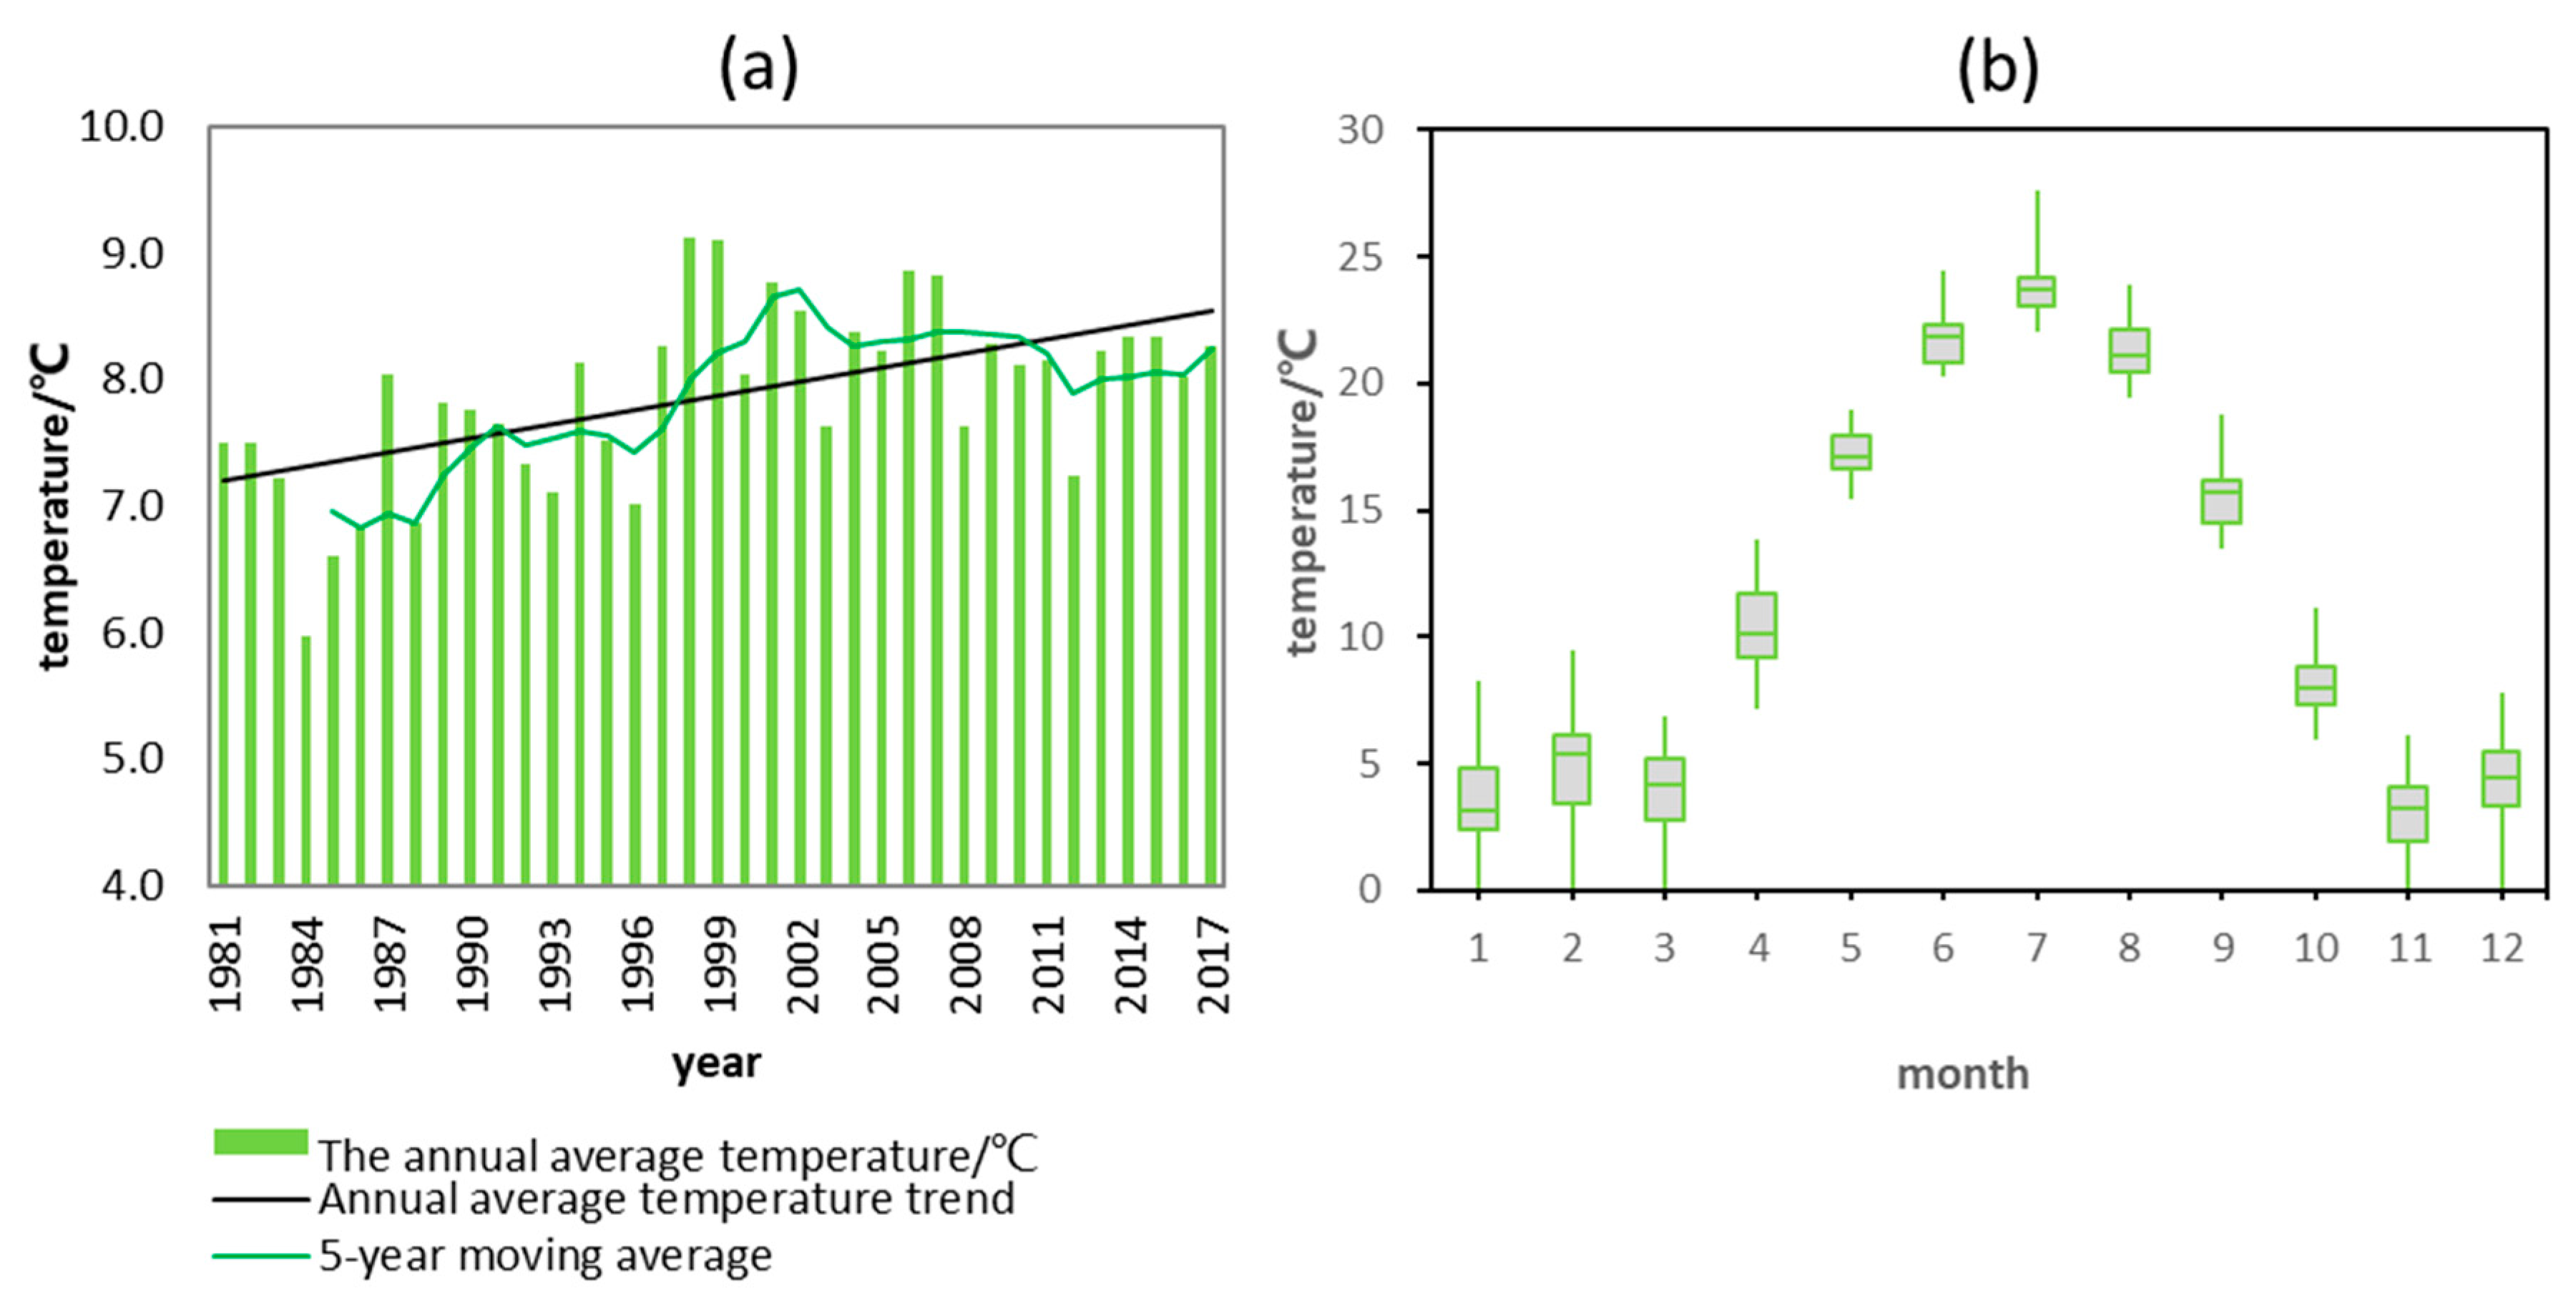
Temperature change is another important factor in climate change. The annual average temperature of Baotou Station, the average annual average temperature of 5 years, and the annual average temperature change trend are shown in Figure 4a. The annual average temperature of Baotou Station from 1981 to 2014 was 7.8 °C, the standard deviation was 0.7 mm, the coefficient of variation was 10.3, and the annual average temperature change rate was 0.43 °C/10 yr. The overall trend was increasing, and the regional climate was warming. The maximum annual average temperature of Baotou Station was 90.1 °C in 1998, which was 17% higher than the multi-year average temperature, and the minimum value was 13% at 6.0 °C in 1984. The annual average 5-year temperature showed an increasing trend from 1981 to 2017, but it showed a downward trend for 2002–2005 and 2010–2012, which was different from other years. There was a clear overall upward trend, indicating a warming regional climate.
The monthly average extreme difference in temperature was smaller than the result of precipitation analysis. This further showed that the interannual variation of temperature was relatively small. May to September had the highest temperature, whereas January, February, and November, December had the lowest temperature (Figure 4b).
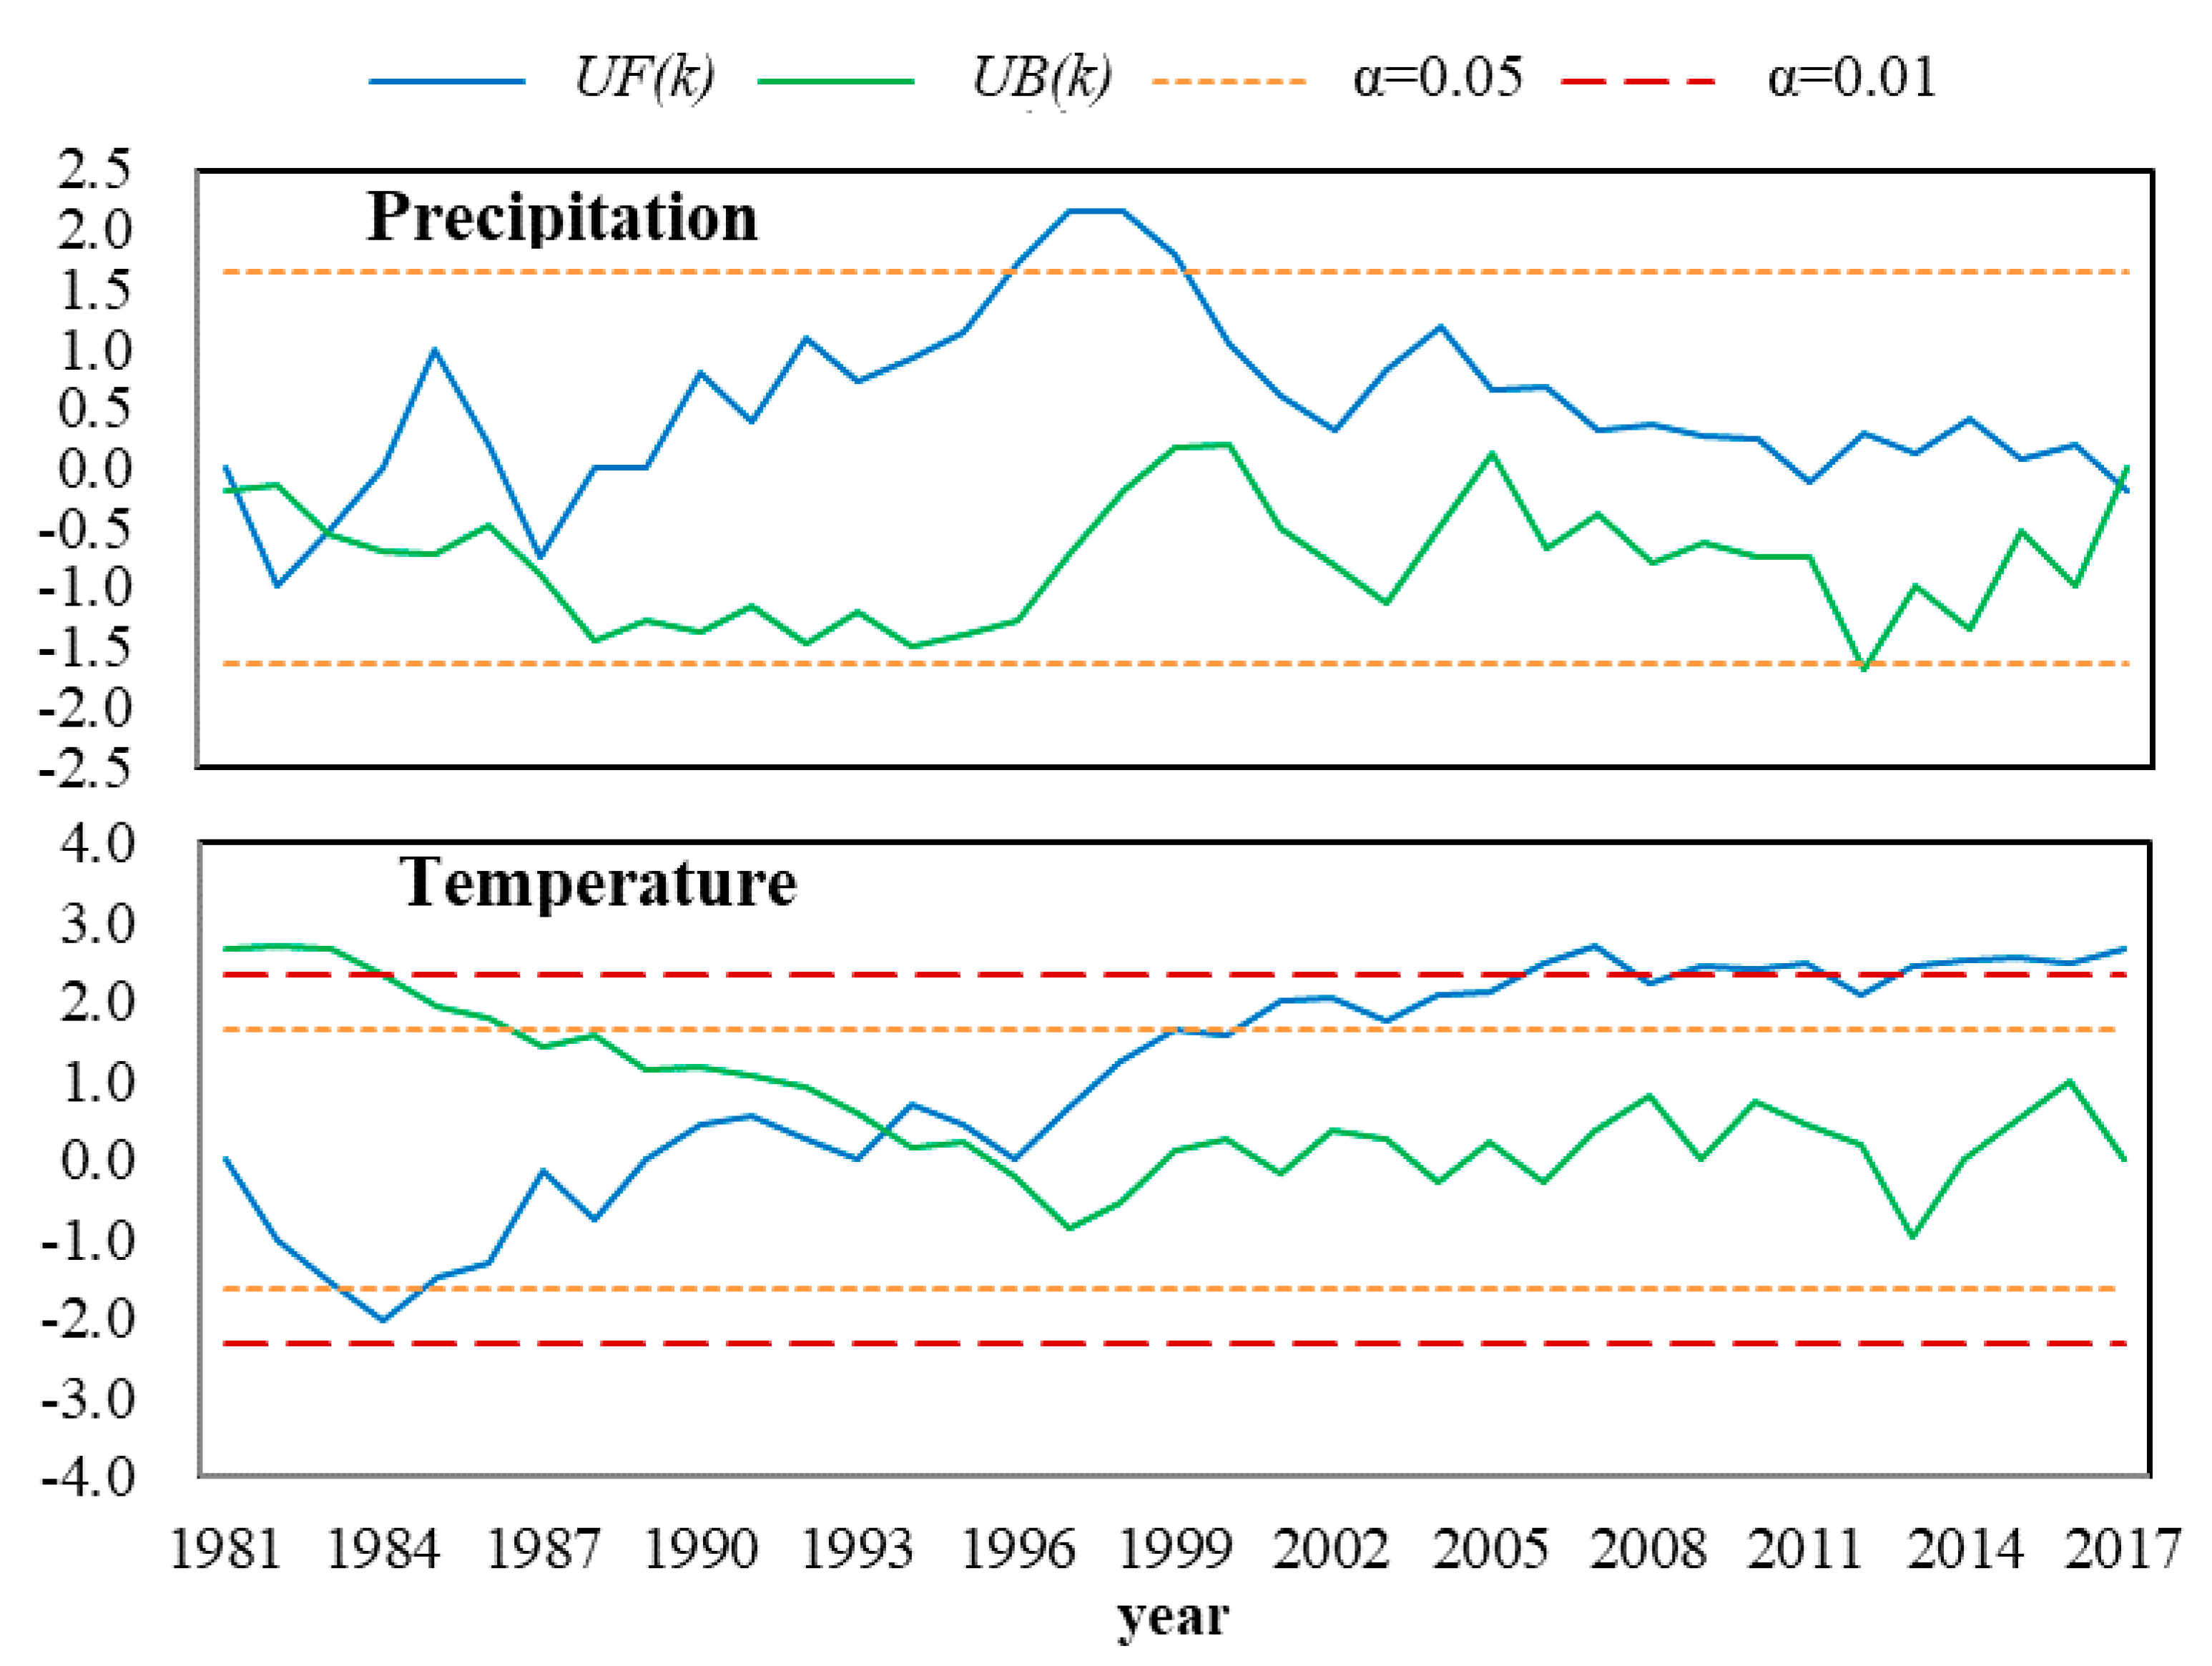
To accurately analyze the changes in precipitation and temperature, the TFPW-Mann–Kendall test was applied to the annual precipitation and annual average temperature to determine its variation characteristics. The Z value of the annual precipitation trend detection was −0.17, indicating that the annual precipitation generally shows a slightly decreasing trend, but this overall upward trend was not significant at the α = 0.05 or α = 0.01 levels. The annual average temperature trend Z value was 2.66, indicating that the annual average temperature generally shows an increasing trend, and the overall upward trend passed a significance test at α = 0.05 and α = 0.01.
To analyze whether there are abrupt changes in precipitation and temperature changes, the TFPW-Mann–Kendall test was used to test the annual precipitation and annual average temperature to obtain the UF curve shown in Figure 5. The annual precipitation increase trend only passed the trend test at α = 0.05 only in 1996–1999. According to the TFPW-Mann–Kendall test, the intersection of the curves of UF and UB in the confidence interval marks the beginning of the abrupt change point, and the possible abrupt change points of the annual precipitation sequence appeared in 1983. The annual average temperature rise trend passed the trend test at α = 0.05 in 1999–2017. In addition, the significant rise in the annual average temperature in 2006–2008, 2009–2011, and 2013–2017 passed the significance test (α = 0.01). The intersection of the UF and UB curves in Figure 5 indicated that the possible abrupt change points of the annual average temperature sequence appeared in 1993.

3.2. Human Groundwater Demand and Pumping

The average annual groundwater utilization in the UPABC from 2007 to 2017 was 152.05 million m3, and the amount of groundwater exploitation increased overall, with an increase of 1.14 million m3 per year. The average annual domestic use capacity is 16.52 million m3, accounting for 10% of the total groundwater use from 2007 to 2017. The total domestic water consumption decreased from 2007 to 2017, with a reduction of 67.02 m3/a. The average annual industrial groundwater exploitation was 19.11 million m3, accounting for an average annual groundwater consumption decrease of 13%, with a reduction of 168,147 m3/a. The average annual agricultural exploitation was 120.99 million m3, accounting for 77% of the average annual groundwater use, showing an overall increasing trend of 1.72 million m3/a (Figure 6).
The maximum amount of groundwater exploitation in the UPABC in the studied period was 177.95 million m3 in 2011, which was 18% above the average value. The minimum amount of groundwater exploitation was 13.345 million m3 in 2007, which was 15% less than the average value. Figure 5 shows that the total amount of groundwater exploitation increased over the studied period, especially in 2008–2011, with the largest increase rate of 11.12 million m3/a; however, there was a decreasing trend during 2007–2008, 2011–2013, and 2014–2017. In general, groundwater utilization decreased slowly after peaking in 2011, but, in 2014, groundwater exploitation increased slightly. This might be related to the government’s introduction of relevant documents to implement water resources management policies in 2011 to reduce the use of groundwater and might also be related to the use of water-saving equipment. Increases in groundwater use in 2014 might have been due to excessive economic growth or weakened regulatory intensity, resulting in increased groundwater exploitation.

3.3. Temporal and Spatial Variation of Groundwater Depth

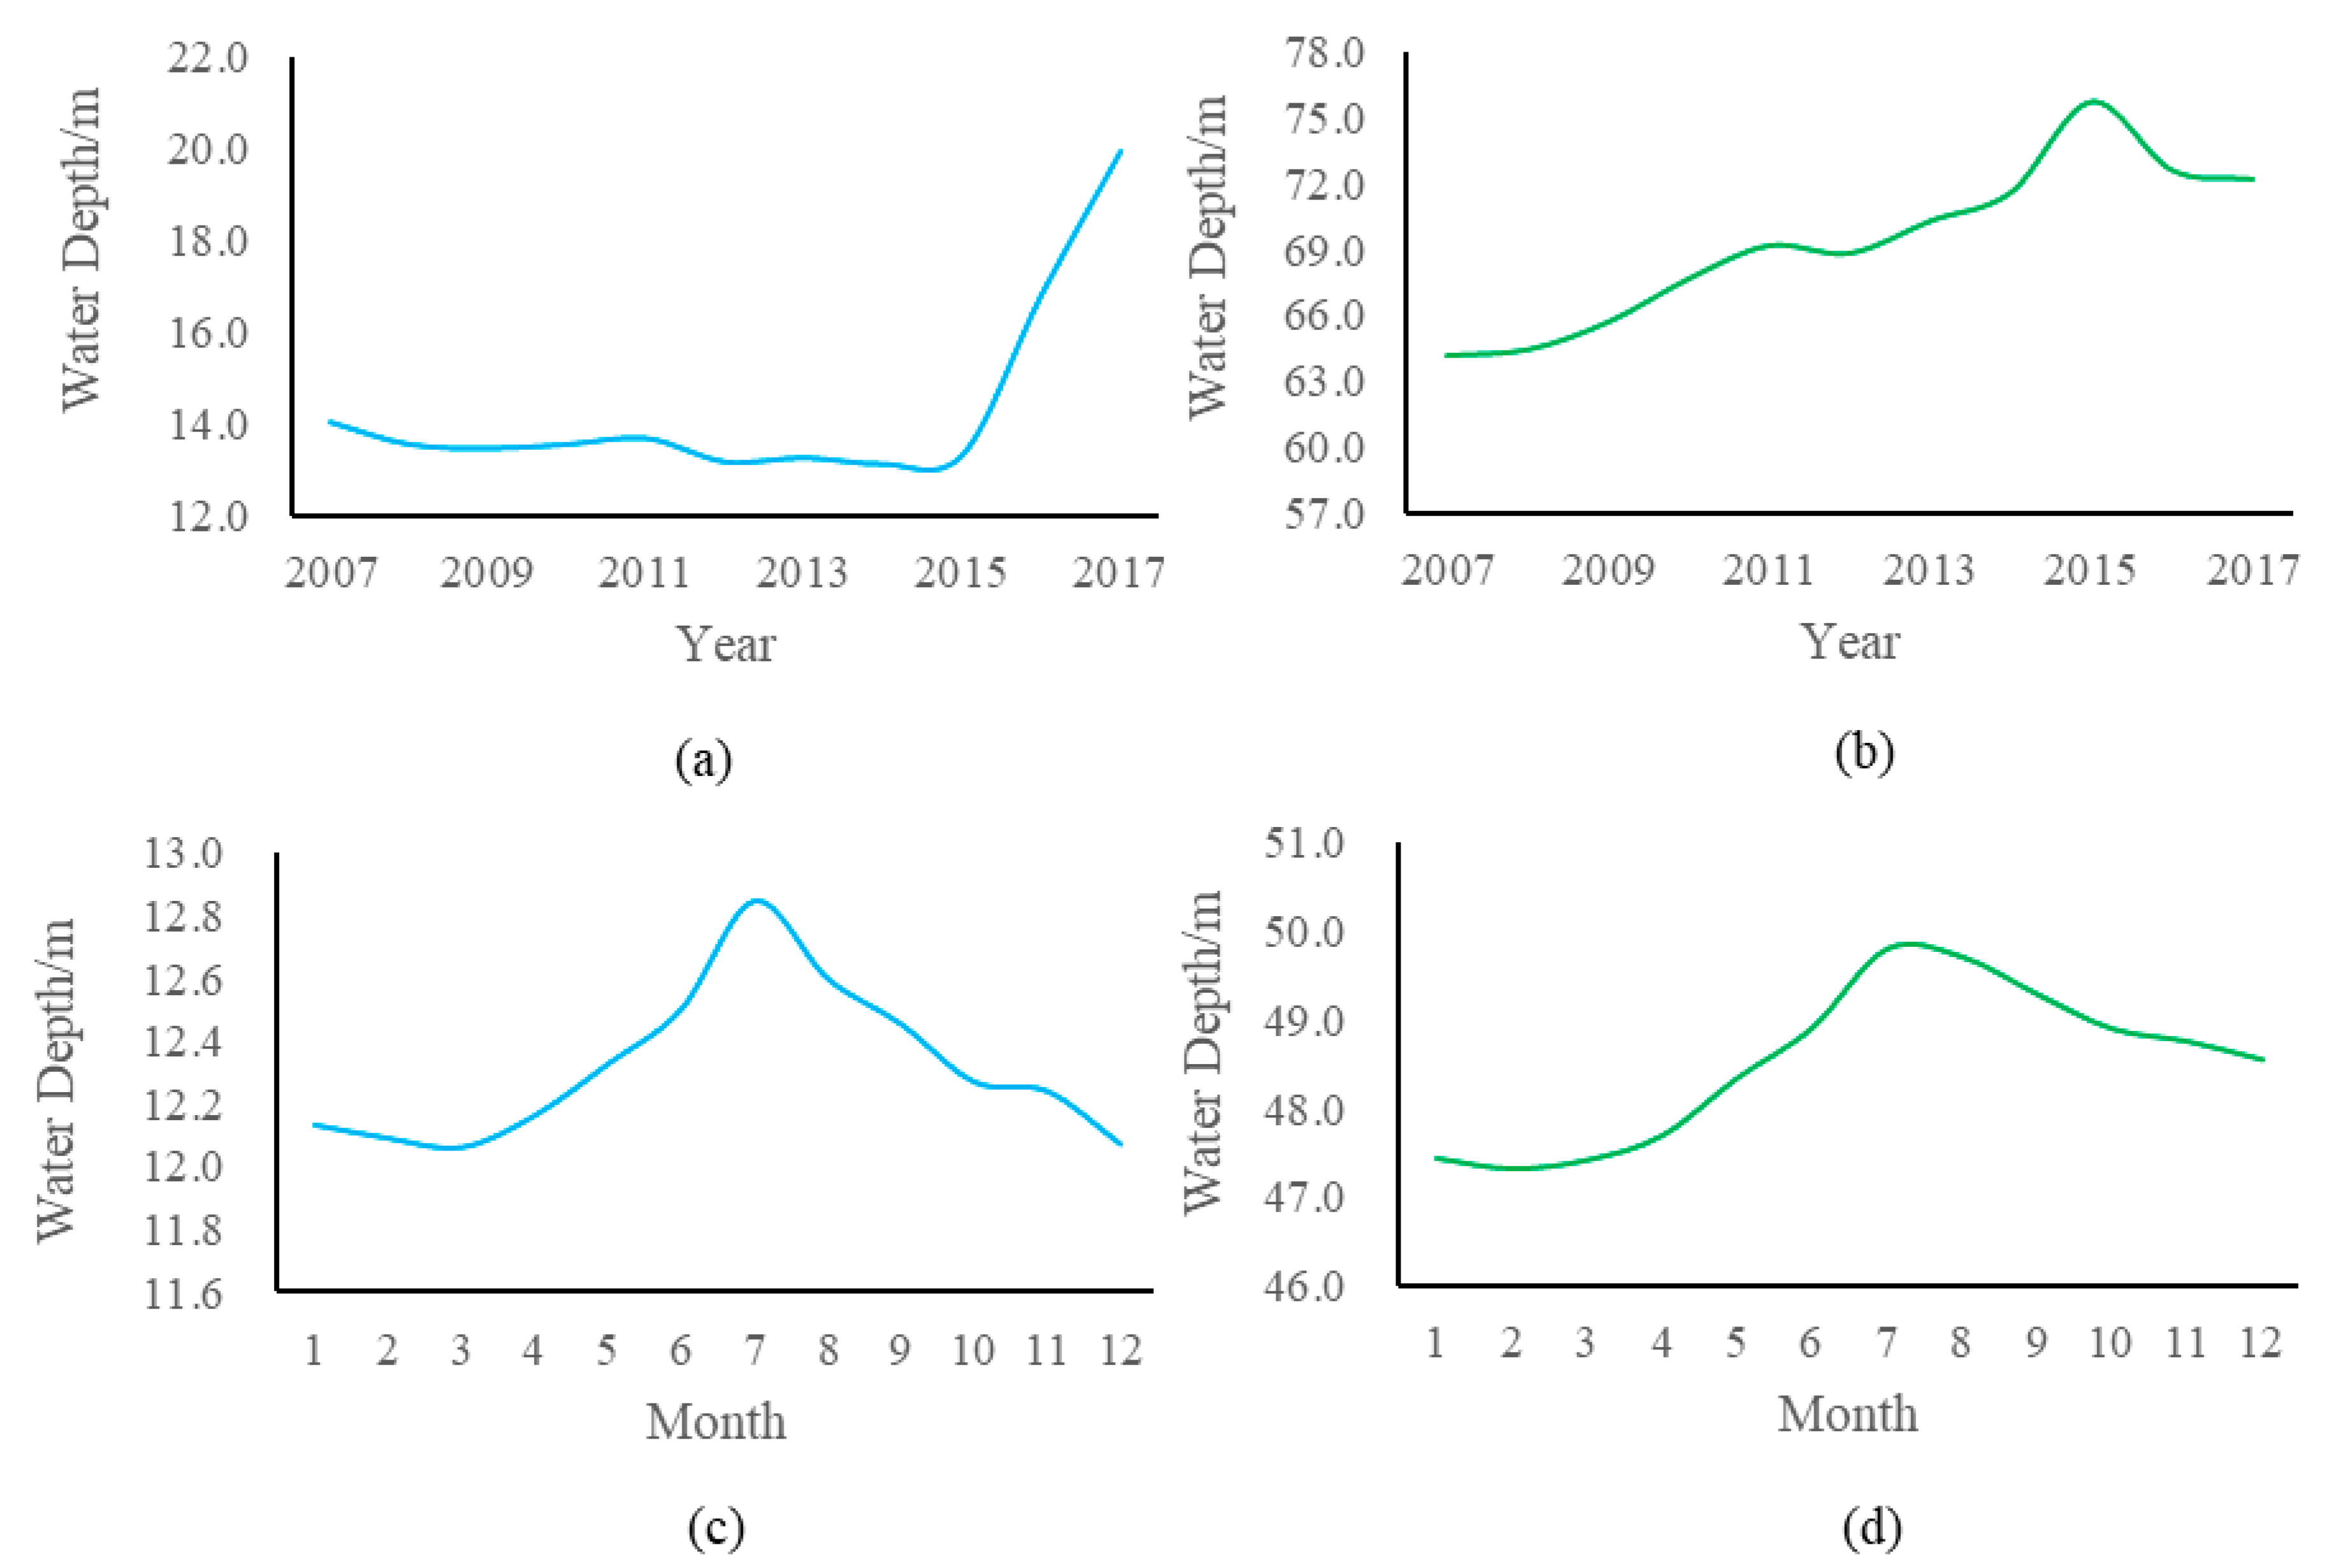
The observation water depth of 29 unconfined observation wells and 20 confined water observation wells in the study area was extracted as the annual average water depth of the groundwater depth in the UPABC. The average annual water depth of unconfined water in the UPABC was 14.40 m from 2007 to 2017, and the average water depth of confined water was 69.3 m from 2007 to 2017. In 2007, the average water depth of the UPABC was 14.00 m, and the average water depth of confined water was 64.20 m. In 2017, the average water depth of the unconfined water in the UPABC was 19.90 m, and the average water depth of the confined water was 72.20 m. The water depth of the unconfined and the confined water both showed an upward trend. The unconfined water decrease rate was 0.50 m per year, and the confined water decrease rate was 0.7 m per year. The unconfined water depth showed different trends in different periods. Specifically, the unconfined water depth in the UPABC decreased slowly in 2007–2015, with a sharp upward trend in 2015–2017 (Figure 7a). The confined water depth showed an upward trend for many years; the rate of decline in 2007–2015 indicated little change, and the decline curve in 2015–2017 was relatively steep (Figure 7b).
The average monthly water depth analysis results are shown in Figure 7c,d. The unconfined water depth declined slowly from January to March, reaching a minimum in March at 13.06 m. The unconfined water depth then increased from March to July, with an increasing rate. When the maximum water depth of 12.84 m occurred, the range of water depth was 0.78 m. The water depth gradually decreased from July to December. The confined water depth gradually decreased from January to February, peaking at 47.33 m. The confined water depth gradually increased from February to July, and the incline rate gradually increased. The maximum water depth occurred in July at 49.81 m, and the water depth range was 2.48 m. The confined water depth showed a gradual downward trend from July to December. Moreover, the unconfined water depth and the confined water depth inclined gradually from January to March because the limited precipitation in winter was insufficient to supply groundwater. Furthermore, it increased to the peak in July, and the unconfined water depth and the confined water depth began to decline because the groundwater replenished with sufficient precipitation in summer.
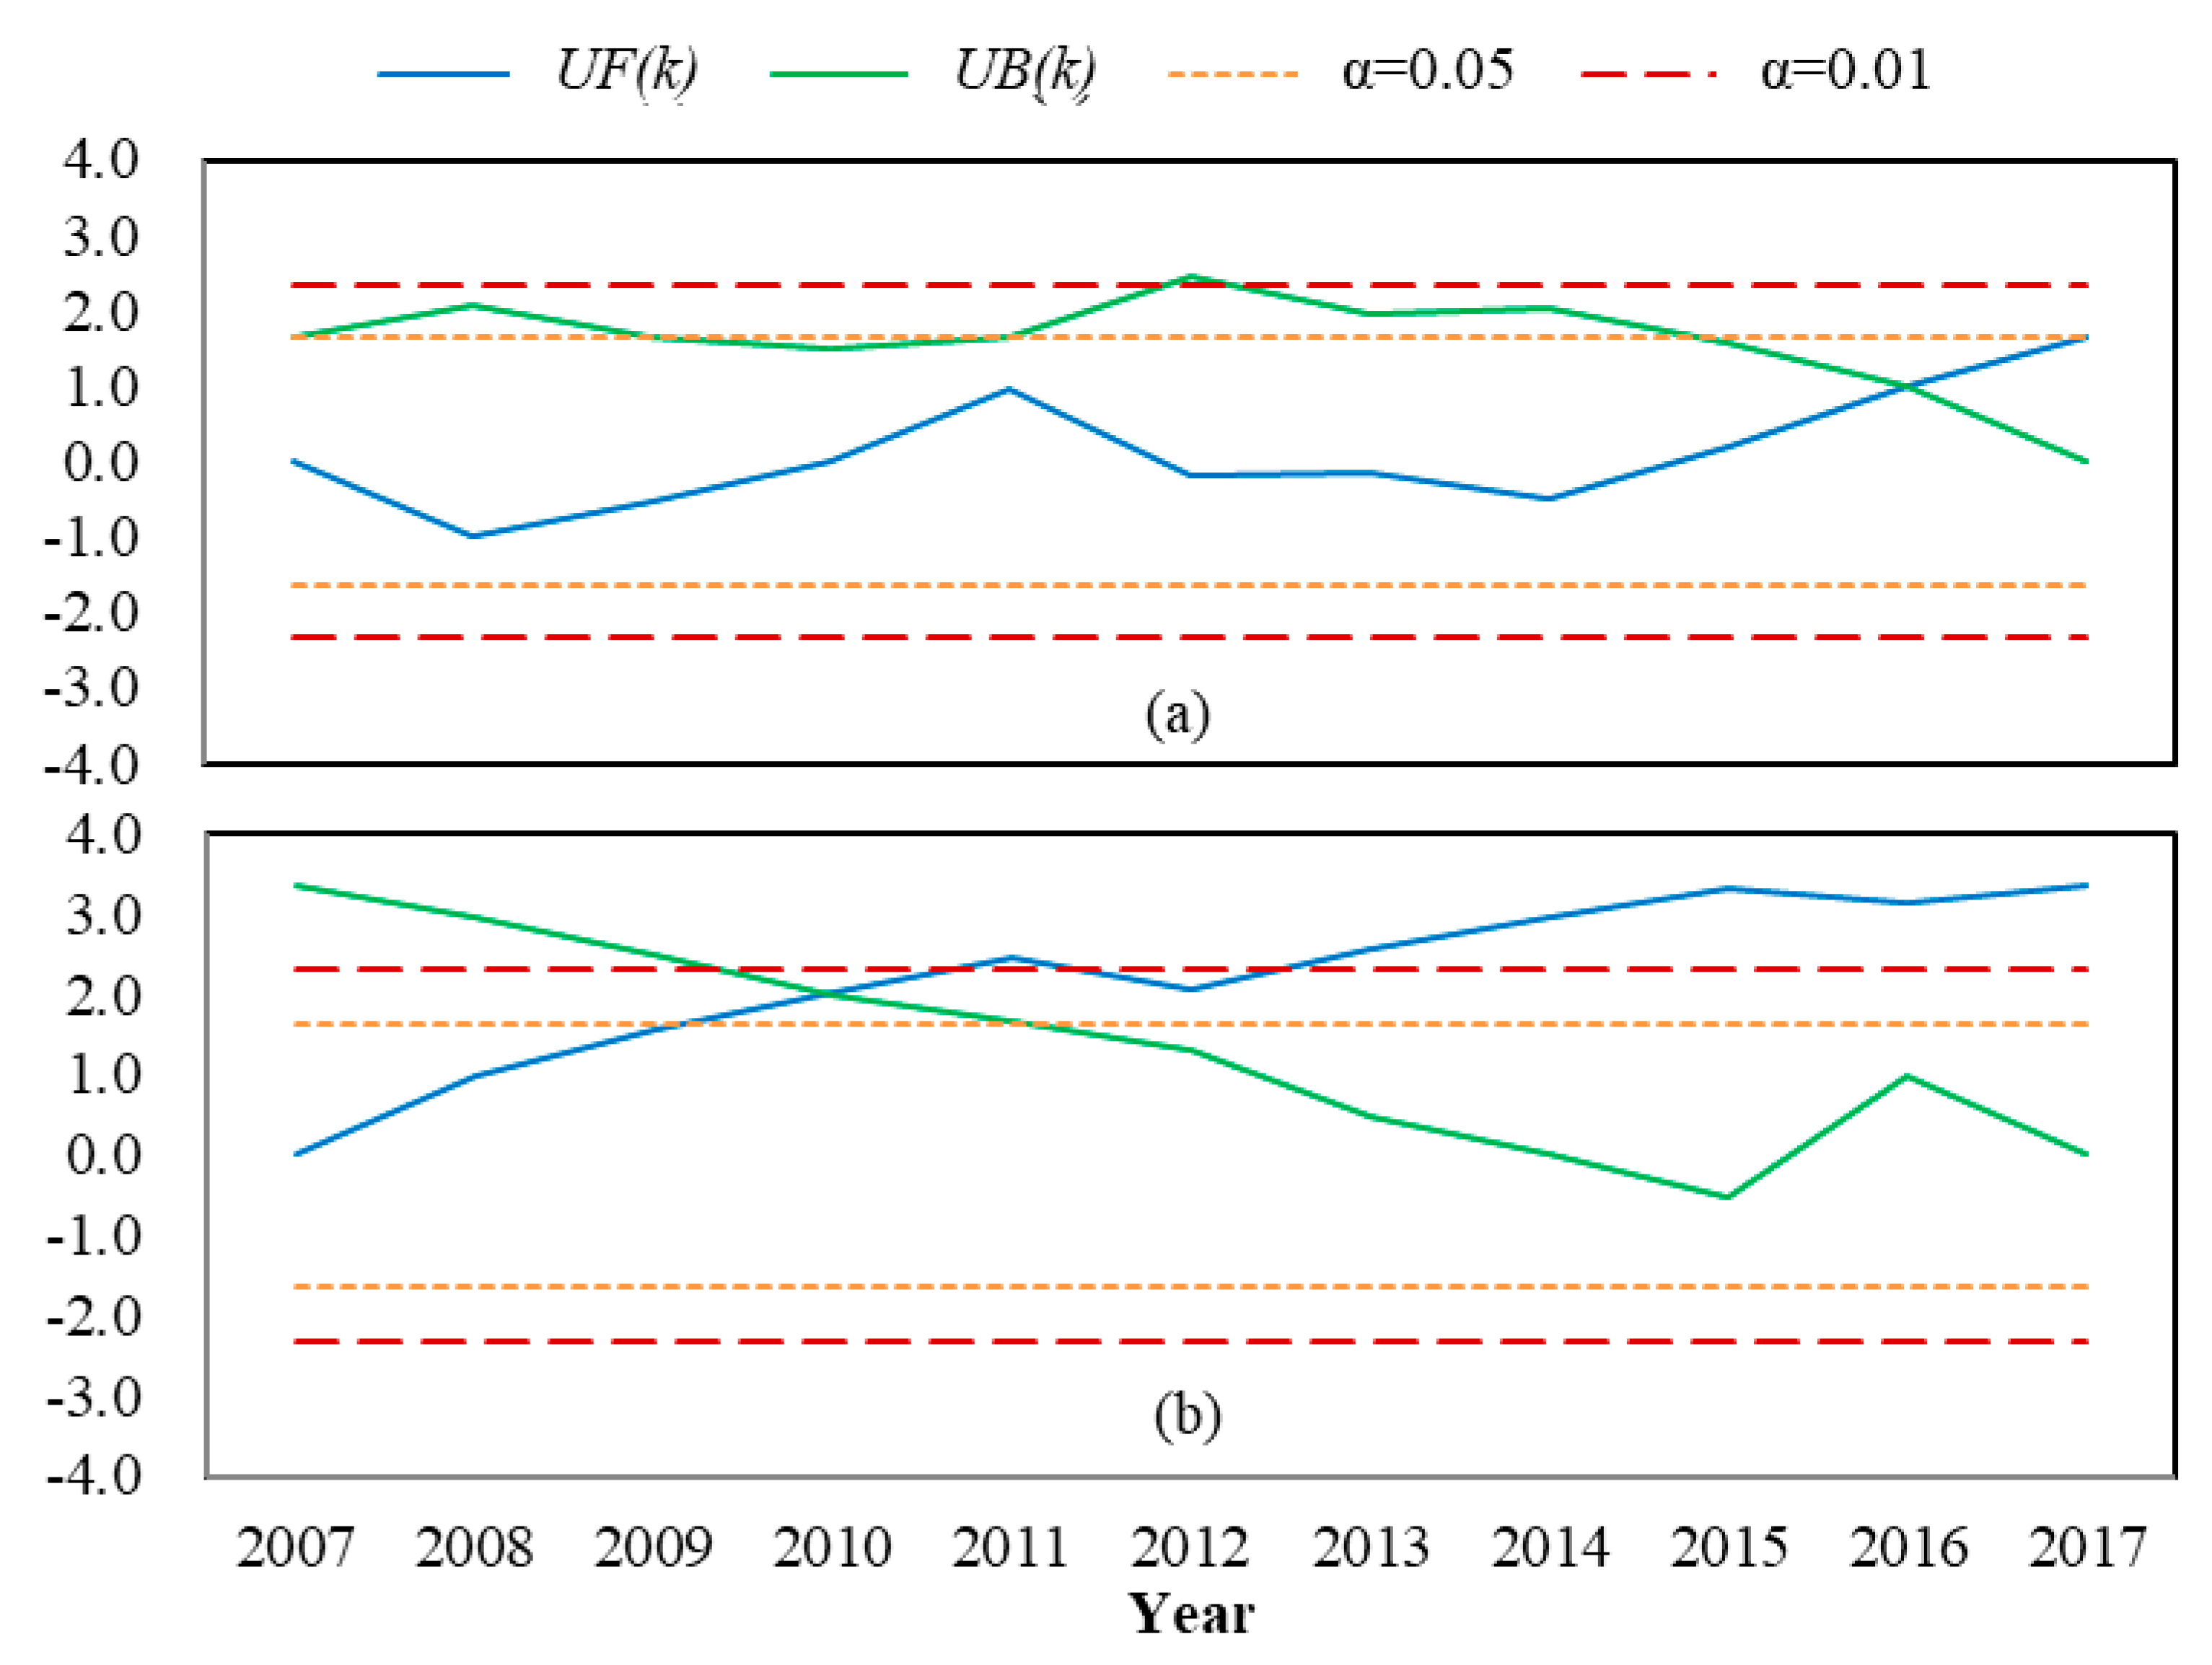
To analyze whether there are abrupt changes in unconfined and confined water depth changes, the TFPW-Mann–Kendall test was used to test unconfined and confined water depth to obtain the UF curve shown in Figure 8a. The unconfined water depth decrease trend did not pass the trend test of α = 0.05. According to the TFPW-Mann–Kendall test, the intersection of the curves of UF and UB in the confidence interval marks the beginning of the abrupt change, and there are no possible abrupt change points of the confined water depth sequence. The confined water depth increasing trend passed the trend test of α = 0.05 in 2009–2017. Moreover, the confined water depth increased significantly in 2011 and passed the significance test (α = 0.01) in 2013–2017. The intersection of the UF and UB curves in Figure 8b indicated that the possible abrupt change points of the confined water depth sequence appeared in 2010.
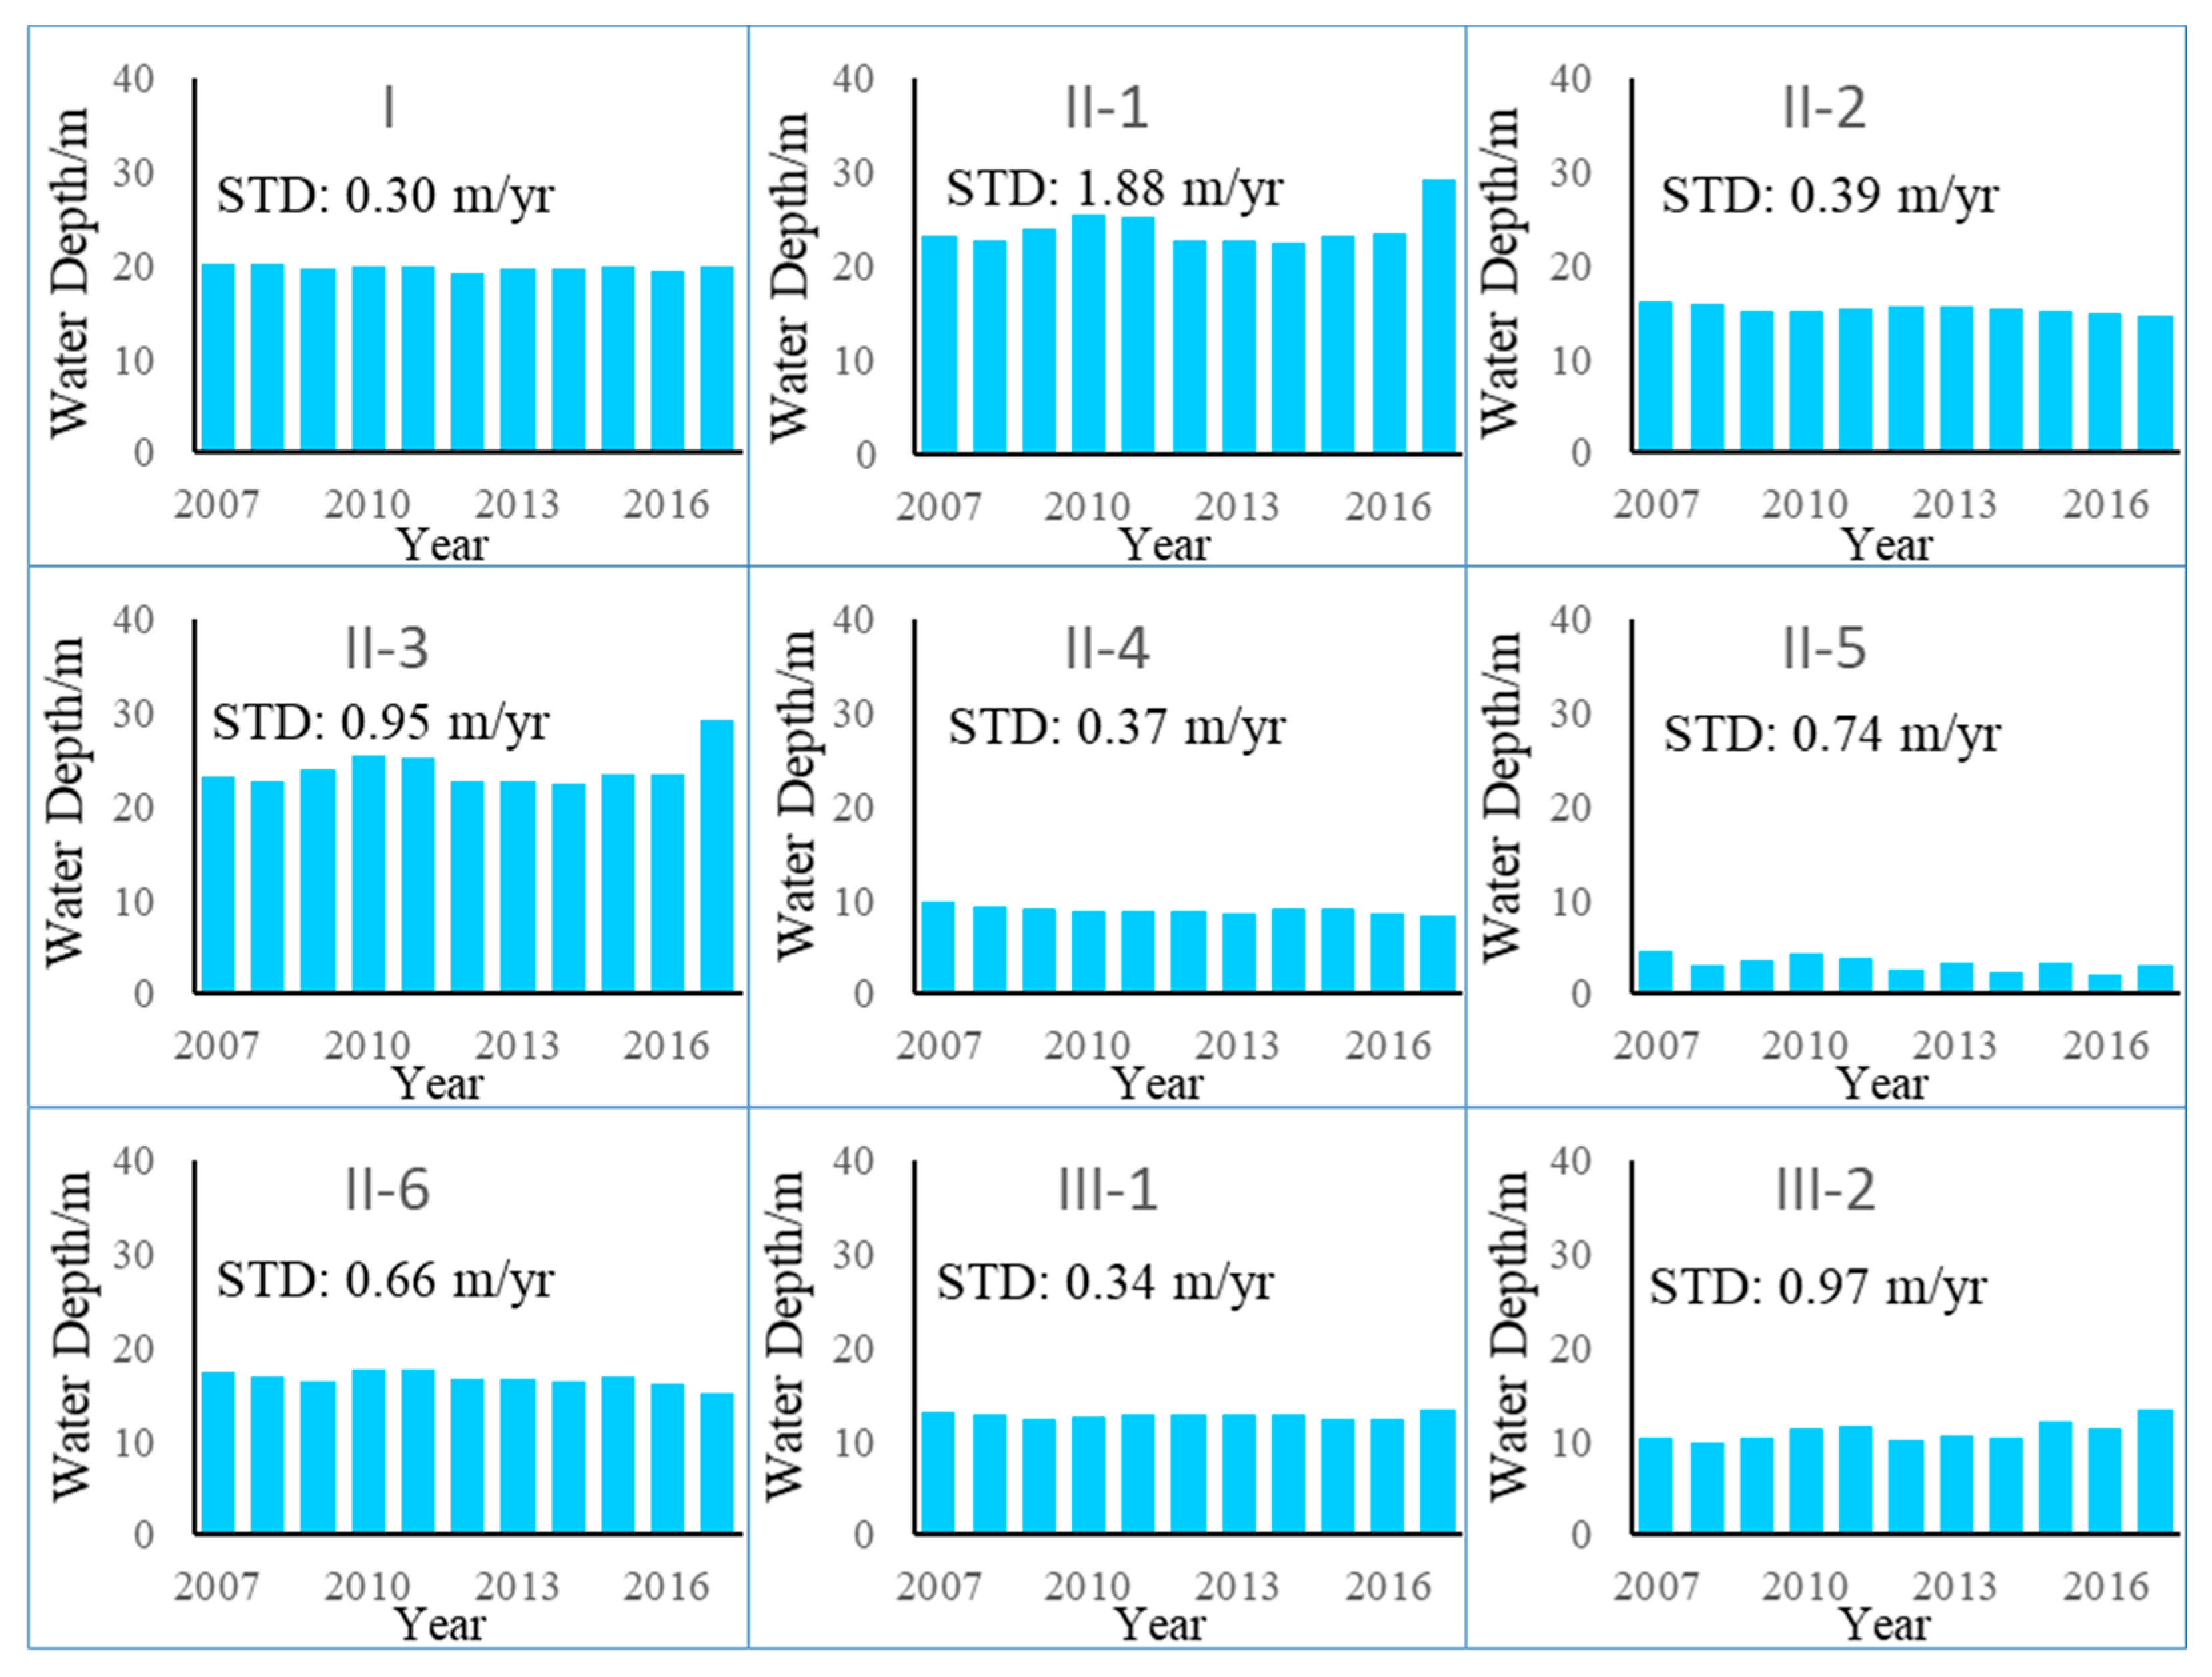
To better understand the law of groundwater changes, we analyzed the groundwater depth of the different hydrogeological zones in Figure 2a (Figure 9). We performed the Kriging interpolation method on the observation wells located in the same hydrogeological area to obtain the average groundwater depth of the hydrogeological zone. We calculated the unconfined and confined groundwater depth of each hydrogeological subarea for comparative analysis. The calculation results showed that the groundwater depth in the three hydrogeological zones (I, II-1, and II-3) was relatively high, and the groundwater depth of these hydrogeological zones reached 20 m, and some were even higher. It is worth mentioning that the groundwater depth in II-1 and II-3 in 2017 increased significantly compared with the previous year. These sudden changes indicated that groundwater was affected by some external factors. The I hydrogeological zone is located in the far north, and its groundwater depth remained stable. According to the II-2, II-6, and III-1 hydrogeological zones, the groundwater depths were between 10 and 20 m, and the depth of groundwater decreased slightly for many years. In contrast, the groundwater depth of the III-2 hydrogeological zone, the southernmost, was about 10 m, and there had been a slight increase over the 2007–2017 period. The shallowest water depths were found at II-4 and II-5, and most of them were less than 10 m deep.
In general, the depth of groundwater in different hydrogeological zones is related to altitude. At high altitudes, the groundwater depth is relatively large, while at lower altitudes, the groundwater level is shallow. However, we did observe some exceptions; for example, the altitude of areas II-4 and II-5 should not be lower than that of area III-2, but the groundwater depth of the former was shallower than that of the latter. This might be due to the large area of III-2, which involves more terrain at different altitudes. Therefore, when the average groundwater level was calculated, the water depth would be large.
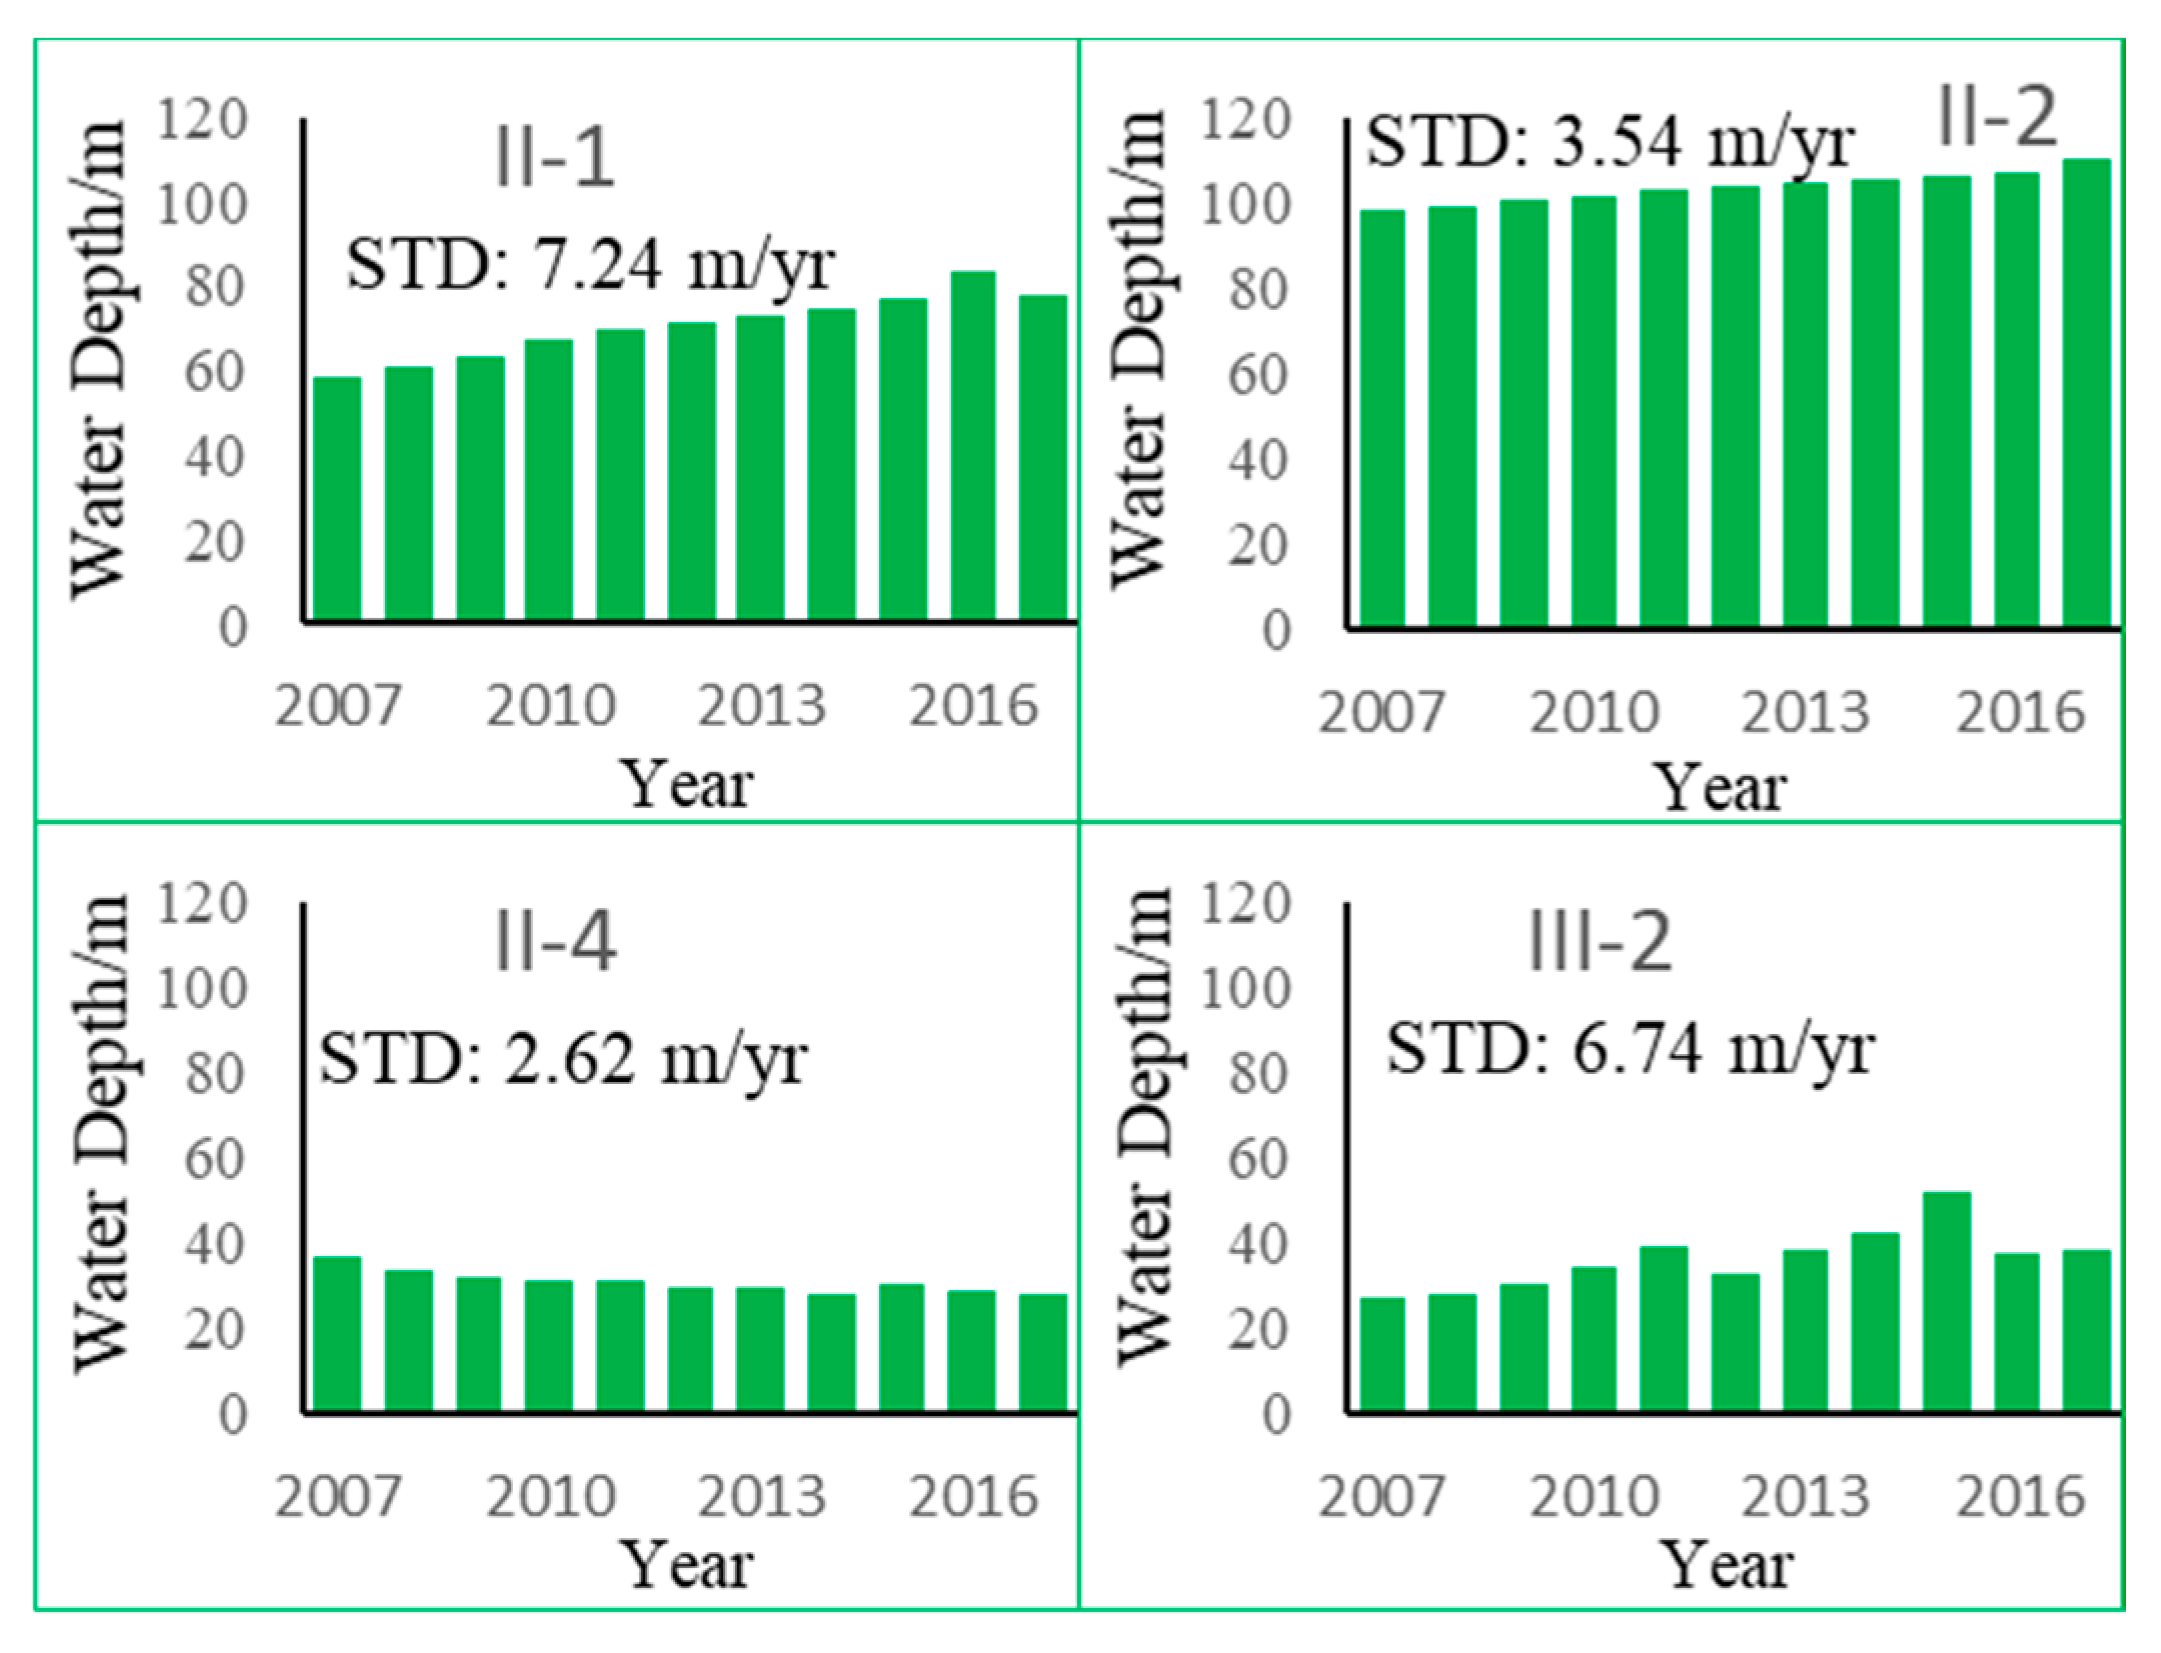
Because of their different geological structures, there were no confined aquifers in some hydrogeological zones, such as I, II-5, II-6, and III-1. Moreover, there were no confined aquifer observation wells in II-3, and thus only the confined water buried depths of II-1, II-2, II-4, and III-2 were analyzed in this paper (Figure 10). The groundwater depths of II-1 and II-2 were deeper than those of II-4 and III-2. The groundwater depth in the II-1 and II-2 hydrogeological areas exceeded 50 m; in particular, the groundwater depth in the II-2 hydrogeological zone even exceeded 100 m, and the groundwater depths in these two hydrogeological units showed an increasing trend. For comparison, the groundwater depths of the II-4 and III-2 hydrogeological zones did not exceed 50 m, and the groundwater depth of the II-4 hydrogeological zone was even lower than 40 m. A decreasing trend of groundwater depths was observed in these zones. However, the groundwater depth of the II-4 hydrogeological zone showed a fluctuating increase.
In general, the groundwater depth of confined aquifers in hydrogeological units increases with altitude. Unlike non-confined aquifers, the depth of groundwater levels in confined aquifers in most hydrogeological units had an increasing trend. An increase in the depth of a confined aquifer indicated a decrease in the groundwater table of the confined aquifer, which would cause an imbalance in the recharge and drainage of the confined water and cause some groundwater ecological environmental risks.

3.4. Driving Factors of Groundwater Depth Changes

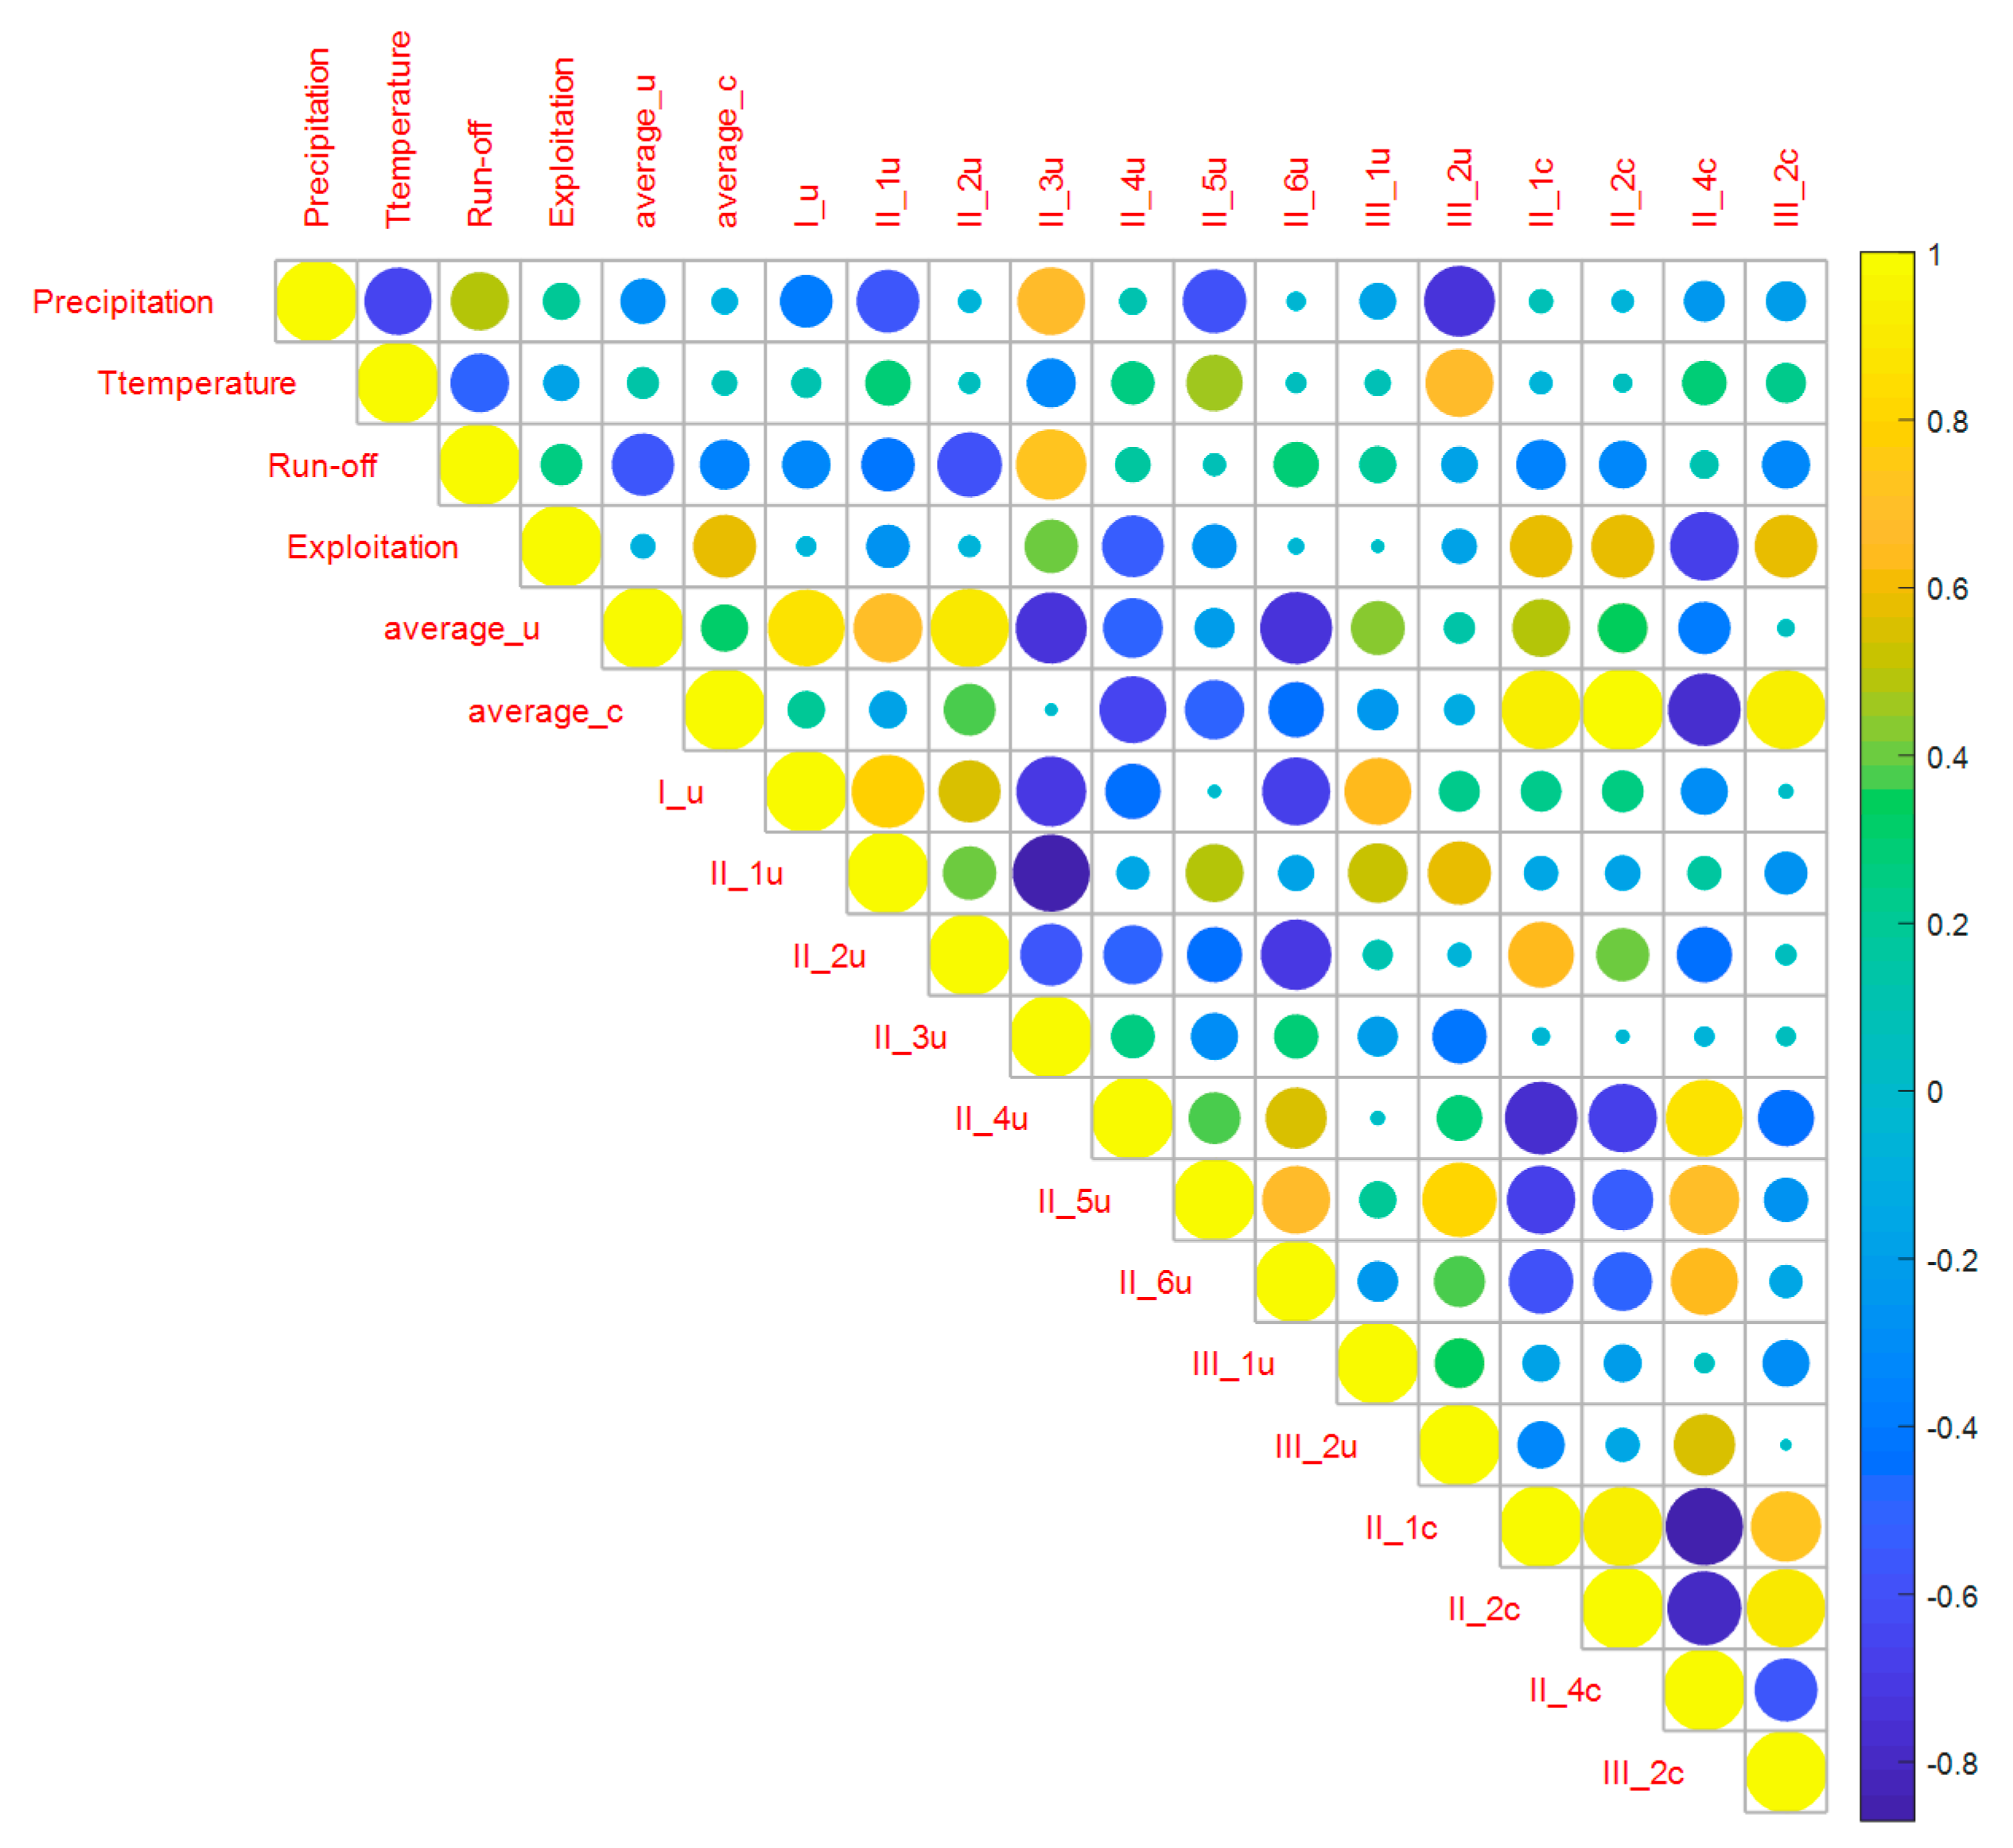
The average water depth sequence in the UPABC and different hydrogeological zones of the unconfined and confined water was used for correlation and regression analysis with factors affecting groundwater depth, such as precipitation from Baotou Station, evaporation (temperature), groundwater exploitation, and the Yellow River runoff as the influencing factors (Figure 11).
For the unconfined and confined average water depth in the UPABC, the amount of groundwater exploitation and runoff of the Yellow River were the two most important factors. In different hydrogeological regions, the influence of the Yellow River and groundwater exploitation on the depth of unconfined and confined water was different. Groundwater exploitation had a strong correlation with the groundwater depth of confined aquifers in each hydrogeological zone, but it was not sensitive to unconfined aquifers. However, the runoff of the Yellow River was the opposite, being more sensitive to the groundwater depth of unconfined aquifers than confined aquifers.
Moreover, the Yellow River runoff was strongly correlated with precipitation, which might be one of the reasons for the weak correlation between precipitation and groundwater depth. In other words, only a part of the precipitation infiltrated the groundwater, and the other part of the precipitation became a part of the Yellow River runoff with the urbanization and hardening of the underlying surface.
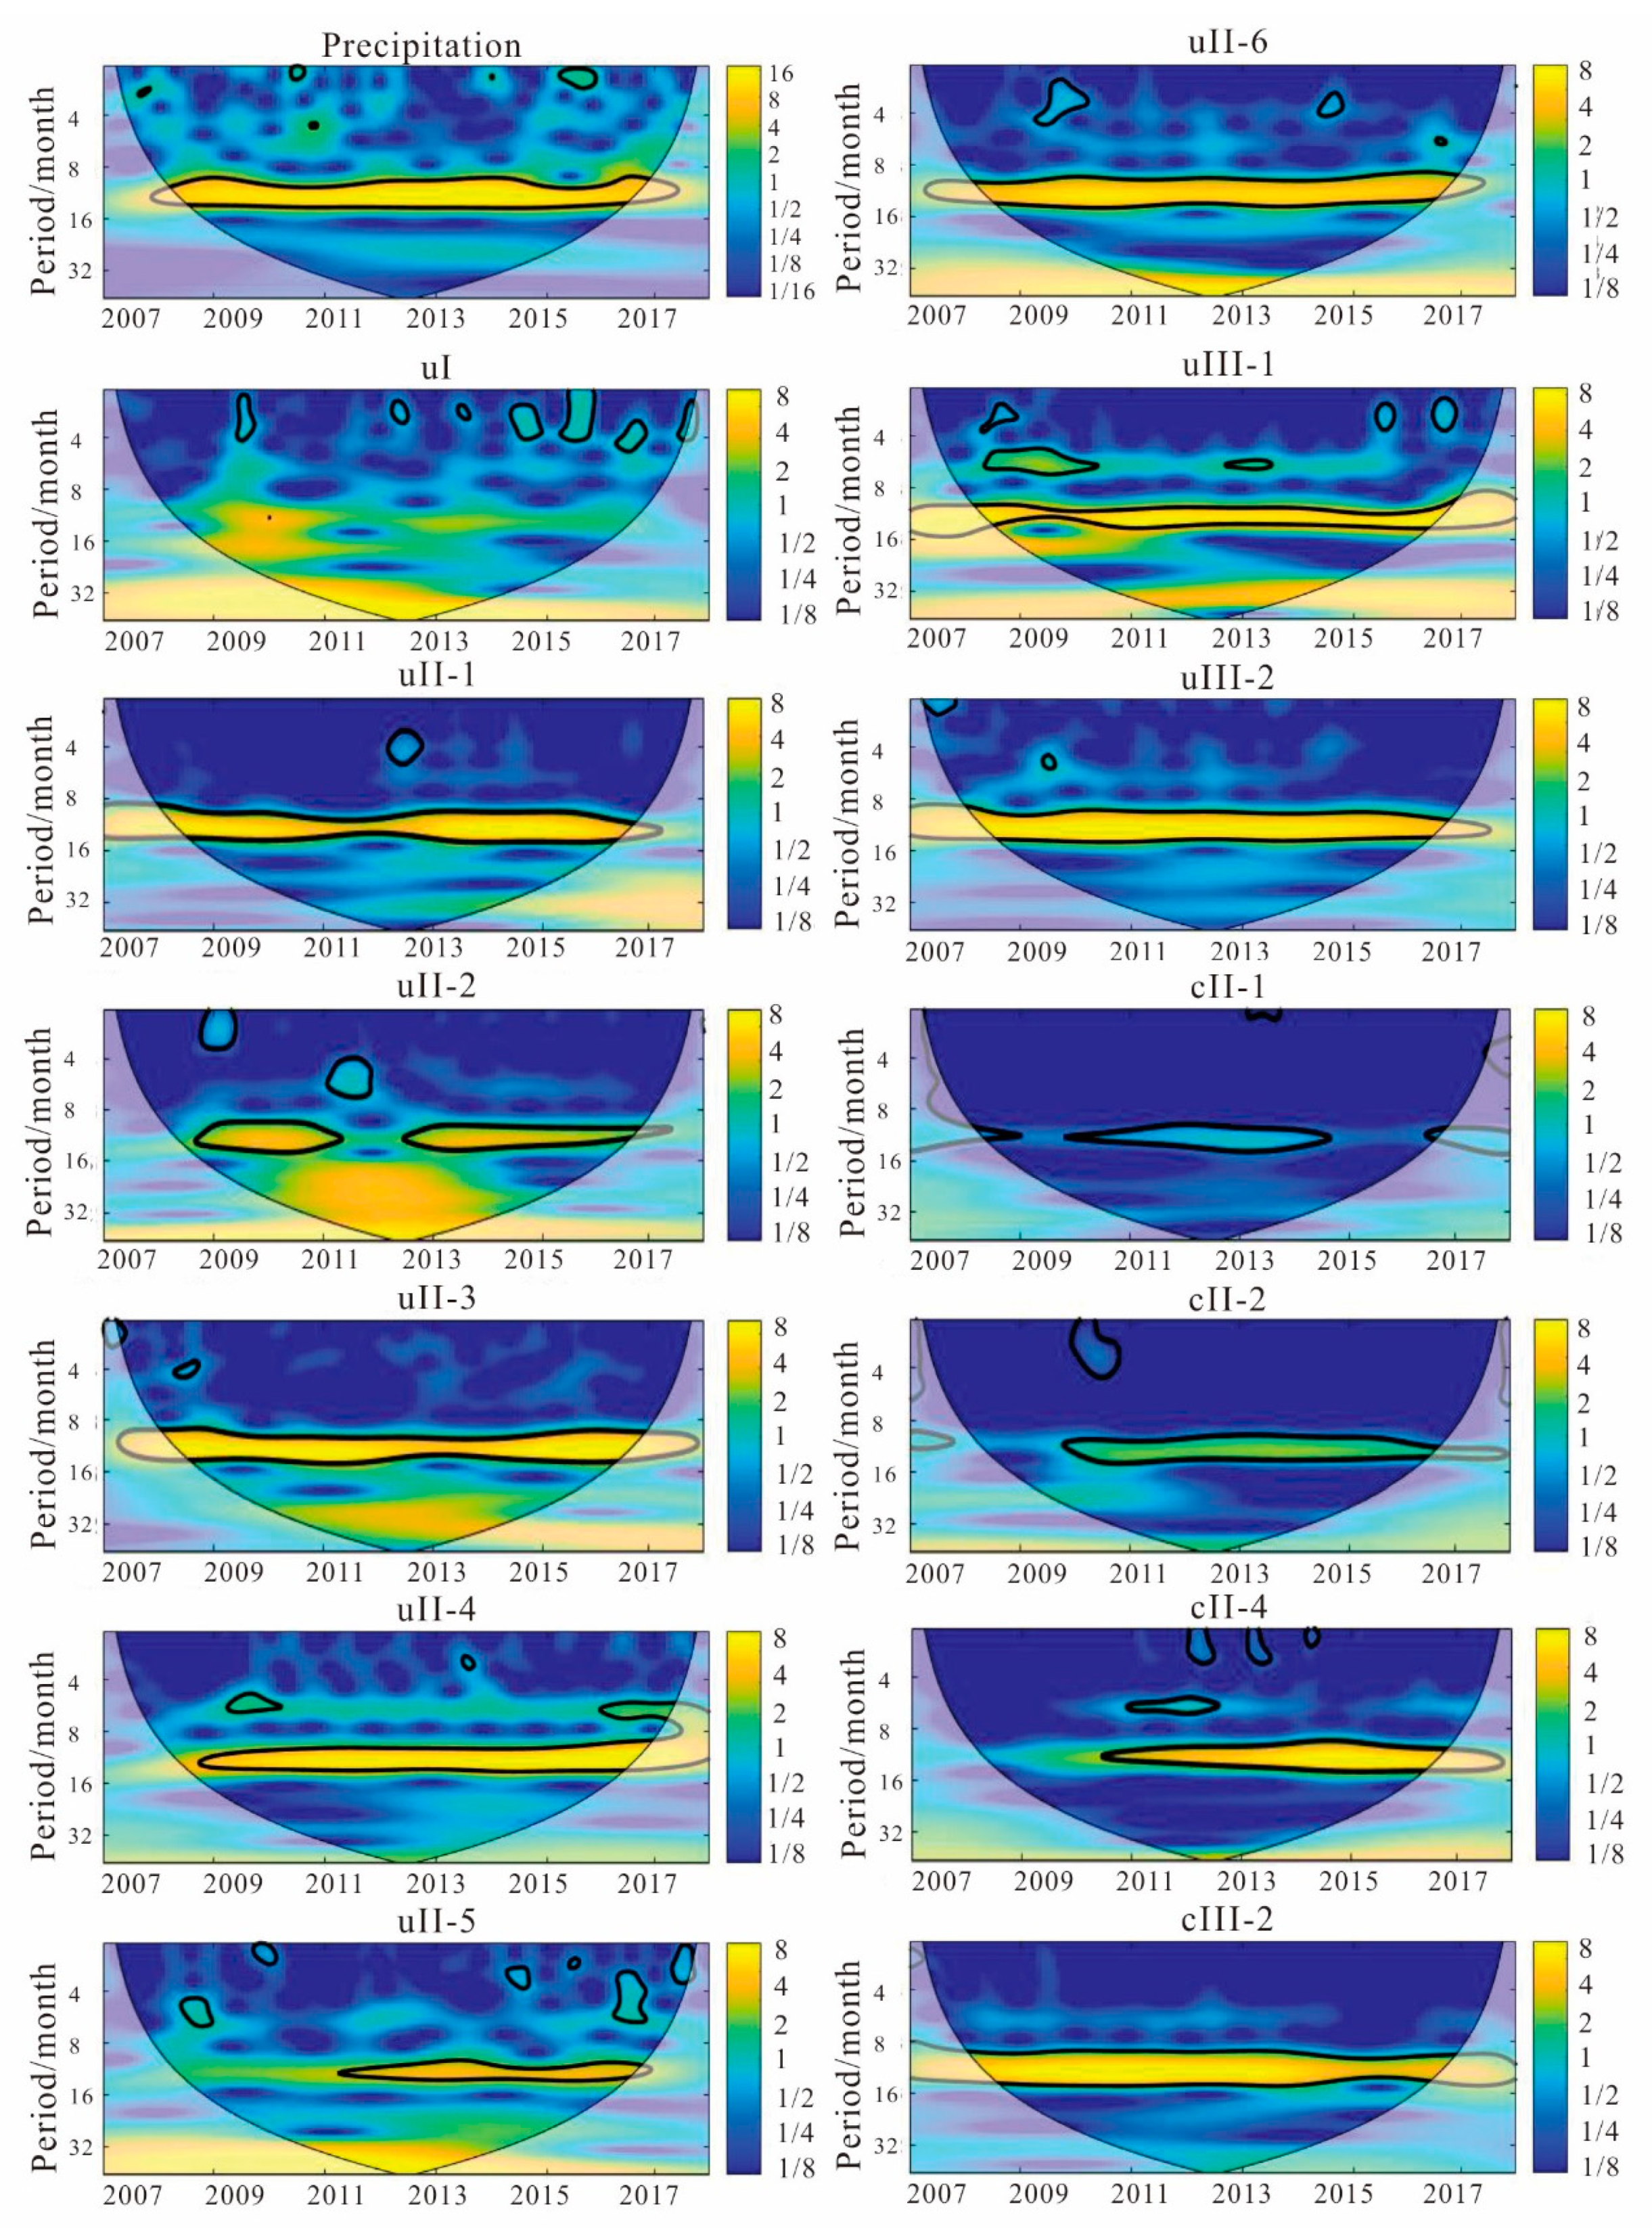
Continuous Wavelet Transform (CWT) was performed on the observed data of precipitation and groundwater depth in different hydrogeological zones in the UPABC (Figure 12).
Figure 12 shows that there was a main oscillation period of 9 to 14 months in the dynamics of precipitation in the UPABC, and it passed the 95% red noise test from 2008 to 2016 and had a significant frequency-domain periodic characteristic. The high-frequency part was mainly concentrated on the period scale of 1 month, but the oscillation was not continuous, and it covered a short time domain and did not have significant periodic characteristics.
The depth of groundwater in different hydrogeological zones showed different oscillation cycles. The main oscillation period of groundwater depth in most hydrogeological zones, except for the I hydrogeological zone, was between 9 and 14 months, and it passed a 95% red noise test from 2009 to 2016 and had significant frequency-domain periodic characteristics. The high-frequency part was mainly concentrated on the period scale of 1–4 months in these areas, but the oscillation was not continuous, and the time domain covered was short and did not have significant periodic characteristics.
For the I hydrogeological zone, there was an oscillation period only in the high-frequency part on a period scale of 1–4 months, but the oscillation was not continuous and covered a short time domain, which did not have significant periodic characteristics. The main oscillation periods of the unconfined water depth were in the II-2, II-4, and II-5 hydrogeological zones, and for the confined water depth, were in the II-1, II-2, and II-4 hydrogeological zones. This reflected that their periodicity only appeared in a certain period. Generally speaking, the groundwater depth of unconfined water is longer than that of confined water, and the depth of groundwater is longer in the plain area than in the hilly area.
To further study the relationship between precipitation and groundwater depth, we analyzed the correlation between precipitation and groundwater depth in different hydrogeological zones. Correlation analysis in the time and frequency domains could be performed using XWT and WTC.
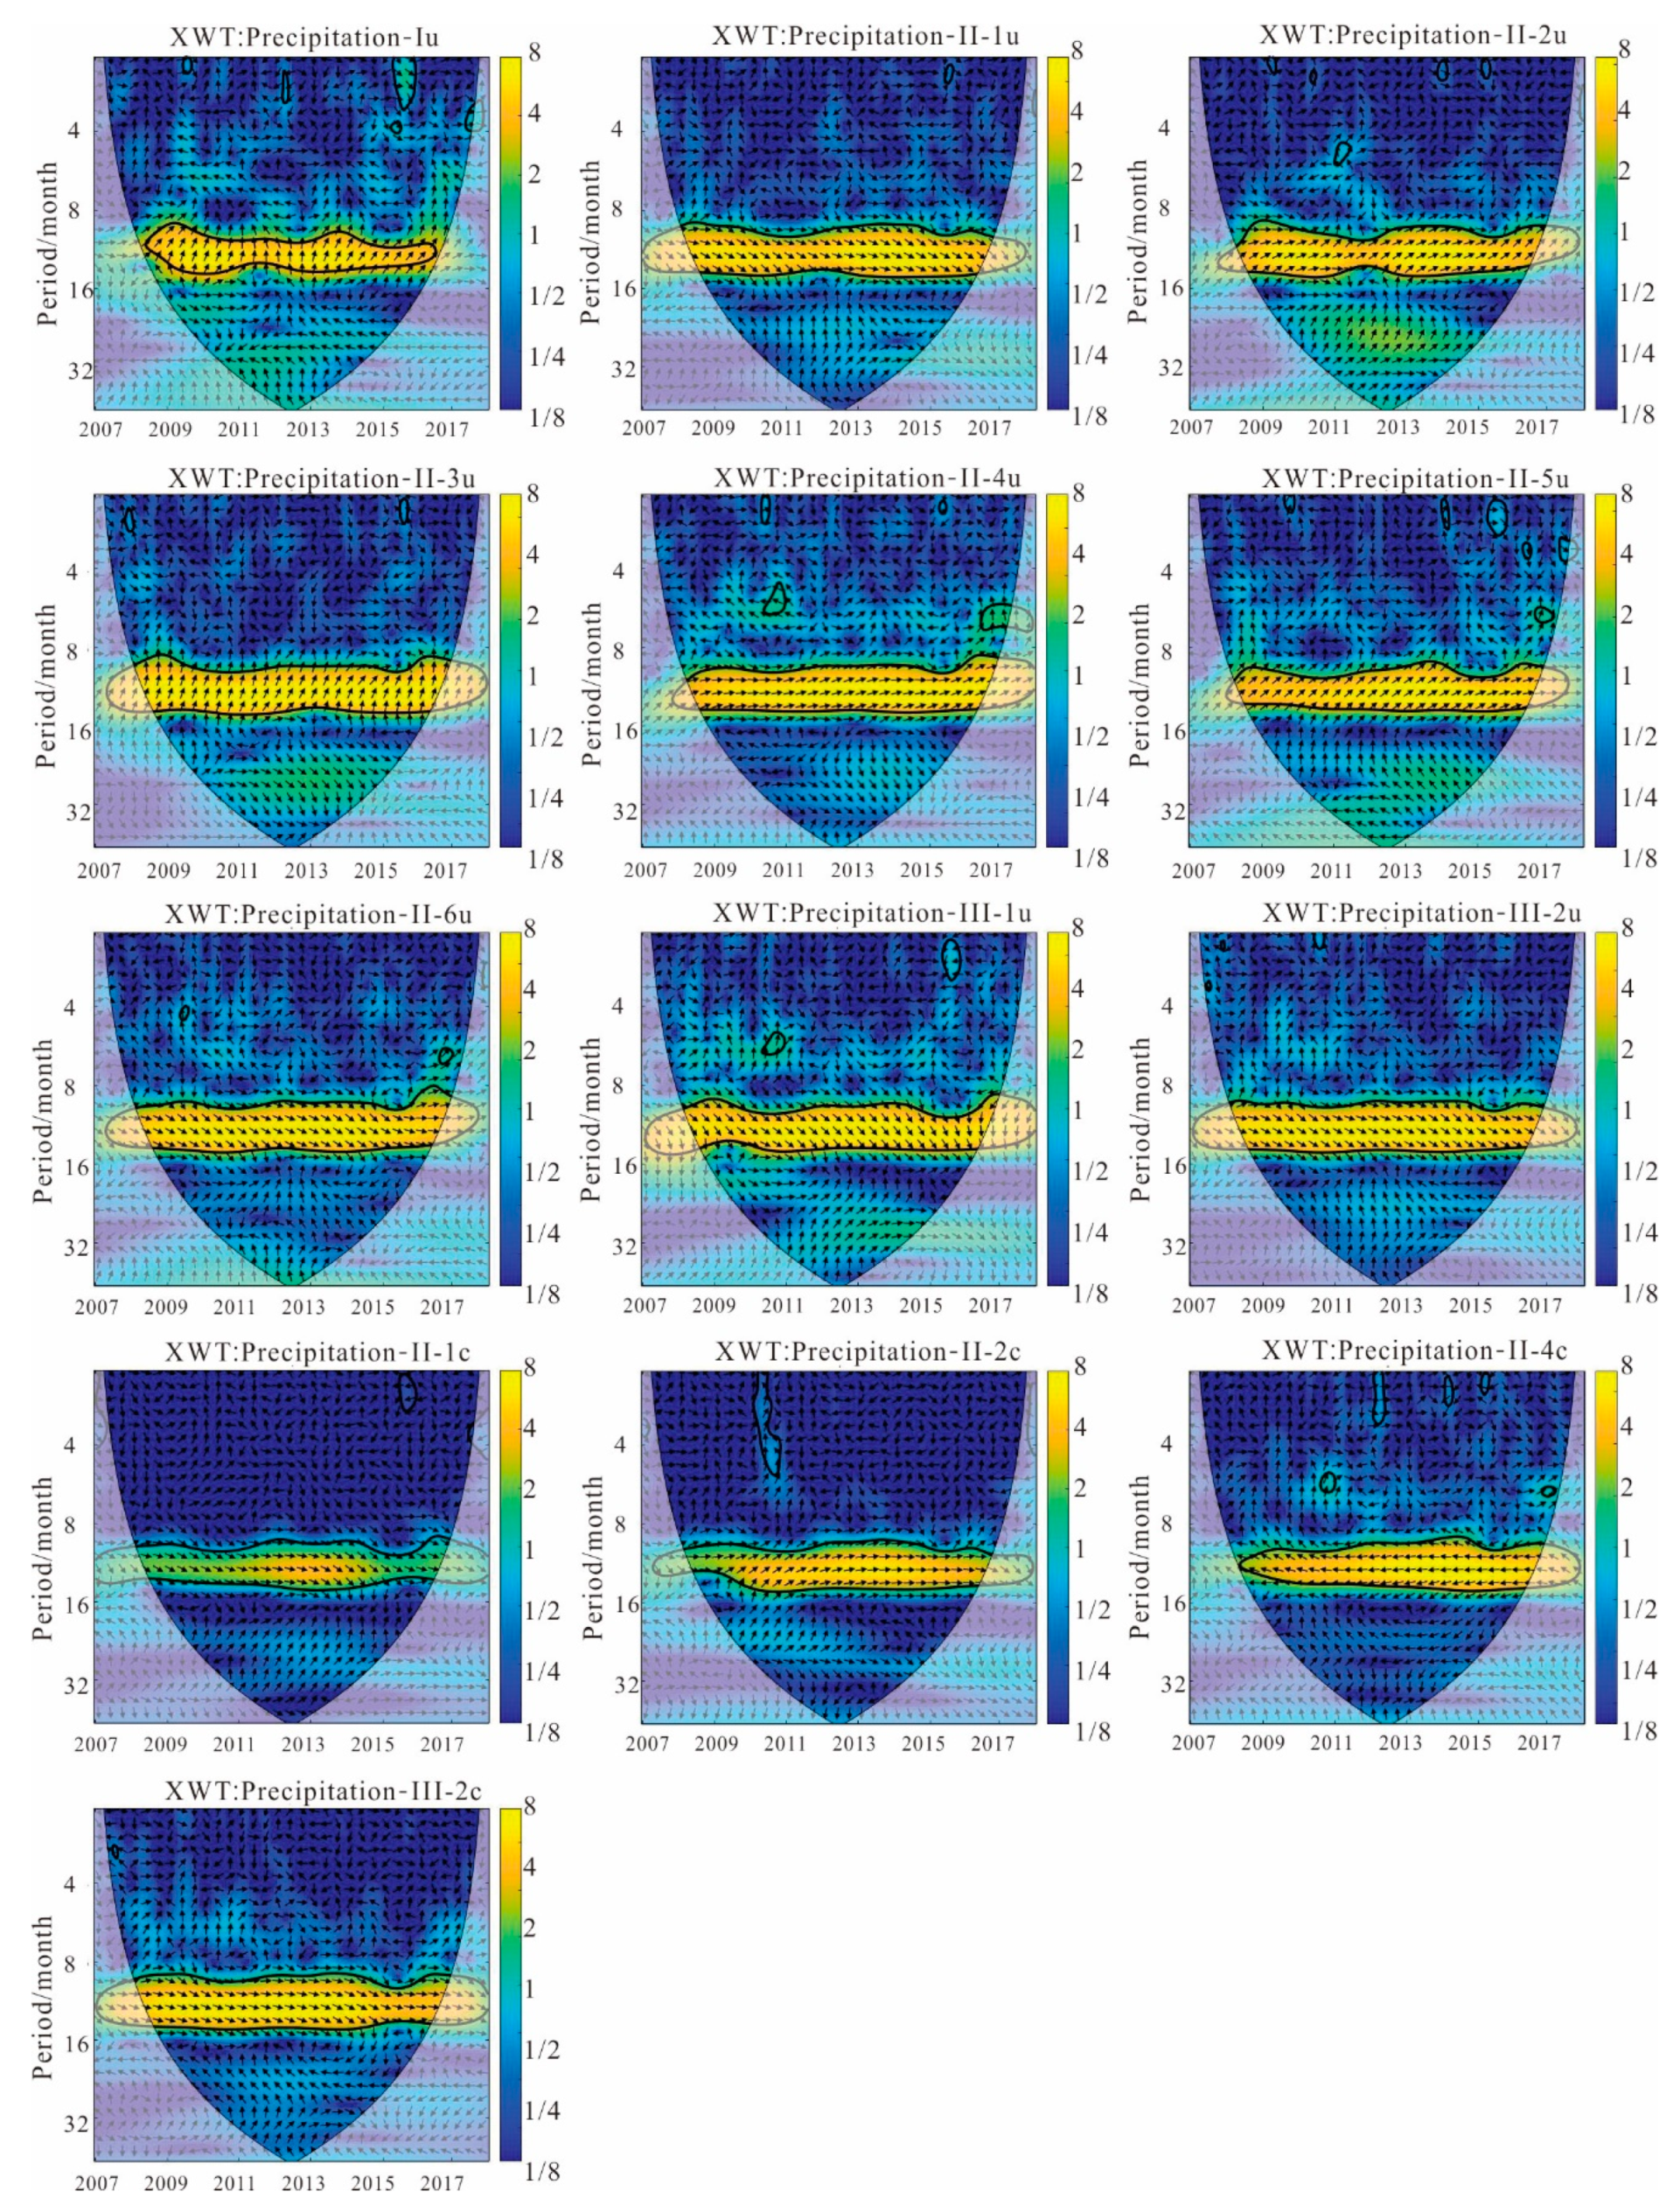
The precipitation data and the water level data of the groundwater depth dynamic observation points of 13 different hydrogeological zones and different aquifers were, respectively, matched into point pairs. The XWT results are shown in Figure 13. The correlation periods of precipitation and groundwater depth in each hydrogeological zone were mostly 9–14 months, and the difference among hydrogeological zones was not obvious. From the phase angle analysis of the lag time of precipitation to groundwater depth, it was found that for unconfined water, the lag response time of Iu, II-2u, II-3u, and II-5u was shorter than II-1-u, II-6u, III-1u, and III-2u. For confined water, the correlation of groundwater in various hydrogeological zones to precipitation was weakened compared with unconfined water, and the response period increased.
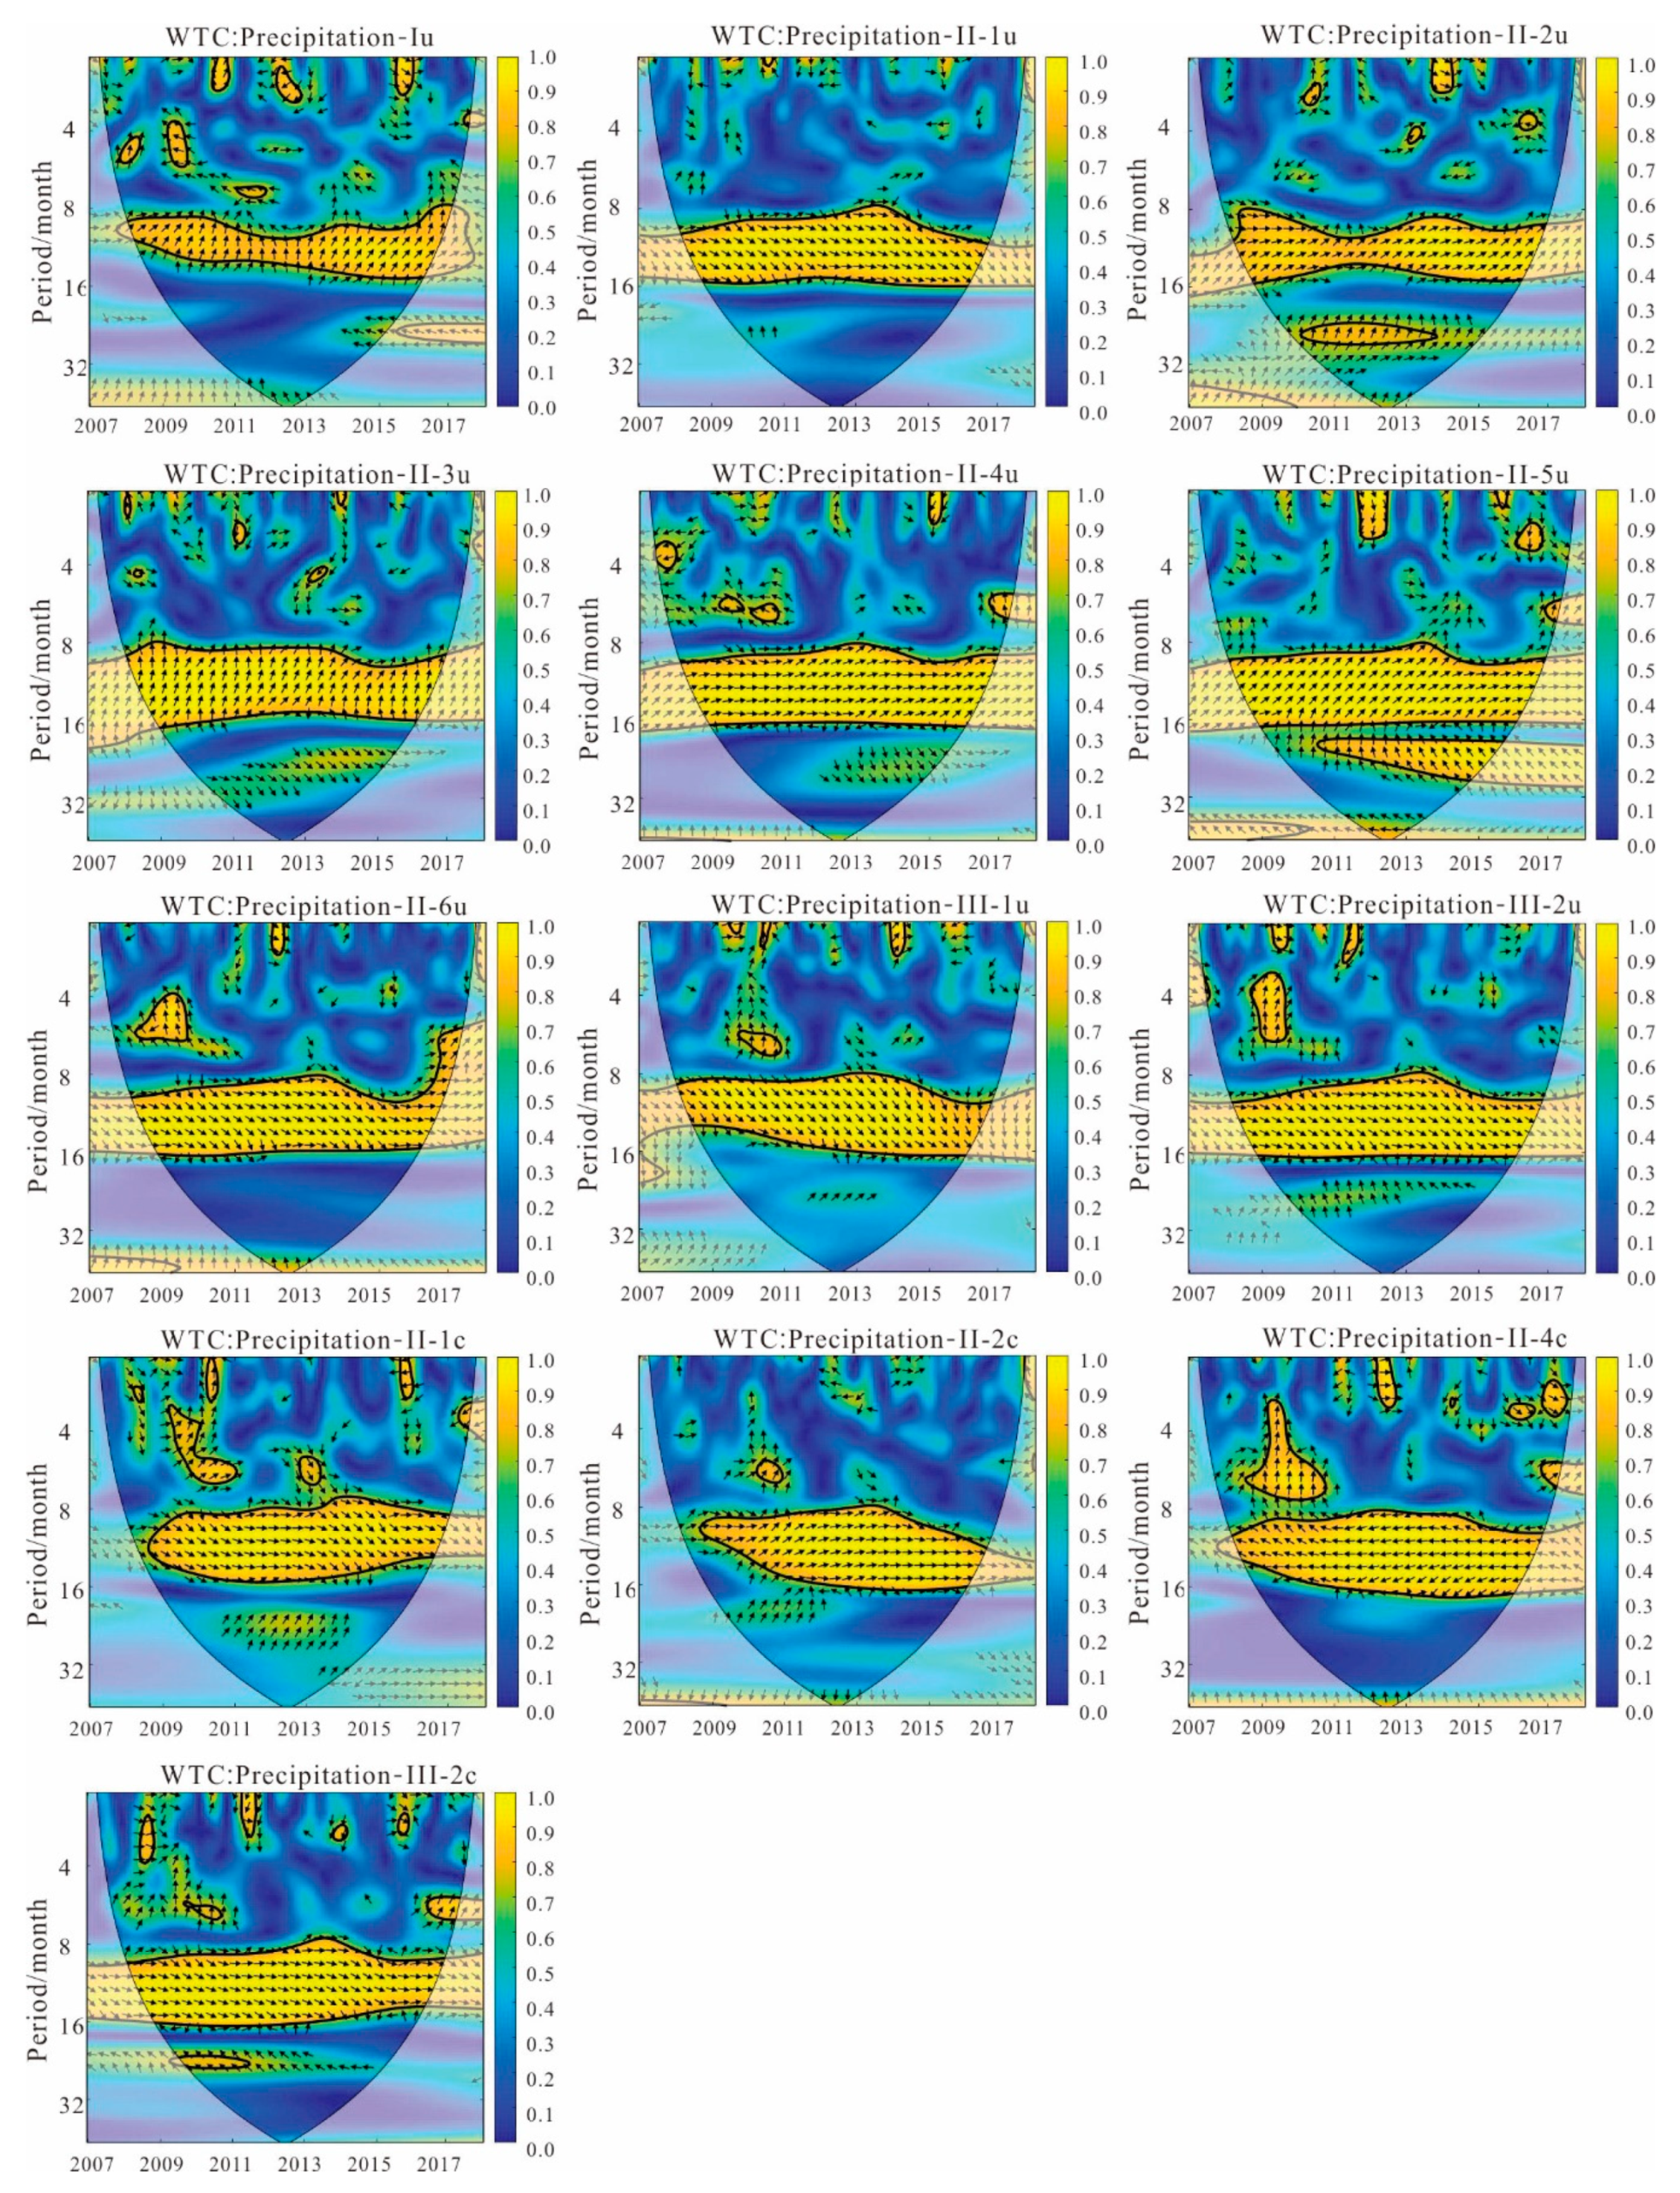
WTC is another tool for discovering the coherence of cross-wavelet power in time–frequency space. Even if the corresponding region of the low energy value of the XWT power spectrum is small, the correlation in the wave coherence spectrum may be significant. The results of WTC analysis (Figure 14) showed that the subsequent period of the unconfined water response to precipitation in the hydrogeological zone I was 8–14 months, which was shorter than that of other hydrogeological zones. The WTC results also showed that there was a lag response period of more than 16 months for unconfined water in the II-2 and II-5 hydrogeological zones and the confined water in the III-2 hydrogeological zone. The depth of groundwater in all hydrogeological zones was below the response period of 4 months, but they were discontinuous and not significant.

4. Discussion

4.1. Drivers of Change in and Sustainability of the Groundwater System

As shown in Figure 7, the rate of incline of water depth in confined water had been relatively stable for many years, and the fluctuation of unconfined water depth was large. This indicated that the unconfined water depth was more strongly affected by external influences than the confined water, which was related to the relative change of precipitation and evaporation in adjacent years. Because the depth of the unconfined water level is small, the extent of changes in the evaporation of soil water that is affected by precipitation recharge and temperature is greater than that of confined water [36,48]. As shown in Figure 11, the water depth of the unconfined aquifer was sensitive to precipitation, Yellow River runoff, and groundwater exploitation. Because of its shallow depth, the unconfined aquifer is affected by climate change and human activities. However, for confined water, water depth changes are mainly affected by precipitation and groundwater exploitation. The results of this study showed that the depth of unconfined water in most areas had remained the same or decreased, whereas the depth of confined water in most areas increased significantly. This was because the depth of unconfined water is generally shallow, it is recharged more by precipitation and surface runoff, and the unconfined water is less developed and utilized, resulting in the unconfined water being able to reach a balance between consumption and recharge. However, the depths of confined water are large in most areas and are rarely recharged by precipitation. At the same time, because of the good water quality and a large amount of water, the use of confined water is large. This has caused the confined water consumption to be greater than the recharge amount, and the confined water aquifer could not reach a balance between recharge and consumption. These reasons have led to the continual decline of confined water levels and the risk of sustainable use of groundwater resources. The weak correlation between precipitation and groundwater depth indicates that precipitation recharges groundwater less. This may be due to the slope of the terrain and the hardening of the underlying surface by urbanization in UPABC, which causes some precipitation to flow to the Yellow River in the south to form runoff. Therefore, the amount of groundwater exploitation is the main factor in the change of groundwater depth [48,49,50]. A highly significant positive correlation was found between the rate of groundwater exploitation and monitored groundwater depths in the confined aquifer type in most confined hydrogeological zones, which implied the long-term risk in areas relying on access to this resource. The shortage of water resources in Baotou, especially the scarcity of surface water, has led to the unavoidable exploitation of confined water. However, the amount of groundwater recharge by precipitation was less than the amount of groundwater withdrawal, and the recharge lag time was longer (Figure 13). As shown in Figure 14, in hydrogeological areas with coarse sand, deep aquifers, and high altitudes (II-2u, II-3u, II-4u, and II-5u), the recharge of groundwater by precipitation lasted a long time, even up to 25 months. For confined water aquifers, the depth of groundwater did not respond to precipitation in all years (II-1c, II-2c, and II-4c in Figure 14), which indicated that confined water had a weaker response than unconfined water to precipitation. The above analysis revealed that the confined water reached a serious imbalance between water withdrawal and recharge, especially in hydrogeological areas with coarse sand, deep aquifers, and high altitudes; these places also happened to be highly concentrated urban areas. To restore the balance of groundwater recovery and ensure the sustainable development of groundwater utilization, the UPABC and other urban planning areas in arid and semi-arid regions should develop long-term policies to reduce the amount of confined groundwater, such as replacing it with surface water, reclaimed water, or other water sources. If necessary, water withdrawal from external sources, such as the Yellow River, should be increased.

4.2. Comparison with Other Studies in Groundwater Level Drivers

Comparing the variation in the water area obtained in this paper with the results of other scholars, we found that the law of change is consistent. Liao et al. [51] showed that regardless of whether it is a high water year or a low water year, the change of the recharge term caused by rainfall changes has a great impact on the change of groundwater level, and when there is less precipitation, the interference of human mining activities on the groundwater level becomes more apparent. This could further indicate that the results of this study were accurate.
Additionally, a more detailed study of groundwater depth response to precipitation was presented in this paper, and the research content was more substantial. Liao et al. [51] used dry years and high years as two different precipitation scenarios and studied the changes in groundwater levels in UPABC under different rainfall conditions. In this study, we divided the UPABC into nine regions according to different hydrogeological divisions and studied the effect of precipitation on groundwater depth under different hydrogeological structures. More importantly, we studied the hysteresis of precipitation to groundwater recharge through XWT and WTC, which was more suitable for us to understand the evolution mechanism of groundwater in UPABC.
To date, most researchers [49,52,53] have used the correlation analysis and cross wavelet methods to assess the groundwater response to precipitation. In this paper, we added WTC to analyze the lag effect of groundwater on precipitation. As shown in Figure 13 and Figure 14, WTC could find weaker areas where cross wavelets are difficult to find. Moreover, we further considered the impact of human activities on groundwater to assess the risk of groundwater use. Based on the above analysis, in this study, the groundwater depth trend was more accurate, and the analysis of factors affecting groundwater depth was more reasonable and detailed.

4.3. Key Lessons, Limitations, and Prospects

Many studies have highlighted precipitation and evaporation as possible causes for the changes in groundwater depth and have shown that the impact of human activities on groundwater depth is increasing [48,49,50]. However, the reasons for the increase in human activities, especially in cities in the arid regions, have been less accurately analyzed. In this article, we showed that agricultural irrigation water was the main reason for the decline of groundwater depth in human activities (Figure 6), and this phenomenon was quite severe even in cities. Because of the excessive use of confined water by agricultural activities, the response of groundwater use to groundwater depth was stronger than the response of precipitation replenishment and temperature-induced evaporation (Figure 11). This would cause groundwater use to exceed recharge depth, leading to long-term risks of insufficient groundwater recharge. Therefore, agricultural irrigation systems in cities in arid regions with similar conditions should be upgraded to use more water-saving equipment for irrigation. At the same time, surface water, externally-diverted water, and reclaimed water should be added for agricultural irrigation, thereby reducing groundwater use. It is expected that the groundwater system will reach a state of equilibrium in consumption and recharge.
The research in this paper also had certain limitations. On the one hand, the number of monitoring stations for precipitation in this study was small, and there was only one meteorological monitoring station in the study area. Although the area of the study area was small, the number of monitoring stations would still cause certain deviations in the analysis of groundwater depth in different hydrogeological regions. On the other hand, the research in this paper did not include a study of the hydraulic relationship between surface water and groundwater in the study area. The hydraulic connection between surface water and groundwater is complex and requires more and longer-term surface water and groundwater monitoring points and more complicated research methods. The change in the hydraulic connection between surface water and groundwater caused by surface hardening caused by urbanization is very important for the study of groundwater level response. We hope to have the opportunity to study this in the future.
The methods in this paper could be used to study groundwater in regions with similar climates and different regions. The findings of this study revealed that excessive consumption of confined water in areas with water shortages might cause long-term sustainable water use risks, which needs to be brought to the attention of managers. This might give some experience in studying climate-like regions, and the results of this article would also have some references to climate-like regions.

5. Conclusions

In this paper, the Mann–Kendall test was used to analyze trends and abrupt change points in precipitation, temperature, and groundwater depth. The Pearson correlation method was used to analyze the main factors affecting groundwater depth, and the CWT, XWT, and WTC were used to analyze groundwater depth response to precipitation and lag time. To explore the main influencing factors of groundwater depth, some groundwater management methods were proposed to provide experience for similar areas. Overall, this study provided the following conclusions:
(1)
The annual precipitation changed slowly, the overall trend showed an increasing trend, and the possible abrupt change points of the annual precipitation sequence appeared in 1984. Moreover, the overall trend of temperature was increasing, and the regional climate was warming; possible abrupt change points of the annual average temperature sequence appeared in 1993. Furthermore, groundwater consumption increased, with the majority used for agricultural consumption.
(2)
The groundwater depth of both unconfined and confined water was increasing, and there were slight differences in groundwater changes in different hydrogeological zones. There was no abrupt change point in unconfined water depth from 2007–2017, and the abrupt change point in confined water depth occurred in 2011.
(3)
The biggest impact on groundwater depth was precipitation and mining volume. The lag time of groundwater depth response to precipitation was about 9–14 months, and agricultural water had the biggest impact on groundwater depth. In the future, agricultural water-saving facilities should be promoted in similar areas, and multiple sources of water should be used instead of groundwater for agricultural irrigation.

Author Contributions

Conceptualization, Y.W.; Data curation, Y.C., X.X., Y.S., and H.L.; Formal analysis, Y.W., Z.L., and Y.S.; Funding acquisition, Y.W. and X.X.; Methodology, Y.C., Z.L., and Y.S.; Project administration, Y.W. and X.X.; Resources, H.L.; Writing—original draft, Y.C.; Writing—review and editing, Y.C. All authors have read and agreed to the published version of the manuscript.

Funding

The study was financially supported by the Basic Scientific Research Foundation Special Project of the Institute of Water Resources and Hydropower Research (MK2019J06, MK2017J01), the Major Science and Technology Program for Water Pollution Control and Treatment (2018ZX07110001), the National Natural Science Foundation of China (41807215, 51609153), the National Divided Water Resource Fee Project (126301001000150003).

Acknowledgments

We acknowledge reviewers who helped us in the review process.

Conflicts of Interest

The authors declare no conflict of interest.

References

  1. Giordano, M. Global Groundwater? Issues and Solutions. Annu. Rev. Environ. Resour. 2009, 34, 153–178. [Google Scholar] [CrossRef]
  2. Döll, P.; Hoffmann-Dobrev, H.; Portmann, F.; Siebert, S.; Eicker, A.; Rodell, M.; Strassberg, G.; Scanlon, B.R. Impact of water withdrawals from groundwater and surface water on continental water storage variations. J. Geodyn. 2012, 59, 143–156. [Google Scholar] [CrossRef]
  3. Castellazzi, P.; Martel, R.; Galloway, D.; Longuevergne, L.; Rivera, A. Assessing Groundwater Depletion and Dynamics Using GRACE and InSAR: Potential and Limitations. Ground Water 2016, 54, 768–780. [Google Scholar] [CrossRef] [PubMed] [Green Version]
  4. Çelik, R. Temporal changes in the groundwater level in the Upper Tigris Basin, Turkey, determined by a GIS technique. J. Afr. Earth Sci. 2015, 107, 134–143. [Google Scholar] [CrossRef]
  5. Narany, T.S.; Aris, A.Z.; Sefie, A.; Keesstra, S. Detecting and predicting the impact of land use changes on groundwater quality, a case study in Northern Kelantan, Malaysia. Sci. Total. Environ. 2017, 599, 844–853. [Google Scholar] [CrossRef]
  6. Rahmani, S.E.A.; Chibane, B.; Boucefiène, A. Groundwater recharge estimation in semi-arid zone: A study case from the region of Djelfa (Algeria). Appl. Water Sci. 2016, 7, 2255–2265. [Google Scholar] [CrossRef] [Green Version]
  7. Scanlon, B.R.; Keese, K.E.; Flint, A.L.; Flint, L.E.; Gaye, C.B.; Edmunds, W.M.; Simmers, I. Global synthesis of groundwater recharge in semiarid and arid regions. Hydrol. Process. 2006, 20, 3335–3370. [Google Scholar] [CrossRef]
  8. Huang, X.; Deng, H.; Zheng, C.; Cao, G. Hydrogeochemical signatures and evolution of groundwater impacted by the Bayan Obo tailing pond in northwest China. Sci. Total. Environ. 2016, 543, 357–372. [Google Scholar] [CrossRef]
  9. Kumar, C.P. Climate Change and Its Impact on Groundwater Resources. Research Inventy: International. J. Eng. Sci. 2012, 1, 43–60. [Google Scholar]
  10. Arnell, N.W. Relative effects of multi-decadal climatic variability and changes in the mean and variability of climate due to global warming: Future streamflows in Britain. J. Hydrol. 2003, 270, 195–213. [Google Scholar] [CrossRef]
  11. Crosbie, R.S.; McCallum, J.L.; Walker, G.R.; Chiew, F.H.S. Modelling climate-change impacts on groundwater recharge in the Murray-Darling Basin, Australia. Hydrogeol. J. 2010, 18, 1639–1656. [Google Scholar] [CrossRef]
  12. Mileham, L.; Taylor, R.; Todd, M.; Tindimugaya, C.; Thompson, J. The impact of climate change on groundwater recharge and runoff in a humid, equatorial catchment: Sensitivity of projections to rainfall intensity. Hydrol. Sci. J. 2009, 54, 727–738. [Google Scholar] [CrossRef] [Green Version]
  13. Gurdak, J.S.; Hanson, R.; Green, T.R. Effects of Climate Variability and Change on Groundwater Resources of the United States. In Fact Sheet; US Geological Survey: Reston, VA, USA, 2009. [Google Scholar]
  14. Green, T.R. Linking Climate Change and Groundwater. In Integrated Groundwater Management: Concepts, Approaches and Challenges; Jakeman, A.J., Barreteau, O., Hunt, R.J., Rinaudo, J., Ross, A., Eds.; Springer International Publishing: Cham, Switzerland, 2016; pp. 97–141. [Google Scholar]
  15. Liao, C.; Zhuang, Q. 2017 Regents of the University of Colorado Quantifying the Role of Permafrost Distribution in Groundwater and Surface Water Interactions Using a Three-Dimensional Hydrological Model. Arctic Antarct. Alp. Res. 2017, 49, 81–100. [Google Scholar] [CrossRef]
  16. Macdonald, A.; Calow, R.; Macdonald, D.M.J.; Darling, W.G.; Dochartaigh, B.É.Ó. What impact will climate change have on rural groundwater supplies in Africa? Hydrol. Sci. J. 2009, 54, 690–703. [Google Scholar] [CrossRef] [Green Version]
  17. Green, T.R.; Taniguchi, M.; Kooi, H.; Gurdak, J.J.; Allen, D.M.; Hiscock, K.M.; Treidel, H.; Aureli, A. Beneath the surface of global change: Impacts of climate change on groundwater. J. Hydrol. 2011, 405, 532–560. [Google Scholar] [CrossRef] [Green Version]
  18. Huang, T.; Jahan, C.S.; Edmunds, W.M. Soil profile evolution following land-use change: Implications for groundwater quantity and quality. Hydrol. Process. 2012, 27, 1238–1252. [Google Scholar] [CrossRef]
  19. Salem, G.S.A.; Kazama, S.; Shahid, S.; Dey, N.C. Impacts of climate change on groundwater level and irrigation cost in a groundwater dependent irrigated region. Agric. Water Manag. 2018, 208, 33–42. [Google Scholar] [CrossRef]
  20. Shahid, S.; Hazarika, M.K. Groundwater Drought in the Northwestern Districts of Bangladesh. Water Resour. Manag. 2009, 24, 1989–2006. [Google Scholar] [CrossRef]
  21. Taylor, R.G.; Scanlon, B.; Döll, P.; Rodell, M.; Van Beek, R.; Wada, Y.; Longuevergne, L.; Leblanc, M.; Famiglietti, J.; Edmunds, M.; et al. Ground water and climate change. Nat. Clim. Chang. 2012, 3, 322–329. [Google Scholar] [CrossRef] [Green Version]
  22. Duvert, C.; Jourde, H.; Raiber, M.; Cox, M.E. Correlation and spectral analyses to assess the response of a shallow aquifer to low and high frequency rainfall fluctuations. J. Hydrol. 2015, 527, 894–907. [Google Scholar] [CrossRef]
  23. Hocking, M.; Kelly, B.F. Groundwater recharge and time lag measurement through Vertosols using impulse response functions. J. Hydrol. 2016, 535, 22–35. [Google Scholar] [CrossRef]
  24. Sophocleous, M. Interactions between groundwater and surface water: The state of the science. Hydrogeol. J. 2002, 10, 52–67. [Google Scholar] [CrossRef]
  25. Hu, B.X.; Xu, Z. Numerical Simulation of Groundwater Flow and Solute Transport in a Karst Aquifer with Conduits. In Groundwater—Contaminant and Resource Management; IntechOpen: London, UK, 2016. [Google Scholar]
  26. Hughes, J.; Petrone, K.C.; Silberstein, R.P. Drought, groundwater storage and stream flow decline in southwestern Australia. Geophys. Res. Lett. 2012, 39. [Google Scholar] [CrossRef]
  27. Tallaksen, L.M.; Hisdal, H.; Van Lanen, H.A. Space–time modelling of catchment scale drought characteristics. J. Hydrol. 2009, 375, 363–372. [Google Scholar] [CrossRef]
  28. Castle, S.L.; Thomas, B.; Reager, J.T.; Rodell, M.; Swenson, S.C.; Famiglietti, J. Groundwater depletion during drought threatens future water security of the Colorado River Basin. Geophys. Res. Lett. 2014, 41, 5904–5911. [Google Scholar] [CrossRef] [Green Version]
  29. Rodell, M.; Velicogna, I.; Famiglietti, J. Satellite-based estimates of groundwater depletion in India. Nature 2009, 460, 999–1002. [Google Scholar] [CrossRef] [Green Version]
  30. Naumburg, E.; Mata-González, R.; Hunter, R.G.; McLendon, T.; Martin, D.W. Phreatophytic Vegetation and Groundwater Fluctuations: A Review of Current Research and Application of Ecosystem Response Modeling with an Emphasis on Great Basin Vegetation. Environ. Manag. 2005, 35, 726–740. [Google Scholar] [CrossRef]
  31. Newman, B.D.; Wilcox, B.P.; Archer, S.R.; Breshears, D.D.; Dahm, C.N.; Duffy, C.J.; McDowell, N.G.; Phillips, F.M.; Scanlon, B.R.; Vivoni, E.R. Ecohydrology of water-limited environments: A scientific vision. Water Resour. Res. 2006, 42. [Google Scholar] [CrossRef]
  32. Lite, S.; Stromberg, J. Surface water and ground-water thresholds for maintaining Populus–Salix forests, San Pedro River, Arizona. Boil. Conserv. 2005, 125, 153–167. [Google Scholar] [CrossRef]
  33. Orellana, F.; Verma, P.; Ii, S.P.L.; Daly, E. Monitoring and modeling water-vegetation interactions in groundwater-dependent ecosystems. Rev. Geophys. 2012, 50. [Google Scholar] [CrossRef]
  34. Minh, H.V.T.; Ngoc, D.; Ngan, H.; Van Men, H.; Van, T.; Tran Van, T. Assessment of Groundwater Level and Quality: A Case Study in O Mon and Binh Thuy Districts, Can Tho City, Vietnam. Naresuan Univ. Eng. J. 2016, 11, 25–33. [Google Scholar] [CrossRef]
  35. Soylu, M.E.; Lenters, J.D.; Istanbulluoglu, E.; Ii, S.P.L. On evapotranspiration and shallow groundwater fluctuations: A Fourier-based improvement to the White method. Water Resour. Res. 2012, 48. [Google Scholar] [CrossRef] [Green Version]
  36. Cui, Y.; Shao, J. The Role of Ground Water in Arid/Semiarid Ecosystems, Northwest China. Ground Water 2005, 43, 471–477. [Google Scholar] [CrossRef] [PubMed]
  37. Song, Y.; Guo, Z.; Lu, Y.; Yan, D.; Liao, Z.; Liu, H.; Cui, Y. Pixel-Level Spatiotemporal Analyses of Vegetation Fractional Coverage Variation and Its Influential Factors in a Desert Steppe: A Case Study in Inner Mongolia, China. Water 2017, 9, 478. [Google Scholar] [CrossRef]
  38. Jones, P.; Osborn, T.J.; Briffa, K.R. The Evolution of Climate over the Last Millennium. Science 2001, 292, 662–667. [Google Scholar] [CrossRef] [Green Version]
  39. Pau, S.; Wolkovich, E.M.; Cook, B.I.; Davies, T.J.; Kraft, N.J.; Bolmgren, K.; Betancourt, J.L.; Cleland, E.E. Predicting phenology by integrating ecology, evolution and climate science. Glob. Chang. Boil. 2011, 17, 3633–3643. [Google Scholar] [CrossRef]
  40. Hamed, K.; Rao, A.R. A modified Mann-Kendall trend test for autocorrelated data. J. Hydrol. 1998, 204, 182–196. [Google Scholar] [CrossRef]
  41. Yue, S.; Pilon, P.; Cavadias, G. Power of the Mann–Kendall and Spearman’s rho tests for detecting monotonic trends in hydrological series. J. Hydrol. 2002, 259, 254–271. [Google Scholar] [CrossRef]
  42. Sarr, M.A.; Gachon, P.; Seidou, O.; Bryant, C.R.; Ndione, J.A.; Comby, J. Inconsistent linear trends in Senegalese rainfall indices from 1950 to 2007. Hydrol. Sci. J. 2015, 60, 1538–1549. [Google Scholar] [CrossRef]
  43. Zhang, H.; Wang, B.; Xin, C.; Lan, T. Effects of trend-free pre-whitening methods on trend detection in Mann-Kendall test of runoff series. J. Hydroelectr. Eng. 2016, 35, 56–69. [Google Scholar] [CrossRef]
  44. Chen, Z.; Jiang, W.; Wang, W.; Deng, Y.; He, B.; Jia, K. The Impact of Precipitation Deficit and Urbanization on Variations in Water Storage in the Beijing-Tianjin-Hebei Urban Agglomeration. Remote. Sens. 2017, 10, 4. [Google Scholar] [CrossRef] [Green Version]
  45. Jarrah, A.M.; Khanna, N. Some results on vanishing moments of wavelet packets, convolution and cross-correlation of wavelets. Arab. J. Math. Sci. 2019, 25, 169–179. [Google Scholar] [CrossRef]
  46. Huang, L.; Hao, H.; Li, X.; Li, J. Source identification of microseismic events in underground mines with interferometric imaging and cross wavelet transform. Tunn. Undergr. Space Technol. 2018, 71, 318–328. [Google Scholar] [CrossRef]
  47. Huang, H.B.; Huang, X.R.; Yang, M.L.; Lim, T.C.; Ding, W.P. Identification of vehicle interior noise sources based on wavelet transform and partial coherence analysis. Mech. Syst. Signal Process. 2018, 109, 247–267. [Google Scholar] [CrossRef]
  48. Cui, Y.; Wei, Y.; Guo, Z.; Liao, Z.; Long, Y. Response of Groundwater Level to Variation of Precipitation Factors in Ecologically Fragile Grassland Areas. Water Sav. Irrig. 2017, 60–64. [Google Scholar]
  49. Cui, T.; Raiber, M.; Pagendam, D.; Gilfedder, M.; Rassam, D. Response of groundwater level and surface-water/groundwater interaction to climate variability: Clarence-Moreton Basin, Australia. Hydrogeol. J. 2017, 26, 593–614. [Google Scholar] [CrossRef]
  50. Zhang, Y.; Wang, J.; Jing, J.; Sun, J. Response of groundwater to climate change under extreme climate conditions in North China Plain. J. Earth Sci. 2014, 25, 612–618. [Google Scholar] [CrossRef]
  51. Liao, Z.; Long, Y.; Liu, H.; Song, Y.; Guo, Z.; Wei, Y. Influence of Climate Change and Human Activities on Groundwater Level in Baotou City. Arid Zone Res. 2014, 31, 138–143. [Google Scholar]
  52. Qi, P.; Zhang, G.; Xu, Y.J.; Wang, L.; Ding, C.; Cheng, C. Assessing the Influence of Precipitation on Shallow Groundwater Table Response Using a Combination of Singular Value Decomposition and Cross-Wavelet Approaches. Water 2018, 10, 598. [Google Scholar] [CrossRef] [Green Version]
  53. Li, H.; Lu, Y.; Zheng, C.; Zhang, X.; Zhou, B.; Wu, J. Seasonal and Inter-Annual Variability of Groundwater and Their Responses to Climate Change and Human Activities in Arid and Desert Areas: A Case Study in Yaoba Oasis, Northwest China. Water 2020, 12, 303. [Google Scholar] [CrossRef] [Green Version]
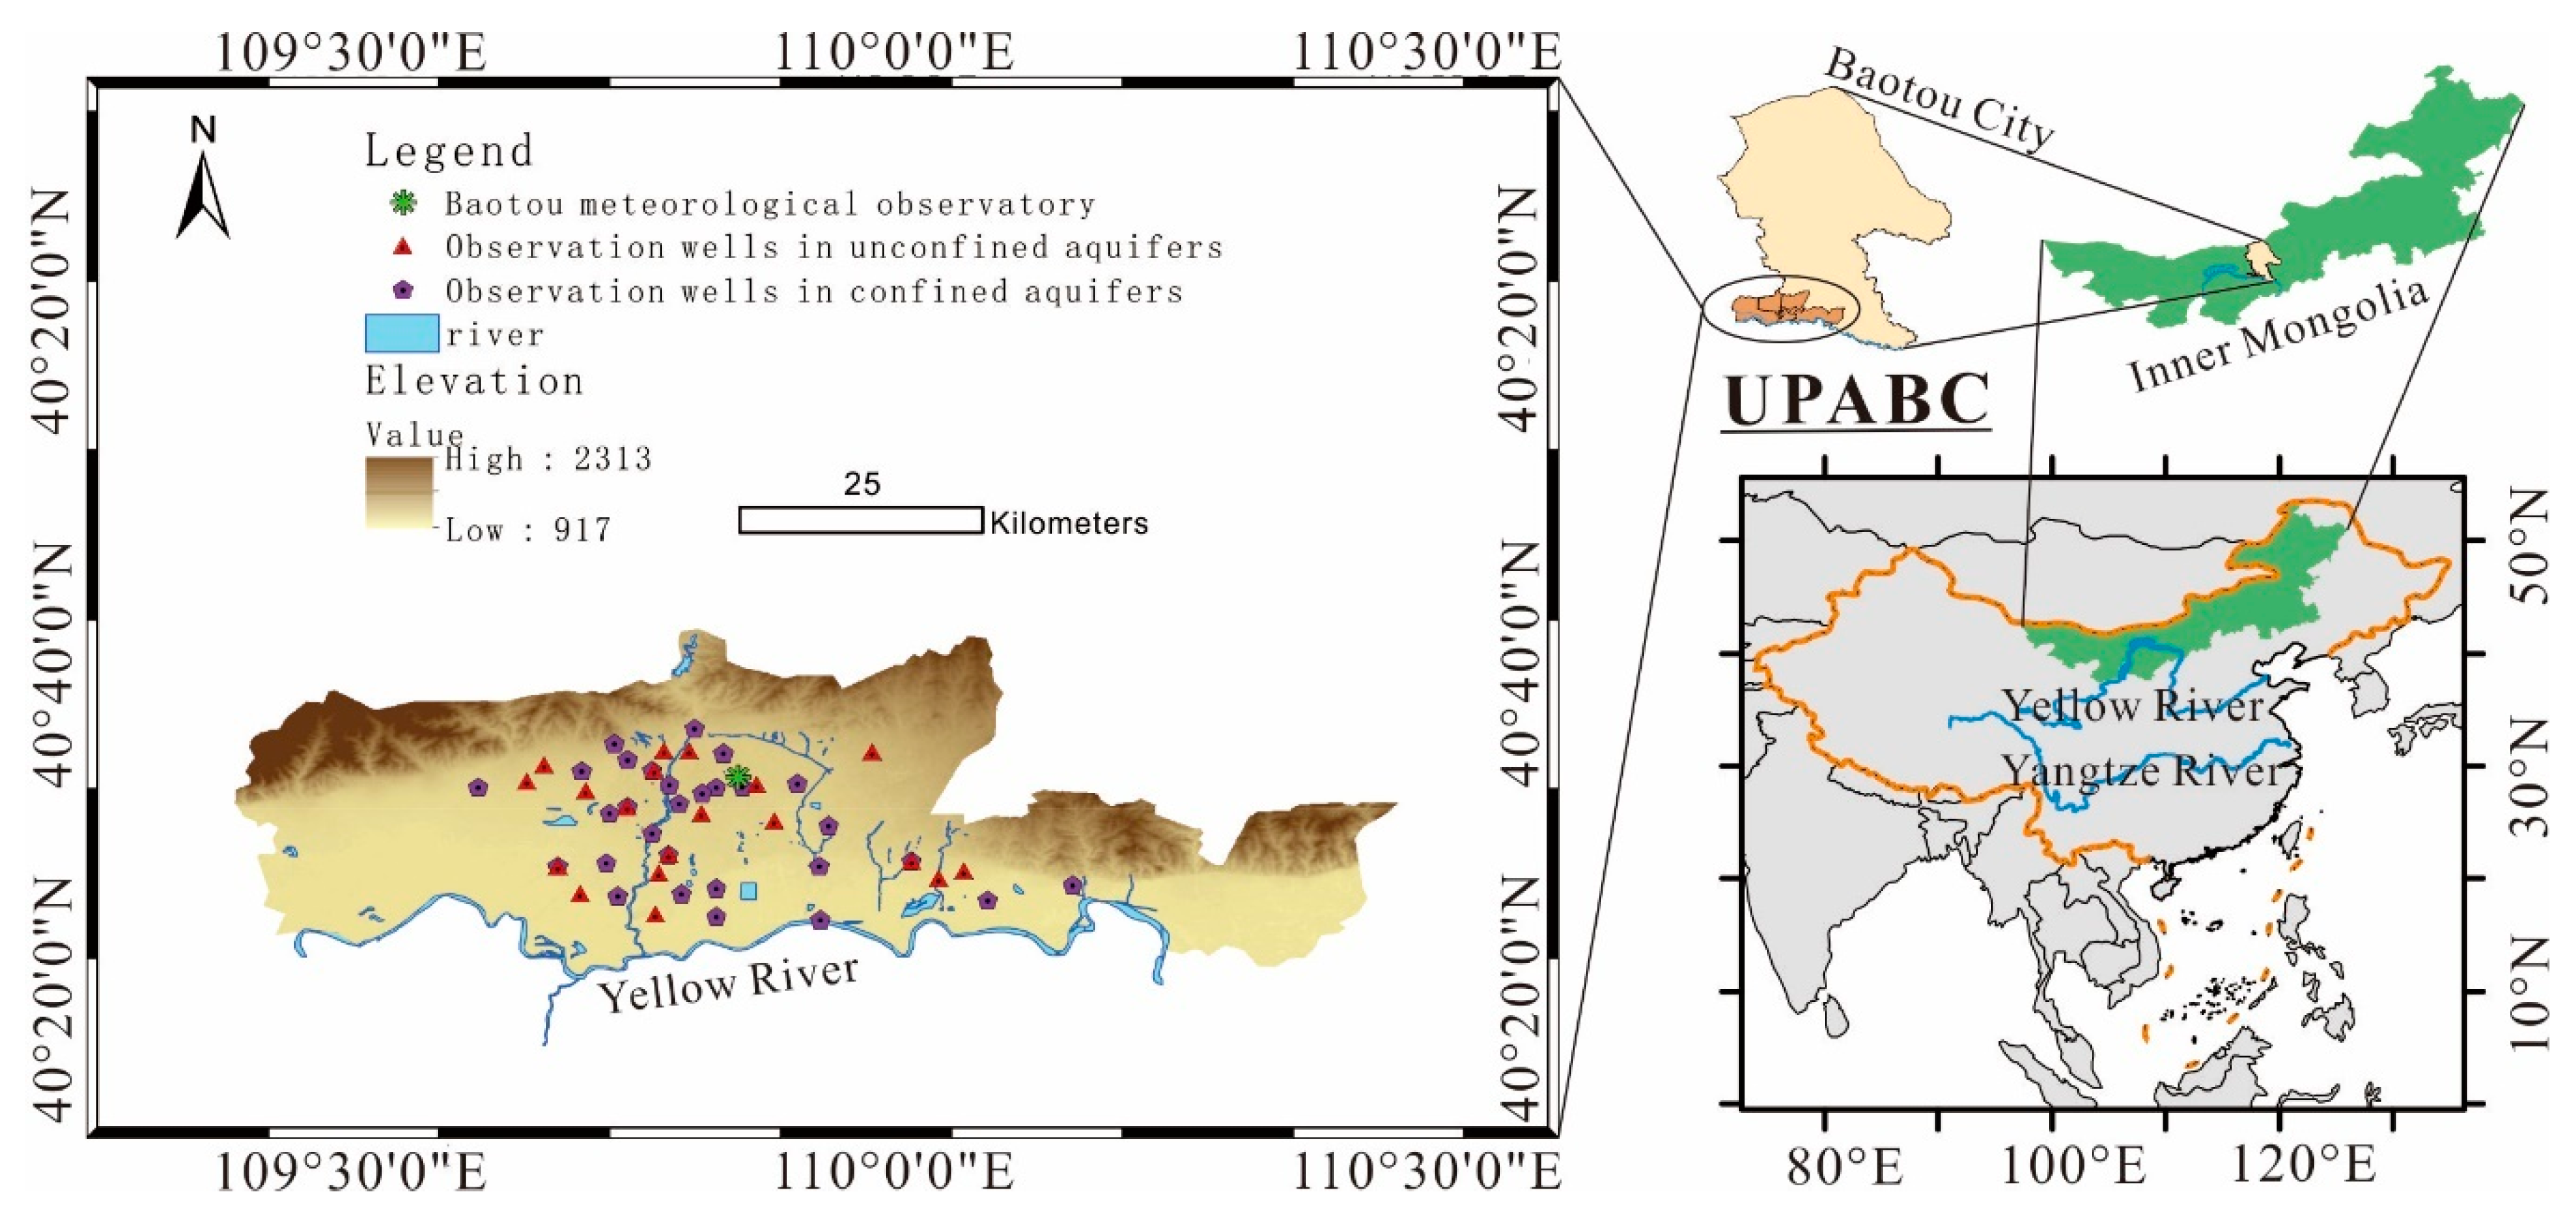
Figure 1. The locations of the Urban Planning Area of Baotou City (UPABC), the river system, a meteorological observatory, and observation wells.
Water 12 01078 g001
Figure 2. Hydrogeological area distribution (a), and hydrogeological profile of the study area (b).
Water 12 01078 g002
Figure 3. Annual precipitation trend (a) and monthly precipitation range (b).
Water 12 01078 g003
Figure 4. Annual average temperature trend (a) and monthly temperature range (b).
Water 12 01078 g004
Figure 5. Precipitation and temperature Trend-Free Pre-Whitening (TFPW)-Mann–Kendall test results. UF and UB are the curves calculated using the Mann–Kendall test method. If the intersection of the curve of UF and the curve of UB is between the significant horizontal lines, the intersection is the starting moment of the sequence abrupt change point, and we can regard it as the beginning of an abrupt change point.
Water 12 01078 g005
Figure 6. The changes in groundwater exploitation in various industries. STD: interannual standard deviation of water consumption.
Water 12 01078 g006
Figure 7. The interannual and monthly water depth trend of an unconfined and confined aquifer. Interannual water depth trend of an unconfined aquifer (a), Interannual water depth trend of a confined aquifer (b), Monthly water depth trend of an unconfined aquifer (c), Monthly water depth trend of a confined aquifer (d).
Water 12 01078 g007
Figure 8. Unconfined and confined water depth TFPW-Mann–Kendall test results. Unconfined depth TFPW-Mann–Kendall test (a), Confined depth TFPW-Mann–Kendall test (b).
Water 12 01078 g008
Figure 9. Groundwater depth of unconfined aquifers in different hydrogeological zones. STD: interannual standard deviation of unconfined water depth. The I, II-1, II-2, II-3, II-4, II-5, II-6, III-1, and III-2 subgraphs show the average groundwater depth of the unconfined aquifer in the I, II-1, II-2, II-3, II-4, II-5, II-6, III-1, and III-2 hydrogeological zones defined in Figure 2a.
Water 12 01078 g009
Figure 10. Groundwater depth of confined aquifers in different hydrogeological zones. STD: interannual standard deviation of confined water depth. The II-1, II-2, II-4, and III-2 subgraphs show the average groundwater depth of the unconfined aquifer in the II-1, II-2, II-4, and III-2 hydrogeological zones defined in Figure 2a.
Water 12 01078 g010
Figure 11. Correlation between various influencing factors of groundwater depth.
Water 12 01078 g011
Figure 12. CWT (Continuous Wavelet Transform) analysis of precipitation and groundwater depth in different hydrogeological zones. Yellow and blue represent the peaks and valleys of the energy density, respectively, reflecting the local and dynamic characteristics of the time–frequency conversion of the dominant fluctuation component. The color shade indicates the relative change in energy density. The closed value of the black thick solid coil passed the red noise test at the 95% confidence level. The cone area below the black thin solid line is the wavelet influence cone (COI) area, and it is the area where the edge effects of the continuous wavelet transform data were more affected. The precipitation subgraph shows the result of CWT analysis on the precipitation of UPABC. The uI, uII-1, uII-2, uII-3, uII-4, uII-5, uII-6, uIII-1, and uIII-2 subgraphs show the results of CWT analysis on the groundwater depth of the unconfined aquifer in the I, II-1, II-2, II-3, II-4, II-5, II-6, III-1, and III-2 hydrogeological zones defined in Figure 2a. The cII-1, cII-2, cII-4, and cIII-2 subgraphs show the results of CWT analysis on the groundwater depth of the confined aquifer in the II-1, II-2, II-4, and III-2 hydrogeological zones defined in Figure 2a.
Water 12 01078 g012
Figure 13. XWT (Cross Wavelet Transform) analysis of precipitation and groundwater depth in different hydrogeological zones. The precipitation-Iu, precipitation-II-1u, precipitation-II-2u, precipitation-II-3u, precipitation-II-4u, precipitation-II-5u, precipitation-II-6u, precipitation-III-1u, and precipitation-III-2u subgraphs show the results of XWT analysis of precipitation and groundwater depth of the unconfined aquifer in the I, II-1, II-2, II-3, II-4, II-5, II-6, III-1, and III-2 hydrogeological zones. The precipitation-II-1c, precipitation-II-2c, precipitation-II-4c, and precipitation-III-2c subgraphs show the results of XWT analysis of precipitation and groundwater depth of the confined aquifer in the II-1, II-2, II-4, and III-2 hydrogeological zones.
Water 12 01078 g013
Figure 14. WTC (Wavelet Transform Coherence) analysis of precipitation and groundwater depth in different hydrogeological zones. The precipitation-Iu, precipitation-II-1u, precipitation-II-2u, precipitation-II-3u, precipitation-II-4u, precipitation-II-5u, precipitation-II-6u, precipitation-III-1u, and precipitation-III-2u subgraphs show the results of WTC analysis of precipitation and groundwater depth of the unconfined aquifer in the I, II-1, II-2, II-3, II-4, II-5, II-6, III-1, and III-2 hydrogeological zones. The precipitation-II-1c, precipitation-II-2c, precipitation-II-4c, and precipitation-III-2c subgraphs show the results of WTC analysis of precipitation and groundwater depth of the confined aquifer in the II-1, II-2, II-4, and III-2 hydrogeological zones.
Water 12 01078 g014
Table 1. Meteorological information in the UPABC (Urban Planning Area of Baotou City). The meteorological information comes from Baotou meteorological observatory (40°40′ N, 109°51′ E, altitude: 1005.9 m a.s.l.).
Climatic FactorValue
Precipitation (mm)Average305.90
Max465.20
Min161.20
Evaporation (mm)Average2273.80
Max2793.20
Min1960.00
Temperature (°C)Average7.80
Max39.20
Min−31.40
Sunshine (h)Average2873.06
Max3167.00
Min2576.70
Wind speed (m/s)Average9.75
Max21.30
Min4.10
Table 2. Hydrogeological area and lithology.
Hydrogeological Area CODEUnconfined AquiferConfined Aquifer
Depth/mThickness/mLithologyDepth/mThickness/mLithology
ILow mountain hills hydrological address area
I3–105–20Gneiss-based
IIPiedmont Plain hydrogeological area
II-13–4010–25The lithology of the upper and middle layers is gravel and pebble layer, mixed with medium-fine sand and cohesive soil, the particle size is poorly sorted, and the lower part is coarse sand and medium-fine sand.70–11020–50Most of them are gravel, and the edges are coarse, medium, or fine sand.
II-23–405–30The area is dominated by gravel, with coarse sand, medium-fine sand, and fine sand distributed on the western and southwestern edges.90–11020–70The area is mainly composed of gravel and sand eggs, and the lower and edges are medium-coarse sand and medium-fine sand.
II-33–302–8Mainly medium-coarse sand, medium-fine sand, and fine sand.50–7010–30The main lithology is gravel.
II-410–305–20The southern edge is medium-coarse sand and medium-fine sand, and the rest are all gravel layers.20–4070–90The north is mostly gravel, while the south is mainly medium-thick and medium-fine sand.
II-510–3015–20The entire sector is composed of coarse-grained gravel.
II-65–3025The entire fan-shaped ground is composed of coarse-grained gravel.
IIIHydrogeological area of the Yellow River Alluvial Plain
III-13–530–50Some are gravel or gravel sand, and the remaining sections are mainly medium-fine sand and silty sand, followed by silt.
III-21–310–40Some areas are medium-coarse sand and medium-fine sand, and other areas are fine sand and fine sand.0–310–20Medium coarse sand, medium-fine sand, or silt.