Review

Drinking Water Temperature around the Globe: Understanding, Policies, Challenges and Opportunities

by
Claudia Agudelo-Vera
1,*,
Stefania Avvedimento
2,
Joby Boxall
3,
Enrico Creaco
2,
Henk de Kater
4,
Armando Di Nardo
5,
Aleksandar Djukic
6,
Isabel Douterelo
3,
Katherine E. Fish
7,
Pedro L. Iglesias Rey
8,
Nenad Jacimovic
6,
Heinz E. Jacobs
9,
Zoran Kapelan
10,11,
Javier Martinez Solano
8,
Carolina Montoya Pachongo
12,
Olivier Piller
13,
Claudia Quintiliani
1,
Jan Ručka
14,
Ladislav Tuhovčák
14 and
Mirjam Blokker
1,10
1
KWR-Water Research Institute, 3430 PE Nieuwegein, The Netherlands
2
Dipartimento di Ingegneria Civile e Architettura, Università degli Studi di Pavia, 27100 Pavia, Italy
3
Department of Civil and Structural Engineering, University of Sheffield, Sheffield S1 3JD, UK
4
EVIDES Water utility, 3006 HC Rotterdam, The Netherlands
5
Department of Engineering, University of Campania Luigi Vanvitelli–, 81031 Aversa (CE), Italy
6
Faculty of Civil Engineering, University of Belgrade, 11000 Belgrade, Serbia
7
Sheffield Water Centre, Department of Civil and Structural Engineering, University of Sheffield, Sheffield S1 3JD, UK
8
Department of Hydraulic Engineering and Environment, Universitat Politècnica de València, 46022 Valencia, Spain
9
Department of Civil Engineering, Stellenbosch University, Stellenbosch 7600, South Africa
10
Department of Water Management, Delft University of Technology, 2628 CN Delft, The Netherlands
11
Centre for Water Systems, University of Exeter, Exeter EX4 4QF, UK
12
Cognita Links, Cali 760033, Colombia
13
INRAE, ETBX Research Unit, 75338 Paris, France
14
Institute of Municipal Water Management, Faculty of Civil Engineering, Brno University of Technology, 612 00 Brno, Czech Republic
*
Author to whom correspondence should be addressed.
Water 2020, 12(4), 1049; https://doi.org/10.3390/w12041049
Submission received: 28 February 2020 / Revised: 30 March 2020 / Accepted: 1 April 2020 / Published: 7 April 2020
(This article belongs to the Special Issue Water Quality in Drinking Water Distribution Systems)

Abstract

:
Water temperature is often monitored at water sources and treatment works; however, there is limited monitoring of the water temperature in the drinking water distribution system (DWDS), despite a known impact on physical, chemical and microbial reactions which impact water quality. A key parameter influencing drinking water temperature is soil temperature, which is influenced by the urban heat island effects. This paper provides critique and comprehensive summary of the current knowledge, policies and challenges regarding drinking water temperature research and presents the findings from a survey of international stakeholders. Knowledge gaps as well as challenges and opportunities for monitoring and research are identified. The conclusion of the study is that temperature in the DWDS is an emerging concern in various countries regardless of the water source and treatment, climate conditions, or network characteristics such as topology, pipe material or diameter. More research is needed, especially to determine (i) the effect of higher temperatures, (ii) a legislative limit on temperature and (iii) measures to comply with this limit.

1. Introduction

A drinking water distribution system (DWDS) is an integral part of a water supply network comprising pipelines, storage facilities and associated assets to carry potable water from treatment plant(s) to water consumers in order to satisfy residential, commercial, industrial and firefighting requirements. One of the most difficult, yet critical, roles of DWDS operation is maintaining microbiological safety for the protection of public health. To guarantee good standards of water quality supply at the end point of the DWDS, many countries maintain a disinfection residual (commonly chlorine) within treated water during distribution. However, several countries in Europe (e.g., The Netherlands [1], parts of Germany [2], Switzerland and Austria [3]) do not use disinfectant residual in the DWDS. They instead rely on catchment protection and highly treated water which includes disinfection via UV light before water enters the DWDS and good DWDS design, operational and maintenance practices. Whether or not a disinfectant residual is present, a variety of water quality reactions are taking place between microorganisms (present in biofilms, sediments and free-floating in the water column), inorganic contaminants, such as corrosion byproducts, and nutrients. These complex reactions are influenced by source water quality (after treatment), hydraulic conditions in the DWDS (driven by customer demands), nature and condition of the infrastructure and temperature [4].
Water quality and hydraulics in the DWDS have been extensively studied [5,6,7,8,9]. Although little is known in practice, research has been conducted to model temperature changes in the DWDS and to determine delivered water temperature at the customer [10,11,12,13,14]. Temperature is an important determinant of water quality, since it influences physical, chemical and biological processes, such as absorption of chemicals, chlorine decay [15] and microbial growth and competition processes [8]. Specifically, it influences the survival and growth conditions of microorganisms and the kinetics of many chemical reactions. Temperature can influence the dynamics of microorganisms in the DWDS promoting the role of biofilms as a reservoir of opportunistic pathogens and their release into the bulk drinking water [16]. Many water treatment processes (e.g., clariflocculation, filtration, ozonation) are influenced by water temperature. However, the applied hydraulic and quality models in the literature usually consider a constant temperature [17,18]. Machell and Boxall [19] highlight the complex interaction of hydraulics (specifically water age), infrastructure conditions and water quality. They specifically show the heating effect of water during its transit through the DWDS during summer months in the UK and the route-specific nature of this. Blokker et al. [20] also analysed this complex interaction when studying the potential to extract thermal energy from drinking water.
Drinking water temperature can significantly increase or decrease during distribution from the source to the customer. This change is strongly influenced by the weather, the depth of installation of transport and distribution pipes, the soil type, ground water levels, presence of anthropogenic heat sources and hydraulic residence times [11,21]. At the building level, drinking water temperature can also be affected by the layout of the hot water installations [14].
The Netherlands is one of the few countries with a specific regulation regarding temperature: the Drinking Water Standards [22] states that the temperature of drinking water at the customers’ tap should not exceed 25 °C. Within the regular tap sampling program of the Dutch utilities, in the relatively warm year of 2006, it was reported that 0.1% of samples exceeded the 25 °C limit. With global warming and increasing urbanisation, it is expected that the quantity of samples that exceed the temperature limit will increase.
Over the last decade, Dutch drinking water companies have been researching the impact of drinking water temperature in their DWDSs to guarantee high drinking water quality and to prepare the infrastructure for the challenges that climate change may pose. Despite its importance, according to our best knowledge, only a few researchers [11,23] have developed and published a validated model about how the drinking water temperature changes in the distribution network. In The Netherlands, it was shown that the water temperature at the tap approaches the temperature of the soil that surrounds the distribution mains (pipes with a diameter of 60–200 mm, typical residence times of 48 h or more and located at a depth of 1 m) [11]. In the urban environment, temperatures easily approach the 25 °C limit during a warmer than average summer. Locally, under the influence of anthropogenic heat sources such as district heating pipes or electric cables, the temperature in the DWDS can temporally and locally be higher than 25 °C [21]. Yet, there remains a paucity of information regarding drinking water temperature in the DWDS, especially in countries where temperature limits are not enforced.
This article presents a review of the current knowledge about drinking water temperature from source to tap, as well as a comparison between the policies and practices in a number of countries. Challenges for drinking water companies and policy makers are formulated, resulting in identification of future research directions.

2. Methodology

Two methods were used to gather data. A survey was performed to identify local experiences, issues and current knowledge. A literature review was conducted to determine the current scientific knowledge about the potential impact of water temperature on the DWDS.

2.1. Survey

A questionnaire was sent to 18 participants of the European Project WatQual (www.sheffield.ac.uk/civil/wat-qual) in August 2018. Participants were researchers from universities or employees of water utilities. The questionnaire contained twelve open questions regarding legislation, practices, knowledge and data about drinking water temperature in the DWDS. Eleven completed questionnaires were returned with data from nine countries. Some answers about practices were anonymised and scientific references were searched to support them. Data from the countries was used to illustrate current practices regarding monitoring.

2.2. Literature Review

The online database SCOPUS was used. The search was conducted in November 2019 and no time limit was used in the search. The search was limited to the subject areas: engineering and environmental science. Two searches were conducted. First, the key word “Tap water temperature” was used. This did not provide any relevant documents. A second search using “Drinking water” AND “distribution systems” AND “temperature”, focusing on publications in English was performed and 239 articles were found. After a first screening of the articles, only 10 references were relevant for this review. After that, the snowball method was followed, using these key documents as a starting point to find other relevant titles on the subject matter. Additionally, a question regarding relevant literature was included in the questionnaire of the survey. In total, 48 articles from 25 different journals were used in the current study.

3. Results—Drinking Water Temperature from Source to Tap

3.1. Monitoring Practices

Most of the surveyed water companies systematically monitor source water temperature, and/or the temperature of the treated water (Table 1), as an operational parameter. However, the temperature from source to tap is not systematically monitored in most of the surveyed countries. In the countries where the temperature is monitored, the results are often from discrete samples, resulting in data as shown in Table 1.
A few countries monitor water temperatures at the tap. From the surveyed countries, Czech Republic, France, The Netherlands, Serbia and the UK monitor the tap water temperature. This monitoring is usually random and a standard thermometer is used. These samples collected at customers’ taps are discrete data sets and are very temporally and spatially sparse. Only in The Netherlands and the Czech Republic is temperature measured and recorded to comply with regulatory reporting requirements. In other countries, it is common that temperature is measured when discrete samples are collected at customer taps, for example, as part of chlorine residual measurements, but the values are not typically recorded or reported. In The Netherlands, the reading is made from the closest tap to the water meter (usually in the kitchen sink on the ground floor). The stagnant water in the domestic installation is flushed; after flushing, the temperature stabilises and it is recorded. In the UK, the standard procedure for random day time sampling is to run the tap for one minute prior to sample collection. In France, The Regional Health Agency (French ARS) randomly checks water temperature at consumers’ water taps, where number and frequency of measurements depends on the size of the water utility. In the Czech Republic, the analysis at the consumer’s tap also includes measuring the water temperature. The results of the analyses are then electronically sent to the common national PiVO database. The IS PiVo system was created in 2004 as a tool of hygienic service for water quality monitoring in the Czech Republic. All operators of public water supply systems are obliged to monitor the quality of drinking water by law. The results are provided electronically and processed statistically on an annual basis [26]. Table 1 shows the range of measured drinking water temperatures in the surveyed countries.

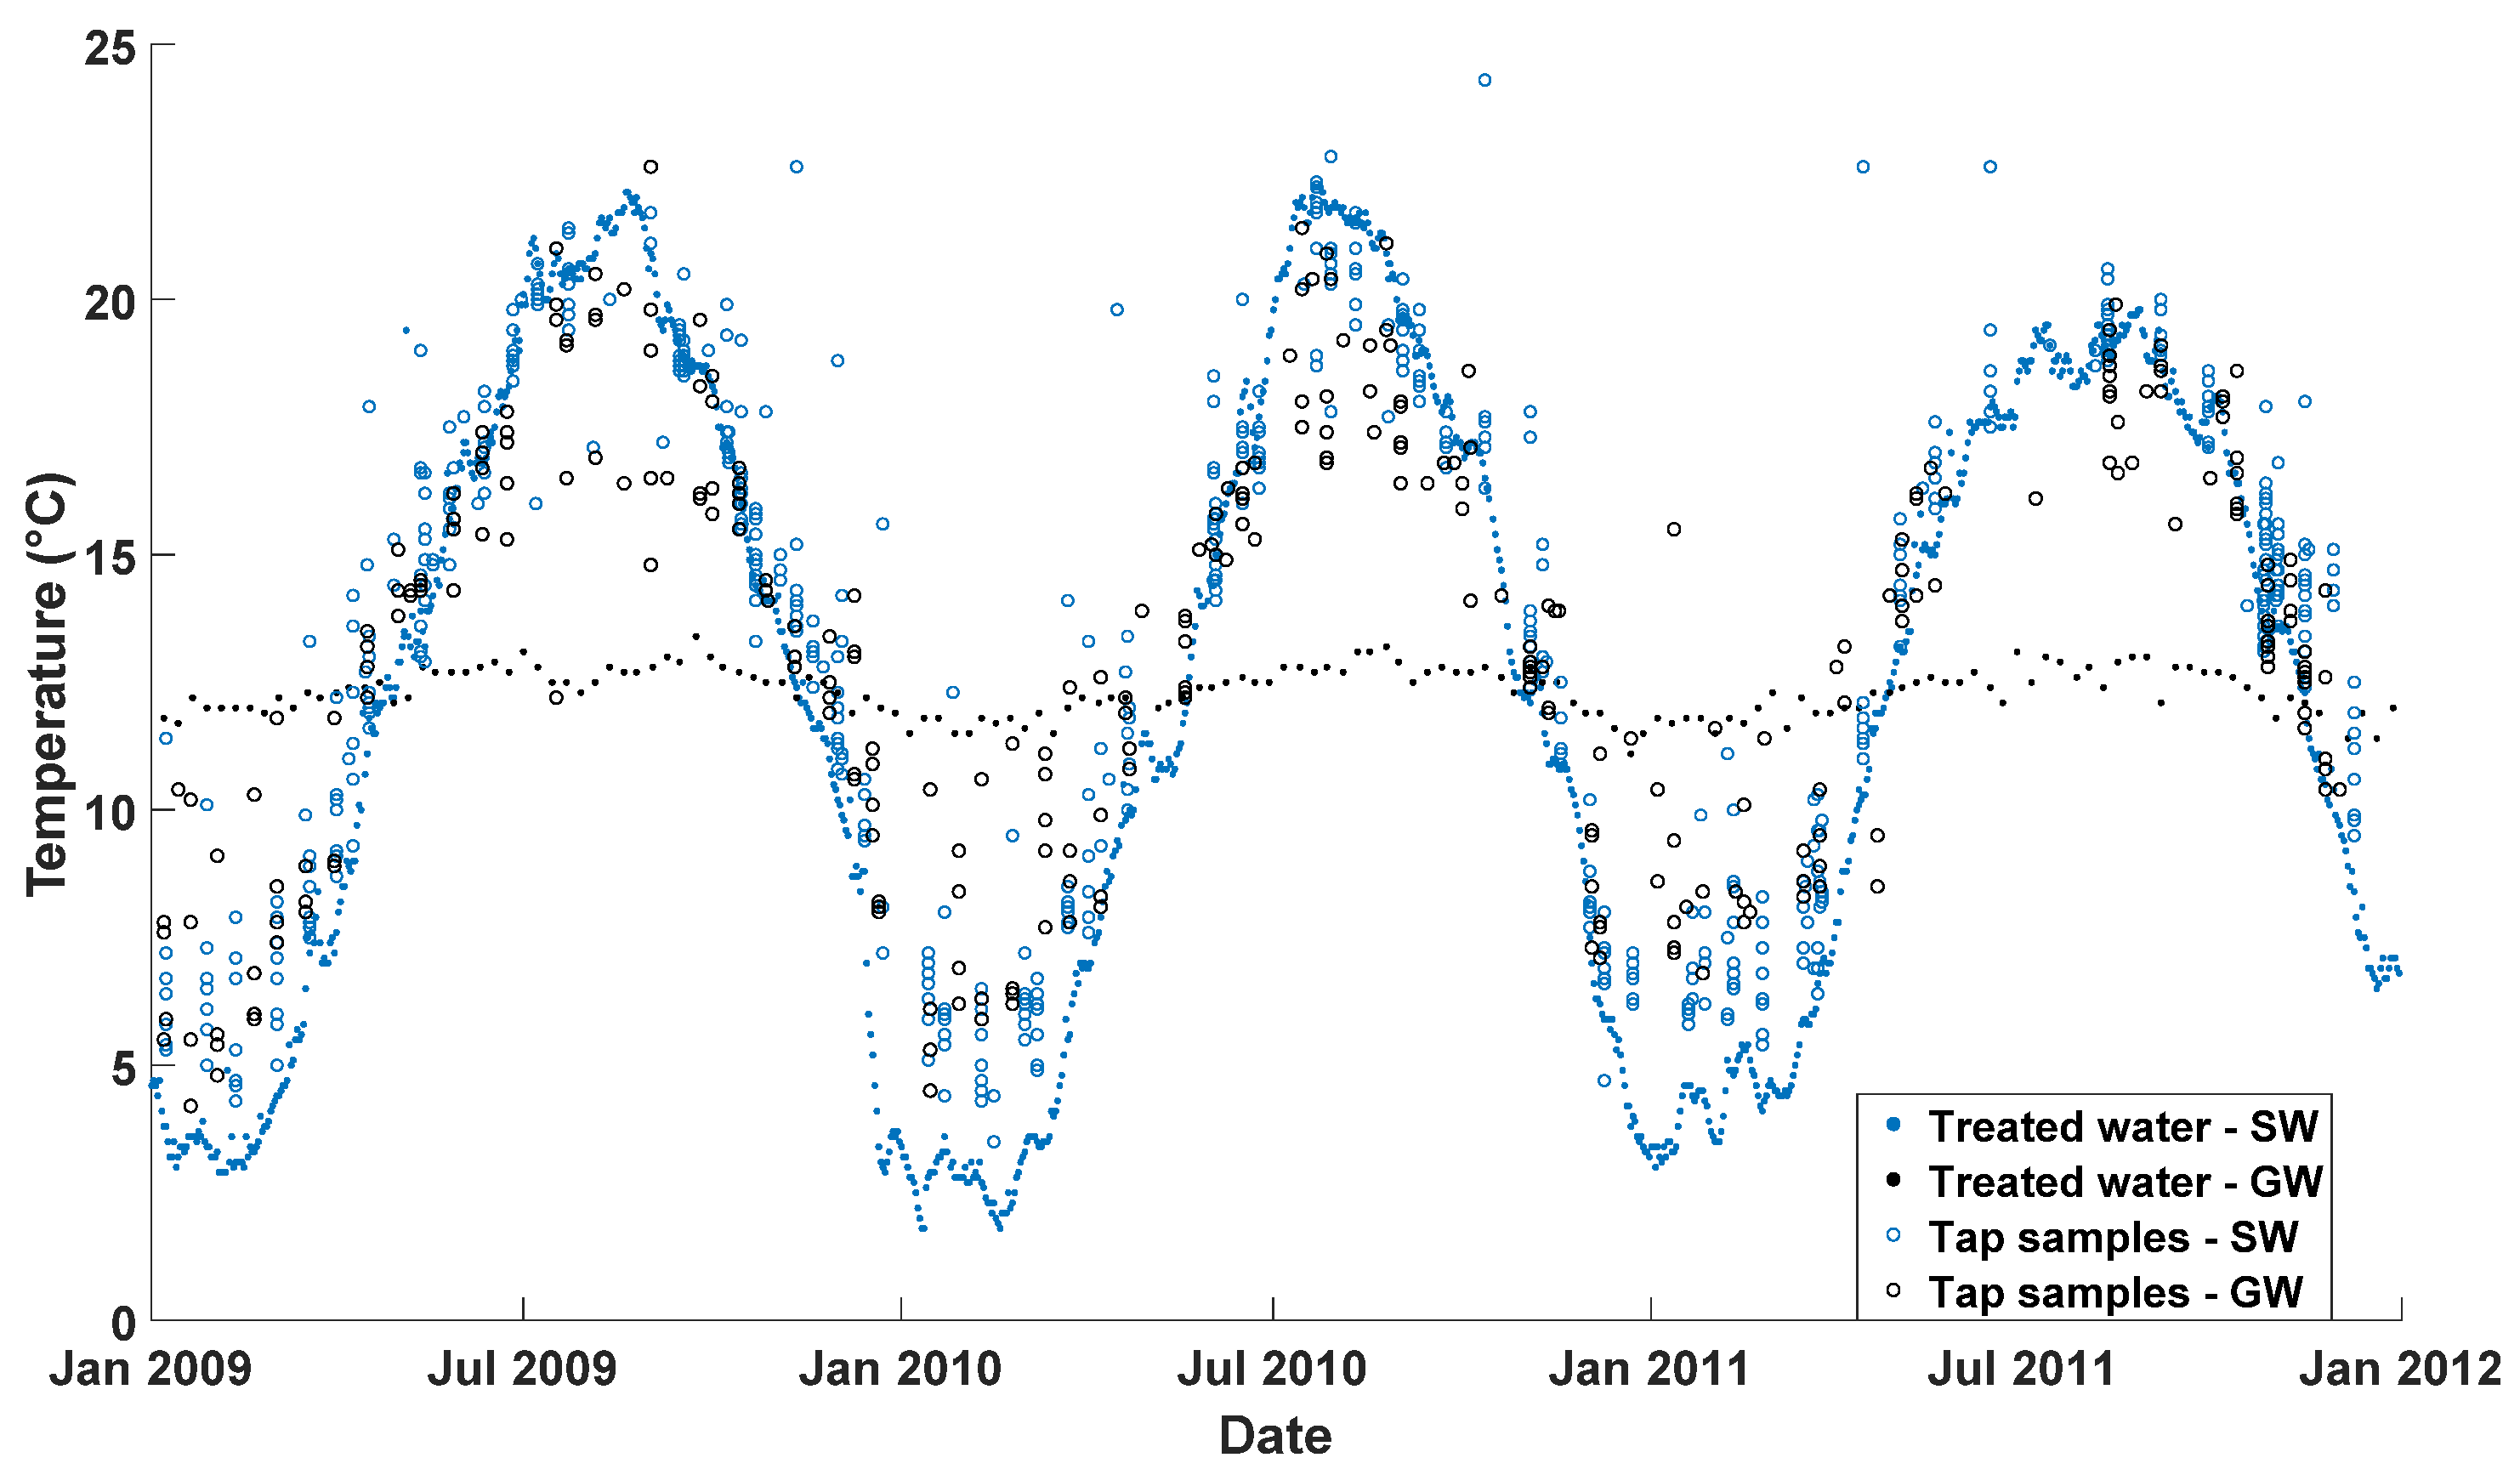
3.2. Drinking Water Temperature at The Source

Source water temperatures have a limited impact on the temperature at the tap. Measurements in The Netherlands have shown that temperature at the customer’s tap is mostly determined by the temperature of the soil around the distribution mains (typically at 1.0 m depth in The Netherlands and much of the world), independent of the water source type. Figure 1 shows two supply areas with different water sources: one with a ground water (GW) source, one with a surface water (SW) source; the temperature profiles are unique for each source. Water temperatures at the tap for these areas were also analysed and showed similar temperatures with a seasonal pattern between the two different water sources. These results confirm that the water temperature at the tap is to a limited extent determined by the temperature at the source/outlet of water treatment plant (WTP).
Drinking water temperature at the point where source water (after treatment) enters the DWDS is determined by the type of source water (ground water or surface water) and the characteristics of the facilities where the water is treated and treated water is stored. As a general rule, groundwater temperature is mainly stable over the year. For example, groundwater temperature in The Netherlands is around 12–13 °C, but seasonal temperature variations can be higher if the source is close to a river and groundwater is influenced by riverbank filtration (see Table 1, data for ground water in Belgrade, Serbia). Meanwhile the surface water temperature has high seasonal variations, and its typical pattern is shown in Figure 1. Table 1 shows an overview of variations of water temperature after treatment from different sources, recorded in various countries.

3.3. Drinking Water Temperature in the Transport and Distribution System

The temperature gradient between soil surrounding the water main and water in the pipe drives temperature change in the DWDS. The temperature of the shallow underground soil (1–2 m depth), where drinking water mains are often installed, shows seasonal variations. The ‘frost depth’ is the depth to which the ground water in the soil is expected to freeze in subzero conditions, and it depends on climatic conditions. Frost depth is considered in many countries to determine the minimum installation depth of drinking water mains to avoid freezing of water in the pipes, or breaking pipes from freezing and thawing of the soil around the pipes. Typical installation depths in central Europe vary between 0.8 m and 1.5 m, whereas in countries such as Finland at higher latitudes, installation depths increase, up to 2.5 m. In other countries, where frost is not an issue, the minimum depth of the trenches is determined in such a way that the pipes are protected from traffic and external loads. In Cali (Colombia) an installation depth between 1.0 m and 1.5 m was reported. In Spain, for instance, the minimum depth will be such that the upper border of the pipeline is at least one meter from the surface; under sidewalks it should be a minimum of 0.60 m. In South Africa, the cover should be no less than 0.9 m [27], although older South African standards stipulated 0.6 m minimum cover. Pipes in South Africa are typically installed at approximately 1.5 m. Water reticulation design guidelines provided by WaterCare in New Zealand suggest 1.0 m cover in roads and 0.75 m in berms and open country [28].
Soil temperature is influenced by the weather (air temperature, solar radiation, etc.), the environment (rural vs. urban), land-cover (bitumen/tar vs. natural vegetation), soil type and conditions (sand vs. clay and moisture content), as shown below. The energy transfer rate from the soil to the inner pipe wall is determined by the conductivity of the pipe material and the thickness of the pipe wall. Subsequently, the energy is transferred from the inner wall to the flowing water. Within a few hours, drinking water reaches the surrounding soil temperature, depending on factors such as the pipe diameter, wall thickness and flow velocity. Based on the equations presented by Blokker and Pieterse-Quirijns [11] it is possible to calculate the time needed to warm up the water contained in a pipe of a certain diameter, given an initial drinking water temperature and the soil temperature. Figure 2 shows the number of hours needed for drinking water in distribution pipes to heat up from 15 °C to 25 °C and number of minutes in connection pipes to warm up from 20 °C to 25 °C. Plastic and asbestos cement pipes are thermal insulators and this means a relatively long heating time. Cast iron pipes, even with cement lining, show a much shorter time for the water to heat up from 15 to 25 °C for the same diameters, e.g., less than 1 h for a 150 mm cast iron pipe with cement lining [11].
The term “urban heat island” describes built up areas that are hotter than surrounding rural areas due to limited evapotranspiration, heat storage in buildings and urban surfaces, and anthropogenic heat sources. Sources of anthropogenic heat include cooling and heating of buildings, manufacturing, transportation, lighting, etc. [30,31]. Recently it was proven that the temperature of the shallow underground is also strongly influenced by anthropogenic heat sources such as district heating pipes, electricity cables, underground parking garages, etc. and it can lead to which is known as the ‘subsurface heat island effect’ [32,33,34]. Analysis of German cities has shown that superposition of various heat sources leads to a significant local warming [32]. Measurements of soil temperatures in The Netherlands have shown that soil temperatures at depth of 1.0 m in a warmer than average summer with a heat wave can reach very local up to 27 °C and can heat up at a rate of 1 °C per day, in so-called ‘hot-spot’ locations. Examples of ‘hot-spot’ locations are industrial areas with large anthropogenic heat sources, with no vegetation and good drainage that prevents infiltration and fully exposed to the sun radiation [21].
Blokker et al. [10] modelled drinking water temperature in the DWDS using EPANET-MSX [35]. The use of EPANET-MSX facilitates the calculation of temperature at each node in the distribution network. The model was developed assuming a constant soil temperature over 24 h. Figure 3 shows that tap temperatures vary from 10 °C close to the WTP to 25 °C further downstream. Machell and Boxall [19] reported measured temperatures in the networks and showed that temperature increases with increasing water age along flow routes. Figure 4 shows different pipe routes for a network with two Service Reservoirs (SRs) and demonstrates a range of temperature increases. Although several soil temperature models for rural areas have been proposed, little is known about the soil temperature profile in urban areas. A one-dimensional soil temperature model was developed by Blokker and Pieterse-Quirijns [11] and extended by Agudelo-Vera et al. [21] to include anthropogenic heat sources, as seen in Figure 5.

3.4. Drinking Water Temperature in the Domestic Drinking Water Installation and at the Tap

Domestic drinking water supply systems (DDWSs) are the final step in the supply of drinking water to consumers. Drinking water temperatures are generally higher in households and buildings than in the distribution system. Drinking water temperature in the domestic drinking water installation can increase due to pipes installed through heated rooms or nearby heat sources [36,37]. Zlatanovic, et al. [14] developed a model to simulate the temperature in DDWSs. The model showed that inlet water temperature and ambient temperature both have a large effect on the water temperature at the household tap.
Drinking water temperature in tropical countries could be even higher; nine water samples collected on different days in the city of Cali (Colombia) resulted in temperatures between 25 °C and 28 °C [24]. Measurements in South Africa showed that the final temperature at the cold water tap varied from one day to the next with a range of ± 6 °C. Spot measurements made in summer with the cold water end-use temperature in one home peaked at 34 °C in an afternoon on December 2018, after a few seconds of the tap running. Temperatures up to 41 °C degrees have been measured during the first 10 s after opening the cold water tap during a very hot midsummer day in Cape Town (January 2020) with an outside air temperature of 42 °C [38]. These relatively high values could be ascribed to the shallow buried plumbing pipe (300 mm ground cover) passing around the Northern side of the house in the full sun [25]. Drinking water temperature without flushing in the DDWS can reach the indoor temperature, in countries where homes are typically not climate controlled, such as South Africa.

3.5. Drinking Water from Source to Tap

Water has a relatively large heat capacity; therefore, considerable amounts of energy are required to heat up water. Additionally, water has a relatively high heat transfer coefficient, so it takes some time for the water to heat up; note that the time required to reach a certain temperature is decreased by convection (i.e., flowing water enhances heat transfer). A heat transfer model can calculate that it takes tens of hours to heat up water in a reservoir or a transport main (pipe diameter 300–800 mm), a few hours in a distribution pipe (diameter 60–150 mm), and a few minutes in a property connection pipe (diameter 15–30 mm). This is shown in Figure 2 and [11]. This simple heat transfer model assumes that the driving force is the temperature at the pipe wall, which is not affected by the temperature of the drinking water. This means that the temperature of the pipe wall can be assumed to be equal to the undisturbed soil temperature at installation depth. The undisturbed soil temperature can easily be determined by a one-dimensional micrometeorology model. However, there is a heat exchange between soil and drinking water.
However, as drinking water pipes distribute water of varying temperatures (5–25 °C throughout the year due to seasonal variation), the soil temperature around the drinking water pipe is also affected by the drinking water temperature. As the pipes are installed for a long period of time, it can be expected that the soil temperature around the pipes is not always equal to the undisturbed soil temperature. Thus, the soil temperature around the drinking water pipe is also affected by the drinking water temperature. The interactions between and within the soil temperature and water temperature are complex. The effect of soil temperature on short and long wave radiation, surface convection, and heat transfer through the soil need to be considered in combination with the effect of drinking water temperature, which is difficult to model. The weather-related variables have a seasonal temporal resolution, whereas the drinking water temperature could change in a few hours depending on the flow rate of the water through the pipe.
Given the above and considering the typical residence times of water in the various parts of the network between source and tap, drinking water temperature at different locations between the source and a tap is estimated as follows:
Drinking water temperature at source or treatment plant (Table 1): Temperature is often measured here, and hence known. Ground water temperature at the source will be relatively stable (e.g., 12–13 °C in The Netherlands and U.K./Bristol) year-round, and surface water source temperature can vary substantially between 2 and 27 °C.
Drinking water temperature in the transport main: Typically, almost equal to source/treatment plant temperature (difference of ± 1 °C). Firstly, these mains have a large diameter and are usually short enough for the residence time to be much smaller than the heating time given in Figure 2. Secondly, these large mains substantially influence the surrounding soil temperature, which means there is a limited net heat exchange between the soil and water in the pipe. Furthermore, these mains are typically installed deeper than distribution mains, hence the soil temperature is less affected by the weather.
Drinking water in SRs/tanks: The large volume to surface area of most SRs compared to pipes leads to slower heating/cooling effects during the residence within these critical structures. However, they often have very long residence times. Figure 4 shows the relative impact of flow routes, including a second large SR to retard heating effects during the summer in the UK. It should be noted that this was for an underground tank in a hilly area. Underground tanks are affected by ground temperature as with the buried pipes. Where topology is flatter, such tanks are typically elevated above the ground. In above-ground reservoirs, heating and cooling effects can be very significant due to bigger and more rapid variations in air temperature than in soil temperature. Temperature in the reservoirs can be also affected by material. However, there is not enough data to quantify the level of difference.
Drinking water temperature in the distribution mains: typically quickly approaches the undisturbed soil temperatures at installation depth (typically 1.0 m). These mains have a limited diameter, where the residence time is greater than the heating time from Figure 2. As these mains influence the surrounding soil temperature to a limited extent, the actual heating time may be longer than that shown in Figure 2, but the residence times have the same order of magnitude, so there is significant heat exchange. These mains are typically installed at a depth of 1 m, where the soil temperature is subjected to seasonal change.
Drinking water temperature in the connection water supply pipes: typically almost equal to the temperature at the end of the distribution main (so soil temperature at depth of 1 m). Firstly, these small diameter mains have short lengths, where the residence time (during flow, the situation of stagnant water is kept out of the analysis) is much smaller than the heating time. These small mains hardly influence the surrounding soil temperature, and if they do, the equilibrium would be towards the temperature of the distribution mains. These pipes are typically installed at a shallower depth than distribution mains, so the soil temperature is more influenced by the weather.
Drinking water temperature in the premises plumbing pipes: Typically almost equal to the temperature at the end of the connection and thus of the distribution main (i.e., soil temperature at depth of 1 m). These small diameter mains have short lengths, hence their water residence time (again during flow) is much smaller than the heating time. These mains are not located in the soil, but in airshafts, and the air temperature is not affected by the drinking water temperature of these small-diameter pipes.
Drinking water temperature at the tap: Typically (during flow after flushing) equal to temperature at the end of the distribution mains (i.e., soil temperature at the depth of 1 m) when customers are directly connected to the network. For situations where storage occurs between the distribution network and the customer’s tap, other temperatures apply depending on the type of storage (roof or underground), local climate and storage times. Stagnant water will reach the surrounding temperature.
Consequently, it is clear that the soil temperature at the installation depth of the distribution mains is important to know. This temperature is determined by, on one hand, short and long wave radiation (including from above ground anthropogenic sources), surface convection, and heat transfer through the soil and, on the other hand, by the underground (anthropogenic) heat sources. As the anthropogenic sources can have a local effect, it is not easy to predict drinking water temperatures in the entire network. Tap temperatures are not typically measured (Table 1), and in the soil/ground water, only on a project basis. Therefore, the soil temperatures at installation depth are mostly unknown.

3.6. Consequences of Higher Temperatures and Legislation

The World Health Organization (WHO) guidelines recommend a maximum temperature limit of 25 °C at the tap [39]: “Cool water is generally more palatable than warm water, and temperature will impact on the acceptability of a number of other inorganic constituents and chemical contaminants that may affect the taste. High water temperature enhances the growth of microorganisms and may increase taste, odour, colour and corrosion problems”. In a recent review the WHO reports that in a survey of 104 countries, 18 countries have a regulatory/guideline value of temperature [40]. This review also states that “None of the values for temperature were mandatory, being guiding levels or operational goals. None of the countries and territories’ documents indicated what would happen if temperatures rose above the suggested value. In addition to those with numerical values, seven countries and territories had descriptive levels such as: 2.5 °C above normal; “not objectionable”; “air temperature plus 3 °C”; “acceptable”; and “ambient””. No additional information about the countries or the type of standard is given. In the survey conducted for this paper, a number of legal standards were identified, as summarised in Table 2.
Factors such as nutrient concentration, temperature and pH determine microbial community structure and potential for regrowth within DWDSs. Consequently, changes in temperature in DWDSs can influence microbial community composition, promoting the presence of pathogens and the potential for microbial regrowth, particularly of biofilms in the pipe environment [29,46]. A temperature increase of drinking water can influence the microbial ecology of DWDSs, affecting parameters such as potential growth (e.g., colony count at 22 °C, bacteria of the coli group and Legionella) and the presence of undesirable microorganisms because of their possible role in disease [29]. There is a difference in the effect of temperature on microorganisms depending on location, either as free-living planktonic organisms in the bulk-water, or as a community within a biofilm attached to the pipe wall. The effect of temperature may also depend on water quality (e.g., disinfectant residual, organic loading) and hydraulics. For example, some microorganisms have their optimal growth at 20 °C, others at 25 °C, and yet others at 30 °C. Thus, the temperature will affect the composition of the biofilm. However, publications about microorganisms in water supplies in many cases do not provide accurate data on water temperature [47]. It has been shown in a chlorinated DWDS in the UK that a rise of temperature from the average 16 °C in the warmer months to a temperature of 24 °C promoted changes and loss in the complexity of microbial biofilm communities [46].
The main concern regarding the impact of temperature increases in DWDS is the potential for the proliferation of pathogens such as Legionella spp. Legionellosis is a collection of infections that emerged in the second half of the 20th century, and that are caused by Legionella pneumophila and related species of bacteria belonging to the genus Legionella. Water is the major natural reservoir for Legionellae, and these bacteria are found worldwide in many different natural and artificial aquatic environments, such as cooling towers, water systems in hotels, domestic water heating systems [48], ships and factories, respiratory therapy equipment, fountains, misting devices, and spa pools [49]. Whether or not disinfectant is used, controlling Legionella spp. in a drinking water installation can be problematic [50]. Temperature control is a known measure to prevent the proliferation of Legionella. The WHO states that to prevent Legionella infection, the recommended temperature for storage and distribution of cold water is below 25 °C, and ideally below 20 °C. Table 2 shows that this recommendation has not been adopted everywhere. Table 2 also shows that temperature standards of building owners are not always matched with temperature standards for drinking water utilities. Laboratory studies of mutant Legionella strains show that the bacteria may grow below 20 °C under certain conditions [51]. Legionella will survive for long periods at low temperatures and then proliferate when the temperature increases, if other conditions allow.
When temperatures remain below 25 °C, it is expected that growth of Legionella pneumophila will not occur or will be limited, whereas at temperatures above 30 °C, it is likely that growth of Legionella pneumophila will occur at significant levels, providing the biofilm concentration in the drinking water distribution system is high enough. Another prerequisite for the significant growth of Legionella pneumophila, is that the temperature has to be higher than 30 °C for a prolonged period, reported as more than seven days [29].
The results of the survey conducted herein showed that seasonal increase of temperatures can cause unpleasant taste on the palate, which may be related to pipe material (e.g., black alkathane pipework, or lead plumbing pipes). Drinking water companies are generally aware that potential issues can include the occurrence of infections (such as Salmonella, Legionella, Mycobacterium), chlorine decay and formation of byproducts. As expressed in one survey response “… it is known that increased water temperature leads to increased biofilm activity in distribution network”. Research in The Netherlands on the influence of temperature on discolouration risk, concludes that it is likely that higher temperatures in the DWDS can augment discolouration risk [52,53]. In a tropical DWDS in the city of Cali (Colombia), the formation of disinfection byproducts was clearly influenced by pH, temperature, chlorine dosage, and water age. The interactions observed between these parameters and Trihalomethanes (THMs), were also shaping the microbial characteristics of these systems [24]. Other studies regarding the effects of temperature in the DWDS are reported in Table 3.

4. Challenges and Opportunities

4.1. Trends

Increasing urbanisation and climate change seem to be the most important current trends affecting drinking water temperature. The ‘urban heat island’ has been an object of studies during the last decades, but only recently was it shown that it also affects the shallow subsurface, where DWDS pipes are located. In an urban environment with numerous anthropogenic heat sources, the ground is warmer than it is in a rural area. This also influences the temperature of drinking water and therefore the water quality. Although the biggest impacts of climate change will be felt many years from now, it is important to consider the long life-span of a water distribution network and the potential impacts on infrastructure integrity and water quality management. The replacement of water mains offers the opportunity to improve the network by, among other things, starting to take the impact of climate change into account now. For places where replacement is not feasible, and considering that climate change and water shortages are likely to influence the way water is used and stored, it is important to understand the potential consequences of elevated temperature to manage their risks in alternative ways.
Currently, during hot summers, there are concerns when water temperatures exceed 20 °C due to the increased risk of Legionella proliferating in premises water systems. With climate change and urbanisation, it is expected that drinking water temperatures will rise [29,62]. As there is hardly any monitoring being done, it is not easy to actually see this trend occurring. The effect of higher water temperatures (on health, organoleptic parameters) is not known. In some countries, this means that legislation is on the “safe side” and limits the drinking water temperature to 25 °C. However, it is not easy to guarantee water supply below this temperature. Firstly, there is no monitoring programme, so compliance is largely unknown and hard to enforce. Secondly, when there is a noncompliance, there is no easy operational measure available to resolve the issue. Flushing can work locally, but at the network scale, the system may not have enough pressure capacity to drastically shorten the residence times [63] and it provides only short or very short-term amelioration. Forensics to quickly determine where the problem is introduced upstream do not exist and when the problem location is determined it may be expensive to solve, too late to react and difficult to determine where the liability lies. Thirdly, when there is a large noncompliance, i.e., the problem is not local but instead occurring in the whole network, there is no operational measure available at all to resolve the issue. The only solution would be to install pipes deeper or take other (large scale) design and installation measures to ensure less effect of climate change or urbanisation on high soil temperatures. Alternatively, we could accept the inadequacy of DWDS and, for example, advocate solutions such as point-of-treatment via small packaged UV systems. Such systems are commercially available and, anecdotally, increasingly common in countries such as South Korea. However, the social, moral, and regulatory implications of such an approach are dramatic and far-reaching.
Another factor to consider is the increasing use of smart appliances and other water saving/demand management type technologies (e.g., rainwater harvesting, grey water recycling, smart meters, etc.). These technologies are likely to affect water temperature at different locations in the system, from property level to pipe network level. For example, increased use of rain or grey water may reduce potable water demand, increasing domestic plumbing and DWDS residence times, and increasing summer months’ heating effects from the surrounding air and ground, respectively. The impact of these technologies on water temperature is not currently well understood. Greywater poses an increased risk as it originates from heated sources in the home such as the shower, bath or clothes washing machine, with a notably increased temperature of the reused greywater, often combined with relatively poor quality when compared to water from the DWDS [64]. Alternatively, smart appliances may be managed to use water at specific times and locations to limit residence times by managing the flow through DWDS and premises to avoid peak high temperatures.
Other future changes in the urban environment (e.g., wider use of geothermal energy, district heating systems, etc.) and related planning which is increasingly done in an integrated way, based on the principles of circular economy and water–energy nexus type thinking, may result in further alterations of water temperatures in the built environment and consequentially DWDS water quality as well. The impact of temperature and its link to these issues is not understood well.

4.2. Knowledge Gaps and Future Research

Further studies on the influence of temperature on the interacting factors impacting drinking water safety as it travels through DWDS infrastructure are needed. Critical amongst these are biofilm structure, potential for disinfection, byproduct formation and overall biological stability. It is important that the effects of temperature are studied as an integral part of the complex physical, chemical and biological processes interacting within DWDSs. This must cover the full range of basic drinking water quality and representative physical conditions: water age, biological stability, Natural Organic Matter (NOM)/Assimilable Organic Carbon (AOC)/Total organic carbon (TOC) content, chlorine, chemical composition, infrastructure materials, surface area to volumes, hydraulic regimes, etc. Typical temperature ranges are usually limited in a specific supply area. Future studies and data gathered from DWDS in, for example, South European countries or in tropical networks such as the one mentioned here from Colombia, can aid to elucidate the global impact of climate change in DWDS. The practical first step could be to determine the effect (health, organoleptic parameters) of higher temperatures, and from this to determine a proper limit on temperature. Ideally, this should be done in an international context with various water qualities and temperatures and considering the local characteristics of the drinking water distribution systems, such as the water quality after treatment, use of chlorination, roof tanks or intermittent distribution.
The next step would be to look at which measures are possible and sufficient to ensure this realistic temperature limit, first using a model-driven approach, and then when sufficient data is available, by a data-driven approach. Things to consider in design and installation, for example, are the minimum distance between district heating pipes or electricity cables and drinking water pipes, the effect of installation depth, soil coverage by grass or shade. Additionally, tools have to be developed to predict and forecast the short-term consequences of heat waves [65,66] or long-term climate change. In this paper, the challenges and threats of higher drinking water temperatures were extensively reviewed. This research did not address opportunities, such as reclaiming thermal energy from drinking water. Some research [12,20,67] has been conducted showing there is potential.

5. Conclusions

A range of issues related to water temperature in drinking distribution systems and its potential impact on water quality in these systems was addressed in this paper. The methodology adopted is based on a literature review and a stakeholder survey conducted in nine countries.
Based on the information and results obtained, the following observations are made:
Water temperatures are monitored, but this is not done systematically, and data collected varies substantially across different countries. In most cases, water temperature is most frequently monitored at sources and treatment plants. There is limited and sporadic monitoring in the DWDS. This monitoring should be done more systematically for a number of reasons, including improved compliance testing and underpinning future research in this area. In many countries, temperature is already measured, such as part of when measuring for chlorine residuals on site, but is not recorded. Therefore, such data could readily be gained with minimal additional effort.
It is widely acknowledged in the literature and engineering practice of different countries that a link exists between drinking water temperature and quality—lower temperatures are linked to improved quality. However, this link is currently not well understood for a range of potential water quality issues. This includes the significance of the 25 °C threshold, which water utilities in some countries are already asked to comply with.
Water temperature varies as it travels from the water treatment works to a tap, primarily due to exchange with the surrounding ground and ground water. Whilst plausible models could be proposed to simulate the processes involved, these remain unverified at present. There is a need for anthropogenic heat sources, and pipe hydraulics.
A number of future changes in the surrounding environment are likely to impact the water temperature in the DWDS. These include climate change, urbanisation, more integrated urban planning, rainwater use, greywater reuse and wider application of water saving and other technologies. The impact of these changes on the DWDS temperature and consequential water quality is currently not well understood and requires future research.
The temperature in drinking water distribution systems is clearly an emerging concern in many countries around the world (not just in warmer climates) and hence should be studied more closely in the future and supported via suitable research funding programmes.

Author Contributions

Conceptualization and methodology, C.A.V. and M.B.; literature review, C.A.V.; Data collection (survey), S.A., E.C., A.D.N., A.D., I.D., K.E.F., P.L.I.R., N.J., H.E.J., J.M.S., C.M.P., O.P., C.Q., J.R., L.T.; writing—original draft preparation, C.A.V. and M.B.; review and editing, all authors; paper review and consolidation with additional text provided in places—Z.K., K.E.F., H.E.J. and J.B. All authors have read and agreed to the published version of the manuscript.

Funding

This research was partially funded by the European project WATQUAL https://www.sheffield.ac.uk/civil/wat-qual and partly by the joint research program (BTO) of the Dutch Drinking Water Companies.

Acknowledgments

We would like to thank Stewart Husband (University of Sheffield) for providing the pathway for dissemination and access to UK water companies and coordinated and gathering responses; Ceyhun Koseoglu (Bristol Water), Paul Gaskin (Dŵr Cymru Welsh Water) and Claire Moody (Anglian Water) for providing data, Marco Dignum (Waternet) for reading and commenting on the final version of the document.

Conflicts of Interest

The authors declare no conflict of interest.

References

  1. Smeets, P.W.M.H.; Medema, G.J.; Van Dijk, J.C. The Dutch secret: How to provide safe drinking water without chlorine in The Netherlands. Drink. Water Eng. Sci. 2009, 2, 1–14. [Google Scholar] [CrossRef] [Green Version]
  2. Uhl, W.; Schaule, G. Establishment of HPC(R2A) for regrowth control in non-chlorinated distribution systems. Int. J. Food Microbiol. 2004, 92, 317–325. [Google Scholar] [CrossRef] [PubMed]
  3. Rosario-Ortiz, F.; Rose, J.; Speight, V.; Gunten, U.v.; Schnoor, J. How do you like your tap water? Science 2016, 351, 912–914. [Google Scholar] [CrossRef] [PubMed]
  4. Douterelo, I.; Sharpe, R.L.; Husband, S.; Fish, K.E.; Boxall, J.B. Understanding microbial ecology to improve management of drinking water distribution systems. Wires Water 2019, 6, e01325. [Google Scholar] [CrossRef] [Green Version]
  5. Blokker, M.; Agudelo-Vera, C.; Moerman, A.; Van Thienen, P.; Pieterse-Quirijns, I. Review of applications for SIMDEUM, a stochastic drinking water demand model with a small temporal and spatial scale. Drink. Water Eng. Sci. 2017, 10, 1–12. [Google Scholar] [CrossRef] [Green Version]
  6. Douterelo, I.; Sharpe, R.L.; Boxall, J.B. Influence of hydraulic regimes on bacterial community structure and composition in an experimental drinking water distribution system. Water Res. 2013, 47, 503–516. [Google Scholar] [CrossRef]
  7. Liu, G.; Verberk, J.Q.J.C.; Van Dijk, J.C. Bacteriology of drinking water distribution systems: An integral and multidimensional review. Appl. Microbiol. Biotechnol. 2013, 97, 9265–9276. [Google Scholar] [CrossRef]
  8. Prest, E.I.; Hammes, F.; van Loosdrecht, M.C.M.; Vrouwenvelder, J.S. Biological Stability of Drinking Water: Controlling Factors, Methods, and Challenges. Front. Microbiol. 2016, 7, 45. [Google Scholar] [CrossRef]
  9. Sharpe, R.L.; Biggs, C.A.; Boxall, J.B. Hydraulic conditioning to manage potable water discolouration. In Proceedings of the Institution of Civil Engineers-Water Management; Thomas Telford Ltd.: London, UK, 2019; pp. 3–13. [Google Scholar]
  10. Blokker, E.J.M.; Pieterse-Quirijns, E.J.; Vogelaar, A.J.; Sperber, V. Bacterial Growth Model in the Drinking Water Distribution System—An Early Warning System; Prepared 2014.023; KWR: Nieuwegein, The Netherlands, 2012. [Google Scholar]
  11. Blokker, E.J.M.; Pieterse-Quirijns, I. Modeling temperature in the drinking water distribution system. J. Am. Water Works Assoc. 2013, 105, E19–E28. [Google Scholar] [CrossRef]
  12. De Pasquale, A.M.; Giostri, A.; Romano, M.C.; Chiesa, P.; Demeco, T.; Tani, S. District heating by drinking water heat pump: Modelling and energy analysis of a case study in the city of Milan. Energy 2017, 118, 246–263. [Google Scholar] [CrossRef]
  13. van der Zwan, S.; Pothof, I.; Dignum, M. Multifunctional design to prevent excessive heating of drinking water. In Proceedings of the IWA WCE 2012, Dublin, Ireland, 13–18 May 2012. [Google Scholar]
  14. Zlatanovic, L.; Moerman, A.; van der Hoek, J.P.; Vreeburg, J.; Blokker, M. Development and validation of a drinking water temperature model in domestic drinking water supply systems. Urban Water J. 2017, 14, 1031–1037. [Google Scholar] [CrossRef] [Green Version]
  15. Monteiro, L.; Figueiredo, D.; Covas, D.; Menaia, J. Integrating water temperature in chlorine decay modelling: A case study. Urban Water J. 2017, 14, 1097–1101. [Google Scholar] [CrossRef]
  16. Ingerson-Mahar, M.; Reid, A. Microbes in Pipes: The Microbiology of the Water Distribution System; American Academy of Microbiology: Boulder, CO, USA, 2013. [Google Scholar]
  17. DiGiano, F.A.; Zhang, W. Uncertainty Analysis in a Mechanistic Model of Bacterial Regrowth in Distribution Systems. Environ. Sci. Technol. 2004, 38, 5925–5931. [Google Scholar] [CrossRef] [PubMed]
  18. Fisher, I.; Kastl, G.; Sathasivan, A. A suitable model of combined effects of temperature and initial condition on chlorine bulk decay in water distribution systems. Water Res. 2012, 46, 3293–3303. [Google Scholar] [CrossRef]
  19. Machell, J.; Boxall, J. Modeling and field work to investigate the relationship between age and quality of tap water. J. Water Resour. Plan. Manag. 2014, 140, 04014020. [Google Scholar] [CrossRef]
  20. Blokker, E.J.M.; van Osch, A.M.; Hogeveen, R.; Mudde, C. Thermal energy from drinking water and cost benefit analysis for an entire city. J. Water Clim. Chang. 2013, 4, 11–16. [Google Scholar] [CrossRef]
  21. Agudelo-Vera, C.; Blokker, M.; De Kater, H.; Lafort, R. Identifying (subsurface) anthropogenic heat sources that influence temperature in the drinking water distribution system. Drink. Water Eng. Sci. Discuss. 2017, 10, 83–91. [Google Scholar] [CrossRef]
  22. Drink Water Directive. Drinkwaterbesluit. Available online: http://wetten.overheid.nl/BWBR0030111/geldigheidsdatum_25-02-2013 (accessed on 2 December 2019).
  23. Piller, O.; Tavard, L. Modeling the Transport of Physicochemical Parameters for Water Network Security. Procedia Eng. 2014, 70, 1344–1352. [Google Scholar] [CrossRef]
  24. Montoya-Pachongo, C.; Douterelo, I.; Noakes, C.; Camargo-Valero, M.A.; Sleigh, A.; Escobar-Rivera, J.-C.; Torres-Lozada, P. Field assessment of bacterial communities and total trihalomethanes: Implications for drinking water networks. Sci. Total Environ. 2018, 616, 345–354. [Google Scholar] [CrossRef]
  25. Jacobs, H.; Botha, B.; Blokker, M. Household Hot Water Temperature–An Analysis at End-Use Level. Proceedings of WDSA/CCWI Joint Conference, Kingston, ON, Canada, 23–25 July 2018. [Google Scholar]
  26. Novakova, J.; Rucka, J. Undesirable consequences of increased water temperature in drinking water distribution system. Mm Sci. J. 2019, 2019, 3695–3701. [Google Scholar] [CrossRef] [Green Version]
  27. South African National Standard. South African National Standard. South African National Standard SANS 2001-DP1 Edition 1.1. In Construction Works Part DP1: Earthworks for Buried Pipelines and Prefabricated Culverts; 2011 Edition 1.1 South African National Standard—Construction Works Part DP1: Earthworks for Buried Pipelines and Prefabricated Culverts; SABS Standards: Pretoria, South Africa, 2011; ISBN 978-0-626-25160-4. [Google Scholar]
  28. Services, W. Guidelines for Design of Water Reticulation and Pumping Stations; Watercare Services Ltd.: Auckland, New Zealand, 2013. [Google Scholar]
  29. Agudelo-Vera, C.M.; Blokker, E.J.M.; van der Wielen, P.W.J.J.; Raterman, B. Drinking Water Temperature in Future Urban Areas; BTO 2015.012; KWR: Nieuwegein, The Netherlands, 2015. [Google Scholar]
  30. Herb, W.R.; Janke, B.; Mohseni, O.; Stefan, H.G. Ground surface temperature simulation for different land covers. J. Hydrol. 2008, 356, 327–343. [Google Scholar] [CrossRef]
  31. Mihalakakou, G. On estimating soil surface temperature profiles. Energy Build. 2002, 34, 251–259. [Google Scholar] [CrossRef]
  32. Menberg, K.; Bayer, P.; Zosseder, K.; Rumohr, S.; Blum, P. Subsurface urban heat islands in German cities. Sci. Total Environ. 2013, 442, 123–133. [Google Scholar] [CrossRef] [PubMed]
  33. Menberg, K.; Blum, P.; Schaffitel, A.; Bayer, P. Long-term evolution of anthropogenic heat fluxes into a subsurface urban heat island. Environ. Sci. Technol. 2013, 47, 9747–9755. [Google Scholar] [CrossRef]
  34. Müller, N.; Kuttler, W.; Barlag, A.-B. Analysis of the subsurface urban heat island in Oberhausen, Germany. Clim. Res. 2014, 58, 247–256. [Google Scholar] [CrossRef] [Green Version]
  35. Shang, F.; Uber, J.G. EPANET Multi-Species Extension User’s Manual; EPA/600/S-07/021; EPA: Cincinnati, OH, USA, 2008.
  36. Lautenschlager, K.; Boon, N.; Wang, Y.; Egli, T.; Hammes, F. Overnight stagnation of drinking water in household taps induces microbial growth and changes in community composition. Water Res. 2010, 44, 4868–4877. [Google Scholar] [CrossRef]
  37. Lipphaus, P.; Hammes, F.; Kötzsch, S.; Green, J.; Gillespie, S.; Nocker, A. Microbiological tap water profile of a medium-sized building and effect of water stagnation. Environ. Technol. 2014, 35, 620–628. [Google Scholar] [CrossRef]
  38. Jacobs, H. Personal Communication. 13 February 2020. [Google Scholar]
  39. WHO. Guidelines for Drinking-Water Quality; WHO: Geneva, Switzerland, 2006. [Google Scholar]
  40. WHO. A Global Overview of National Regulations and Standards for Drinking-Water Quality; WHO: Geneva, Switzerland, 2018; Handleiding Legionellapreventie in leidingwater. Richtlijnen voor prioritaire installaties. [Google Scholar]
  41. ISSO 55.1. Handleiding. Legionellapreventie in Leidingwater. Richtlijnen Voor Prioritaire Installaties; ISSO: Rotterdam, The Netherlands, 2012; pp. 94–95. [Google Scholar]
  42. Real Decreto 140/2003, de 7 de febrero, por el que se establecen los criterios sanitarios de la calidad del agua de consumo humano. In Boletín Oficial del Estado 2003; Ministerio de Sanidad y Consumo: Madrid, España, 1980; Volume 45.
  43. Real Decreto 865/2003, de 4 de julio, por el que se establecen los criterios higiénico-sanitarios para la prevención y control de la legionelosis. In Boletín Oficial del Estado 2003; Ministerio de Sanidad y Consumo: Madrid, España, 2003; Volume 171.
  44. Carrim, M.; Cohen, C.; de Gouveia, L.; Essel, V.; Mc Carthy, K.; Stewart, R.; Thomas, T.; von Gottberg, A.; Wolter, N. Legionnaires’disease: Nicd recommendations for diagnosis, management and public health response. Foreword Contents 2016, 14, 137. [Google Scholar]
  45. Britain, G. Control of Substances Hazardous to Health Regulations 2002; The Stationery Office: London, UK, 2002. [Google Scholar]
  46. Preciado, C.C.; Boxall, J.; Soria-Carrasco, V.; Douterelo, I. Effect of temperature increase in bacterial and fungal communities of chlorinated drinking water distribution systems. Access Microbiol. 2019, 1. [Google Scholar] [CrossRef]
  47. van der Kooij, D.; van der Wielen, P. Microbial Growth in Drinking Water Supplies. Problems, Causes, Control and Research Needs; Kooij, D.v.d., Wielen, P.W.v.d., Eds.; Iwa Publishing: London, UK, 2013. [Google Scholar]
  48. Stone, W.; Louw, T.M.; Gakingo, G.K.; Nieuwoudt, M.J.; Booysen, M.J. A potential source of undiagnosed Legionellosis: Legionella growth in domestic water heating systems in South Africa. Energy Sustain. Dev. 2019, 48, 130–138. [Google Scholar] [CrossRef] [Green Version]
  49. WHO. Legionella and the Prevention of Legionellosis; WHO: Geneva, Switzerland, 2007. [Google Scholar]
  50. van der Lugt, W.; Euser, S.M.; Bruin, J.P.; den Boer, J.W.; Yzerman, E.P.F. Wide-scale study of 206 buildings in The Netherlands from 2011 to 2015 to determine the effect of drinking water management plans on the presence of Legionella spp. Water Res. 2019, 161, 581–589. [Google Scholar] [CrossRef] [PubMed]
  51. Söderberg, M.A.; Rossier, O.; Cianciotto, N.P. The type II protein secretion system of Legionella pneumophila promotes growth at low temperatures. J. Bacteriol. 2004, 186, 3712–3720. [Google Scholar] [CrossRef] [PubMed] [Green Version]
  52. Blokker, E.J.M.; Schaap, P.G. Effecten van Temperatuur op Bruinwaterrisico; KWR 2015.091; KWR: Nieuwegein, The Netherlands, 2015. [Google Scholar]
  53. van Summeren, J.; Raterman, B.; Vonk, E.; Blokker, M.; van Erp, J.; Vries, D. Influence of Temperature, Network Diagnostics, and Demographic Factors on Discoloration-Related Customer Reports. Procedia Eng. 2015, 119, 416–425. [Google Scholar] [CrossRef]
  54. Francisque, A.; Rodriguez, M.J.; Miranda-Moreno, L.F.; Sadiq, R.; Proulx, F. Modeling of heterotrophic bacteria counts in a water distribution system. Water Res. 2009, 43, 1075–1087. [Google Scholar] [CrossRef] [PubMed]
  55. Niquette, P.; Servais, P.; Savoir, R. Bacterial Dynamics in the drinking water distribution system of Brussels. Water Res. 2001, 35, 675–682. [Google Scholar] [CrossRef]
  56. Vital, M.; Dignum, M.; Magic-Knezev, A.; Ross, P.; Rietveld, L.; Hammes, F. Flow cytometry and adenosine tri-phosphate analysis: Alternative possibilities to evaluate major bacteriological changes in drinking water treatment and distribution systems. Water Res. 2012, 46, 4665–4676. [Google Scholar] [CrossRef]
  57. Li, X.; Gu, D.-M.; Qi, J.-Y.; Ukita, M.; Zhao, H.-B. Modeling of residual chlorine in water distribution system. J. Environ. Sci. 2003, 15, 136–144. [Google Scholar]
  58. Sunny, I.; Husband, S.; Boxall, J. Seasonal Temperature and Turbidity Behaviour in Trunk Mains. Proceedings of WDSA/CCWI Joint Conference, Kingston, ON, Canada, 23–25 July 2018. [Google Scholar]
  59. van der Wielen, P.W.J.J.; van der Kooij, D. Nontuberculous Mycobacteria, Fungi, and Opportunistic Pathogens in Unchlorinated Drinking Water in The Netherlands. Appl. Environ. Microbiol. 2013, 79, 825. [Google Scholar] [CrossRef] [Green Version]
  60. Pinto, A.J.; Xi, C.; Raskin, L. Bacterial Community Structure in the Drinking Water Microbiome Is Governed by Filtration Processes. Environ. Sci. Technol. 2012, 46, 8851–8859. [Google Scholar] [CrossRef]
  61. Li, X.; Zhao, H.-b. Development of a model for predicting trihalomethanes propagation in water distribution systems. Chemosphere 2006, 62, 1028–1032. [Google Scholar] [CrossRef]
  62. Levin Ronnie, B.; Epstein Paul, R.; Ford Tim, E.; Harrington, W.; Olson, E.; Reichard Eric, G.U.S. drinking water challenges in the twenty-first century. Environ. Health Perspect. 2002, 110, 43–52. [Google Scholar] [CrossRef] [PubMed] [Green Version]
  63. Blokker, E.J.M.; Pieterse-Quirijns, E.J. Scenariostudies Voor Beperken Invloed Klimaatveranderingen op Temperatuur en Kwaliteit Drinkwater in Het Net; KWR 2012.017; KWR Watercycle Research Institute: Nieuwegein, The Netherlands, 2012. [Google Scholar]
  64. Nel, N.; Jacobs, H.E. Investigation into untreated greywater reuse practices by suburban households under the threat of intermittent water supply. J. Water Sanit. Hyg. Dev. 2019, 9, 627–634. [Google Scholar] [CrossRef]
  65. Agudelo-Vera, C.; Blokker, M.; Pieterse-Quirijns, I. Early Warning Systems to Predict Temperature in the Drinking Water Distribution Network. Procedia Eng. 2014, 70, 23–30. [Google Scholar] [CrossRef] [Green Version]
  66. Agudelo-Vera, C.M.; Blokker, E.J.M.; Pieterse-Quirijns, E.J. Early warning system to forecast maximum temperature in drinking water distribution systems. J. Water Supply Res. Technol. AQUA 2015, 64, 496–503. [Google Scholar] [CrossRef]
  67. Hubeck-Graudal, H.; Kirstein, J.; Ommen, T.; Rygaard, M.; Elmegaard, B. Drinking water supply as low-temperature source in the district heating system: A case study for the city of Copenhagen. Energy 2020, 194, 116773. [Google Scholar] [CrossRef]
Figure 1. Measured water temperature at two pumping stations in The Netherlands—one from surface water (SW) and the other from ground water (GW)—and the respective temperatures at the tap measured at random locations in the separate drinking water distribution system (DWDS) [29].
Water 12 01049 g001
Figure 2. Heating up of the drinking water temperature in (a) polyvinyl chloride (PVC) distribution pipes with inside diameters between 59 mm and 152 mm. Original water temperature is 15 °C and soil temperature is 25 °C; (b) plastic connection pipes with inside diameters between 19.6 mm and 31.4 mm. Original water temperature is 20 °C and soil temperature is 25 °C.
Water 12 01049 g002
Figure 3. Example of simulation of the temperature in the DWDS [10].
Water 12 01049 g003
Figure 4. Measured temperature versus the calculated water mean age along flow routes for a network with two Service Reservoirs (SRs), with permission from the American Society of Civil Engineers (ASCE) [19].
Water 12 01049 g004
Figure 5. Schematic representation of the one-dimensional soil temperature model, with permission from Copernicus Publications [21].
Water 12 01049 g005
Table 1. Overview of recorded temperatures SW = surface water, GW = ground water, MW = Mix of GW and SW, RDT: Random Day Time.
CountrySourceWater Treatment PlantAt the Customer
Colombia a13–28 °C16–26 °C25–28 °C
Czech RepublicGW: 6–15 °C bSW: 4–11 °C cMW: 2–24 °C d
FranceGW: 12 °C eRDT: 10 <25 °C f
Italy6–15°C g
Netherlands hSW: 2–23 °C
GW: 12–13°C
RDT: 4–25 °C
Serbia9–16 °C i
SW: 6–27 °C j
GW: 12–18 °C j
5–18 °C i
South Africa10–28 °C k20.5–24.5 °C l
Spain10–29 °C m
United KingdomSW: 1–21°C nSW: 2–26 °C o
GW: 10–18 °C o
MW: 2–23 °C o
SW: 3–24 °C p
GW: 11–12 °C p
MW: 6–22 °C p
SW: 3–25 °C o
GW: 4–27 °C o
MW: 4–26 °C o
a City of Cali—At the source and water treatment plant: daily measurements, years: 2017–2018, at the tap: nine water samples collected in different days [24]. b City of Vsetín, Czech Republic—ground water source, bank infiltration from Bečva river, year 2018–2019. c City of Vsetín, Czech Republic—WTP from valley reservoir Karolinka, years 2018–2019. d City of Vsetín, Czech Republic—costumer’s tap in the city center, years 2018–2019. e At Strasbourg—ground water. For other locations, it can exceed 25 °C in some situations. f ARS 2020 http://www.eaupotable.sante.gouv.fr. Exceedances of the reference temperature (25 °C) on the water of the distribution networks are frequent in the summer period (2017 results: 138 noncompliant values out of 800 samples taken in June, July and August and 3500 during the year; source ARS). g Campania, Southern Italy. h Rotterdam, tap samples—RDT, years 2008–2012. i Measurements in the city of Pancevo, Serbia, between Feb 2017 and Jan 2018 at three locations: two at the city center and the third a village nearly 18 km from the WTP. j Belgrade, Serbia—Years 2013–2018. k Nonsystematically monitored. l Jacobs et al. [25]. m City of Murcia, Spain. Year 2009. Measurements in the water treatment plants and in the network. n Dŵr Cymru Welsh Water—years 2010–2017. o Anglian Water—2018. p Bristol Water—2018 daily measurements.
Table 2. Legal standards and monitoring of the surveyed countries.
CountryLegal Standard for Drinking Water TemperatureLegal Standard for Legionella
ColombiaNo legal standardNo legal standard
Czech RepublicDecree No. 252/2004 Coll.
Decree laying down hygiene requirements for drinking and hot water and frequency and scope of drinking water control. The recommended temperature of drinking water at the customer‘s tap is between 8 and 12 °C.
Decree No. 252/2004 Coll.
Decree laying down hygiene requirements for drinking and hot water and frequency and scope of drinking water control. This indicator is only set for hot water, where the limit of 100 HTP/100 mL is mandatory. This is the limit that applies to health and accommodation facilities, hot water supplied to showers of artificial or natural pools and drinking water used for hot water production; for other buildings, it is the recommended value to be sought through technical measures. The limit 0 HTP/100 mL as the highest limit value applies to wards of hospitals where immunocompromised patients are located
FranceThe temperature at the consumer’s tap should be less than 25 °C (decree from 11 January 2017) in metropolitan France.For water heating systems of public premises (hospital, hostel, camping, retreat houses, etc.) and cooling towers there is a regulation for environmental monitoring of Legionella. Since 1 August 2012, monitoring has been based on culture methods (as per Standard NF T90-431 “Detection and enumeration of Legionella spp. and of Legionella pneumophila by culture in agar media”. However, there are several detection and enumeration methods for Legionella that are under development or that are currently in use to greater or lesser extents.
Since 1 January 2012, monitoring is mandatory on hot water networks for establishments receiving the public ANSES (French Agency for Food, Environmental and Occupational Health & Safety).
ItalyNo legal standard. However, it is recommended that temperature should range between 12 °C and 25 °C (Rapporti ISTISAN 97/9, Istituto Superiore della Sanità)National guidelines from Conferenza Stato-Regioni del 07 maggio 2015. Drinking water temperature must be controlled to be outside of the critical range 20–50 °C to prevent Legionella infections.
NetherlandsThe Dutch Drinking Water Directive contains a maximum temperature limit of 25 °C at the tap [22].National guidelines concerning prevention of Legionella infections that state the drinking water temperature in a building may not exceed 25 °C, and hot water temperatures must be at least 55 °C [41].
SerbiaDrinking water quality standards (Official gazette of FRYu, No. 42/98 and 44/99, Official gazette of RS No. 28/19), temperature at the consumer is not set, but there is a requirement that it shall not be higher than the temperature at the source.No standards
SpainNo standardsThere are two laws that establish some parameters related to Legionella: (a) Royal Decree 140/2003 of February 7th [42] establishing the sanitary criteria for quality of water for human consumption. In this law, there is no mention to temperature nor Legionella at all, but fixes all the values applied to suitable drinking water. It also fixes that sampling protocols for every water company. (b) Royal Decree 865/2003, of 4 July [43] establishes hygienic-sanitary criteria for the prevention and control of Legionnaires’ disease. The aim of this law consists of preventing and controlling legionellosis by adopting hygienic and sanitary measures in those facilities where Legionella can proliferate and spread. In this sense, it focuses on hot water facilities inside the buildings. The Building Technical Standards (CTE from its initials in Spanish) for the design of plumbing installations inside buildings CTE-DB H4 are based on the aforementioned law. There is a nonmandatory recommendation for drinking water to be under 20 °C where weather conditions allow.
South AfricaNo standardsNo standards around the presence of Legionella in drinking water. The National Institute for Communicable Diseases [44] recommends: “The proper design, maintenance and temperature of potable water systems are the most important method for preventing the amplification of Legionella. Hot water should be stored above 60 °C and delivered to taps above 50 °C. Cold water should be stored below 20 °C, and dead legs or low flow areas eliminated.”
Legionnaires disease is a notifiable health condition (compulsory notification) in South Africa.
United KingdomNo standards. The Water Fittings Regulations Guidance book advises to try and keep water supplied to 20 °C as a maximum.Health and Safety England (HSE) have produced a document which is an “Approved Code of Practice” regarding controlling Legionella in water systems. The risk assessment, prevention and control of Legionella falls under the 1974 Health and Safety at Work Act (HSWA) and a framework for this assessment is covered by the Control of Substances Hazardous to Health Regulations 2002 (COSHH) [45].
Guidelines suggest control measures of:
  • Cold water stored <20 °C and distributed to all outlets at <20 °C within two minutes of operation
  • Hot water stored at 60 °C and distributed to outlets at >50 °C within 1 min of operation
Table 3. Scientific studies on the effects of temperature in the distribution network or at the tap.
AspectLocationReference
Changes in bacterial dynamicsNetwork[19,54,55,56]
Increased chlorine decayNetwork[15,19,57]
Increased discolouration riskNetwork/tap[19,52,53,58]
L. pneumophila and opportunistic pathogens[59]
Seasonal shifts in bacterial communitiesEffluents of treatment utilities[60]
Trihalomethanes propagation in DWDSNetwork[61]

