Article

Flow Measurements Using a Sluice Gate; Analysis of Applicability

1
Water Center of Warsaw University of Life Sciences-SGGW, Ciszewskiego 6, 02-776 Warsaw, Poland
2
Institute of Environmental Engineering, Department of Hydraulic and Sanitary Engineering, Faculty of Civil and Environmental Engineering, Warsaw University of Life Sciences-SGGW, 02-797 Warsaw, Poland
3
Department of Hydro and Environmental Engineering, Faculty of Building Services, Warsaw University of Technology, 00-653 Warszawa, Poland
*
Author to whom correspondence should be addressed.
Water 2020, 12(3), 819; https://doi.org/10.3390/w12030819
Submission received: 10 February 2020 / Revised: 11 March 2020 / Accepted: 11 March 2020 / Published: 14 March 2020
(This article belongs to the Section Hydraulics and Hydrodynamics)

Abstract

:
This study analyzes the possibilities of using an irrigation sluice gate in submerged conditions to measure water flow rate. Hydraulic experiments on sluice gate discharge capacity were performed on a model made on a 1:2 scale. Measurements were taken for the submerged flow of the sluice gate. Nomograms and relationships for discharge coefficients of the analyzed sluice gate were developed. The possibility of using the existing nomogram for discharge capacity of the submerged sluice gate to determine the discharge capacity of the modeled gate was also investigated. The effect of narrowing of the sluice gate cross-section resulting from different mounting techniques on its capacity was explained. The analyses confirmed the possibility of using the formulas for the submerged sluice gate to estimate the flow through the irrigation sluice gate.

1. Introduction

The use of existing sluice gates in irrigation hydraulic constructions after their calibration to measure the water flow rate is not a new problem [1,2,3,4,5,6,7,8,9]. The water flow through the sluice gate has long been the subject of numerous theoretical analyzes, and laboratory and field experiments [10,11]. Depending on the water depth downstream the gate from its edge, two hydraulic conditions can be distinguished: free and submerged flows. Free flow conditions are present when the downstream water depth is below the gate invert and downstream water depth has no effect on the flow under the gate. Submerged flow means the rise of downstream water level above the gate invert and downstream water affects upstream water depth. On the basis of numerous hydraulic experiments, the values of the discharge coefficients used in one-dimensional formulas were determined, linking the water depths upstream and downstream, the gate, and the gate opening height and its width with the water flow rate for both of these flow forms. Most of these experiments were carried out in a flume with a horizontal bottom, a rectangular cross-section and a width, corresponding to the width of the gate. The use of these formulas and coefficients to determine the flow rate for submerged gate outlets in hydraulic structures of irrigation canals, such as intake gates, requires the clarification of many issues, including the most important:
  • Is it possible to use the given formulas and discharge coefficients determined for the submerged gate outflow for structures with the gate installed in intake canals with trapezoidal cross-sections?
  • Where should the downstream water depth measured for the submerged gate be, installed in a canal with rectangular cross-section, to ensure a good fit between measured and calculated flow rates?
  • How does the construction of guides necessary for lifting the gate (changing the width of the opening in relation to the width of the channel) affect the values of the flow coefficients for the submerged flow conditions?
An attempt to answer these questions was the goal of the hydraulic experiments undertaken and described in this work. Because, in practice, unsubmerged flow conditions in irrigation intake structures rarely occur, the study focuses on the submerged flow in the sluice gate.

2. Methods

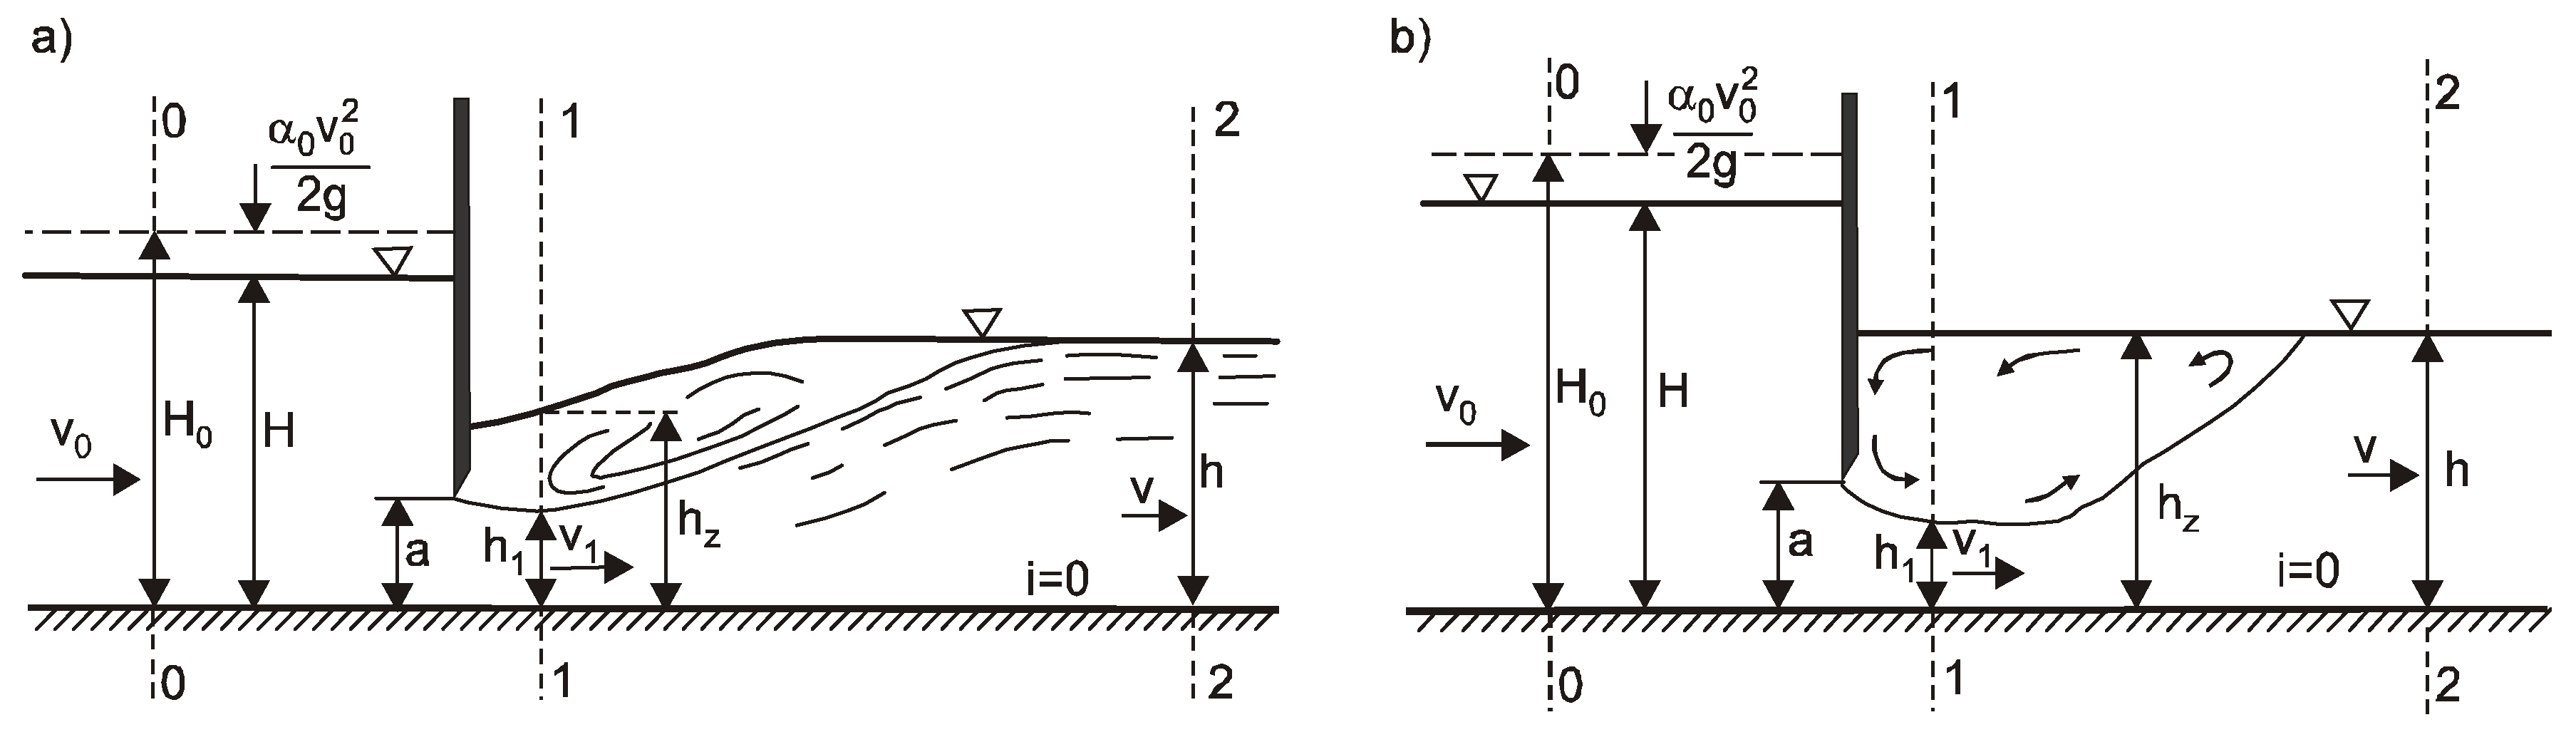
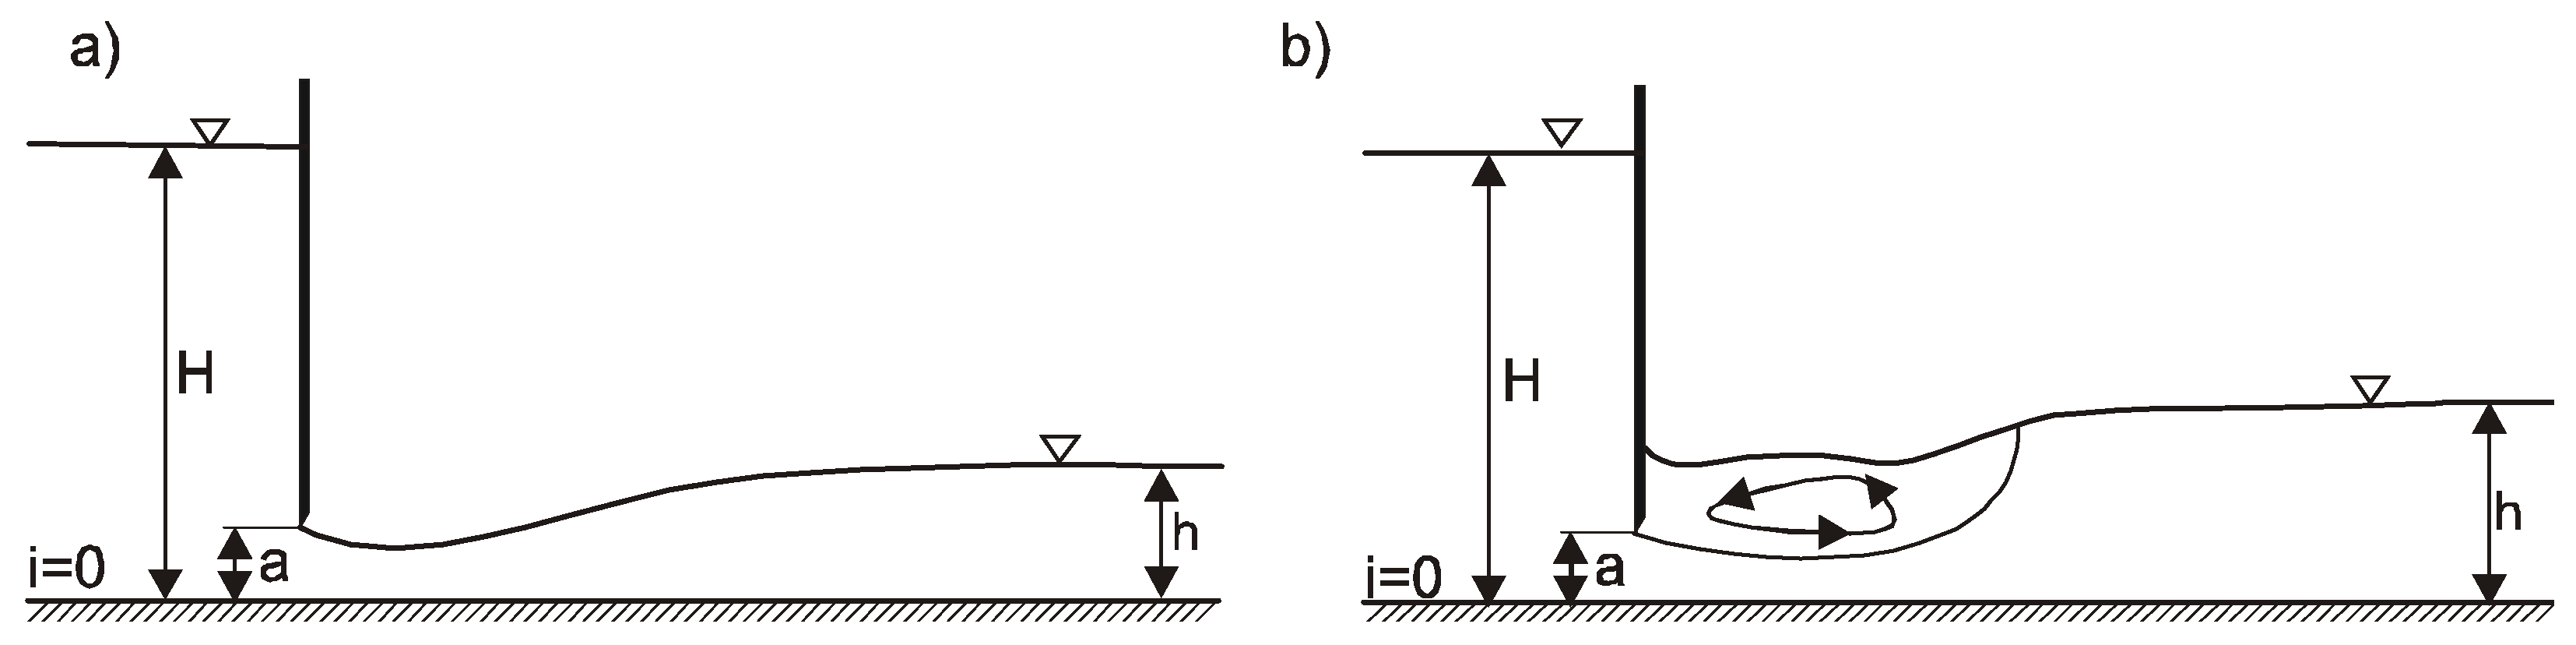
2.1. One-Dimensional Description of the Sluice Gate Flow

In submerged conditions of a sluice gate flow, a hydraulic jump is formed immediately downstream of the gate. This jump can take the form shown in Figure 1a, when the water depth hz at the gate outflow is noticeably lower than the water depth h in a downstream channel (hz < h) or a form of the submerged hydraulic jump (Figure 1b), when the water depth hz is close to the water depth in the downstream channel (hz ≈ h). The water profile downstream of the gate for the hydraulic jump formed is unstable and wavy (Fig. 1a).
The flow rate of the submerged sluice gate is calculated on the basis of velocity v1 at depth hz determined using the equation of energy conservation between Sections 0-0 and 1-1:
Q = μ a b 2 g ( H 0 h z )
The values of the discharge coefficient µ for free flow (unsubmerged) are μ = ε ϕ , where ε—contraction coefficients, defined as the ratio of a final cross-sectional area of the gate opening, if only normal stresses act, the magnitude of this coefficient will depend entirely on the boundary geometry (H/a); ϕ —velocity coefficients defined as the ratio between the actual velocity of a water stream at vena-contracta and theoretical velocity of the stream and depth in cross-section 1-1 given by h 1 = ε a . The values of contraction coefficients ε for the free flow conditions are determined on the basis of hydraulic experiments, which can be found in the literature [12,13]. In a one-dimensional description of the submerged sluice gate flow, the location of cross-section 1-1, where the depth hz necessary in Equation (1) should be measured, is not clearly defined. With the submerged jump, it is assumed that the depth hz is equal to the depth of the downstream i.e., hz ≈ h (Figure 1b).
To calculate the flow of the submerged sluice gate with a submerged jump, the relationship derived for a free flow is also used, where the depth in cross-section 1-1 is given with the relationship h 1 = ε a [14]:
Q = C d a b 2 g H
The discharge coefficient Cd (2) is defined as follows:
C d = ε 1 + ε a H
According to Swamee (1992) [15], the sluice gate is submerged, if the following condition (Figure 2) is fulfilled:
H < 0.81 h ( h a ) 0.72
where H—water depth upstream the gate, h—water level downstream the gate, a—gate opening height.
Swamee (1992) [15], based on the Henry (1950) [16] studies on free and submerged flows under the sluice gate, confirmed later by Rajaratnam and Subramanya (1967) [17], developed regression dependencies for the discharge coefficients Cd. In the case of the free flow conditions, the discharge coefficients depended on the upper water depth H and the opening height of the gate a. However, in the case of the submerged outflow, it is necessary to condition its value on the downstream water depth h. Swamee (1992) [15] provided a relationship describing the dependency of the discharge coefficient for the submerged sluice in the following form:
C d = 0.611   ( H a H + 15 a ) 0.072 ( H h ) 0.7 { 0.32 [ 0.81 h ( h a ) 0.72 H ] 0.7 + ( H h ) 0.7 } 1
Introducing the above equation to Equation (2) allows computation of flow rate:
Q = 0.864 a b g H ( H a H + 15 a ) 0.072 ( H h ) 0.7 { 0.32 [ 0.81 h ( h a ) 0.72 H ] 0.7 + ( H h ) 0.7 } 1
The variability of the discharge coefficient given by Equation (5) as a function of depths upstream and downstream the gate, and gate opening height C d = f   ( H a ; h a ) , is given in Figure 3.
The given relationships for submerged sluice gate flow were determined for hydraulic experiments carried out in a horizontal channel with a rectangular cross-section and the width equal to the width of the gate. The flow through the irrigation sluice gate takes for different inflow conditions, shaped by the trapezoidal cross-section of the upstream and downstream channels.

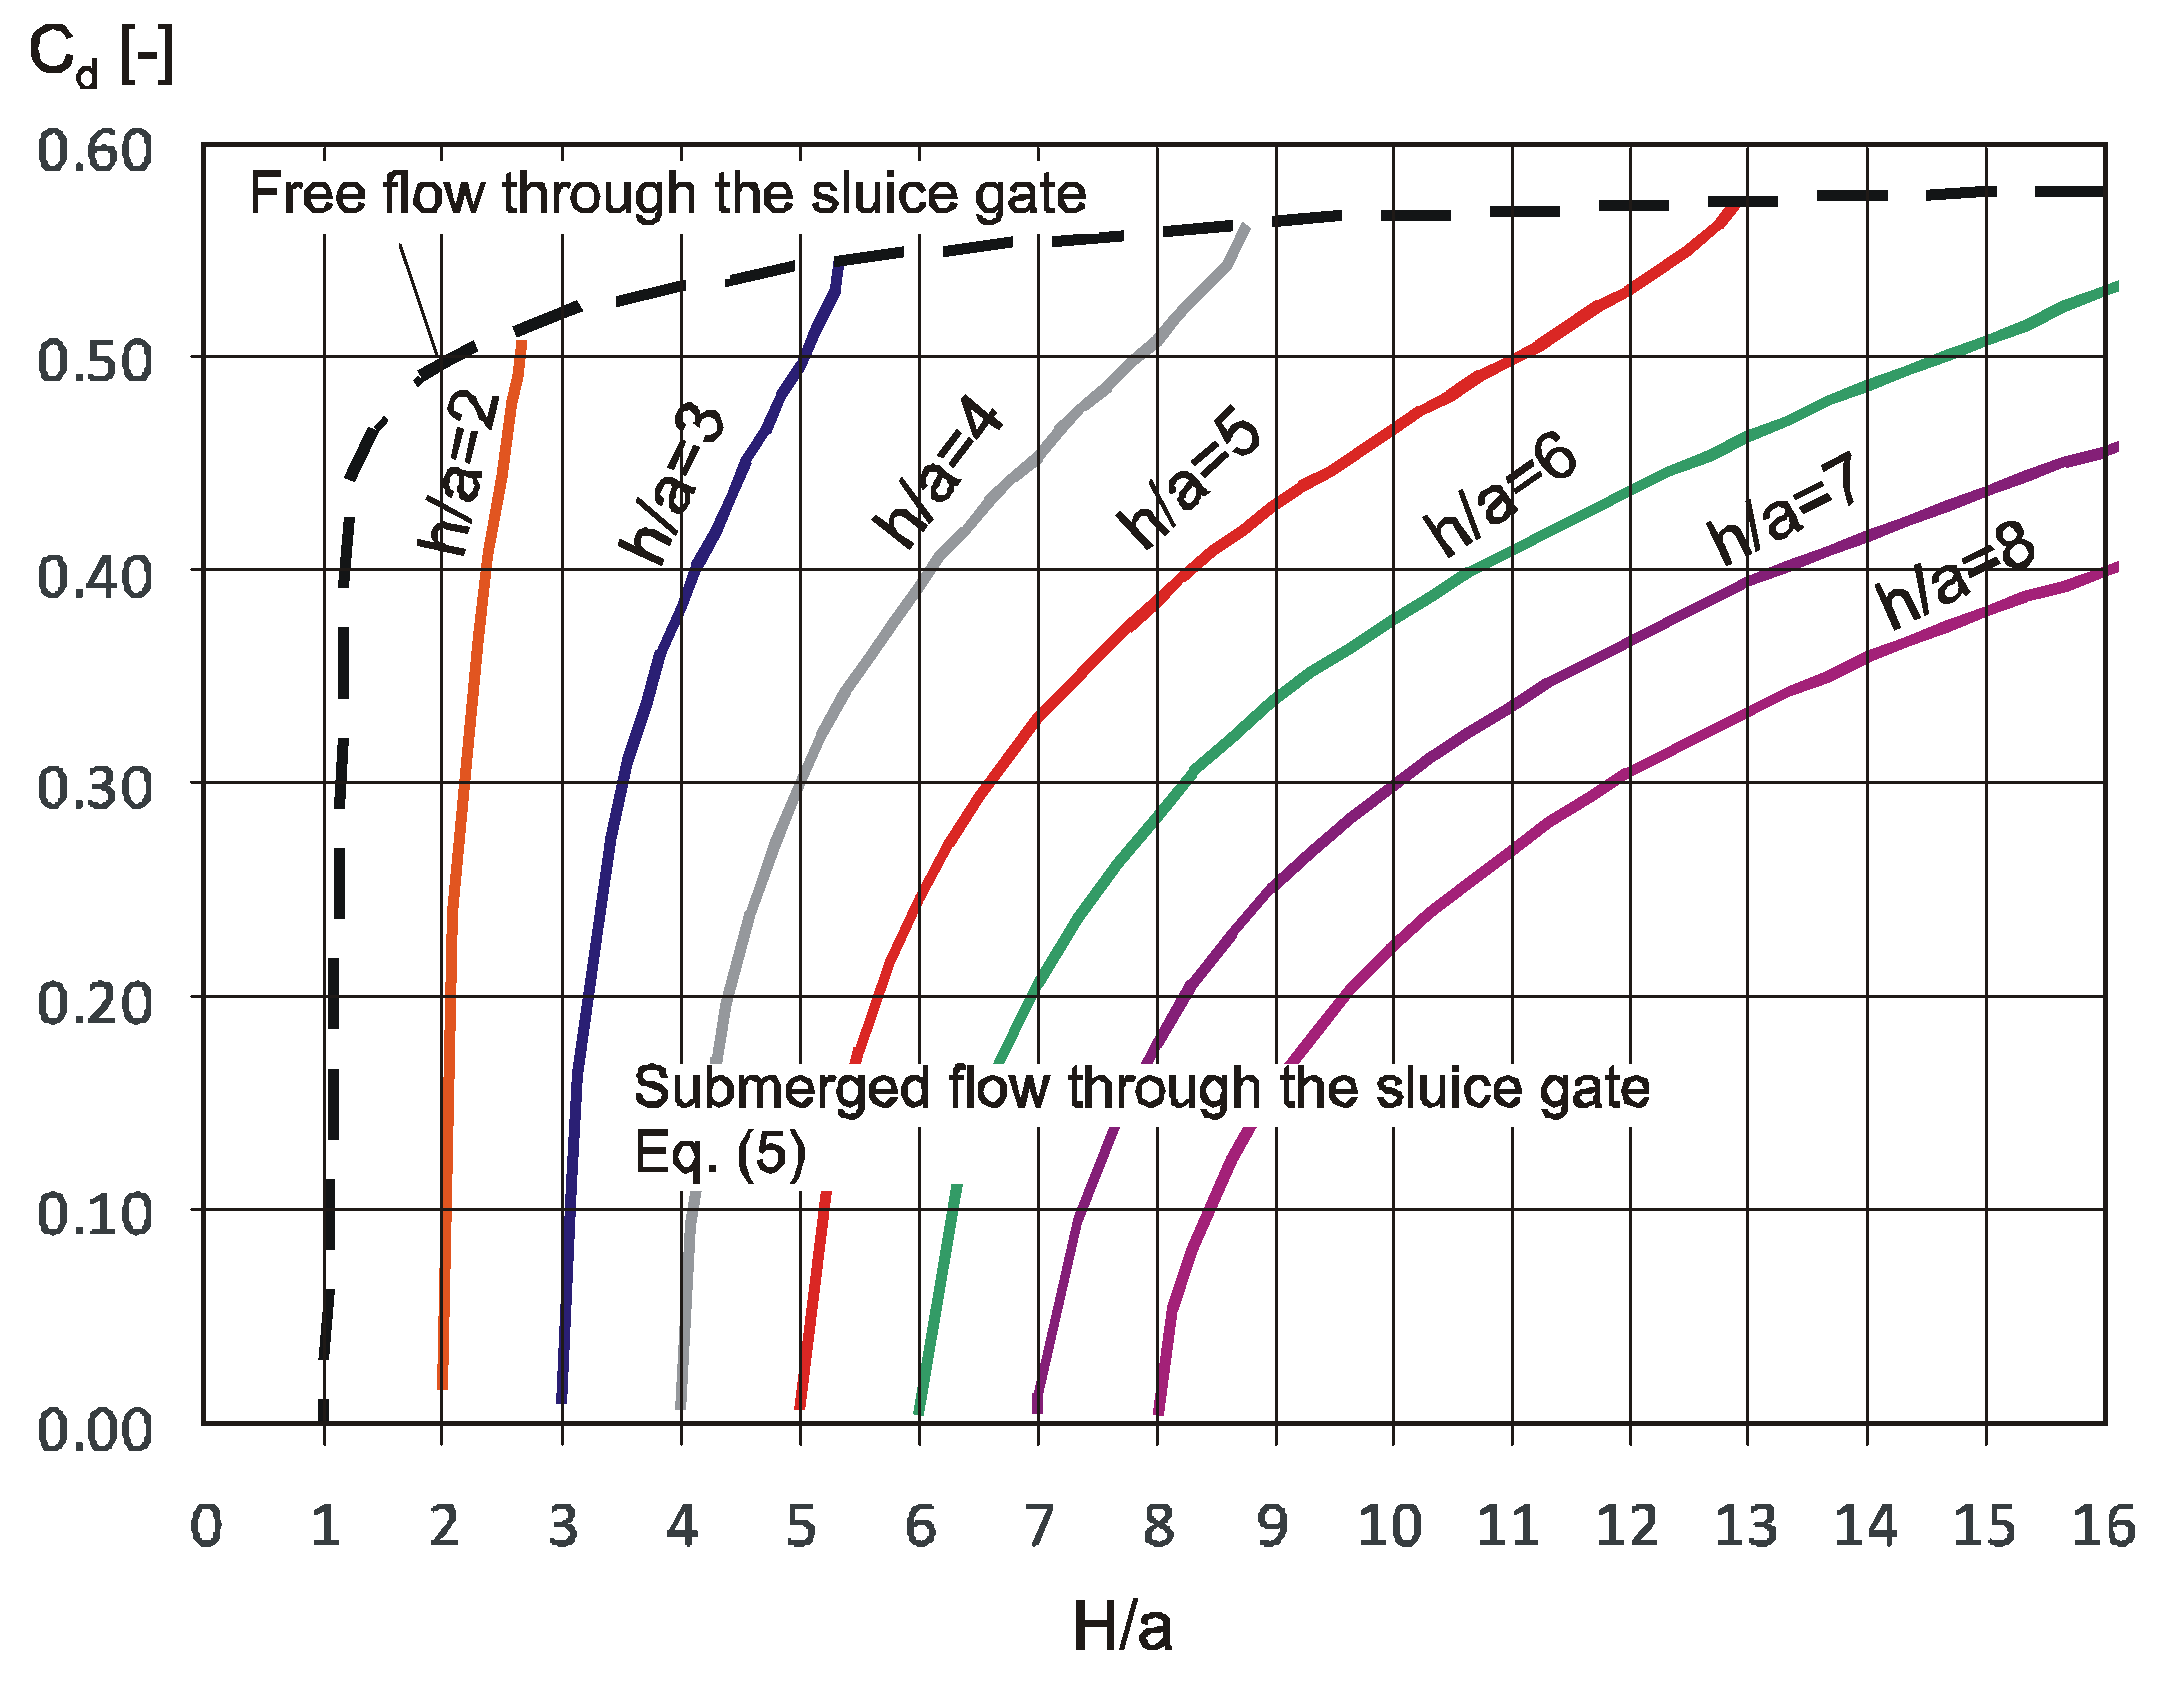
2.2. Studies on Submerged Flow through Irrigation Sluice Gate

Hydraulic experiments on discharge capacity using a model of the irrigation sluice gate installed in the trapezoidal canal were performed in a hydraulic laboratory at the Faculty of Civil and Environmental Engineering, Warsaw University of Life Sciences (WULS-SGGW). The gate model was built on a 1:2 scale, compared to the prototype structures used in practice [18]. The gate is made of rectangular PVC with dimensions of 0.43 × 0.50 m and thickness of 0.018 m. Two test cases were included. In Case 1 (V1), the gate guides were narrowing the width of the opening from 0.40 m to b = 0.34 m (Figure 4a). In Case 2 (V2), the guides were shaped in the abutment walls in such a way that they did not reduce the opening width. The channel width at the outflow was b = 0.40 m (Figure 4b).
The sluice gate model was supplied from a closed water cycle of the hydraulic laboratory. The water flow rate was measured by an induction flow meter. It was possible to change downstream water conditions by fixing the water depth. A hinged overflow gate mounted at a distance of 3.20 m below the sluice gate was used for this. The overflow gate setting allowed to simulate the downstream water depth in the drainage channel, shaped by changing flow conditions, caused in practice by the increase of flow resistance in the canal due to vegetation growth. After stabilizing the water levels, upstream and downstream depths were measured in the channel axis using pin gauges equipped with a contact indicator. The accuracy of the pin gauge was 0.1 mm. The downstream water depths were measured in a cross-section located 3.035 m below the valve, while the water depths in the upper stand were measured at a distance of 2.0 m in front of the gate model (Figure 4c). The measured upper and downstream water depths were used to calculate the flow coefficients for the submerged flow of the sluice gate. Depth measurements were made for gate openings a within (0.031 ÷ 0.101) m. In the V1 400 and V2 1200 experiments, Q ( 10.7 ÷ 51.0 )   d m 3 s 1 was performed. The experiment was initiated with the smallest flow rate at which it was possible to obtain a submerged sluice gate flow. The flow rate was then increased to a value at which the upstream water depth H did not exceed channel banks.
In addition, in Case V1 38, downstream water profiles were taken on the basis of measured water depths, along the channel axis, using a water gauge mounted on a carrier. The first measuring cross-section was 0.035 m below the gate. The distances between successive sections were equal to 0.10 m. After exceeding the distance of 1.035 m below the gate, subsequent sections were at a distance of 0.50 m. The last measuring section was at a distance of 3.035 m below the gate (Figure 4b).
The downstream water depth h was defined as the depth in the trapezoidal cross-section channel with a width in the bottom equal to 0.20 m, slope inclination 1:1, bottom fall 0.5‰, and variable roughness coefficients: 0.031 m−1/3s, 0.034 m−1/3s and 0.037 m−1/3s. The values of Manning roughness coefficients were calculated by the relationship given by Gwinn and Ree (1980) [19], which makes their values dependent on grass height, product of water velocity v in the channel, and hydraulic radius vR. The downstream water levels were set up using a weir mounted downstream of the laboratory flume (Figure 4), based on the calculated flow curves for given values of roughness coefficients.

3. Results

Based on the downstream water profiles measured in Case V1, the water flow rate Qc and the percentage deviation ΔQ of the measured flow Q from the calculated ( Δ Q = Q Q c Q 100   [ % ] ) using relationship (6) were obtained. On this basis, it was possible to determine the downstream water depth hd, which allowed to obtain a flow rate equal to the measured one, i.e., the percentage deviation was zero ΔQ = 0 (Figure 5). The analysis allowed us to specify the measurement cross-section, where depth hd was observed at distance Ld from the gate (Figure 5).
The water level profiles measured in the V1 case for the conditions of submerged sluice gate flow and irrigation canal capacity, parametrized using a constant value of roughness coefficient in select experiments, are shown in Figure 6. The figure also shows the percentage deviation ΔQ of the measured flow rate from the calculated values.
The distance Ld from the gate to the cross-section in which the measured downstream water depth hd ensures agreement between the calculated and observed flow rates is independent from the roughness coefficient in the downstream channel and increases with the height of the gate opening a. For the opening height a = 0.06 m, the depth hd should be measured in the cross-section located at a distance Ld ≈ 10a downstream of the gate valve. Increasing the sluice gate opening to a height of a = 0.08·m means that the downstream water depths should be measured at a distance of about Ld ≈ 15a. Increasing the gate opening to a = 0.10 m shifts the measuring cross-section to a distance of Ld ≈ 18a (Figure 7).
The downstream water depths thus determined were compared with the depths h measured at a distance of 3.035 m from the gate, corresponding to the downstream measurement location of the real structure (Figure 8).
At large gate openings (a = 0.10 m, a = 0.08 m) and small h/a ratios (for downstream water depths), e.g., (h/a = 2 and h/a = 3), the differences between the depth hd used to calculate the flow Qc and the depth h measured at the end of the analyzed section, at a distance of 3.035 m from the gate, are small; as a result, the flow rates measured and calculated are equal. The values of the discharge coefficient calculated on the basis of the measured flow rate and flow rate determined on the basis of relationship (5) using the measured depth are also equal. With smaller openings (a = 0.06 m) and large h/a ratios, the differences between h and hd depths noticeably increase (Figure 8). For example, with the opening height a = 0.06 m and the ratio H/a = 7.85, the depth of the downstream water was hd = 0.255 m (Figure 8) and should be measured at a distance from the gate Ld = 0.65 m (Figure 7). The calculated ratio of the downstream water depth to the gate-opening height would then be equal hd/a = 4.25. The measured cross-section at constant distance from the gate at 3.035 m provides a measured downstream water depth equal to h = 0.283 m, changing the value of the ratio h/a = 4.72. Changing this ratio from hd/a = 4.25 to h/a = 4.72 results in different values of the discharge coefficient as that shown in Figure 3. The discharge coefficient calculated for the depth in the cross-section, in which the measured flow corresponds to the calculated flow, is determined from the curve in Figure 3, given by the ratio hd/a = 4.25 ≈ 4.0, while the discharge coefficient calculated for the depth hd measured in a constant measuring cross-section is given by a curve for h/a = 4.72 ≈ 5.0. This means that the discharge coefficients calculated on the basis of the downstream water depth measured in the cross-section located at a constant distance from the valve equal to 3.035 m will be grater. Figure 9 compares the discharge coefficients Cd calculated directly from the measurements and Cdc from relationship (5).
Because there is a clear relationship between depth hd and depth h measured in the measuring cross-section located at a distance of 3.035 m from the gate (Figure 8), it was assumed that it is possible to calculate the correct flow rate for the submerged outflow of the sluice gate using a correction factor for the discharge coefficient (or flow rate) for depth h measured at the end of the analyzed section.
Percentage deviation of the Cd and Cdc discharge coefficients calculated for the V1 and V2 experimental cases are shown in Figure 10 as a function of h/a. Cd was calculated using relationship (2) with measured value of the flow rate Q and upper water depth H, while Cdc with relationship (5), based on upper water depth H and downstream h in the cross-section located at a distance of 3.035 m from the gate. The percentage deviation is defined as follows:
Δ C d = C d C dc C d 100   [ % ]
Logarithmic curves were fitted to the points in Figure 10:
• For V1:
Δ C d = 25.083   ln ( h / a ) 22.008
• For V2:
Δ C d = 21.705   ln ( h / a ) 12.680
Equation (7) shows that the discharge coefficients obtained from the measurements and calculated using the Swamee [15] Equation (5) are related to each other with the following relationship:
C d = C dc 1 Δ C d 100
The following relationship was thus proposed to calculated the discharge coefficient Cdcc for the submerge sluice gate flow.
Case V1:
C dcc = C dc 1 25.083   ln ( h / a ) 22.008 100
Case V2:
C dcc = C dc 1 21.705   ln ( h / a ) 12.680 100
Figure 11 compares the values of the discharge coefficients calculated on the basis of measurements Cd and that obtained from the Swamee relationship (5) Cdcc, but corrected it with the factor given in Equation (9). In Figure 11, only exemplary points of Cd and Cdcc were given (as a function of H/a) from selected experiments in the V2 variant. All discharge coefficients determined on the basis of measurements and calculated from relationship (5), with a correction (8,9), show a satisfactory agreement.
The percentage deviation of the Cd discharge coefficients determined directly by the measurements of those calculated using relationship (11,12), with correction Cdcc in cases V1 and V2, as function h/a, is presented in Figure 12.
As previously stated, the percentage deviations of the discharge coefficients determined from the Cd measurements and relationship (5) given by Swamee [15] Cdc are in the range of (−5 ÷ 40)% (Figure 10). The values of the Cdcc discharge coefficients calculated from Equation (5) with the correction ΔCdcc differ from the discharge coefficients Cd obtained from measurements by ± 9% (Figure 12)
The discharge coefficients obtained from the measurements and calculated using relationship (5) with correction (8,9) for both cases are shown in Figure 13.
In case V1, the sluice gate guides narrowed the opening to a width of b = 0.34 m, while in case V2, the guides were installed in the wall of the abutments in such a way that they did not reduce the opening width, which was b = 0.40 m. Reduced by the guides, the opening width in case V1 had such an effect that for same opening height a, flow rate Q and downstream water h, the upstream depth H increases in relation to depth in the V2 experiments. Thus, the H/a ratio increases, as a result of which the determined discharge coefficient values are higher than in variant V2 (Figure 14).

4. Conclusions

The performed studies on the capacity of the sluice gate, used in irrigation systems allowed us to formulate the following conclusions:
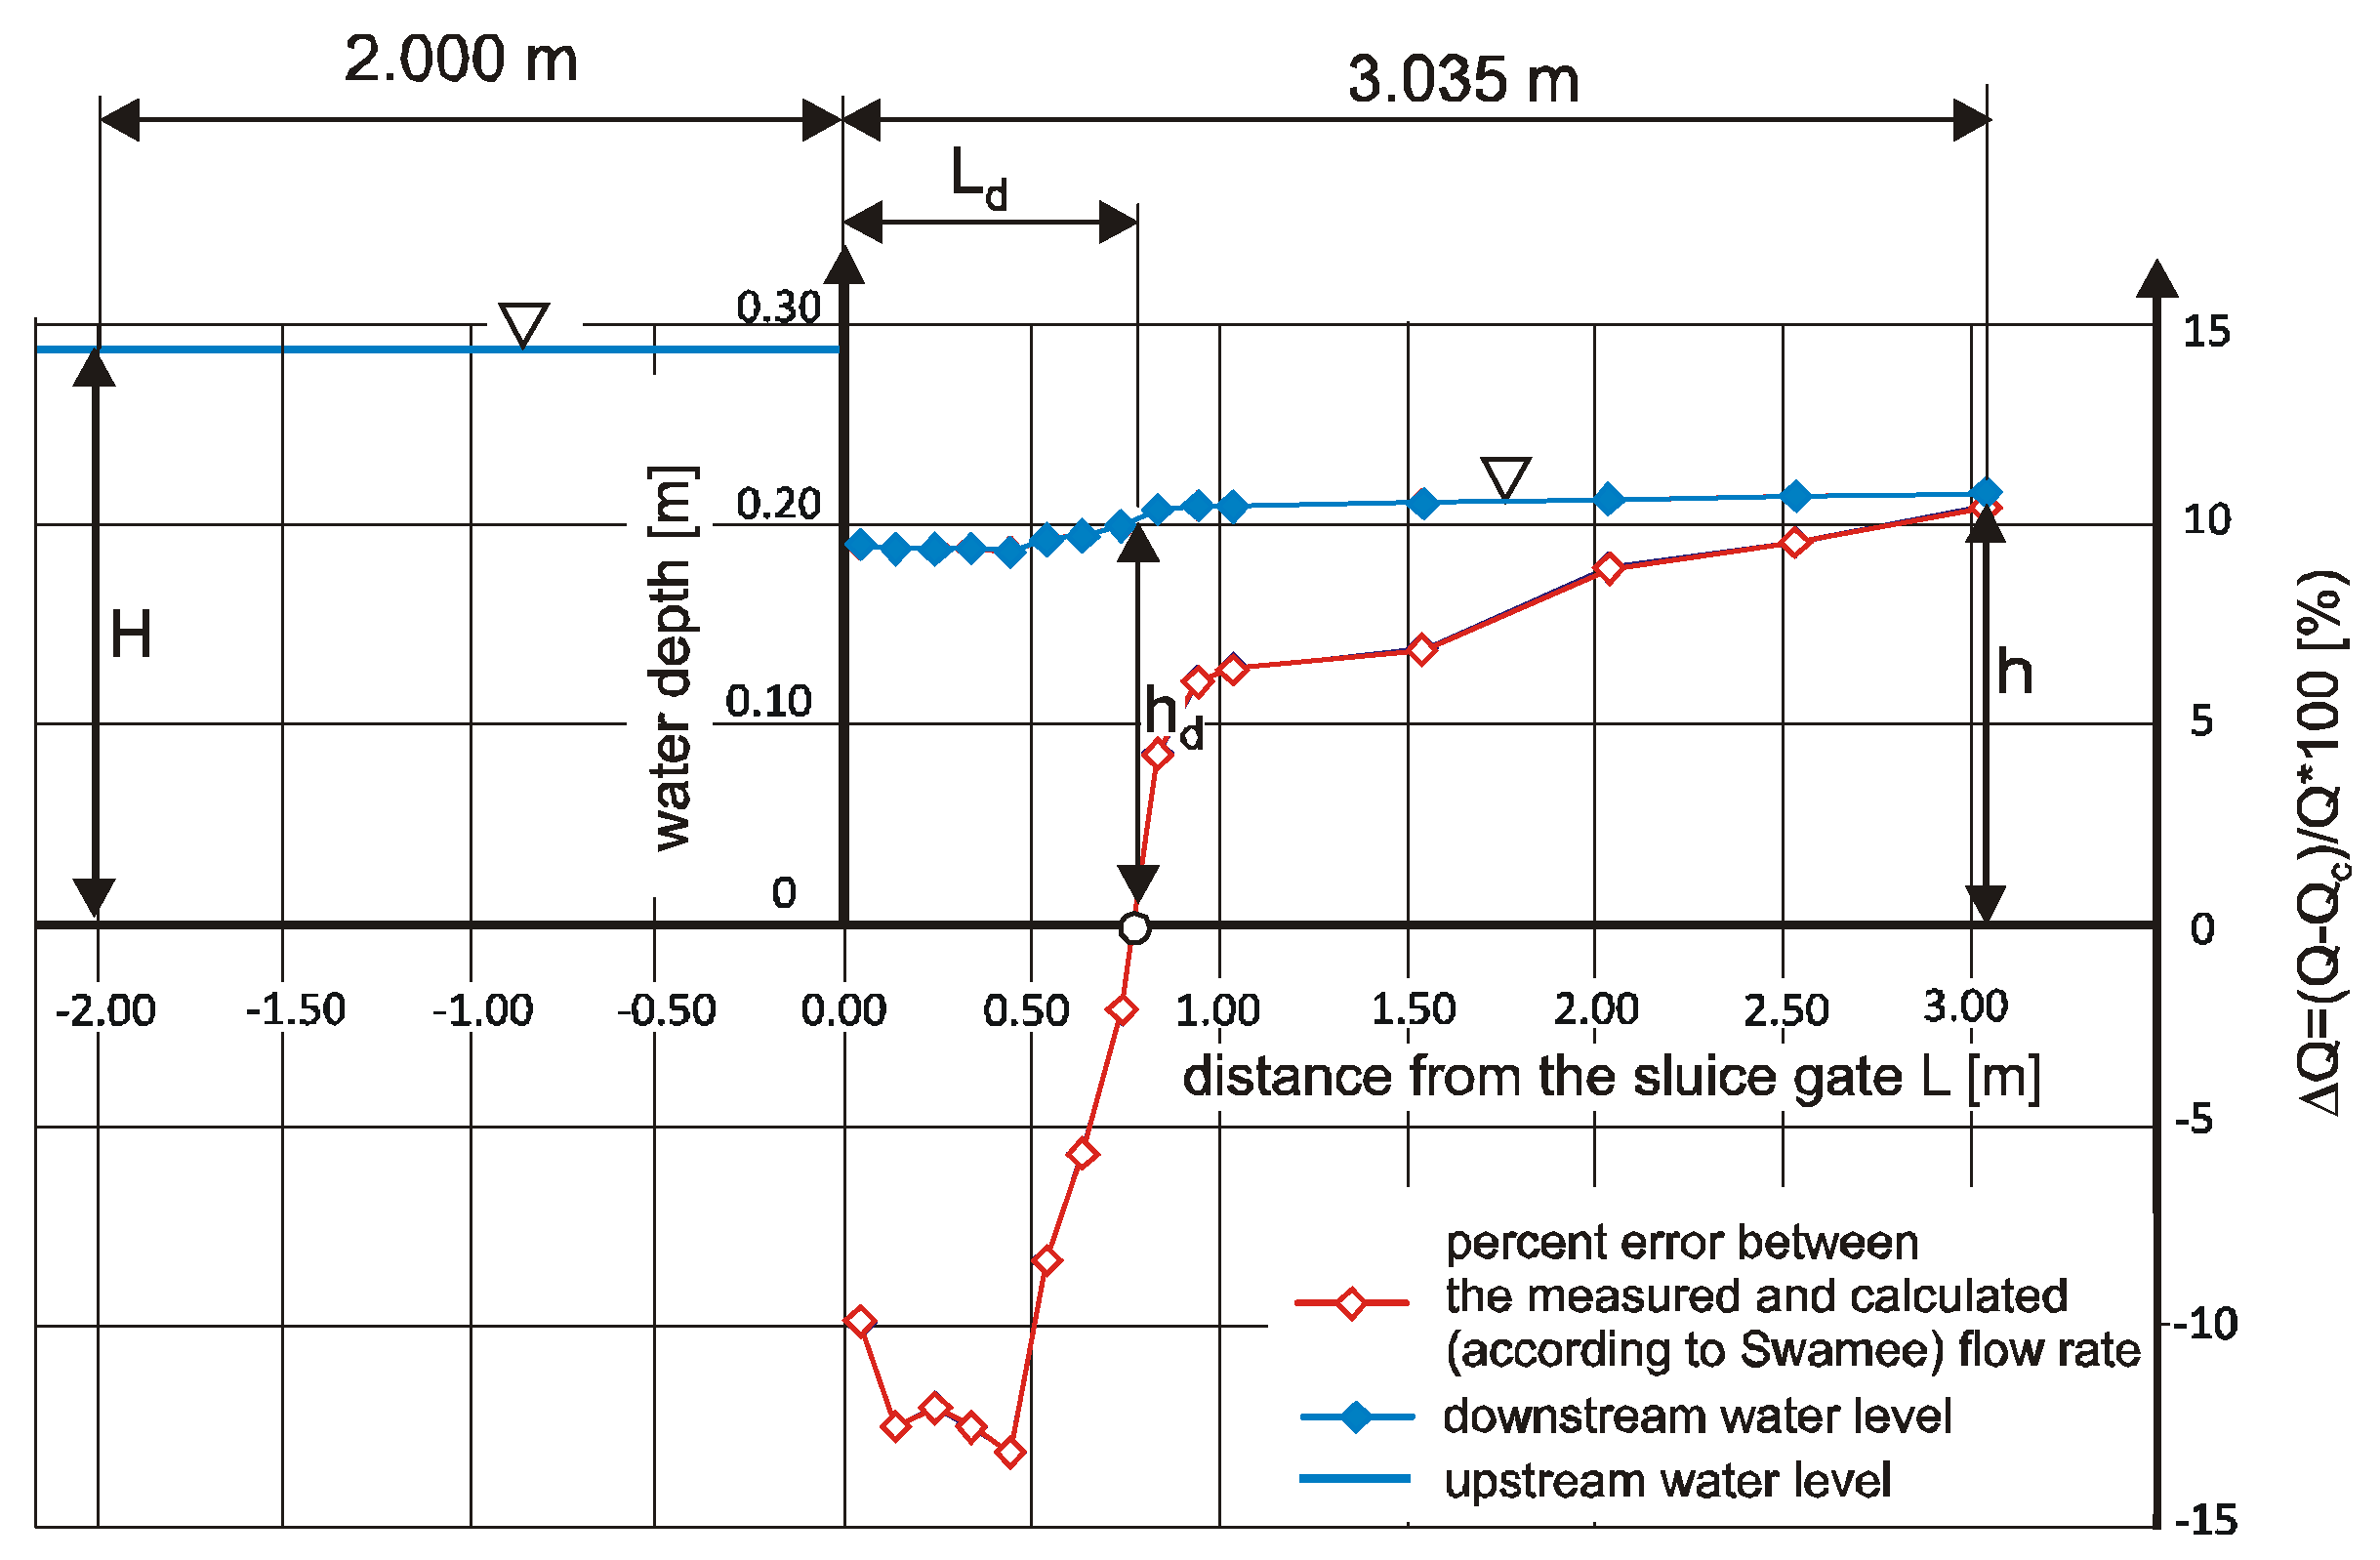
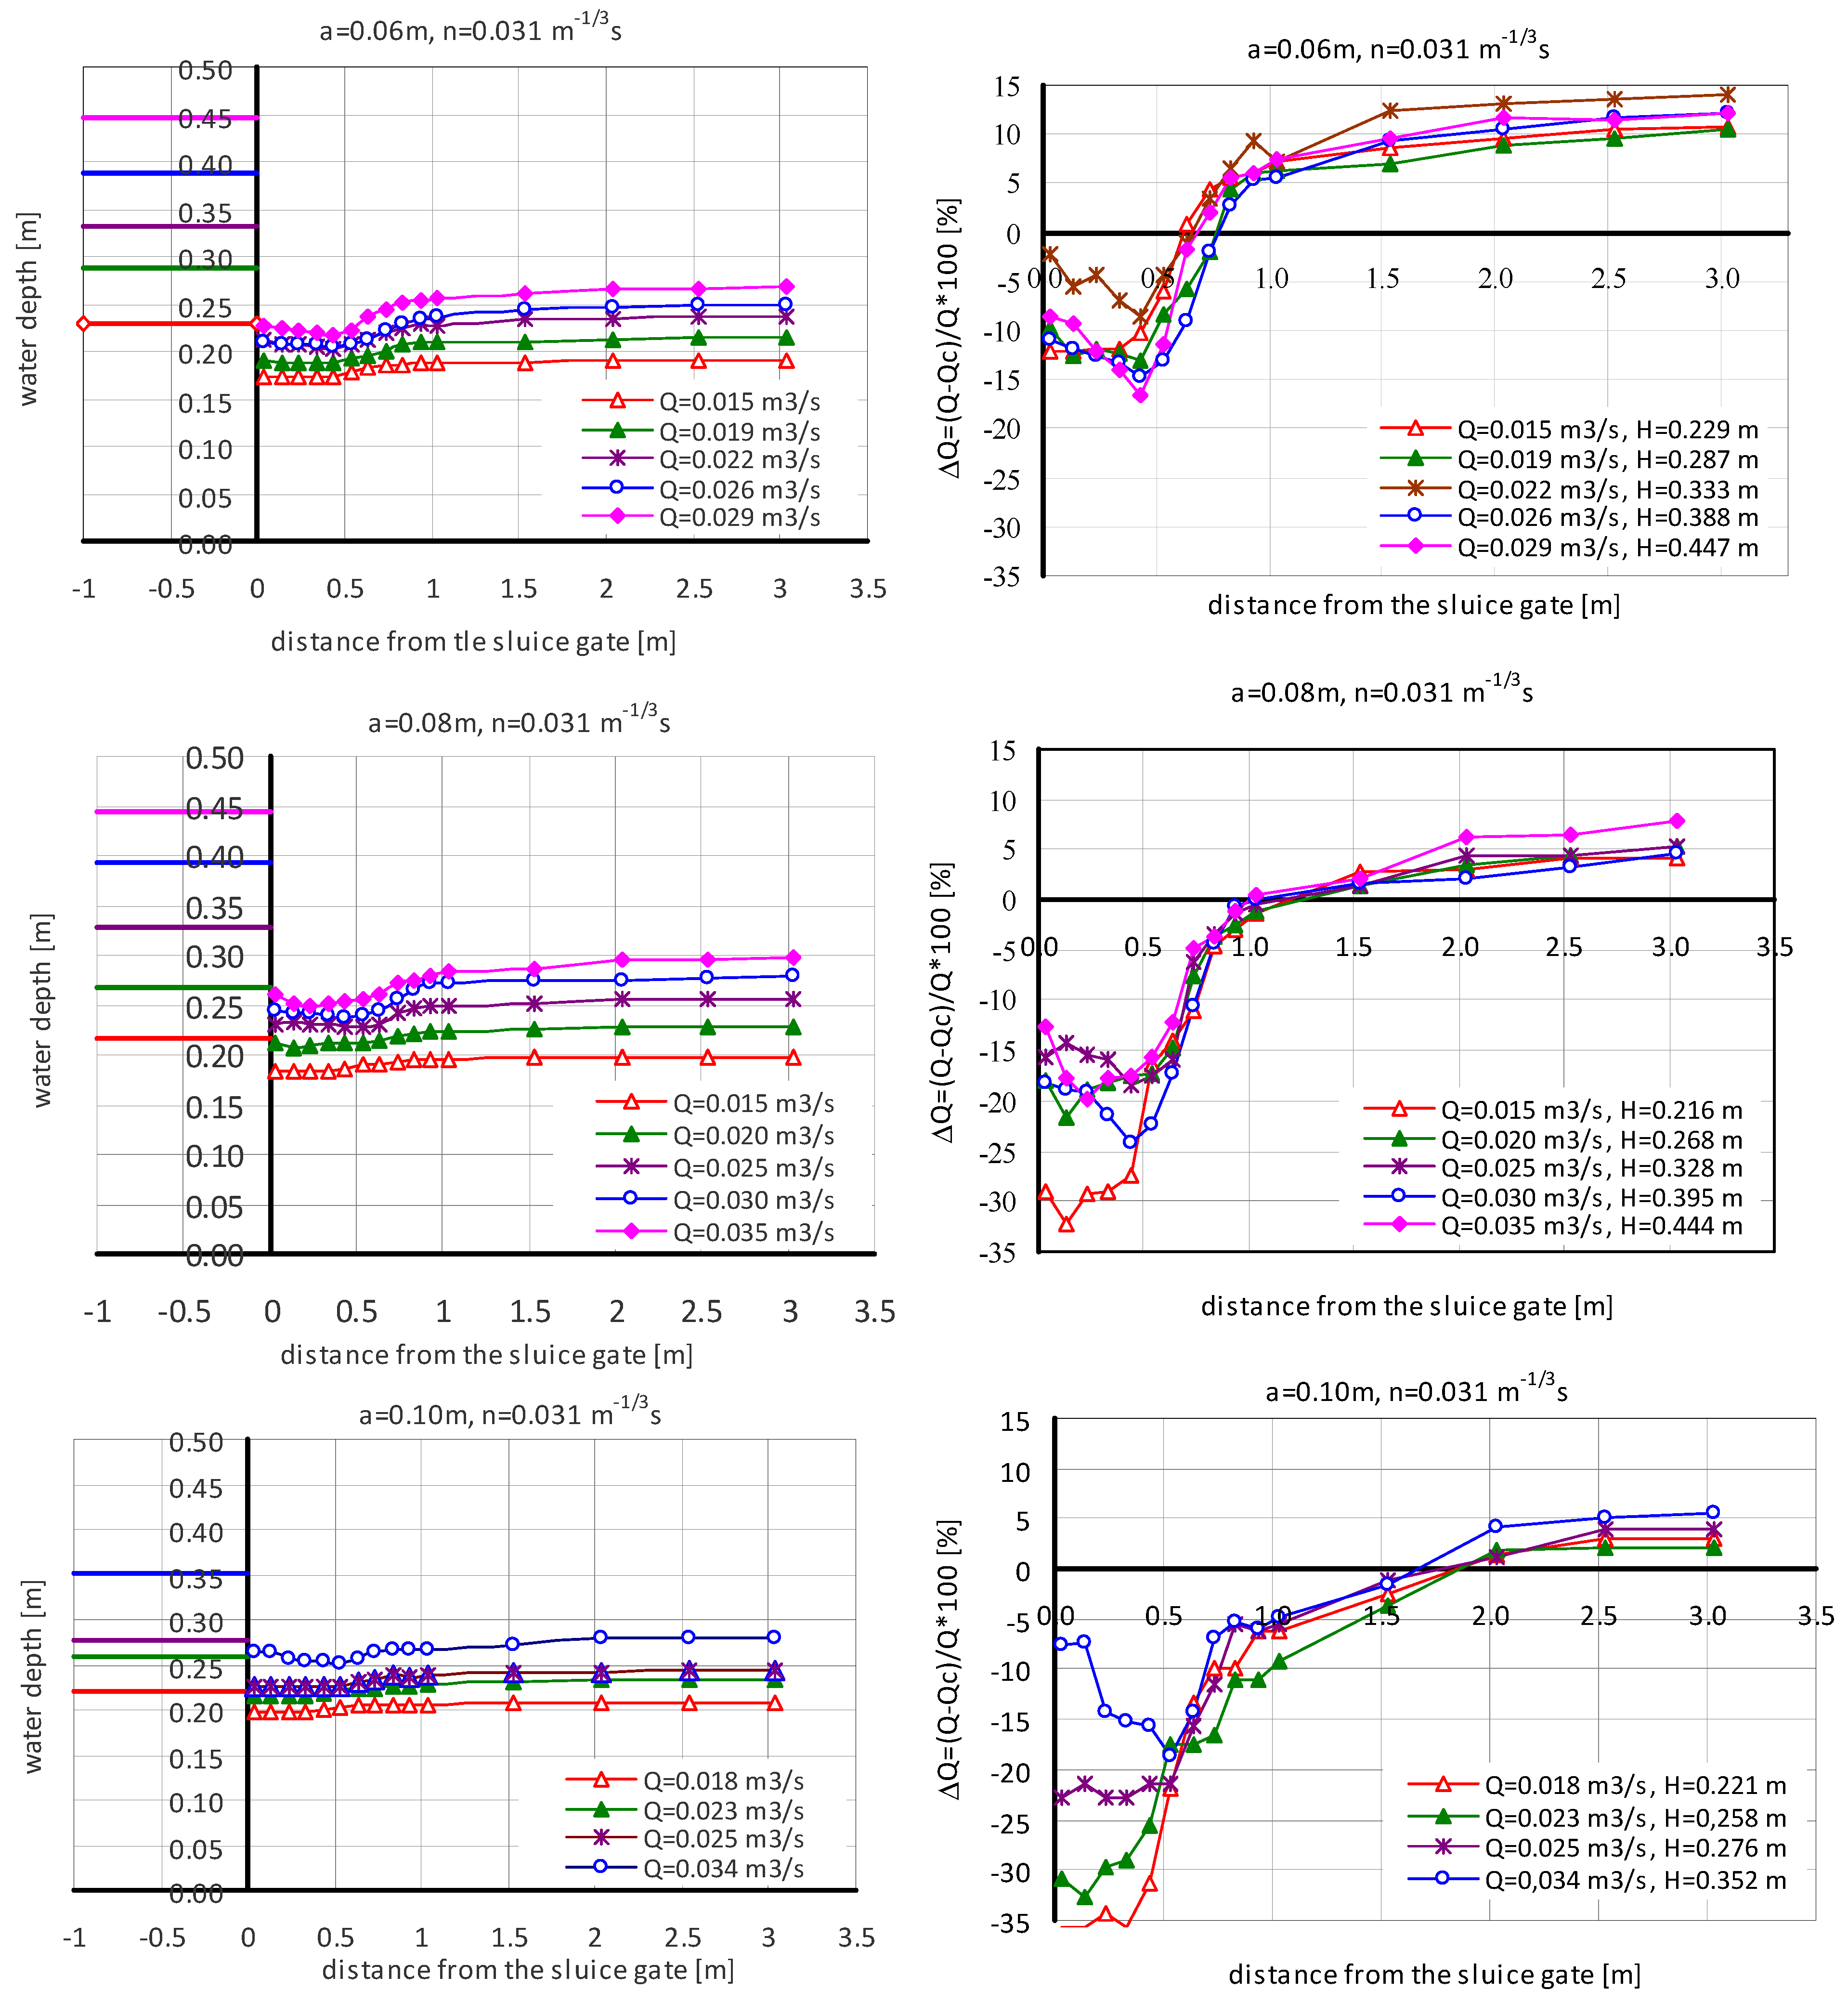
  • As it was not possible to clearly determine the position of the cross-section in which depth hz should be measured, relationship (1) is not useful for calculating water flow rates on the basis of the depths measured upstream and downstream of the sluice gate.
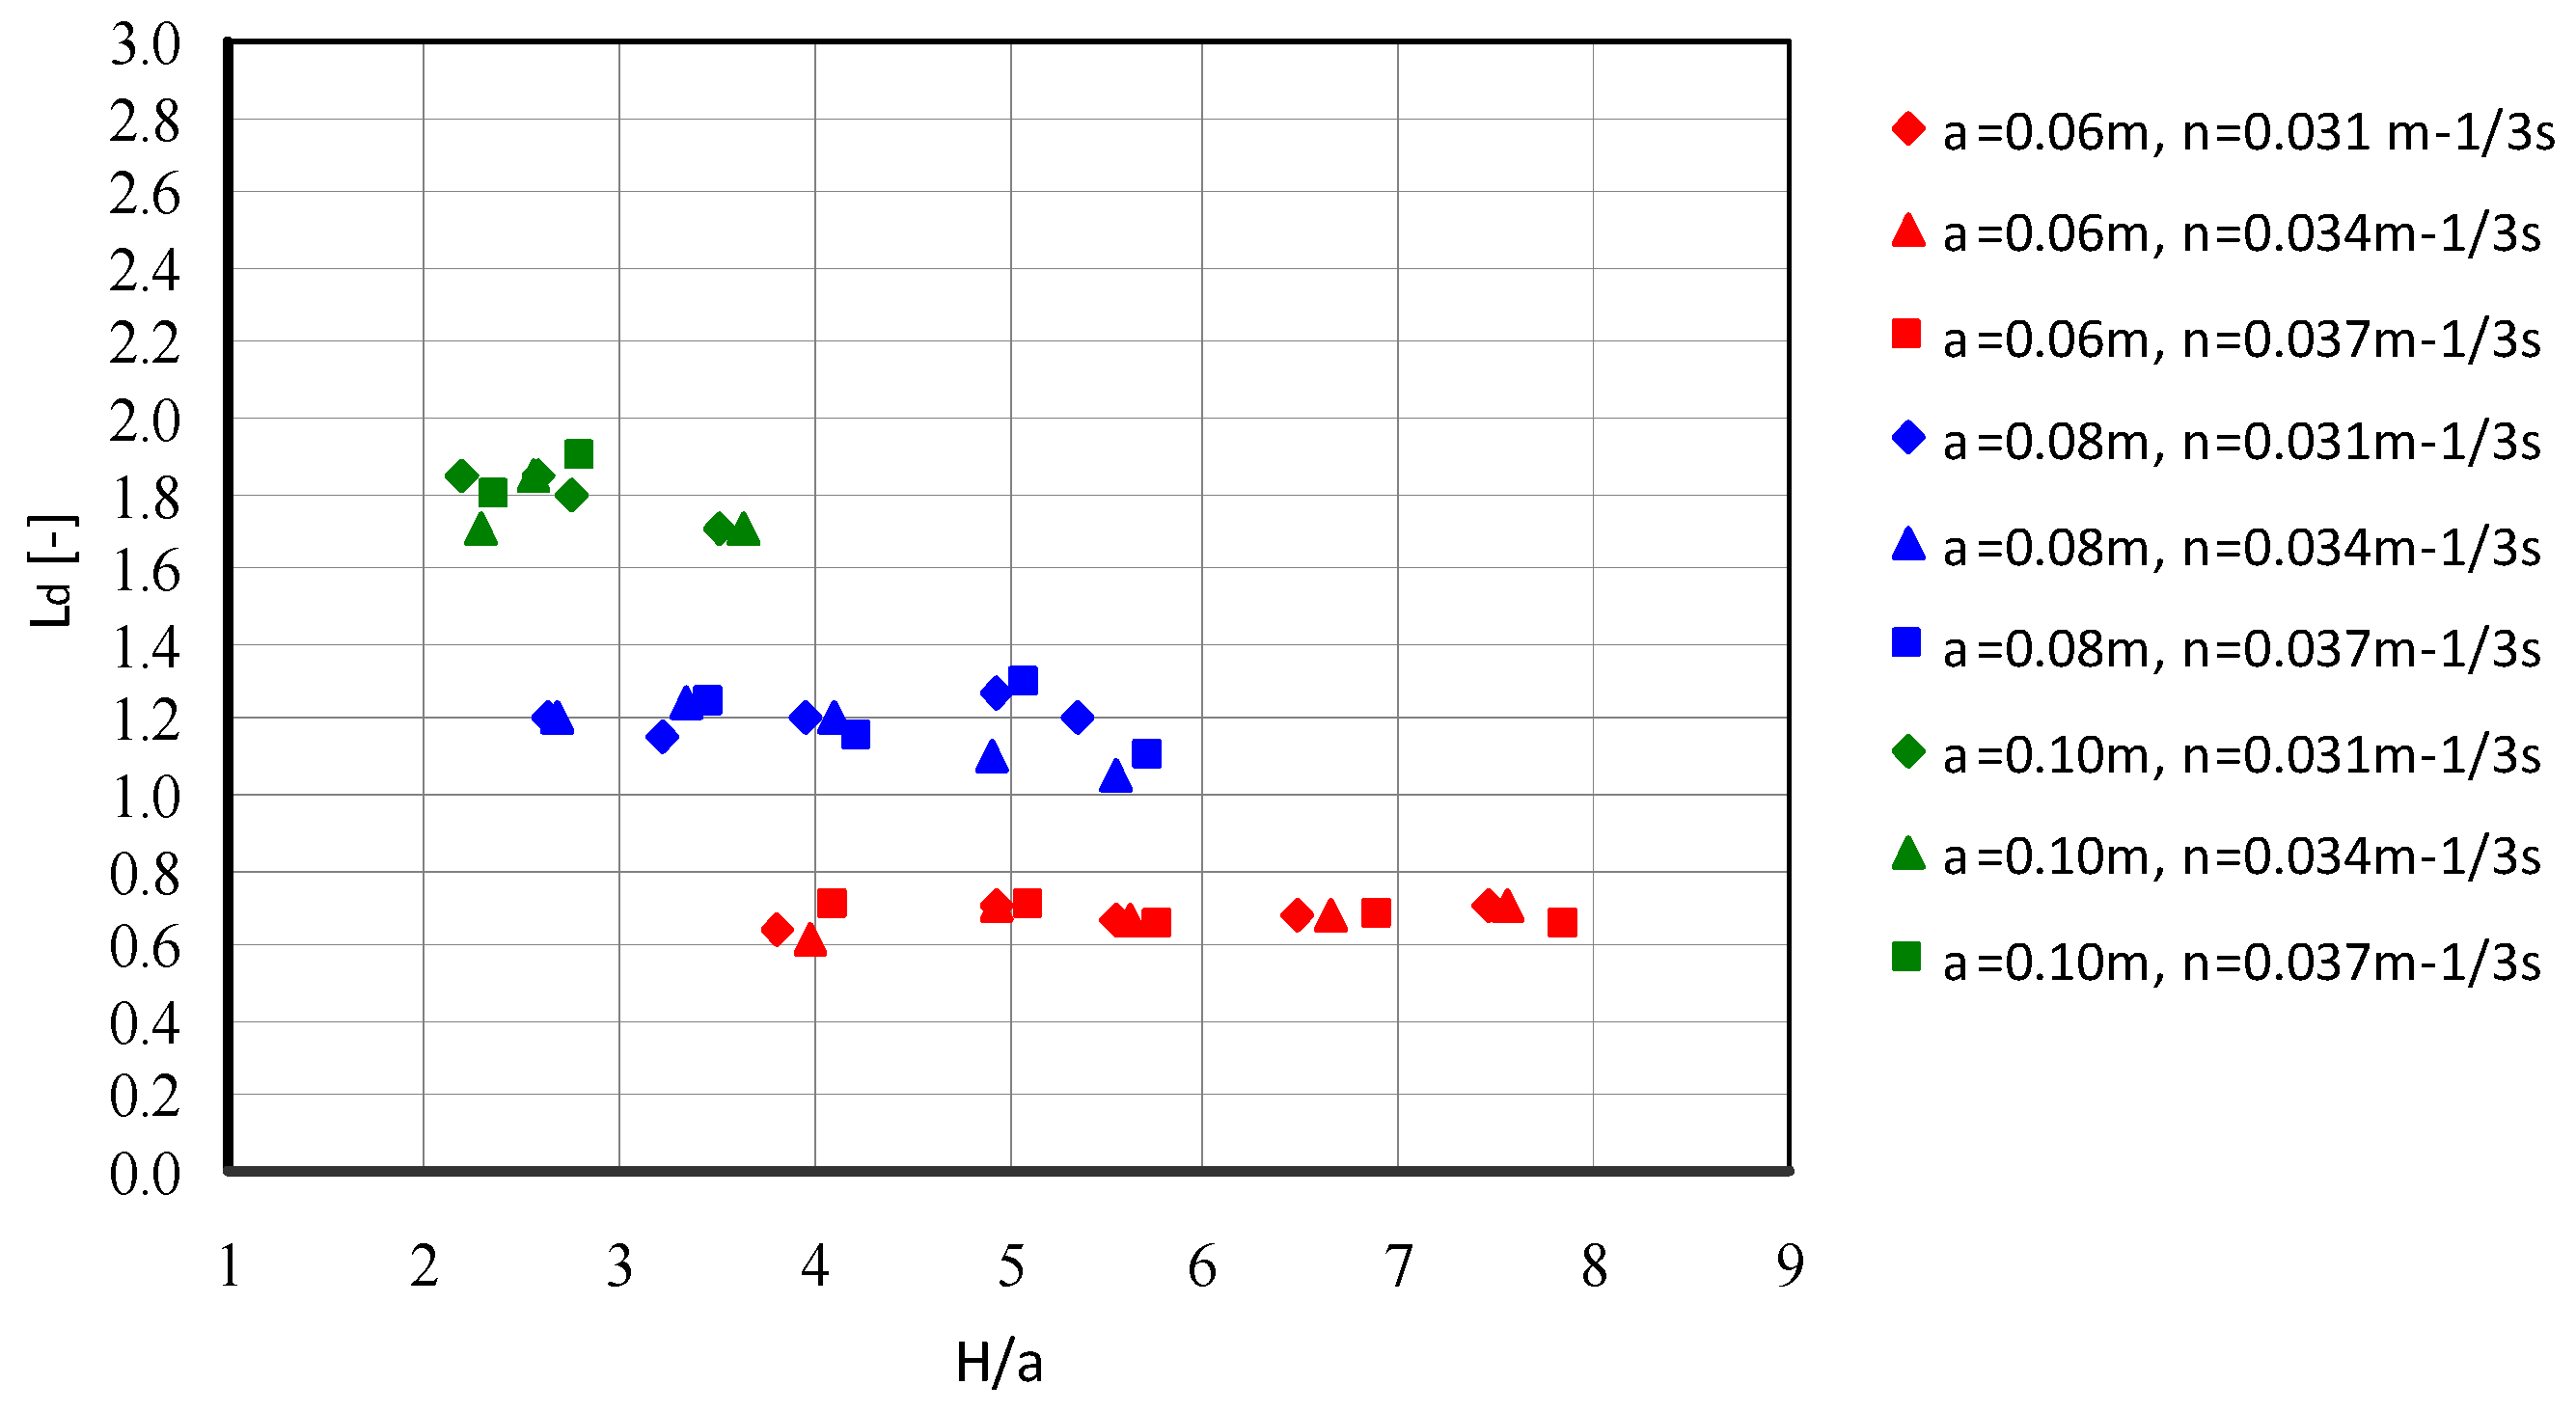
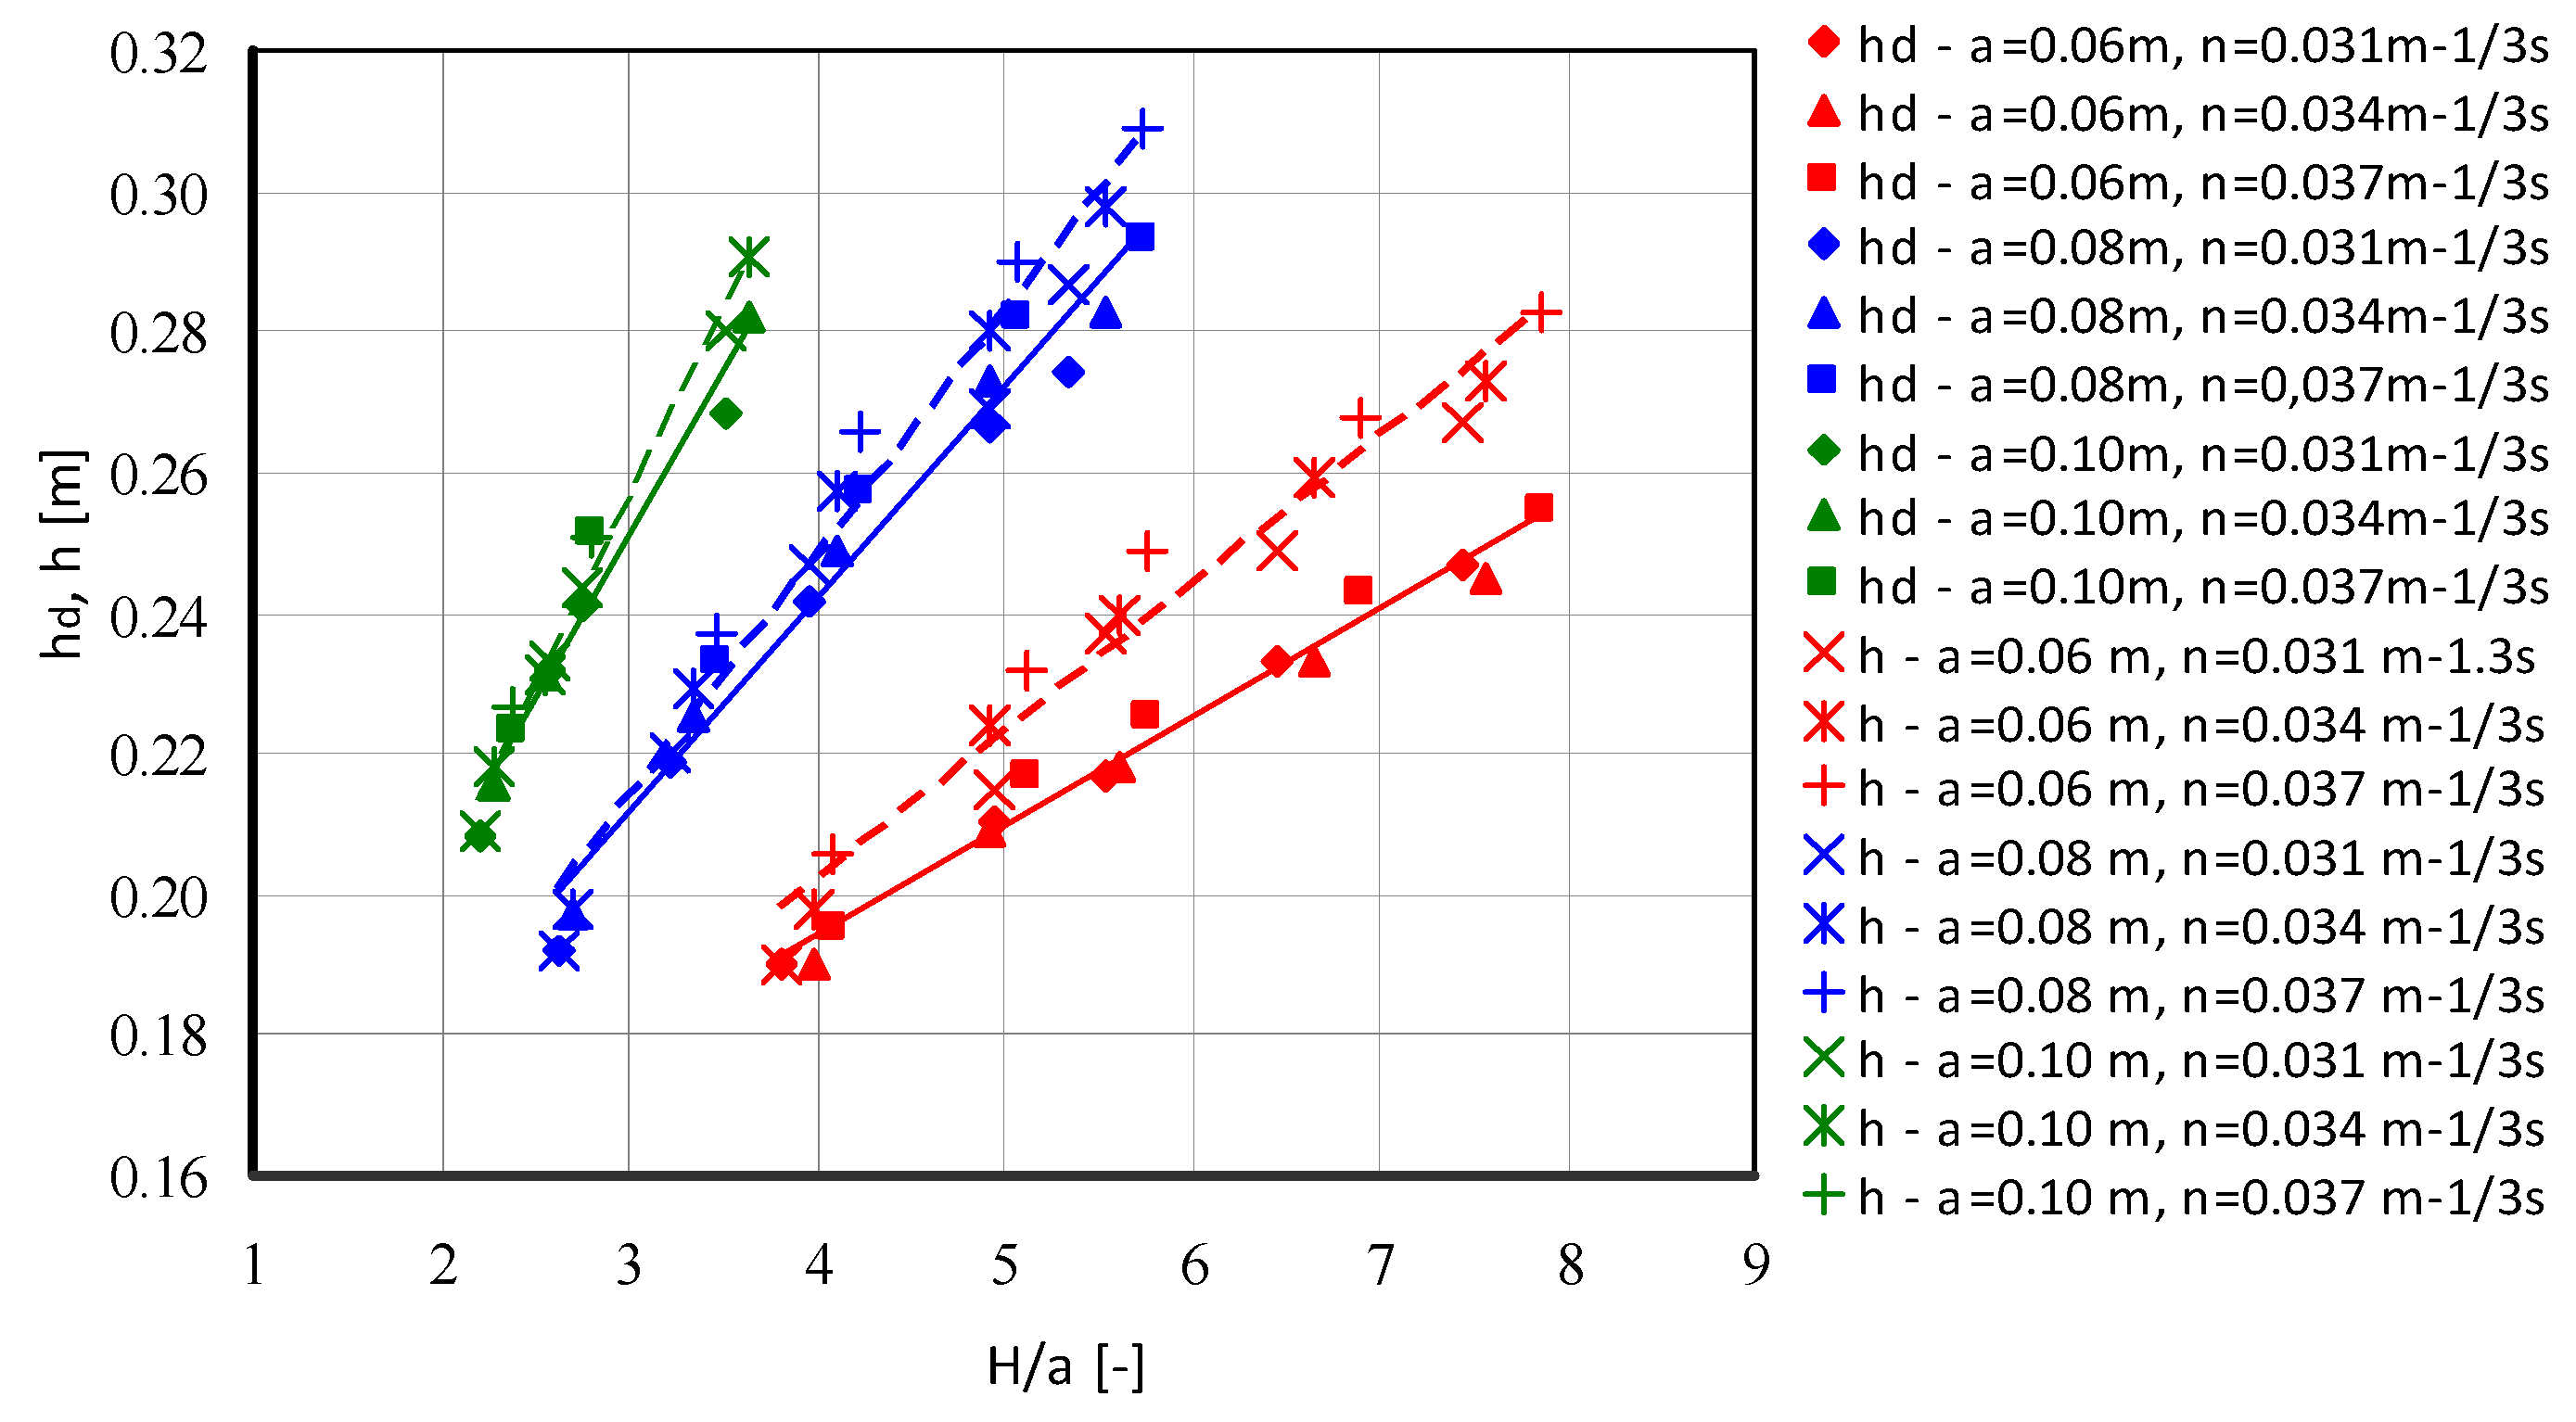
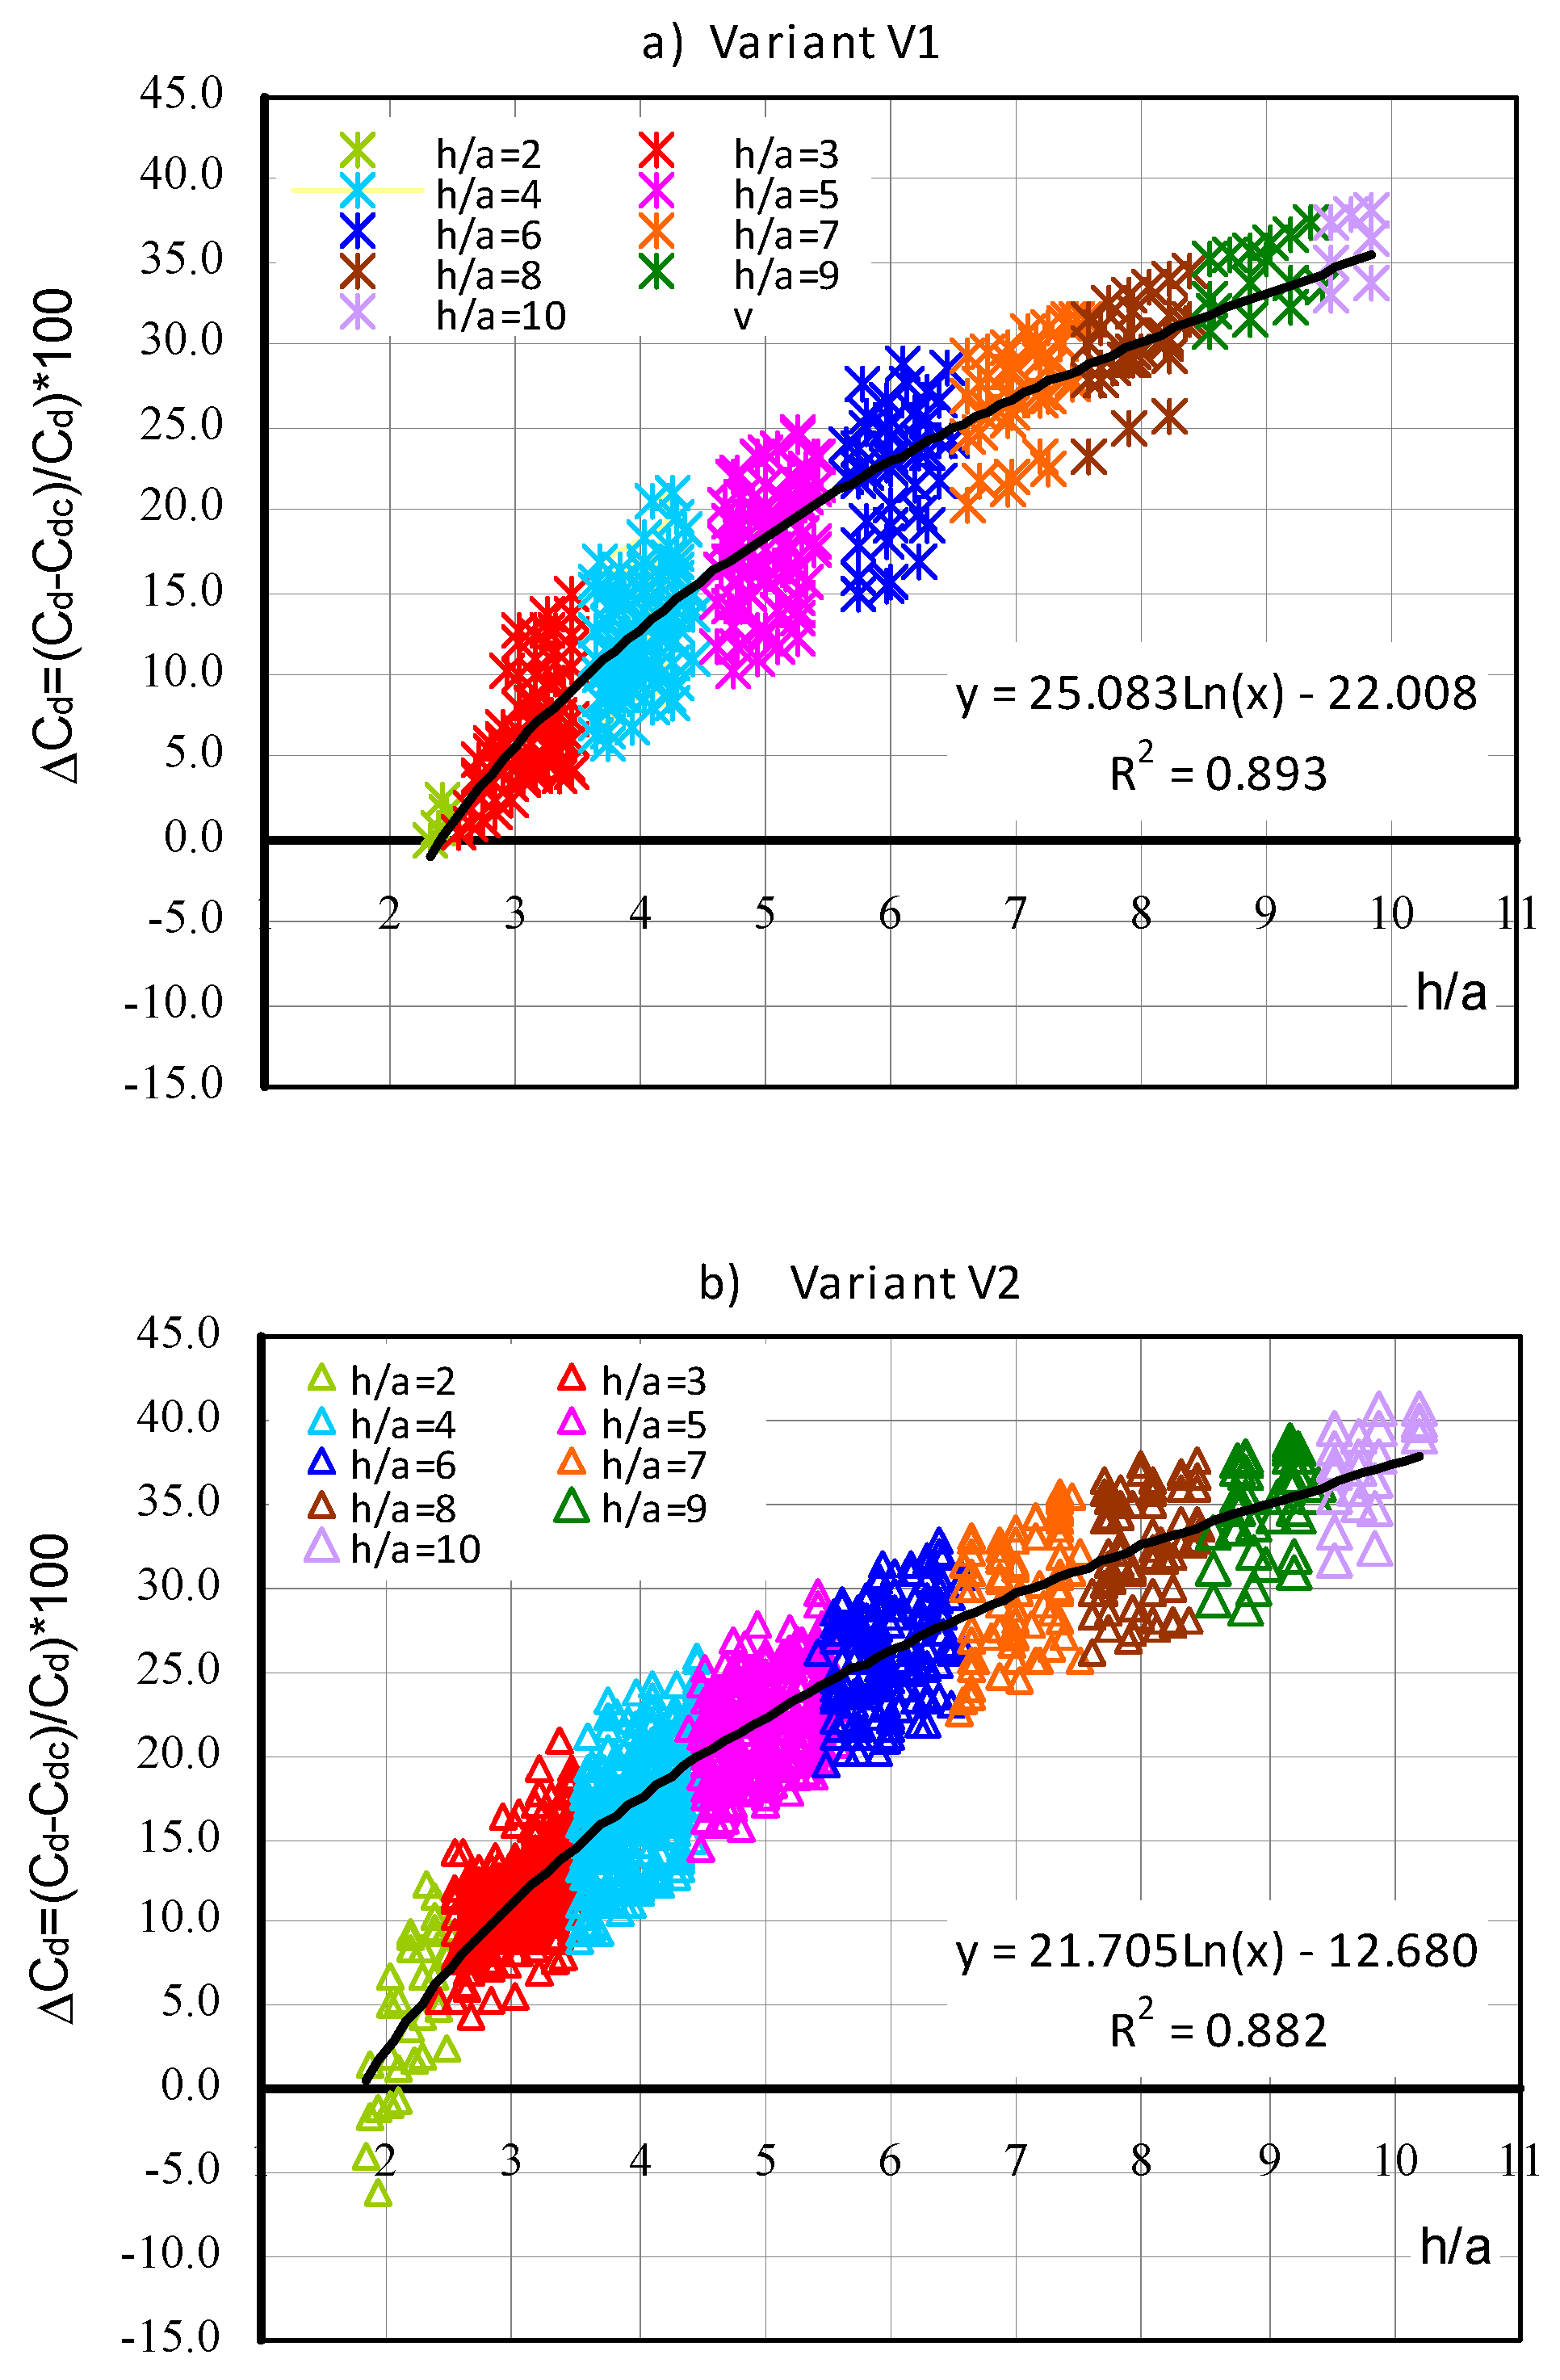
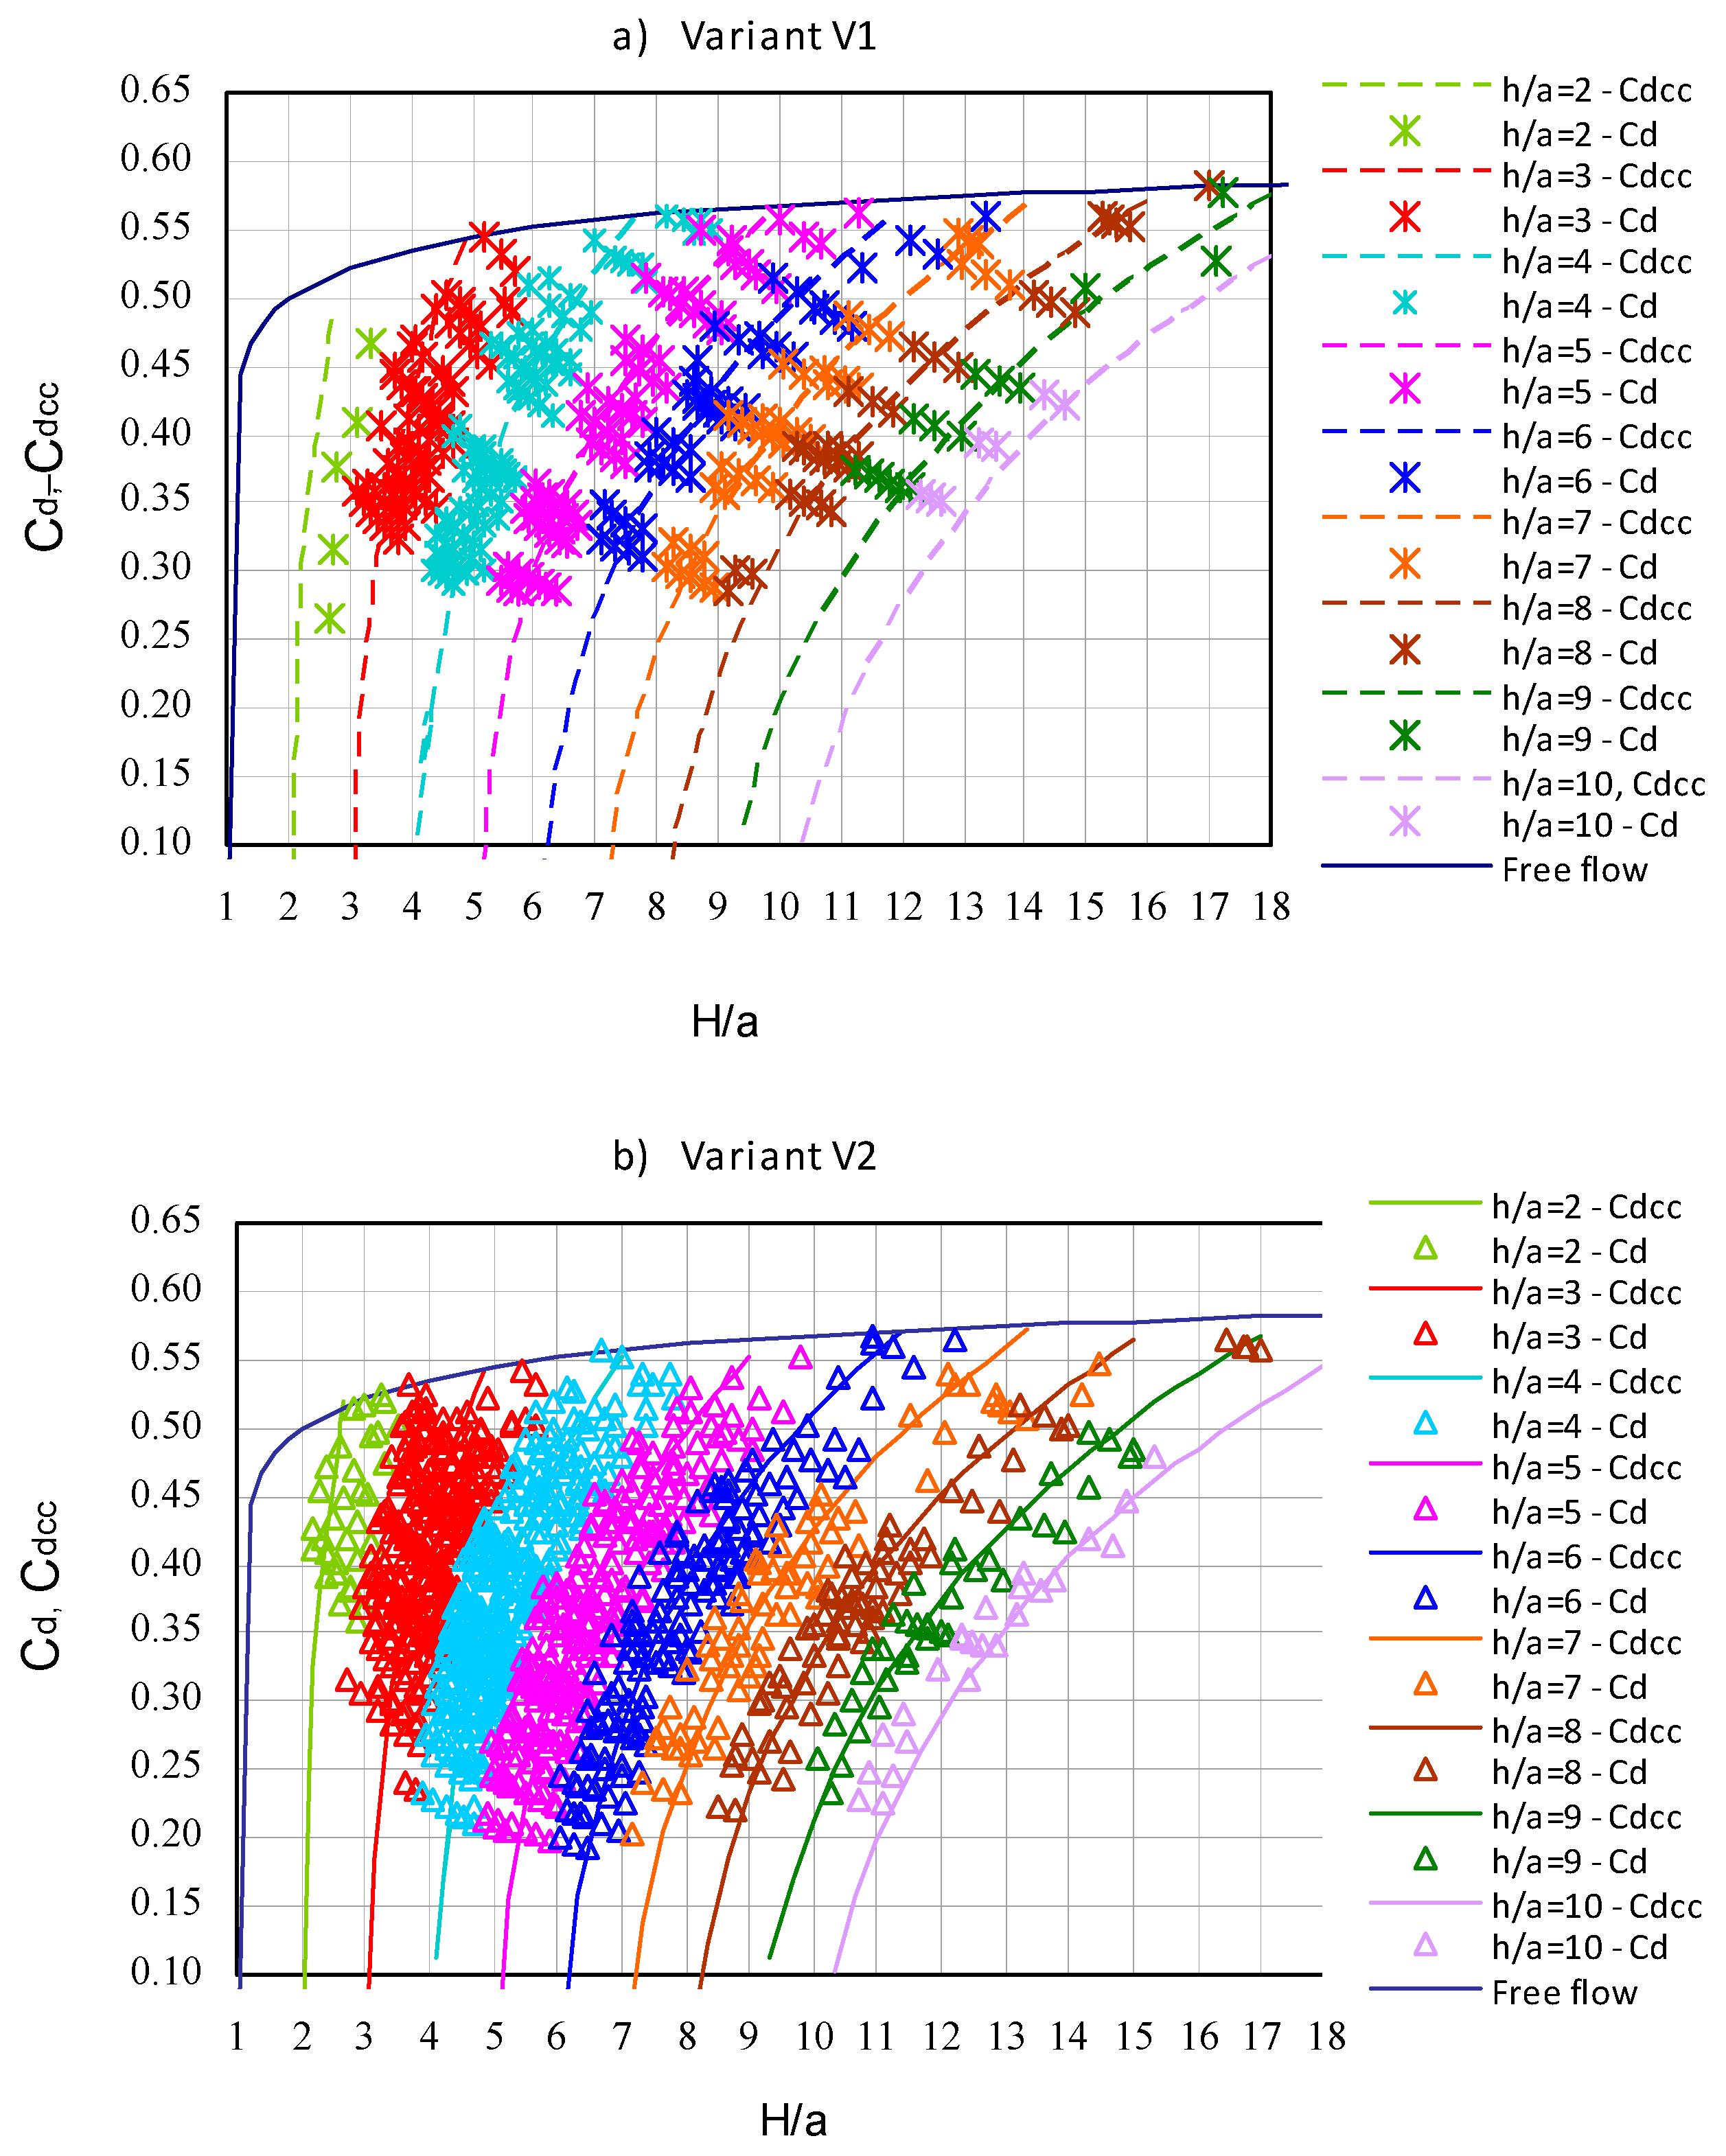
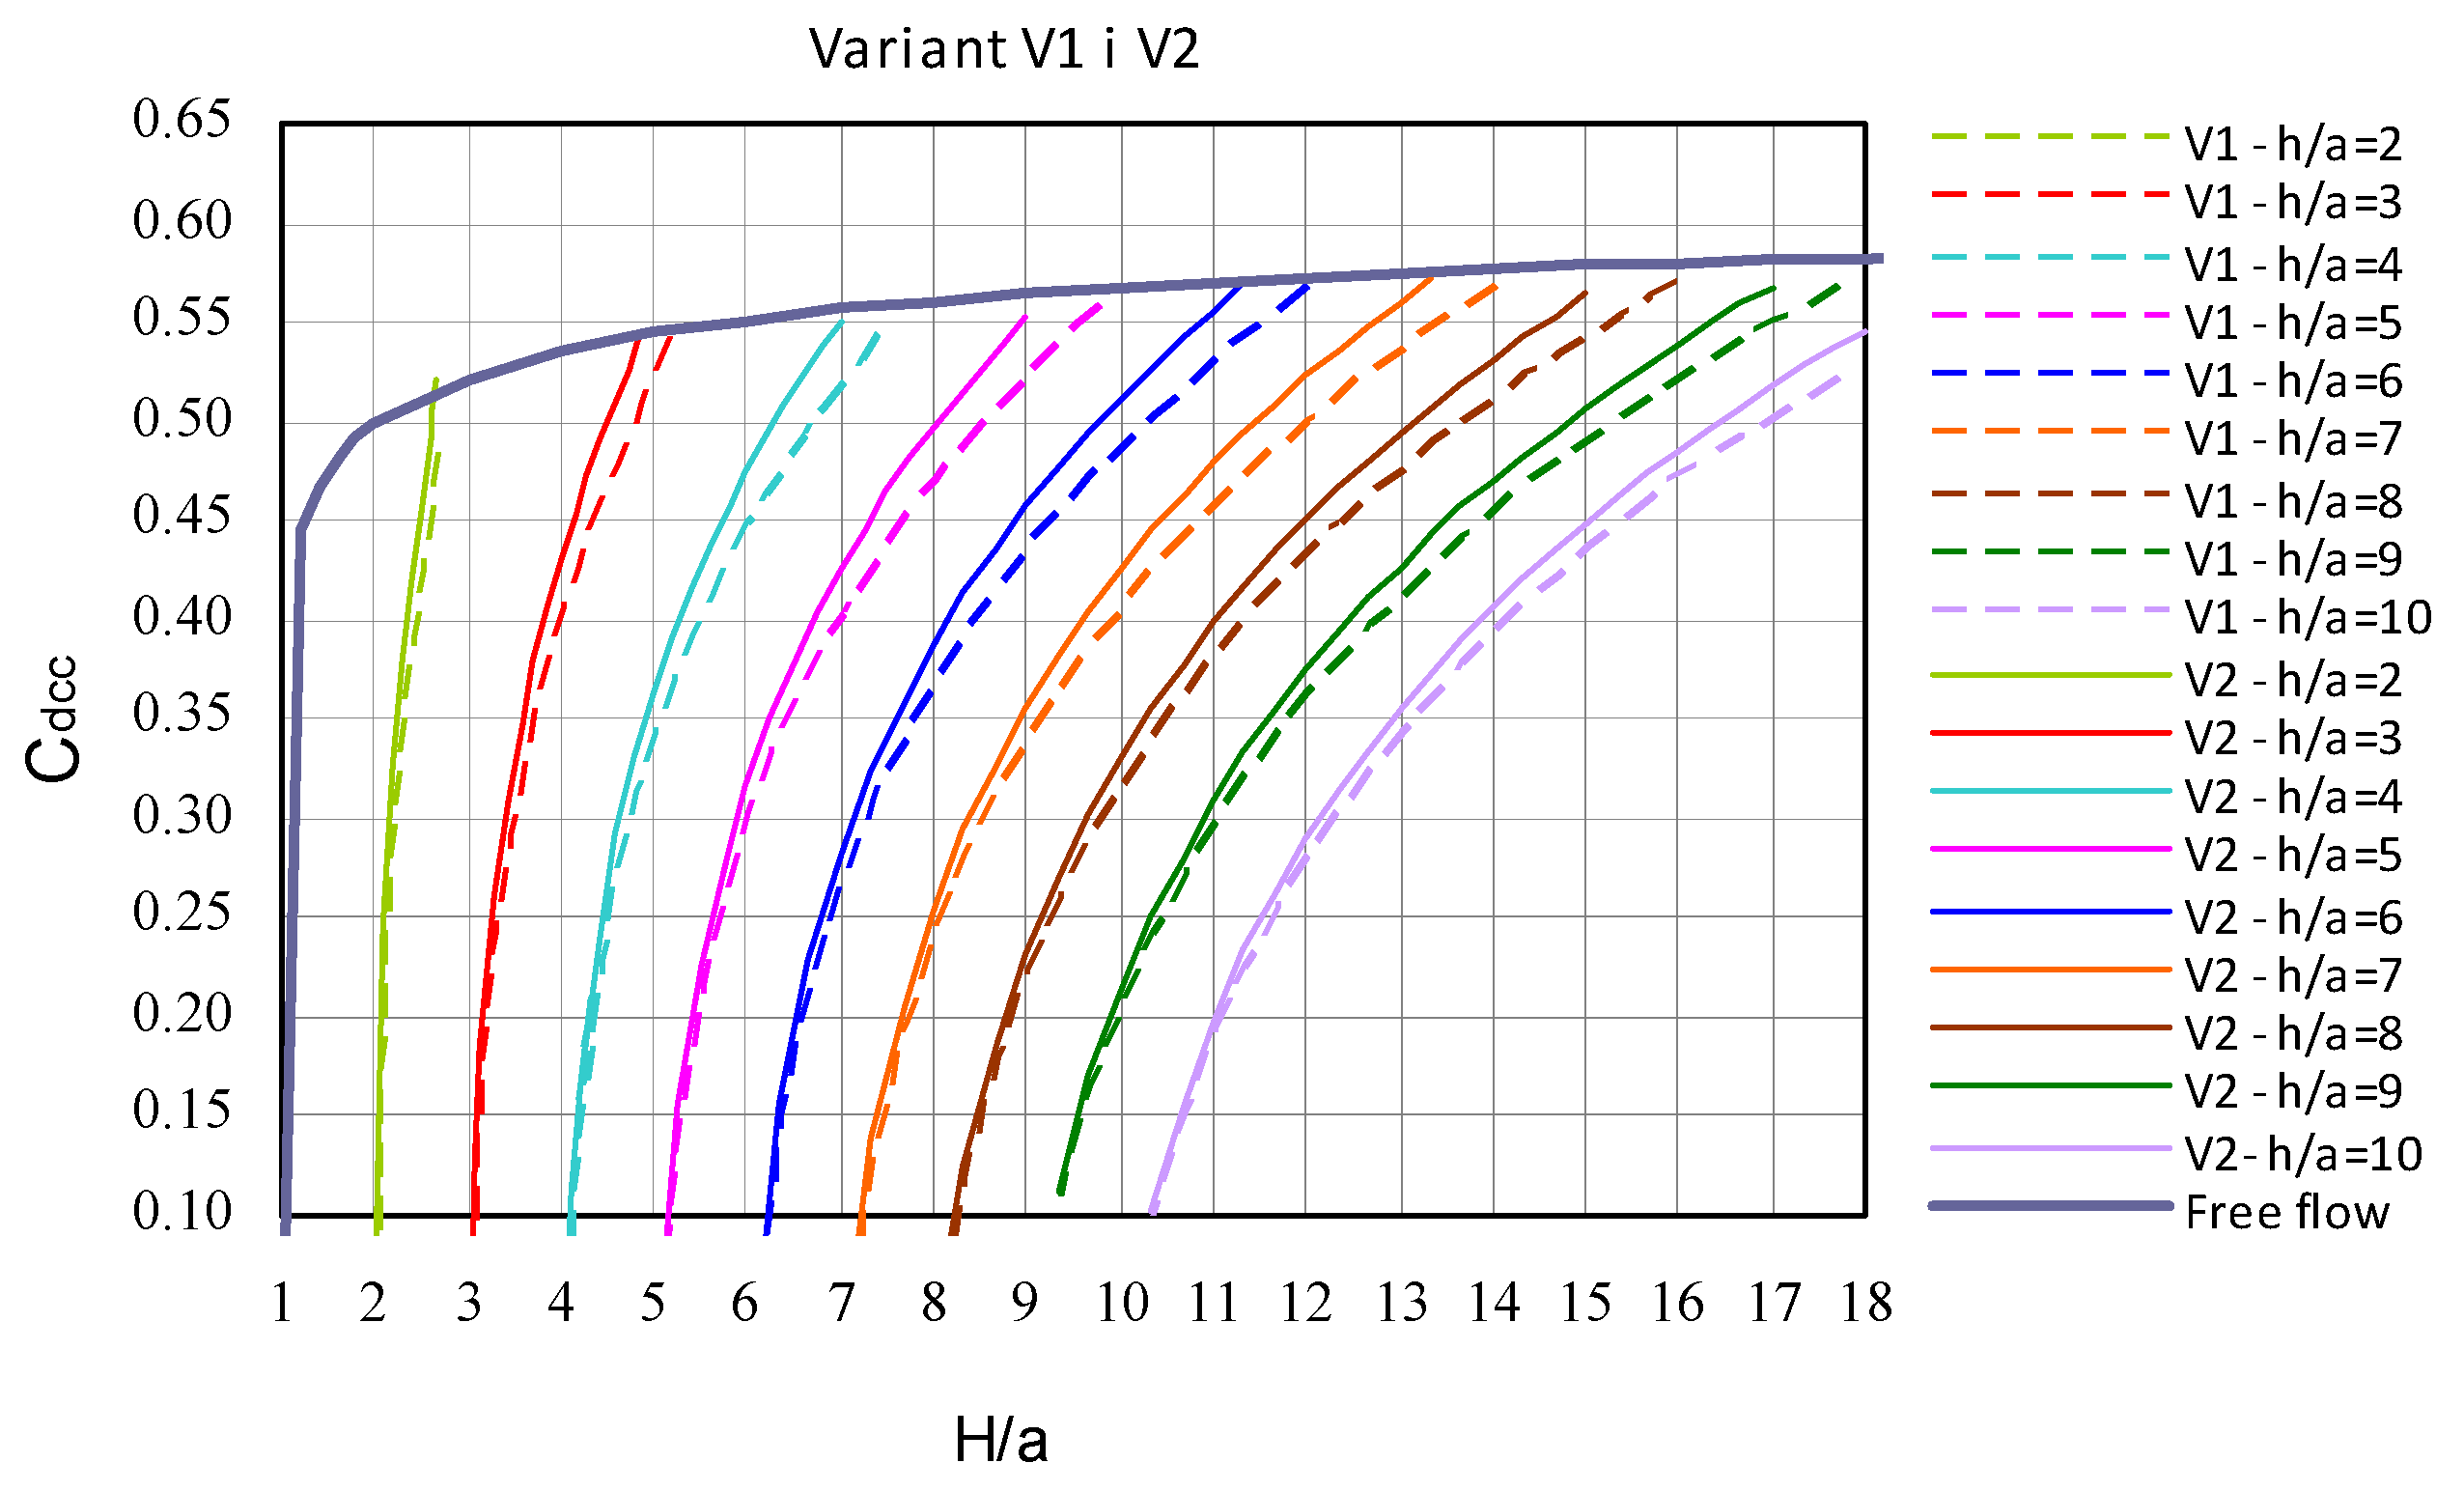
  • The location of the cross-section for measuring downstream water depth h, used to calculate downstream discharge coefficients Cd using the Swamme relationship (5), changes with the opening height of the gate a.
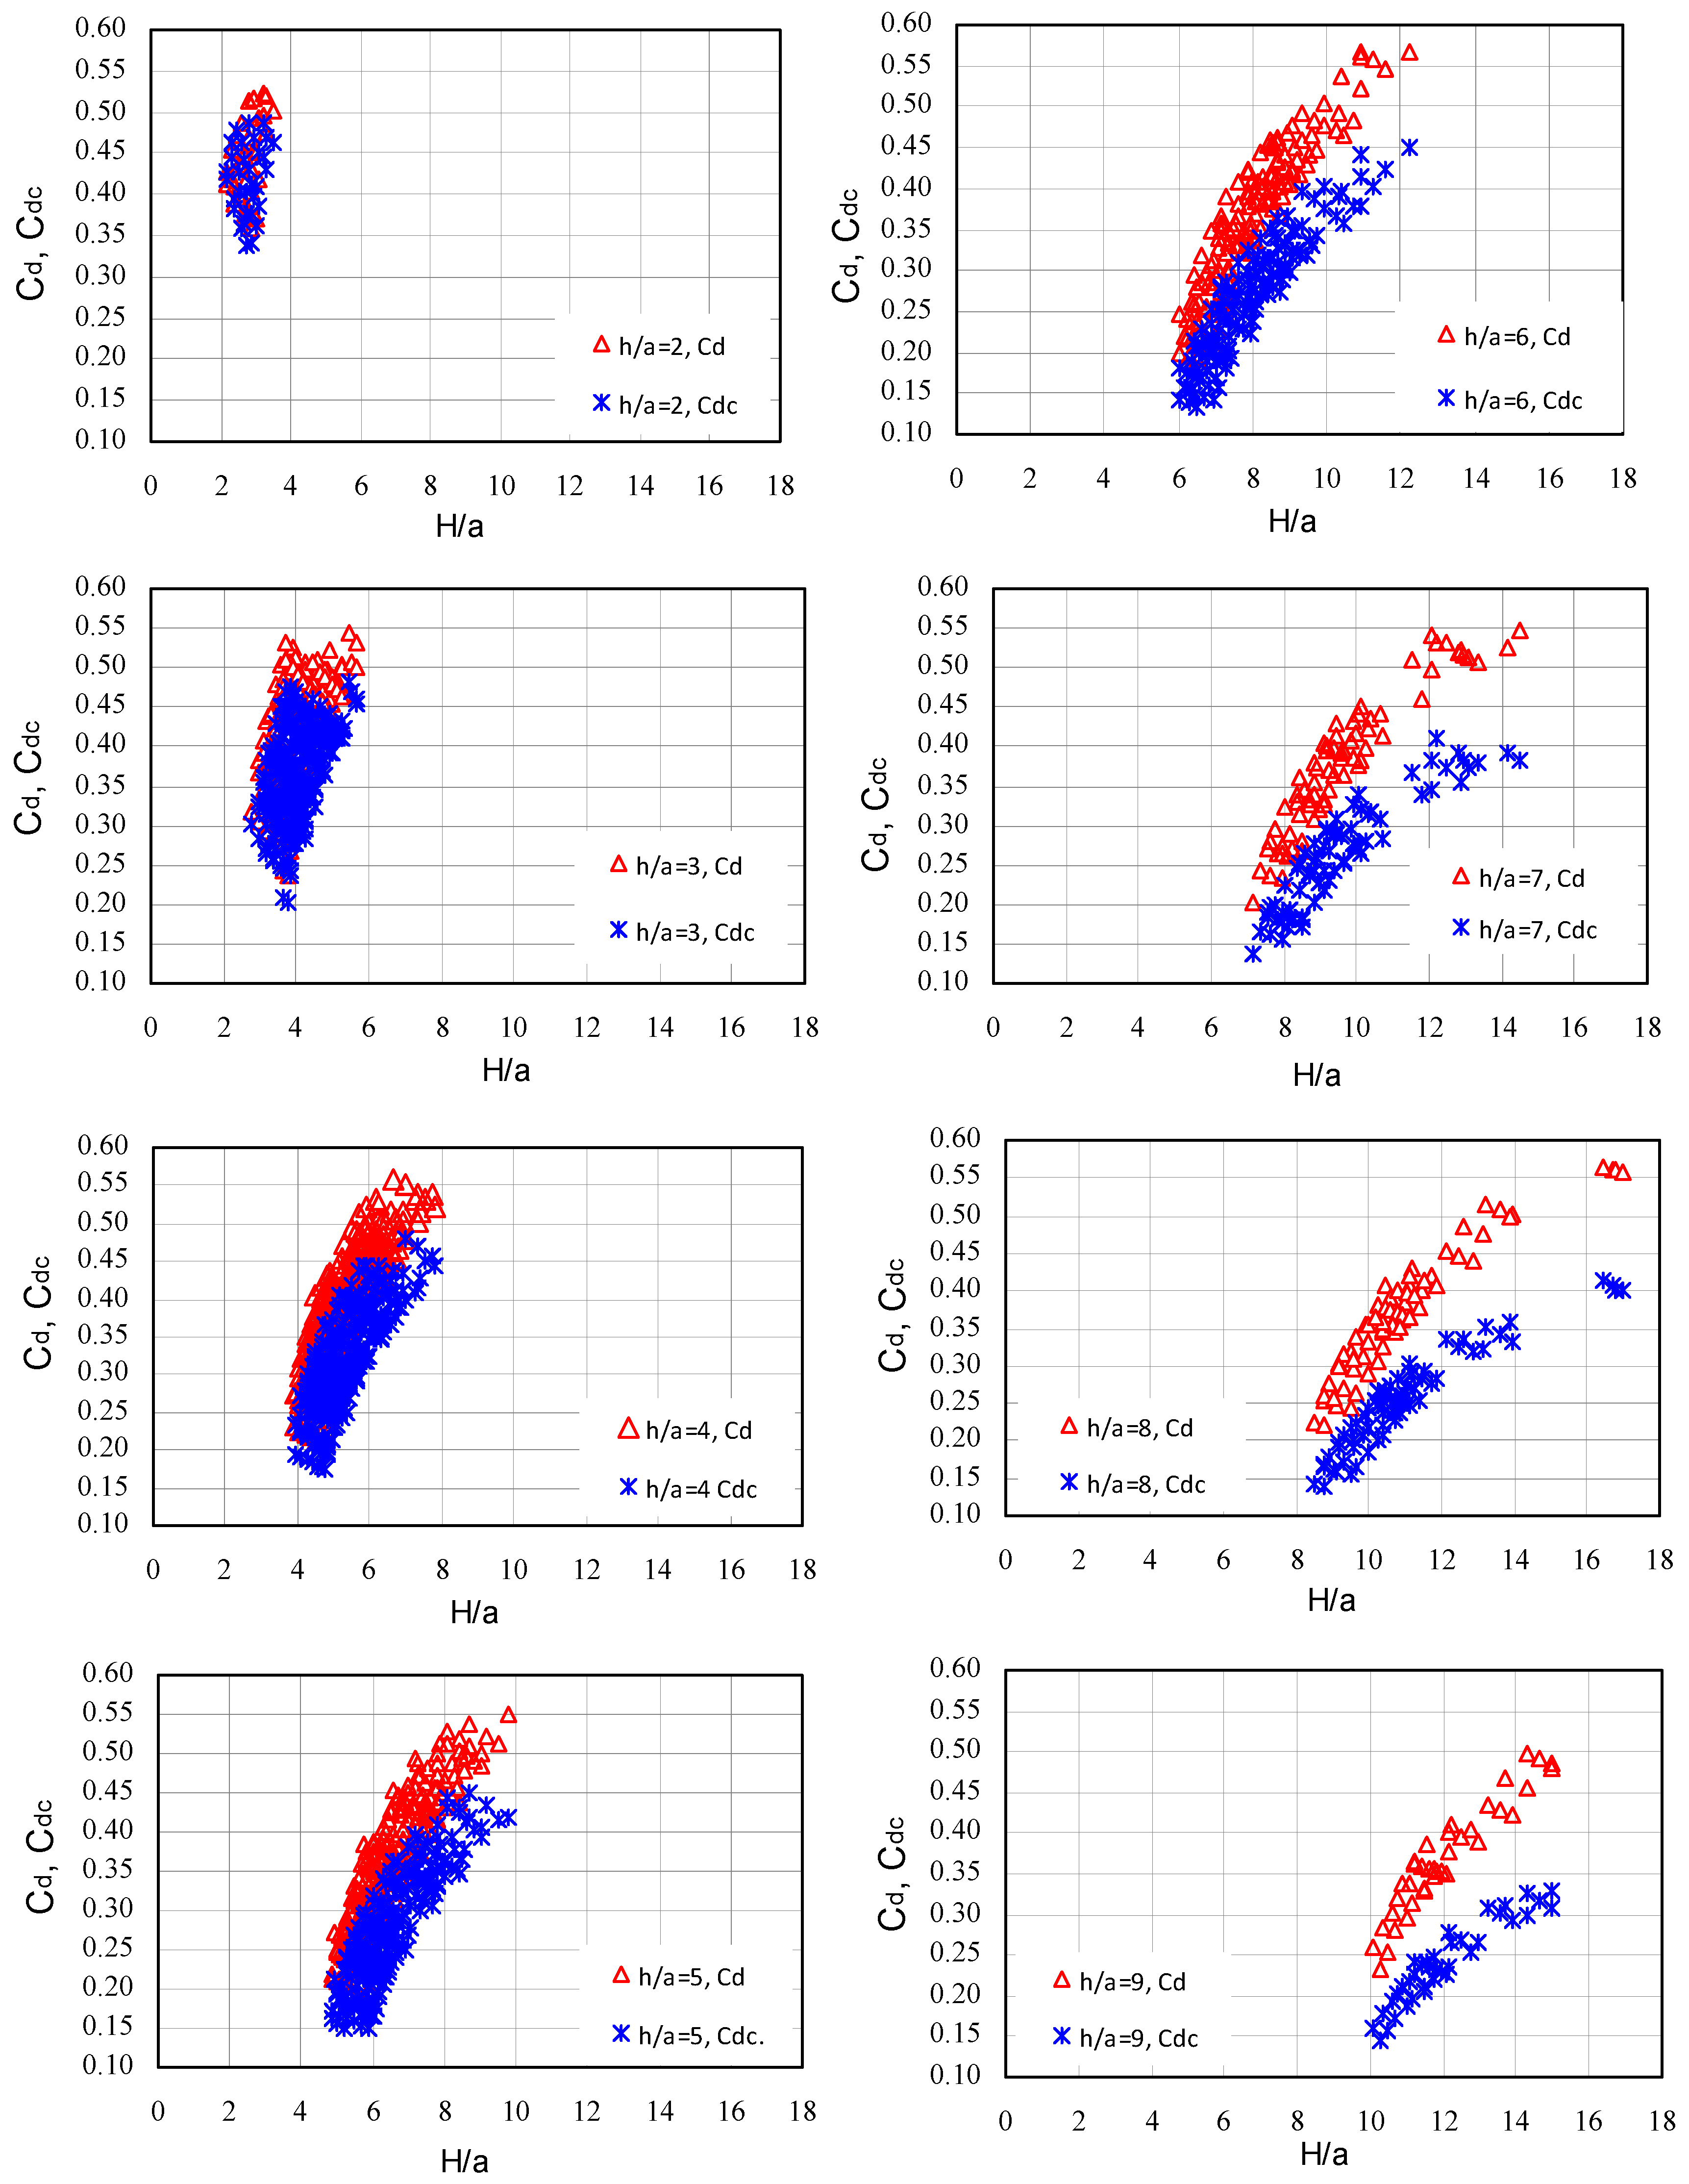
  • It is possible to use the Swamme relationship (5) to calculate the discharge coefficients on the basis of the downstream water depth measured in a fixed cross-section as in the practice of adopting corrections provided in relationships (8), (9). Calculated on the basis of measured depths, upstream H, downstream h and gate opening height a with Equations (11) and (12), the flow factors allow us to achieve compliance between the calculated flow rates and measured rates with accuracy of about 10%, confirming the practical usefulness of this method in estimating flow through the sluice gate, as stated by Boiten (1992) [20].
  • This approach might be useful in calibration of other designs of sluice gates for flow measurements.

Author Contributions

Conceptualization, E.K. and J.K.; Formal analysis, E.K., J.K. and M.K.; Funding acquisition, J.K.; Investigation, E.K., J.K. and M.K.; Methodology, E.K. and J.K.; Software, A.K. and M.K.; Writing—original draft, E.K., J.K., A.K. and M.K.; Writing—review & editing, A.K. All authors have read and agreed to the published version of the manuscript.

Funding

This research was funded by the National Centre for Research and Development, grant number (347837/11/NCBR/2017), “Technical innovations and system of monitoring, forecasting and planning of irrigation and drainage for precise water management on the scale of drainage/irrigation system”.

Acknowledgments

We are grateful Zygmunt Pietraszek for preparing the sluice gate model.

Conflicts of Interest

The authors declare no conflict of interest. The funders had no role in the design of the study; in the collection, analyses, or interpretation of data; in the writing of the manuscript, or in the decision to publish the results.

References

  1. Clemmens, A.L.; Strelkoff, T.S.; Replogle, J.A. Calibration of submerged radial gates. J. Hydraul. Eng. 2003, 129, 680–687. [Google Scholar] [CrossRef] [Green Version]
  2. Kaca, E. Calibration of Water-Drainage Structures; Wydawnictwo IMUZ: Falenty, Poland, 1996. (In Polish) [Google Scholar]
  3. Jędryka, E.; Kaca, E. Assessment of the Error in Estimating an Output Coefficient Value for a Melioration Gate Weirs; Wiadomości Instytutu Melioracji i Użytków Zielonych: Warsaw, Poland, 1998; Volume XIX, pp. 129–142. (In Polish) [Google Scholar]
  4. Lozano, D.; Mateos, L.; Merkley, G.P.; Clemmens, A.J. Field calibration of submerged sluice gates in irrigation canals. J. Irrig. Drain. Eng. 2009, 135, 6. [Google Scholar] [CrossRef]
  5. Belaud, G.; Cassan, L.; Baume, J.P. Calculation of contraction coefficient under sluice gates and Application to discharge measurement. J. Hydraul. Eng. 2009, 135, 1086–1091. [Google Scholar] [CrossRef] [Green Version]
  6. Cassan, L.; Belaud, G. Experimental and numerical investigation of flow under sluice gates. J. Hydraul. Eng. 2012, 138, 367–373. [Google Scholar] [CrossRef] [Green Version]
  7. Shayan, H.S.; Farhoudi, J.; Khezerloo, A.B. Theoretical and experimental study of flow from sluice gates. Proc. Inst. Civil Eng. Water Manag. 2015, 167, 152–163. [Google Scholar] [CrossRef]
  8. Kiczko, A.; Kubrak, J.; Kubrak, E. Experimental and numerical investigation of non-submerged flow under a sluice gate. Ann. Warsaw Univ. Life Sci. Land Reclam. 2015, 47, 187–201. [Google Scholar] [CrossRef] [Green Version]
  9. Silva, C.O.; Rijo, M. Flow rate measurements under sluice gates. J. Irrig. Drain. Eng. 2017, 143, 06017001. [Google Scholar] [CrossRef] [Green Version]
  10. Water Measurement Manual; USA Department of the Interior Bureau of Reclamation: Ephrata, WA, USA, 2001.
  11. Kraatz, D.B. Small Hydraulic Structures; Paper 26/2; FAO Irrigation and Drainage: Rome, Italy, 2002. [Google Scholar]
  12. Żukowski, N.E. Gidrodynamika; ONTI USTPH: Moscow, Soviet Union, 1936; Volume III, p. 220. (In Russian) [Google Scholar]
  13. Kubrak, E.; Kubrak, J. Basics of Fluid Mechanics in Environmental Engineering and Environmental Protection; Wydawnictwo SGGW: Warwav, Poland, 2018. (In Polish) [Google Scholar]
  14. Rouse, H. Elementary Mechanics of Fluids; Dover Publications, Inc.: New York, NY, USA, 1946. [Google Scholar]
  15. Swamee, P.K. Sluice gate discharge equations. J. Irrig. Drain. Eng. 1992, 118, 56–60. [Google Scholar] [CrossRef]
  16. Harold, H.R.; Holdhusen, J.S.; Citrini, D.; Corrsin, S.; Baines, W.D.; Streiff, A. Discussion of “Diffusion of submerged jets”. Trans. ASCE 1950, 115, 687–697. [Google Scholar]
  17. Rajaratnam, N.; Subramanaya, K. Flow equations for the sluice gate. J. Irrig. Drain. Eng. ASCE 1967, 93, 167–186. [Google Scholar]
  18. Typical Designs of the Openings of Type Z; Polish Ministry of Agriculture, Centralne Biuro Studiów i Projektów Wodnych Melioracji: Warsaw, Poland, 1969. (In Polish)
  19. Gwinn, W.R.; Ree, W.O. Maintenance effects on the hydraulic properties of a vegetation lined channel. Trans. ASAE 1980, 23, 636–642. [Google Scholar] [CrossRef]
  20. Boiten, W. Vertical Gates for Distribution of Irrigation Water; Report 30; Delft Hydraulics and Wageningen Agricultural University: Delft, The Netherlands, 1992. [Google Scholar]
Figure 1. Submerged flow under the gate: (a) water depth hz immediately downstream of the gate is noticeably lower than the downstream water depth h (hz < h), (b) the tailwater curve is always above the jump curve (hz ≈ h).
Water 12 00819 g001
Figure 2. Sluice gate flow: (a) free flow at outflow (unsubmerged); (b) submerged outflow (Swamee, 1992).
Water 12 00819 g002
Figure 3. Values of discharge coefficient for different H/a and h/a ratios in the case of a free and submerged flow through the sluice gate [15].
Water 12 00819 g003
Figure 4. The sluice gate model: (a) the view from the downstream stand in case V1, (b) depth measurement points in case V1, (c) depth measurement points in case V2 (dimensions in meters).
Water 12 00819 g004
Figure 5. Procedure to determine the measurement cross-section for downstream water depth hd, ensuring that the discharge calculated, using Equation (6), is equal to the observed one; Lc—the distance from the gate to the measurement cross-section.
Water 12 00819 g005
Figure 6. Measured water level profiles downstream of the gate in Case V1 experiments for the submerged sluice gate and constant roughness coefficients in the channel, with percentage deviation ΔQ of the measured flow rate Q from the calculated Qc on the basis of the measured depths.
Water 12 00819 g006
Figure 7. Changes in the Ld distance between the gate and the cross-sections, wherein the measured downstream water depth hd ensures that calculated flow rate equals the measured one, showed in the function of H/a.
Water 12 00819 g007
Figure 8. Comparison of the water depths h measured in the cross-section 3.035 m downstream of the gate and the depth hd ensuring agreement between the measured and calculated discharge, according to Equation (6).
Water 12 00819 g008
Figure 9. Discharge coefficients Cd calculated on the basis of measurements in experiments in the V2 case and from the Swamee [15] Cdc relationship (5).
Water 12 00819 g009
Figure 10. Percentage deviation of the Cd discharge coefficients calculated on the basis of measurements from the Cdc obtained using relationship (5): (a) Case V1, (b) Case V2.
Water 12 00819 g010
Figure 11. Discharge coefficients determined from measurements Cd and calculated using relationship (5) with correction (9) for h/a ratios 3, 5, and 7 in the V2 case.
Water 12 00819 g011
Figure 12. Percentage deviation in values of discharge coefficients obtained on the basis of measurements Cd and calculated with correction Cdcc: (a) case V1, (b) case V2.
Water 12 00819 g012aWater 12 00819 g012b
Figure 13. Discharge coefficients obtained from measurements Cd and calculated using Equation (5) with correction (11-12) Cdcc for: (a) case V1; (b) case V2.
Water 12 00819 g013
Figure 14. Nomogram to calculate the discharge coefficients Cdcc developed on the basis of dependence (5), including correction (8-9) for experiments performed in cases V1 and V2.
Water 12 00819 g014

