Abstract
Information about potential scenarios and causes of floods is important for future planning. Historical weather data of Fredericton (New Brunswick) and Charlottetown (Prince Edward Island), the two coastal cities of Atlantic Canada, were analyzed using RClimDex, Mann–Kendall test, and Sen’s slope estimates for potential scenarios and causes of floods. Flood hazard analyses were conducted using GIS (Geographical Information System) and ArcSWAT software. The watersheds of Fredericton and Charlottetown were delineated from 25 × 25 m resolution DEMs (Digital Elevation Models) of the two cities followed by percent watershed area calculations for different elevation classes for flood generation. Over the past 100 years, there was a significant decreasing trend in the high intensity precipitation in Charlottetown supported by a significant decrease in the number of heavy precipitation days. However, maximum one-day precipitation and maximum five-day precipitation significantly increased in Charlottetown and Fredericton, respectively. Charlottetown received more annual precipitation than Fredericton. In the last 30 years, there was an event exceeding 50 mm precipitation (considered as a threshold for the return period of urban floods) in Charlottetown; Fredericton experienced such events for more than 1.5 times. For twelve times, these events occurred more than once in a year in Charlottetown as compared to fourteen times in Fredericton. Despite statistically proven similarities in the occurrence of extreme events in the two cities, the visualized flood hazards, and the mapping of watershed characteristics, no devastating floods were reported for Charlottetown. This does not necessarily mean that there had never been risks of flooding in Charlottetown. These findings may help policymakers for future developments.
1. Introduction
Information about long-term homogeneity in trends of precipitation can help in making informed management decisions [1]. Almost 90% of the storm rainfall in the urban watersheds is lost to surface runoff causing floods [2]. Other than topography of a region, climatic factors are responsible for general and flash floods. For example, main- and mid-land regions experience flooding due to patterns of incoming and melting precipitation; whereas, the coastal regions face river backflow due to high tides or high waves resulting from tractive force of lunar tides. Due to climate change, it is advisable to identify the vulnerable areas and methods to mitigate the climate-induced hydrologic variation [3]. Literature describes occurring of floods as a potential impact of climate change [4,5,6,7,8,9,10].
Floods in the northern North coastal Atlantic regions are caused due to high tides, high waves, snowfall, snowmelt, and heavy rains. Climate change in the past years has resulted in irregular trends in the climate extremes including precipitation and temperature. Well defined seasonal floods have also changed the trends of their occurring [4]. It has been debated that flooding may vary from year to year depending upon specific years’ patterns of climate extremes [11,12,13].
Like many other coastal cities on Atlantic Ocean, the capital cities of the Atlantic Canadian provinces New Brunswick and Prince Edward Island; i.e., Fredericton and Charlottetown usually get storm warnings. The two cities are rapidly growing as they accommodate new immigrants, experience urban sprawl and extension in residential as well as commercial setups, situate on coastal belts, and experience similar climate. Fredericton faces regular floods and Charlottetown does not despite homogeneity in extreme events of precipitation and coastal location. Because of the location of Charlottetown in one of the areas in Canada’s most vulnerable to storm surges, concern over the likelihood of sea-level rise affecting the city in the future has been raised by the provincial and local governments, as well as climate change researchers. Charlottetown, with its highly concentrated urban infrastructure along the ocean front, has potential for being seriously affected by sea-level rise and by storm surges, which occur at the rate higher than anywhere else in Atlantic Canada [14,15]. A co-existence of precipitation extreme events and sea-level rise due to the storm surges may cause a situation of devastating flooding and the resultant socio-economic disasters. Flooding due to storm surges have been the subject of climate change studies, including a comprehensive study, completed in 2002, on the coastal impacts of sea-level rise [14,15,16,17]. Potential threats of the extreme precipitation have yet to be explored for their further possible combination with storm surges and resultant flood hazards in Charlottetown.
In general, flood hazard maps are produced based on floodplains analyzed using river level (i.e., stream gauge) and/or topographical data. Li et al. [18] used GIS to processes topographical data; i.e., Digital Elevation Models (DEM), generated with remote sensing, for simulating the flood hazard range and flood-prone areas. They compared their results with flood maps generated from hydrological data as well and recommended that the method of flood hazard generation from GIS can be applied for flood hazard assessments. The literature also indicated that hydrodynamic models are more appropriate for detailed coastal flood vulnerability assessment, but GIS can be used for flood hazard assessment in large areas [19,20]. GIS analysis for flood hazard assessments is based on geographic/topographical information data, such as DEM [18,21,22]. The most of the flood risk assessment models including GIS-based model for urban flood inundation (GUFIM) and the urban storm flood inundation simulation method (USISM) used GIS and DEM to analyze the urban flood hazard maps [22,23] as GIS can analyze the factors that have a greater impact on urban floods [24,25]. Lyu [26] analyzed the relationship between flood risk and urbanization, and concluded that one of the significant influential factors of flooding was identified as the urbanization degree. It has been observed that GIS can be pivotal in delineating flood-prone areas without using river level data [18]. Long-term time-series data can be analyzed for trends in climate extremes and GIS can be used to delineate watersheds and processes DEM for mapping flood-prone areas to visualize areas under flood hazards in regions where stream gauge data (river levels) are unavailable. The outcome of such study may help policymakers for future developments with regard to flood planning under climate change impacts. Therefore, the objective of this study was to investigate if such situations existed in the past with regard to precipitation events having potential for causing floods in Charlottetown.
2. Materials and Methods
2.1. Model Cities
Fredericton and Charlottetown were selected as the model cities for this study (Figure 1; Table 1). Due to vicinity of the Saint John River and the dominant climate of the region, Fredericton has in the past experienced devastating floods. The Saint John River flow from the West to the East bisects Fredericton city, which is almost 150 km away from the Bay of Fundy at Atlantic Ocean. Floods in Fredericton are usually caused by heavy rains in the catchment of the River Saint John, which is the dominant natural feature and drainage source of this city. Conversely, Charlottetown is located in the Gulf of St. Lawrence. The location of the city on the coastal belt and waterfront of Prince Edward Island and its history of prevailing wet climate attract researchers’ interests for studying potential of flooding and its socioeconomic impacts with and without climate change scenarios [27].
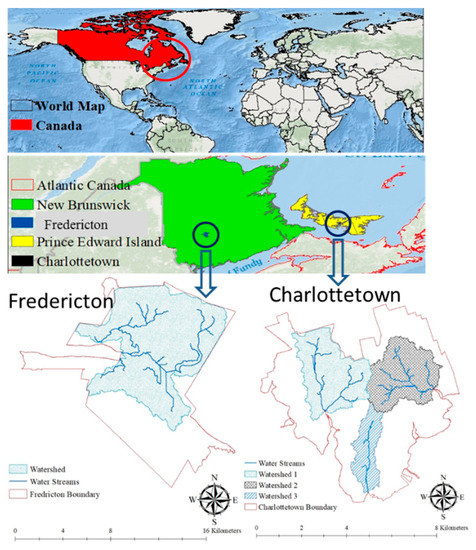
Figure 1.
Locations of the model cities Fredericton (bottom left) and Charlottetown (bottom right) in Atlantic Canada along with watersheds displayed inside the boundary of the cities.

Table 1.
Year of establishment/foundation, population, population density, geographical coordinates, elevation, and historical values of precipitation and temperatures of the selected cities of in comparison to country level figures of Canada.
Charlottetown’s percent urban area is almost twice of Fredericton’s percent urban area. Charlottetown does not only have higher percent area but also has ~1.5-times higher population density than that of Fredericton. However, Fredericton has ~2 times more residential area than Charlottetown may be because of over 22,000 more residents in the former city. These land use statistics put Charlottetown ahead of Fredericton with regard to potential for accommodation of future population and the resultant demographic figures leading to cautions for risks of natural calamities such as floods as according to Sheng and Wilson [2] almost 90% of the storm rainfall in the urban watersheds is lost to surface runoff causing floods.
The official boundary of Charlottetown contains three watersheds; whereas, Fredericton has one watershed. The watersheds of Charlottetown have anthropogenic activities as they are agriculturally productive with ~3-times more agricultural activities than the watershed of Fredericton. Therefore, even rural flood will cause damage to the agricultural properties more in Charlottetown than in Fredericton. As such, the land use of Fredericton watershed has more forests (44.6%) and wetlands (3.3%) than the combined three watersheds of Charlottetown.
Since Charlottetown did not experience any disastrous events, the provincial government of Prince Edward Island did not make and/or report any efforts to develop a database of flood events like the one developed by the New Brunswick Government department of Environment and Local Government (https://www.elgegl.gnb.ca/0001/en/Flood/Search) that stores the records for dates, damage caused and description of floods occurred in New Brunswick over the past more than 100 years. Flood search for Fredericton on this database for the 100 years period (1919–2018) results in 1, 3, 3, 0, and 60 major floods caused by high wave, high tides, snowfall, snowmelt, and heavy rains, respectively. None of these floods except those caused by heavy rains had a huge damage amount. All of these devastating floods, causing high socio-economic impacts, occurred on days when precipitation was more than 50 mm per day or cumulatively for the duration of the flood days (Table 2). The heavy rains can cause ice flood followed by ice jam in the system creating stoppage in the city drainage. Therefore, a daily precipitation of 50 mm or a cumulative rain of this amount for consecutive days of precipitation can be considered as the threshold for return period for heavy floods in coastal cities resembling climatic and urban conditions of Fredericton.
Table 2.
Information about twelve out of sixty floods reported for Fredericton caused by heavy rains during 1988–2018 period. (Source: New Brunswick Government Department of Environment and Local Government website https://www.elgegl.gnb.ca/0001/en/Flood/Search).
2.2. Climate Extreme Indices
Eleven precipitation indices established by the Experts Team on Climate Change Detection, Monitoring and Indices (ETCCDI) and the World Meteorological Organization Commission for Climatology and the Research Program on Climate Variability and Predictability were used to study precipitation extremes of Fredericton and Charlottetown. The indicator names, mathematical definitions, and formulae used to calculate these indices are briefed in Table 3.
Table 3.
The precipitation extreme indices calculated for the selected cities.
2.3. Analysis of the Time-Series Data
Time-series (daily) meteorological data for the past 100 years (1919–2018) were considered for this study. The eleven indices listed in Table 3 for the period data (1919–1988) for the two model cities were used from the database of ETCCDI [28,29]. The meteorological data (1989–2018) were downloaded from Environment Canada website http://www.ec.gc.ca/. Environment Canada collects climate data from a number of weather stations across Canada including one in Fredericton (Latitude: 45.92; Longitude: −66.62) and in Charlottetown (Latitude 46.29; Longitude: −63.13). Daily precipitation data collected at these two stations were downloaded for this study. Quality control and the homogeneity tests on these sets of data were applied using RClimdex software [30,31]. This software conducts quality checks; for example, the negative precipitation (if any) in the data is replaced as missing data. Precipitation values above 200 mm were checked to ensure that the adjacent values were not set to missing, that is, that high values were not due to accumulation over several days [32]. RClimdex was used to calculate to calculate the eleven extreme indices (Table 3). Based on the evidences that the devastating floods in Fredericton occurred when the daily precipitation was at least 50 mm (Table 2) and the value for the assumed of threshold for the return period was fixed as 50 mm. Therefore, in order to calculate the number of days above 50 mm, the index R50mm was calculated the past three decades (1989–2018) to count number of days per year when precipitation was ≥50 mm. The value 50 was used as a user defined threshold for the marked return period of 30 years.
2.4. Hazard Analyses
The geographical data including digital elevation models (DEM), land use, infrastructure and administrative boundaries were retrieved from provincial geographic information portals namely GeoNB and the government of Prince Edward Island GIS catalogues. The watersheds of Fredericton and Charlottetown were delineated from DEM (cell size 25 × 25 m) using ArcGIS V10.4 (Developed by Environmental Systems Research Institute). Flood-prone areas were delineated using ArcSWAT software, which is an ArcGIS-ArcView extension and interface for SWAT. Steam extents were extracted from DEM using ArcSWAT. Flood plains in both cities were delineated with further processing of DEM using ArcGIS extensions including flow direction, stream delineation and defining outlets. Percent areas under different elevation classes of the watersheds were retrieved from DEM using ArcSWAT for flood hazards analysis. River levels data were not available for watersheds of Charlottetown. Probabilistic methods are used to statistically evaluate flood hazards in absence of river level data [33]. Therefore, in sites with missing stream gauge data, the flood hazard assessment is made by using remote sensing data; i.e., DEM to substitute field observations (stream gauge data for river levels) [34]. Flood-prone area maps were generated in ArcMap using elevation information; e.g., less elevation areas have more risks to floods and vice versa.
2.5. Statistical Analyses
Trends of the precipitation extremes and their significance were statistically checked with the nonparametric Mann–Kendall test and Sen’s slope estimates [35,36,37]. All the trend analyses were performed using MAKESENS [38], which uses the S statistics [39] if the number of observations is fewer than 10, MAKESENS and Z statistics (normal distribution) for more than 10 observations. Detailed descriptions of the program can be found in Salmi et al. [38].
Comparison between the calculated climate extremes of the two cities were made by calculating the root mean square error (RMSE), which represents the degree of coincidence of the relevant events, and coefficient of correlation (r), which indicates the degree of association between the calculated values of the two cities. The RMSE was calculated as [40]:
where C1 and C2 are the indices values for city 1 (Fredericton) and city 2 (Charlottetown), respectively, and n is the number of samples; 100 (years) in all indices excluding R50mm (the threshold for return period index) for which the value of n was set as 30 (years) because R50mm was calculated for the past 30 years (1989–2018) of the flood record in consideration. A Pearson linear correlation test was used to cross-correlate the calculated values of extremes of the two cities. Values of r close to 1 meant strong correlation and close to 0 meant week or no correlation.
3. Results and Discussion
The trend of simple daily intensity index (SDII) showed significant decrease (p < 0.001) in the daily precipitation intensity for Charlottetown (Table 4). However, the decrease in the trend of SDII for Fredericton was non-significant. This reflects a decreasing trend in the high intensity precipitations in Charlottetown over the past 100 years supported by the significant decrease (p < 0.001) in the number of heavy precipitation days (R10mm). However, maximum one-day precipitation and maximum five-day precipitation significantly increased in Charlottetown (p < 0.001) and Fredericton (p < 0.05), respectively. Although there were negative trends in total precipitation received per year by both the cities, the trend for Charlottetown was significant (p < 0.001); nonetheless, it received overall more precipitation than Fredericton during the past century.
Table 4.
Results of the Mann–Kendall trend analysis and Sen’s slope estimate to show trend line parameters and significance levels for the calculated trends of precipitation extremes of Fredericton and Charlottetown during the 100 years period of 1919–2018.
Despite non-significant trends, the mean values of number of consecutive dry days increased at the rate of almost 1.5 days per decade; however, there was an addition of half a day per decade in the number of consecutive wet days for the both cities with a slightly less than 0.1 mm/day decrease in the annual total precipitation per wet days (Table 4 and Table 5). Mean number of per annum days when precipitation was more than 10 and 20 mm termed as heavy and very heavy precipitation days, respectively, were almost the same for both the cities; i.e., 40 and 15, respectively. However, Fredericton experienced two time more very wet days (gauged by above 95th percentile of total annual precipitation) and only seven extremely wet days (gauged by above 99th percentile of total annual precipitation) than Charlottetown every year during the past century. The monthly maximum one-day and five-day precipitation averaged over a year for the both cities were almost similar; 57–60 and 89–90 mm, respectively. Charlottetown, however, received 65 mm more precipitation per year than Fredericton over the past century (Table 5).
Table 5.
Results of the descriptive statistics and regression applied individually on the city data to understand variations in the calculated indices within the city and on the combined data for similarities between the cities.
With apparently slight difference between the values of the indices shown in Table 5, the mean values of extreme dry and extreme wet indices for the two cities were not statistically different from one another. The bars of the standard deviation values of the respective indices of the two cities overlapped visually (Figure 2) and arithmetically (Table 5) reflecting statistical similarities between the respective annual mean values of the four indices shown in the Figure 2.
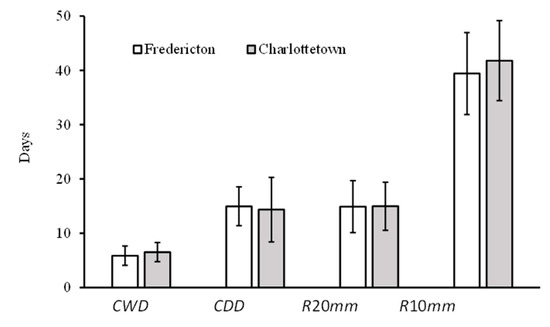
Figure 2.
The mean number of days for consecutive wet, consecutive dry, very heavy precipitation, and heavy precipitation with their overlapping standard deviation bars reflecting no statistically significant difference between the annual means of the mentioned indices of Fredericton (open columns) and Charlottetown (shaded columns).
Frequency as well as intensity of the indices represented by R20mm (very heavy precipitation), and heavy precipitation R10mm heavy precipitation) shown in Figure 1 as indicators of annual count of days when precipitation was equal to or exceeded 20 and 10 mm, respectively indicate similar soaking conditions of the two cities during the past century. This situation is also supported by the results of the simple daily intensity index denoted by SDII, which is the annual total precipitation divided by the number of wet days when precipitation was equal to or more than 1 mm in the year (Figure 3). The two cities did not only have the similar SDII (e.g., 9.56 ± 1.13 versus 8.81 ± 0.98; Table 5), but the indicators of the patterns of precipitation intensity, as represented by the maximum one-day precipitation (Rx1day) and the maximum five-day precipitation (Rx5day) followed the same trends of similarity between the two cities as shown in Figure 3.
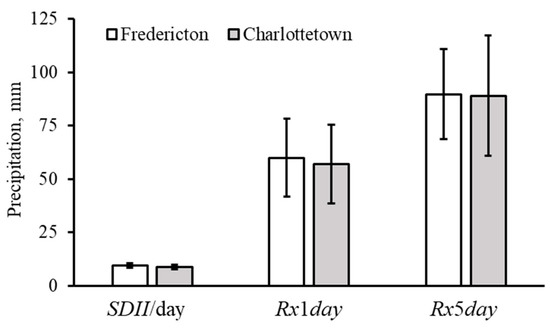
Figure 3.
The mean values of precipitation depth (mm) for the simple daily intensity index (mm/day), the maximum 1-day precipitation, and the maximum 5-day precipitation with their overlapping standard deviation bars reflecting no statistically significant difference between the annual means of the mentioned indices of Fredericton (open columns) and Charlottetown (shaded columns).
Charlottetown had the higher accumulated annual precipitation then Fredericton over the past century as shown in the black and white inset of Figure 4. Never in the past 100 years, had Fredericton’s cumulative precipitation surpassed the values of Charlottetown showing that the latter remained wetter than the former from 1989 to 2018. During the past three decades, Charlottetown had thirty-three events when the precipitation exceeded 50 mm as compared to forty-six similar events (R50mm) experienced by Fredericton as shown in the main Figure 4. For twelve times, these events occurred more than once in a year, depicted by solid lines with multiple symbols (hollow circles) per line in Charlottetown as compared to fourteen times in Fredericton, depicted by solid lines with multiple symbols (close circles) per line, which had three of these intense events per annum during the years 1999 and 2013, and four during 2008 and 2012 (Figure 4).
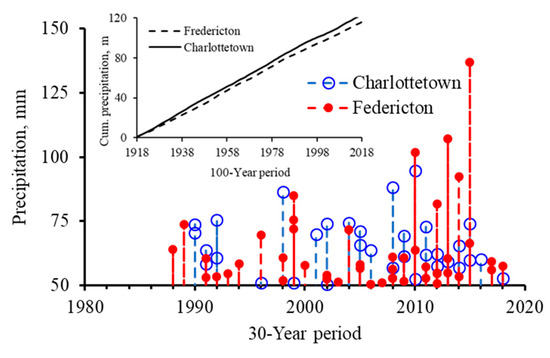
Figure 4.
Amount of daily precipitation exceeding 50 mm in Fredericton and Charlottetown during the 1988–1918 period. The solid red or blue lines represent more than one event of above 50 mm precipitation during the same year. The open circle symbols for Charlottetown data have been enlarged to avoid hiding of Fredericton data. The inset black and white graph shows cumulated 100-year precipitation to display that Charlottetown (solid black line) received more total precipitation than Fredericton (broken black line).
Results in the Figure 5 presented with red stars show the similar extreme events results in ten devastating floods in Fredericton on these dates (Table 3). Review and deep search of the available literature do not report flooding during these years of similar events in Charlottetown; however, the results of the statistical analyses (Table 5) dictates occurrence of danger of floods shown by a strong correlation (r = 0.770) for number of days when precipitation exceeded the marked threshold of return period (50 mm) in the two cities. These events can greatly increase overland flow and without designated areas of flood storage, this could also contribute to increased urban flooding if coincided with the sea-level rise producing storm surges. Thus, the water and sewer system in Charlottetown will have to contend with the increased urban run-off and coastal inundation at the same time [15]. Moderate correlations were also calculated, and reported in Table 5, for the indices defining intensity of precipitation including R10mm, SDII, and R20mm (r = 0.472, 0.400, and 0.383, respectively) and frequency of precipitation; i.e., TOTPRCP (r = 0.469). The indications of similarities between the extreme climates of the two cities are also proven with the low values of RMSE especially for these mentioned indices (Table 5).
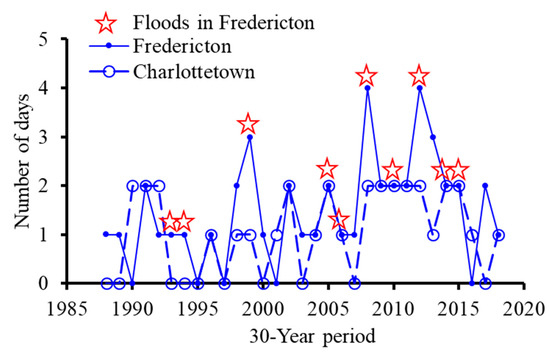
Figure 5.
Number of days when daily precipitation exceeded 50 mm in Fredericton and Charlottetown during the period 1989–1918. The red stars represent flood events reported for Fredericton by New Brunswick government’s flood database during the respective years (Table 2). The open circle symbols for Charlottetown data have been enlarged to avoid hiding of Fredericton data.
Historical records (Table 2) show that all the major flood events in Fredericton occurred when one-day precipitation exceeded 50 mm. This means that during the past, the climate conditions of Charlottetown had potential to cause heavy flooding had its topographical and urban scenarios been similar to those of Fredericton. An obvious difference between the settings of the two cities is the absence of a river of the size of the Saint John to flow through Charlottetown. However, geographical location of Charlottetown in the Gulf of St. Lawrence and on the waterfront of Atlantic can never be ignored for surges in the days of high tides that may lead to a blocked drainage of city’s surface runoff during the events of higher intensity. McCulloch et al. [15] investigated the effects of climate change induced sea-level rise and land subsidence on Prince Edward Island, focusing specifically Charlottetown and the Island’s North Shore and identified the coast of Prince Edward Island, particularly its northern shoreline, as one of the most sensitive regions to climate change and sea-level rise in Canada.
The situation may worsen as according to Vasseur and Catto [41], the projections for the Atlantic region have indicated an increase in both the mean annual temperatures and annual precipitation rates to be 1.5–6 °C in summer and 2–4 °C between the winter by the year 2050 when rainfalls are expected to increase seasonally and are likely to contribute to more frequent precipitation events. For example, on 10 August 2018, a high tide-induced shorter but powerful bout of rain, hail and heavy wind hit Charlottetown and left it underwater (Figure 4). It also left nearly 2500 residents, mostly in Charlottetown without power according to a newspaper reporting (https://www.cbc.ca/news/canada/prince-edward-island/pei-charlottetown-heavy-rain-flooding-water-1.4781688). The reason was claimed to be the catch basins being clogged to create a major problem in terms of the water rising to a level where it interferes and flows into people’s properties. Discussions of officials of Public Works Department of Charlottetown revealed their experience and opinion that as per routine for this coastal city, storm water of this city goes to the harbor, but with the water coming in from the tide, it just backs up into the system that in some areas cannot handle the water (Figure 6).
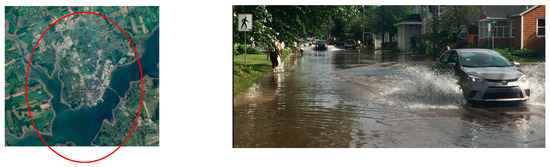
Figure 6.
A Google Earth view of Charlottetown area reflecting potential for a storm water of the city to go to the harbor (left), by routine, backs up into the city system as a result of water coming in from the tide (source for (right): a photo from the CBC online news published on 10 August 2018 at https://www.cbc.ca/news/canada/prince-edward-island/pei-charlottetown-heavy-rain-flooding-water-1.4781688).
Armenakis et al. [42] reported that in recent years, large Canadian cities have been exposed to devastating floods, resulting in damage to properties, loss of lives, the endangerment of exposed populations, the disruption of social and societal services, and substantial damage to the important urban critical infrastructure. Similar events are common for Fredericton and potentially possible for Charlottetown because of the topography of watersheds of these cities (Figure 7). Southern coastal areas and water front of Charlottetown are also at risk for flood hazards due to the three pore points of its three watersheds (Figure 1 and Figure 7b) in contrast to the situation in Fredericton, which is prone to flood hazards in the vicinity of River Saint Johns (Figure 7a and Figure 8a). Severe floods reported for Fredericton might have been generated because of topography of this city having one watershed and all the water of its catchment being drained through one outlet only (Figure 1 and Figure 7a).
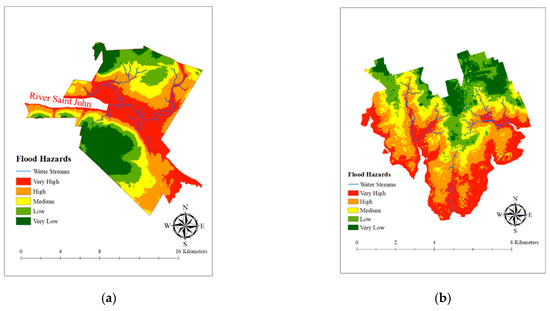
Figure 7.
The flood-prone maps of Fredericton (a) and Charlottetown (b).
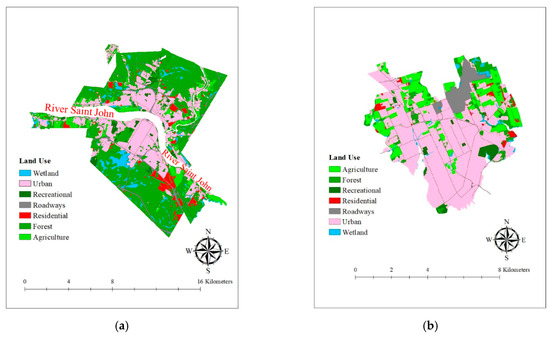
Figure 8.
Land use components of Fredericton (a) and Charlottetown (b) reflecting urban designated areas prone to flood damage in watersheds of both cities.
Another reason for frequent and devastating floods in Fredericton was varying slope of its only watershed. Slightly over 10% of its area is located at elevation above 100 m and over ~33% of the area is at elevation between 50 and 100 m (Table 6). Rainfall received at higher elevation generate flash floods that accumulate in the lower elevations; i.e., 56.8% in case of Fredericton. In contrast, over 95% of the areas of the three watersheds of Charlottetown are prone to accumulation of flood water once an event is or will be generated. Such topographical differences between the watersheds of Fredericton and Charlottetown are responsible for the past devastating floods in the former and the potential floods of extreme nature in future climatic forecasts in the latter.
Table 6.
Topographical characteristics of the watersheds of Fredericton and Charlottetown (displayed in Figure 1) retrieved from flood hazards analysis using ArcSWAT (Soil and Water Assessment Tool) interfaced with ArchGIS.
The land use maps the two cities show similar flood risks as the most of the urban areas of these cities exist around the streamlines and/or rivers passing through the urban settings (Figure 8). Although, the residential areas of the two cities are well apart from potential flood hazard ranges but the most of the roadways of the two cities lie in flood prone areas portraying potential lockdown of the cities in the events of flooding.
These evidences could help policymakers establish for future developments. However, any development with regard to civil work and spending of resources would need further analyses with varying approaches. The approach introduced by Armenakis et al. [42], that builds upon the methods for estimating spatial vulnerability, spatial hazard, and spatial risk considered in various studies [43,44], incorporates the higher spatial resolution and details determined from Earth observation data may also be adopted for further studying the risks of floods in Charlottetown in future endeavors. As suggested by Armenakis et al. [42], this approach can be applied to the development of strategies for future flood risk reduction, risk-based land use planning, resilience, and capacity-building as in particular, it supports spatial decision-making and the development of disaster impact reduction strategies, and the overall effectiveness of disaster management.
4. Conclusions
Results of the analyses of long-term time-series data about precipitation and flood events of Fredericton and Charlottetown have been compared to provide basis for future flood planning in Charlottetown. Statistically significant similarities were found with regard to precipitation extremes of the both cities. GIS analysis and maps helped to visualize potentials for occurring of floods and the areas under threat of floods. It is concluded that the natural topography of Charlottetown resulted in gravity flow of the surface runoff generated from the precipitation events similar to those that caused devastating floods in Fredericton in the past. The situation must not be taken for granted in future and the Prince Edward Island government should start taking preventative measures to cope with the situation of flood generation in case of conjunctive occurrence of extreme precipitation in Charlottetown and storm surges in the Gulf of Saint Lawrence and/or in the Hillsborough and North Rivers. These results will provide guidelines for future studies on risk assessment of flooding in coastal cities. The outcome of such study may help policymakers for future developments with regard to flood planning under climate change impacts.
Author Contributions
Conceptualization, F.A.; methodology, F.A.; validation, A.A.F.; formal analysis, F.A., H.A.; investigation, F.A. and H.A.; resources, A.A.F.; data curation, F.A. and H.A.; software, F.A. and H.A.; writing—original draft preparation, F.A.; writing—review and editing, A.A.F.; supervision, A.A.F.; funding acquisition, A.A.F. All authors have read and agreed to the published version of the manuscript.
Funding
This research was supported the Natural Sciences and Engineering Research Council of Canada (NSERC).
Conflicts of Interest
There is no conflict of interest to declare.
References
- Patakamuri, S.K.; Muthiah, K.; Sridhar, V. Long-term homogeneity, trend, and change-point analysis of rainfall in the arid district of ananthapuramu, Andhra Pradesh State, India. Water 2020, 12, 211. [Google Scholar] [CrossRef]
- Sheng, J.; Wilson, J. Watershed urbanization and changing flood behavior across the los angeles metropolitan region. Nat. Hazrds 2009, 48, 41–57. [Google Scholar] [CrossRef]
- Dong, N.; Yu, Z.; Gu, H.; Yang, C.; Yang, M.; Wei, J.; Wang, H.; Arnault, J.; Laux, P.; Kunstmann, H. Climate-induced hydrological impact mitigated by a high-density reservoir network in the poyang lake Basin. J. Hydrol. 2019, 579, 124148. [Google Scholar] [CrossRef]
- Rémillard, L.J.; Rousselle, F.; Ashkar, D. Sparks: Analysis of the seasonal nature of extreme floods across Canada. J. Hydrol. Eng. 2004, 9, 392–401. [Google Scholar] [CrossRef]
- Kay, A.L.; Davies, H.N.; Bell, V.A.; Jones, R.G. Comparison of uncertainty sources for climate change impacts: Flood frequency in England. Clim. Chang. 2009, 92, 41–63. [Google Scholar] [CrossRef]
- Burn, D.H.; Sharif, M.; Zhang, K. Detection of trends in hydrological extremes for Canadian watersheds. Hydrol. Process. 2010, 24, 1781–1790. [Google Scholar] [CrossRef]
- Whitfield, P.H.; Wang, J.Y.; Cannon, A.J. Modelling future streamflow extremes—floods and low flows in Georgia basin, British Columbia. Can. Water Resour. J. 2003, 28, 633–656. [Google Scholar] [CrossRef]
- Kundzewicz, Z.; Pińskwar, W.I.; Brakenridge, G.R. Large floods in Europe, 1985–2009. Hydrol. Sci. J. 2013, 58, 1–7. [Google Scholar] [CrossRef]
- Collins, M.J. Coauthors. Annual floods in New England (SA) and atlantic Canada: Synoptic climatology and generating mechanisms. Phys. Geogr. 2014, 35, 195–219. [Google Scholar] [CrossRef]
- El-Jabi, N.; Turkkanand, N.; Caissie, D. Regional climate index for floods and droughts using Canadian climate model (CGCM3.1). Am J. Clim. Chang. 2013, 2, 106–115. [Google Scholar] [CrossRef]
- Todorovic, P. Stochastic models of floods. Water Resour. Res. 1978, 14, 345–356. [Google Scholar] [CrossRef]
- Irvine, K.N.; Drake, J.J. Spatial analysis of snow-and rain-generated highflows in southern Ontario. Can. Geographer 1987, 31, 140–149. [Google Scholar] [CrossRef]
- Ashkar, F.; El-Jabi, N.T.; Ouarda, M.J.B. Etude des variations saisonnie’res des crues par le mode’le de de´passement. Rev. Sci. Eau 1993, 6, 131–152. [Google Scholar]
- Gunn, A.H. Step One: Generating Dialogue, Adaptation to Sea-Level Rise on Prince Edward Island. Master’s Thesis, Landscape Architecture, University of Manitoba, Winnipeg, Manitoba, 2009. [Google Scholar]
- McCulloch, M.M.; Forbes, D.L.; Shaw, R.W.; the CCAF A041 Scientific Team. Coastal Impacts of Climate Change and Sea-Level Rise on Prince Edward Island; Open File 4261, Geological Survey of Canada; Bedford Institute of Oceanography: Dartmouth, Nova Scotia, 2002; p. 62. [Google Scholar]
- Forbes, D.L.; Parkes, G.S.; Mansion, G.K.; Ketch, L.A. Storm and shoreline retreat in the southern Gulf of St. Lawrence. Mar. Geol. 2004, 210, 169–204. [Google Scholar] [CrossRef]
- Forbes, D.L.; Shaw, R.W.; Mansion, G.K. Adaptation. In Coastal Impacts of Climate Change and Sea-level Rise on Prince Edward Island; Forbes, D.L., Shaw, R.W., Eds.; (Supporting Document 11); Geological Survey of Canada: Ottawa, ON, Canada, 2002. [Google Scholar]
- Li, J.; Li, J.; Yao, K. Inundation analysis of reservoir flood based on computer aided design (CAD) and digital elevation model (DEM). Water 2018, 10, 530. [Google Scholar] [CrossRef]
- Townsend, P.A.; Walsh, S.J. Modeling floodplain inundation using an integrated GIS with radar and optical remote sensing. Geomorphology 1998, 21, 295–312. [Google Scholar] [CrossRef]
- Avidesh, S.; Matthew, W.; Keith, M. Hydrodynamic versus GIS modelling for coastal flood vulnerability assessment: Which is better for guiding coastal management? Ocean Coast. Manag. 2016, 120, 99–109. [Google Scholar]
- Ismail, E. Flash flood hazard mapping using satellite images and gis Tools: A case study of Najran City, kingdom of Saudi Arabia (KSA). Egypt. J. Remote Sens. Space Sci. 2015, 18, 261–278. [Google Scholar]
- Asare-Kyei, D.; Forkuor, G.; Venus, V. Modeling flood hazard zones at the sub-district level with the rational model integrated with GIS and remote sensing approaches. Water 2015, 7, 3531–3564. [Google Scholar] [CrossRef]
- Zhang, S.H.; Pan, B.Z. An urban storm-inundation simulation method based on GIS. J. Hydrol. 2014, 517, 260–268. [Google Scholar] [CrossRef]
- Ouma, Y.O.; Tateishi, R. Urban flood vulnerability and risk mapping using integrated multi-parametric AHP and GIS: Methodological overview and case study assessment. Water 2014, 6, 1515–1545. [Google Scholar] [CrossRef]
- Gigovic, L.; Pamucar, D.; Bajic, Z.; Drobnjak, S. Application of gis-interval rough AHP methodology for flood hazard mapping in urban areas. Water 2017, 9, 360. [Google Scholar] [CrossRef]
- Lyu, H.-M.; Wang, G.-F.; Shen, J.S.; Lu, L.-H.; Wang, G.-Q. Analysis and GIS Mapping of Flooding Hazards on 10 May 2016, Guangzhou, China. Water 2016, 8, 447. [Google Scholar] [CrossRef]
- Webster, T.L.; Forbes, D.L.; Dickie, S.; Shreenan, R. Using topographic lidar to map flood risk from storm-surge events for charlottetown, Prince Edward Island, Canada. Can. J. Remote Sens. 2004, 30, 64–76. [Google Scholar] [CrossRef]
- Karl, T.R.; Nicholls, N.; Ghazi, A. Clivar/gcos/wmo workshop on indices and indicators for climate extremes: Workshop summary. Clim. Chang. 1999, 42, 3–7. [Google Scholar] [CrossRef]
- Peterson, T.C. Report on the Activities of the Working Group on Climate Change Detection and Related Rapporteurs 1998–2001; World Meteorological Organization: Geneve, Switzerland, 2001; p. 143. [Google Scholar]
- Zhang, X.; Yang, F. Rclimdex (1.0) User Manual. Climate Research Branch. User Manual. 2004. Available online: https://acmad.net/rcc/procedure/RClimDexUserManual.pdf (accessed on 11 March 2020).
- Alexander, L.V. Global observed changes in daily climate extremes of temperature and precipitation. J. Geophys. Res. 2006, 111, D05109. [Google Scholar] [CrossRef]
- Aguilar, E. Changes in precipitation and temperature extremes in Central America and northern South America, 1961–2003. J. Geophys. Res. 2005, 110, D23107. [Google Scholar] [CrossRef]
- Department of regional development and environment executive secretariat for economic and social affairs organization of American states. Chapter 8—Floodplain definition and flood hazard assessment. In Primer on Natural Hazard Management in Integrated Regional Development Planning; Office of Foreign Disaster Assistance United States Agency for International Development: Washington, DC, USA, 1991. Available online: https://www.oas.org/dsd/publications/Unit/oea66e/ch08.htm#TopOfPage (accessed on 8 March 2020).
- Riggs, H.C. Streamflow Characteristics (Developments in Water Science), 1st ed.; Elsevier: Amsterdam, The Netherlands, 1985; ISBN 0444424806. [Google Scholar]
- Mann, H.B. Nonparametric tests against trend. Econometrica 1945, 13, 245–259. [Google Scholar] [CrossRef]
- Kendall, M.G. Rank Correlation Methods; Charles Griffin & Co. Ltd.: London, UK, 1955; p. 196. [Google Scholar]
- Sen, P.K. Estimates of the regression coefficient based on Kendall’s tau. J. Am. Stat. Assoc. 1968, 63, 1379–1389. [Google Scholar] [CrossRef]
- Salmi, T.; Määttä, A.; Anttila, P.; Ruoho-Airola, T.; Amnell, T. Detecting trends of annual values of atmospheric pollutants by the Mann–Kendall test and Sen’s slope estimates: The Excel template application makesens. Finnish Meteor. Inst. Rep 2002, 31, 35. [Google Scholar]
- Gilbert, R.O. Statistical Methods for Environmental Pollution Monitoring; John Wiley & Sons: Hoboken, NJ, USA, 1987; p. 320. [Google Scholar]
- Van Wesemael, B.; Lettens, S.; Roelandt, C.; van Orshoven, J. Changes in soil carbon stocks from 1960 to 2000 in the main belgian cropland areas. BASE 2004, 8, 133–139. [Google Scholar]
- Vasseur, L.; Catto, N.R. Atlantic Canada. In Impacts to Adaptation: Canada in a Changing Climate; Lemmen, D.S., Warren, F., LaCroix, J.J., Bush, E., Eds.; Government of Canada: Ottawa, ON, Canada, 2008; pp. 119–170. [Google Scholar]
- Armenakis, C.; Du, E.X.; Natesan, S.; Persad, R.A.; Zhang, Y. Flood risk assessment in urban areas based on spatial analytics and social factors. Geosciences 2017, 7, 123. [Google Scholar] [CrossRef]
- Armenakis, C.; Nirupama, N. Estimating spatial disaster risk in urban environments. Geomat. Nat. Hazards Risk 2013, 4, 289–298. [Google Scholar] [CrossRef]
- Armenakis, C.; Nirupama, N. Flood risk mapping for the city of Toronto. Procedia Econ. Financ. 2014, 18, 320–326. [Google Scholar] [CrossRef]
© 2020 by the authors. Licensee MDPI, Basel, Switzerland. This article is an open access article distributed under the terms and conditions of the Creative Commons Attribution (CC BY) license (http://creativecommons.org/licenses/by/4.0/).