A Normal Cloud Model-Based Method for Risk Assessment of Water Inrush and Its Application in a Super-Long Tunnel Constructed by a Tunnel Boring Machine in the Arid Area of Northwest China

Abstract
1. Introduction
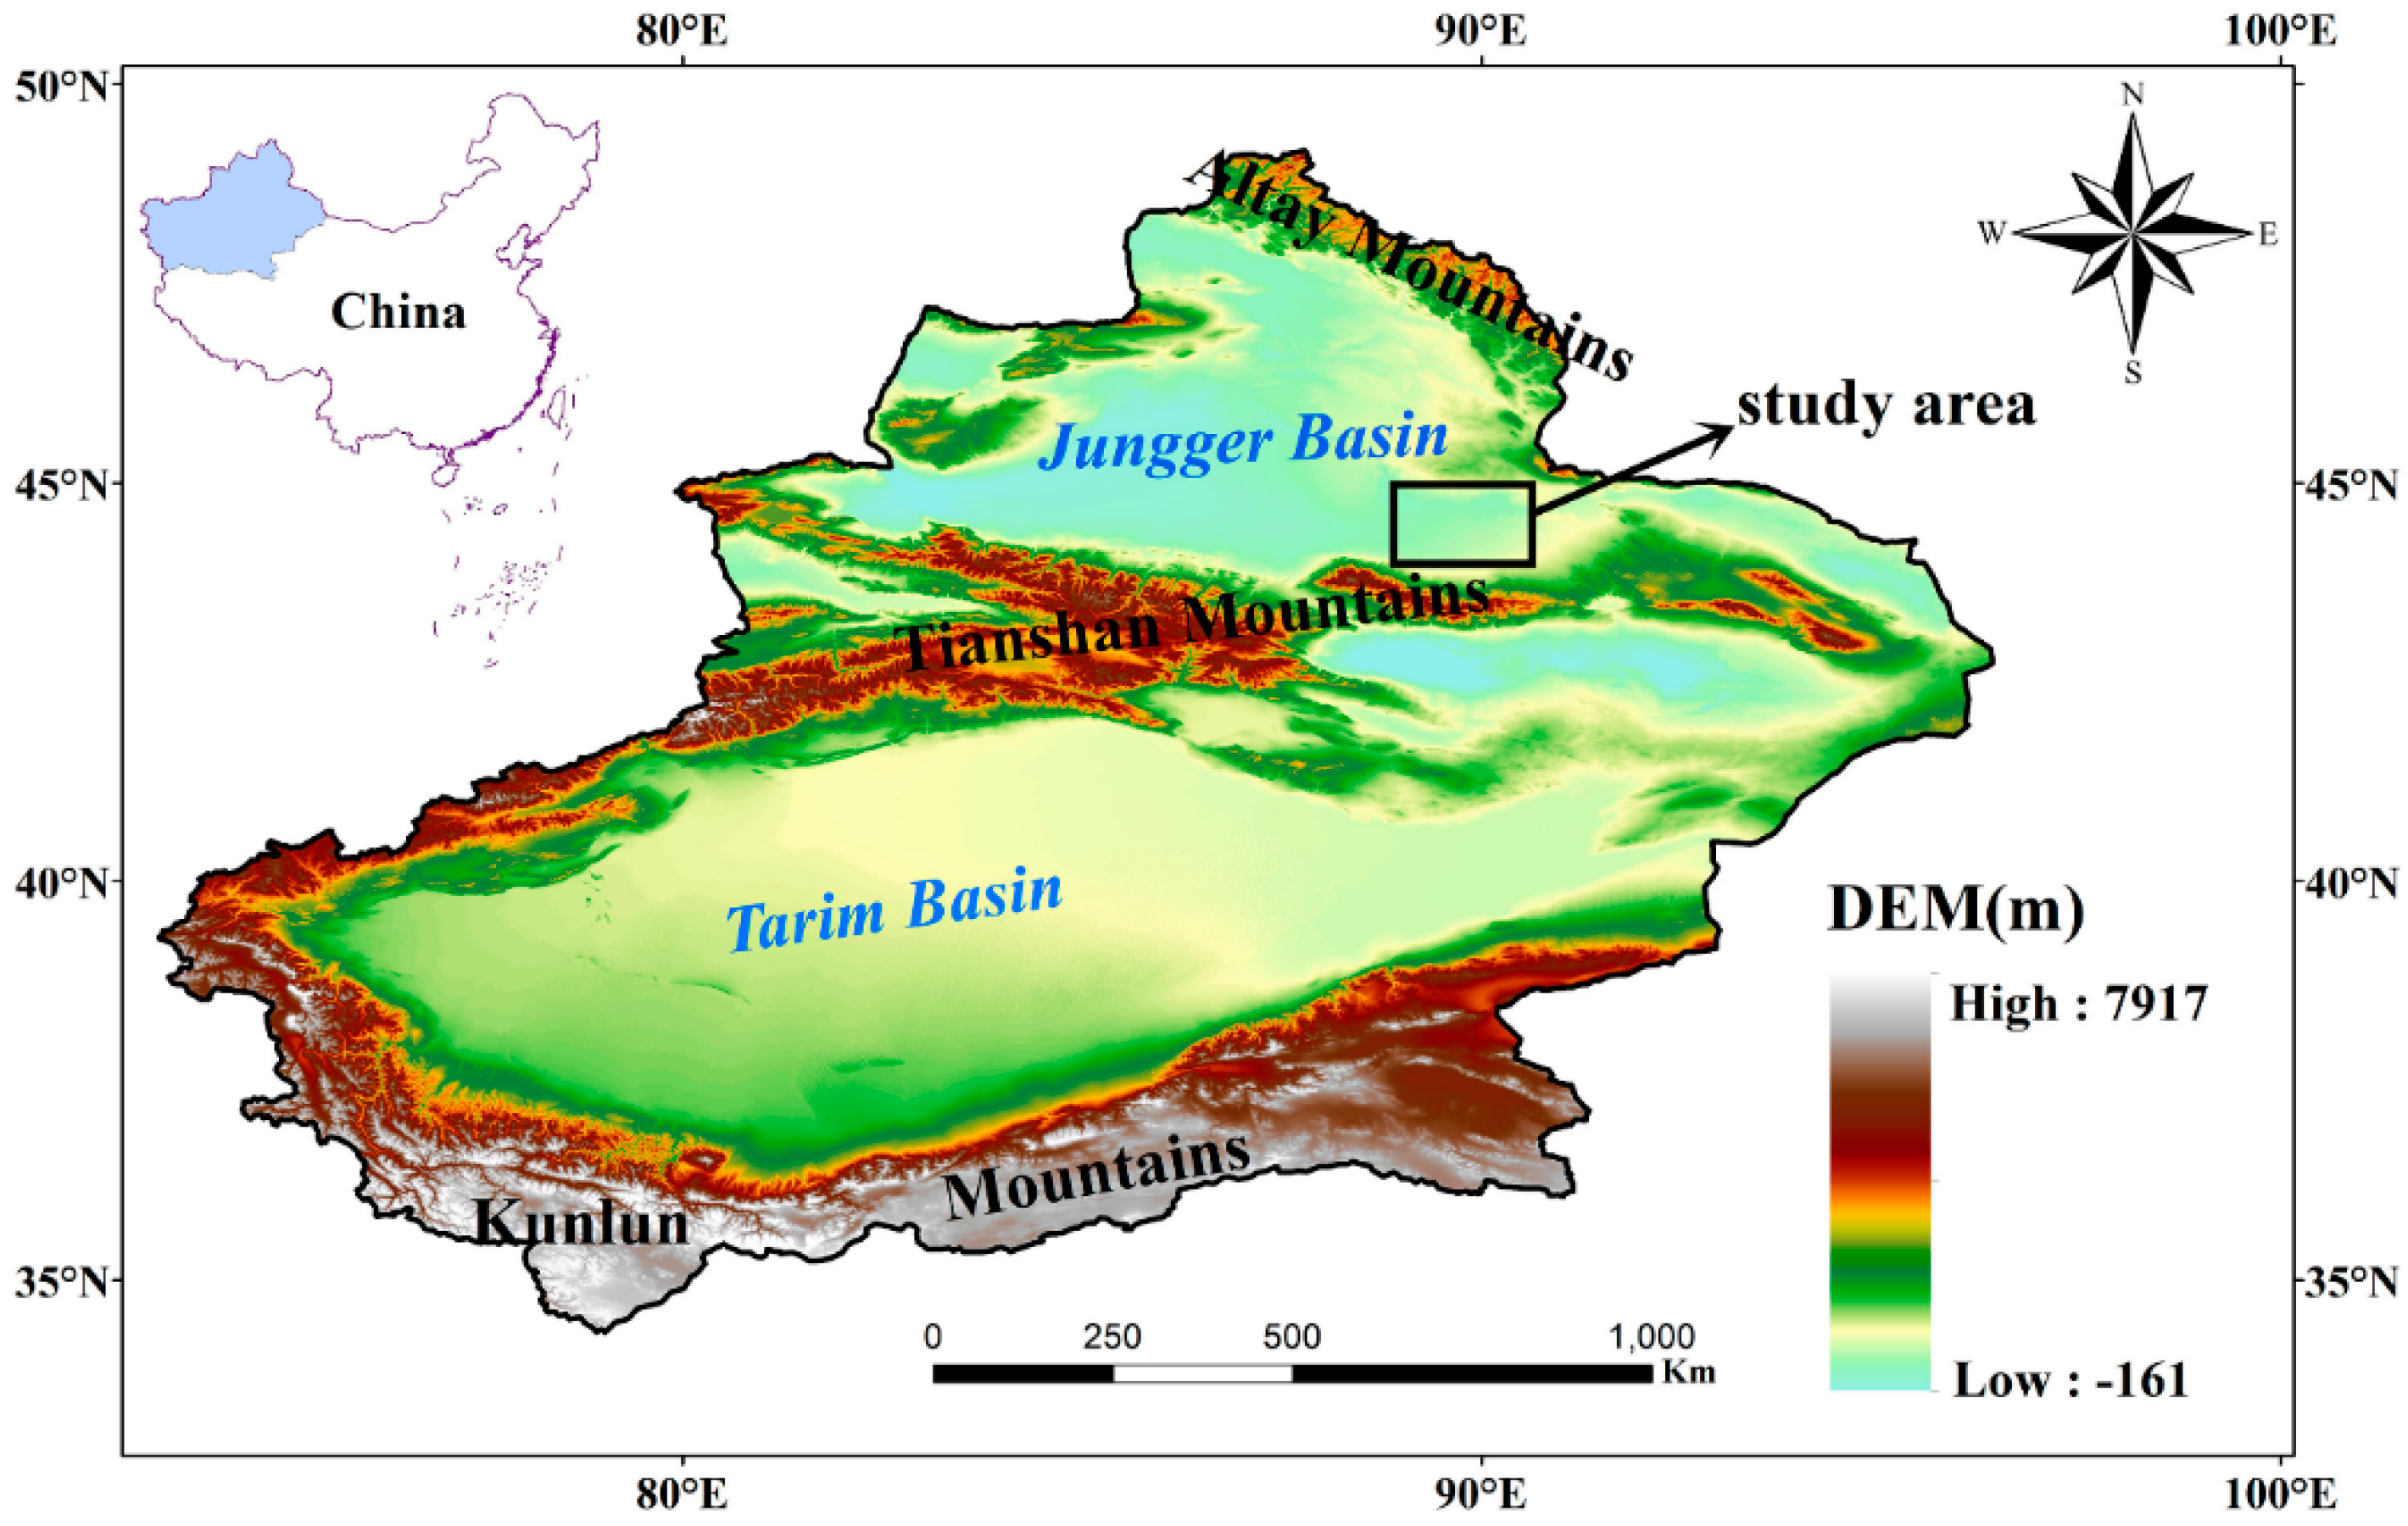
2. Study Area
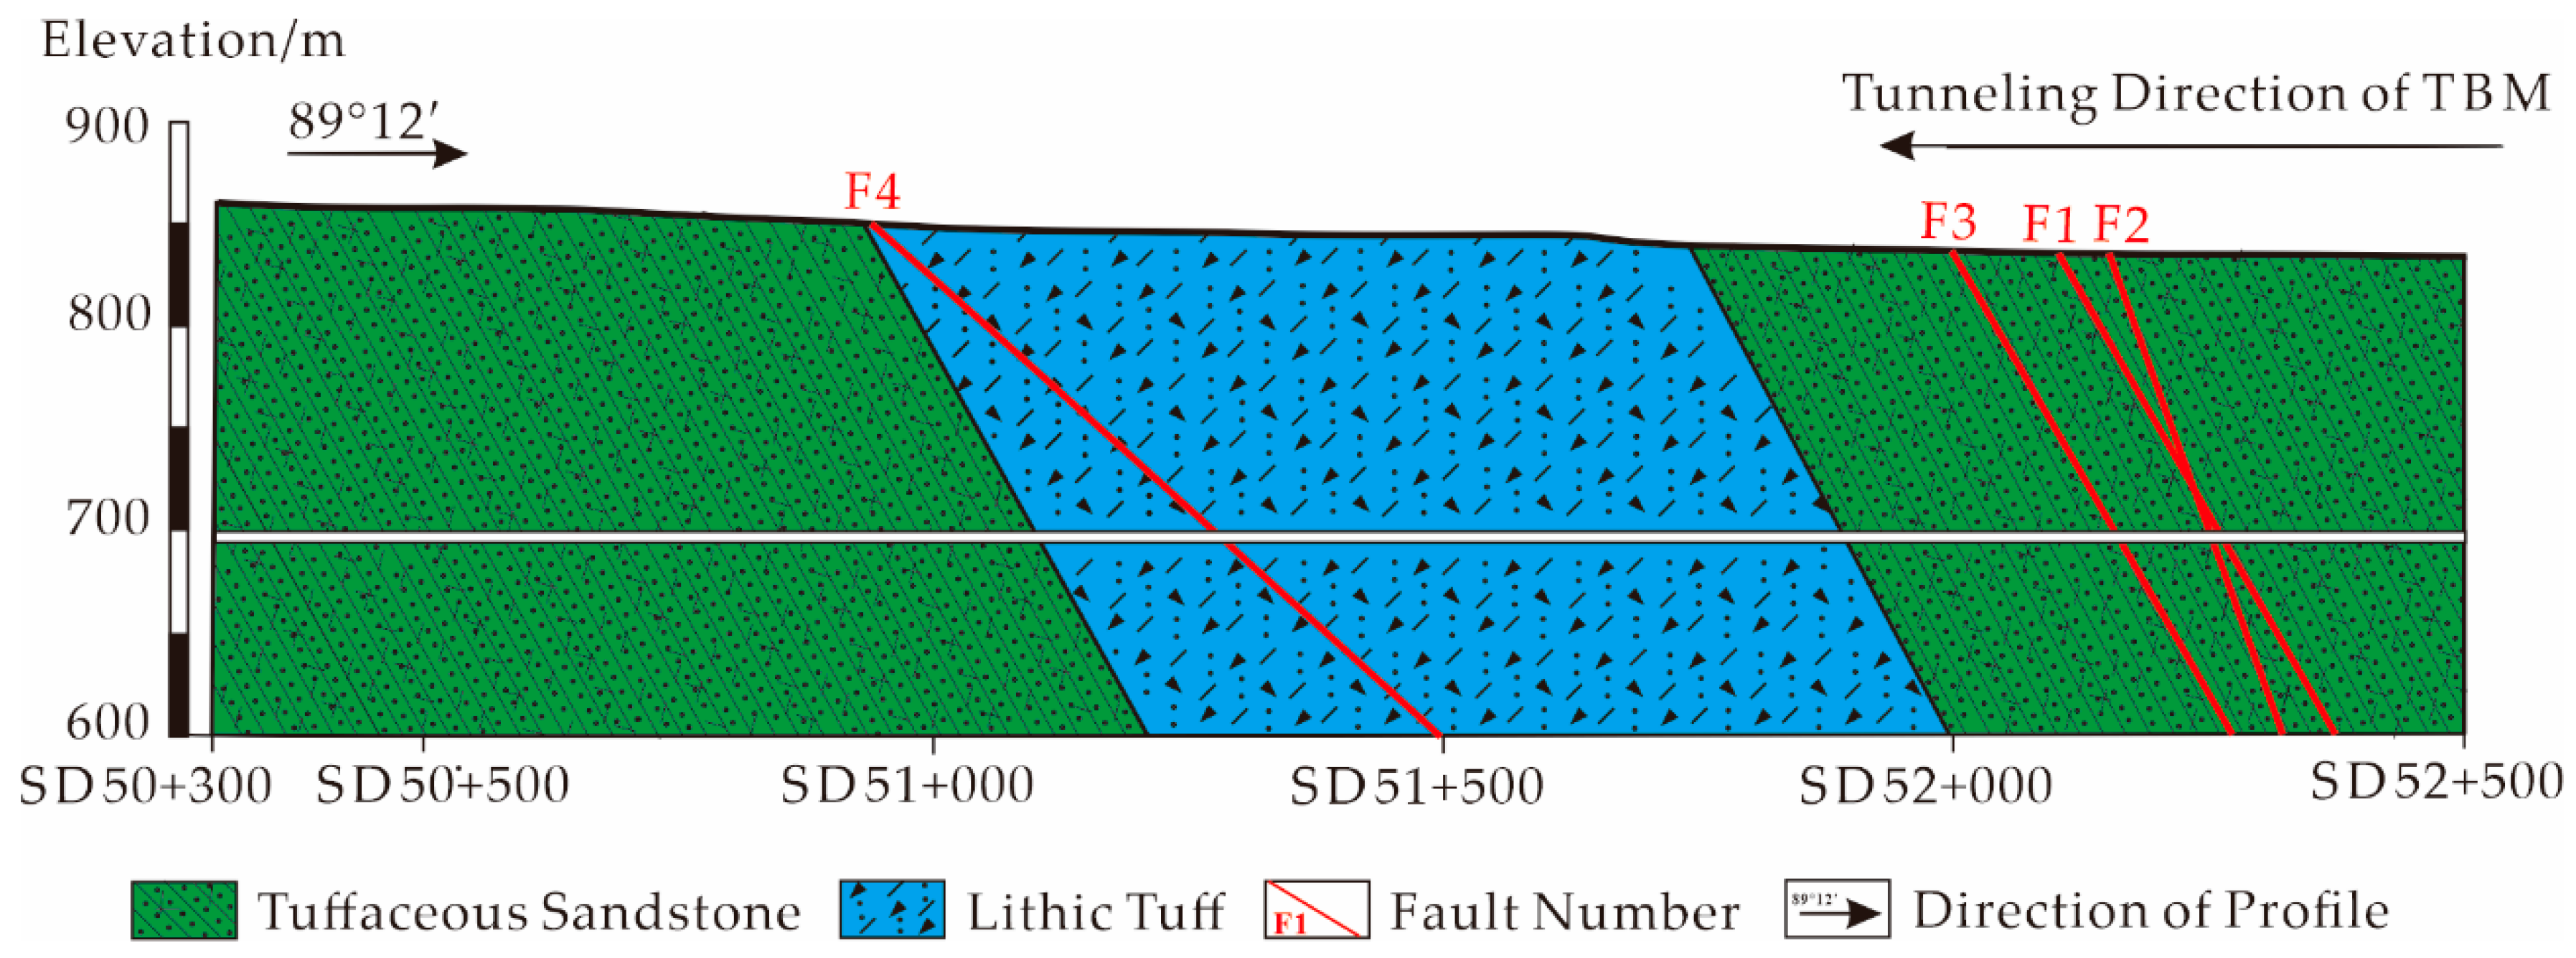
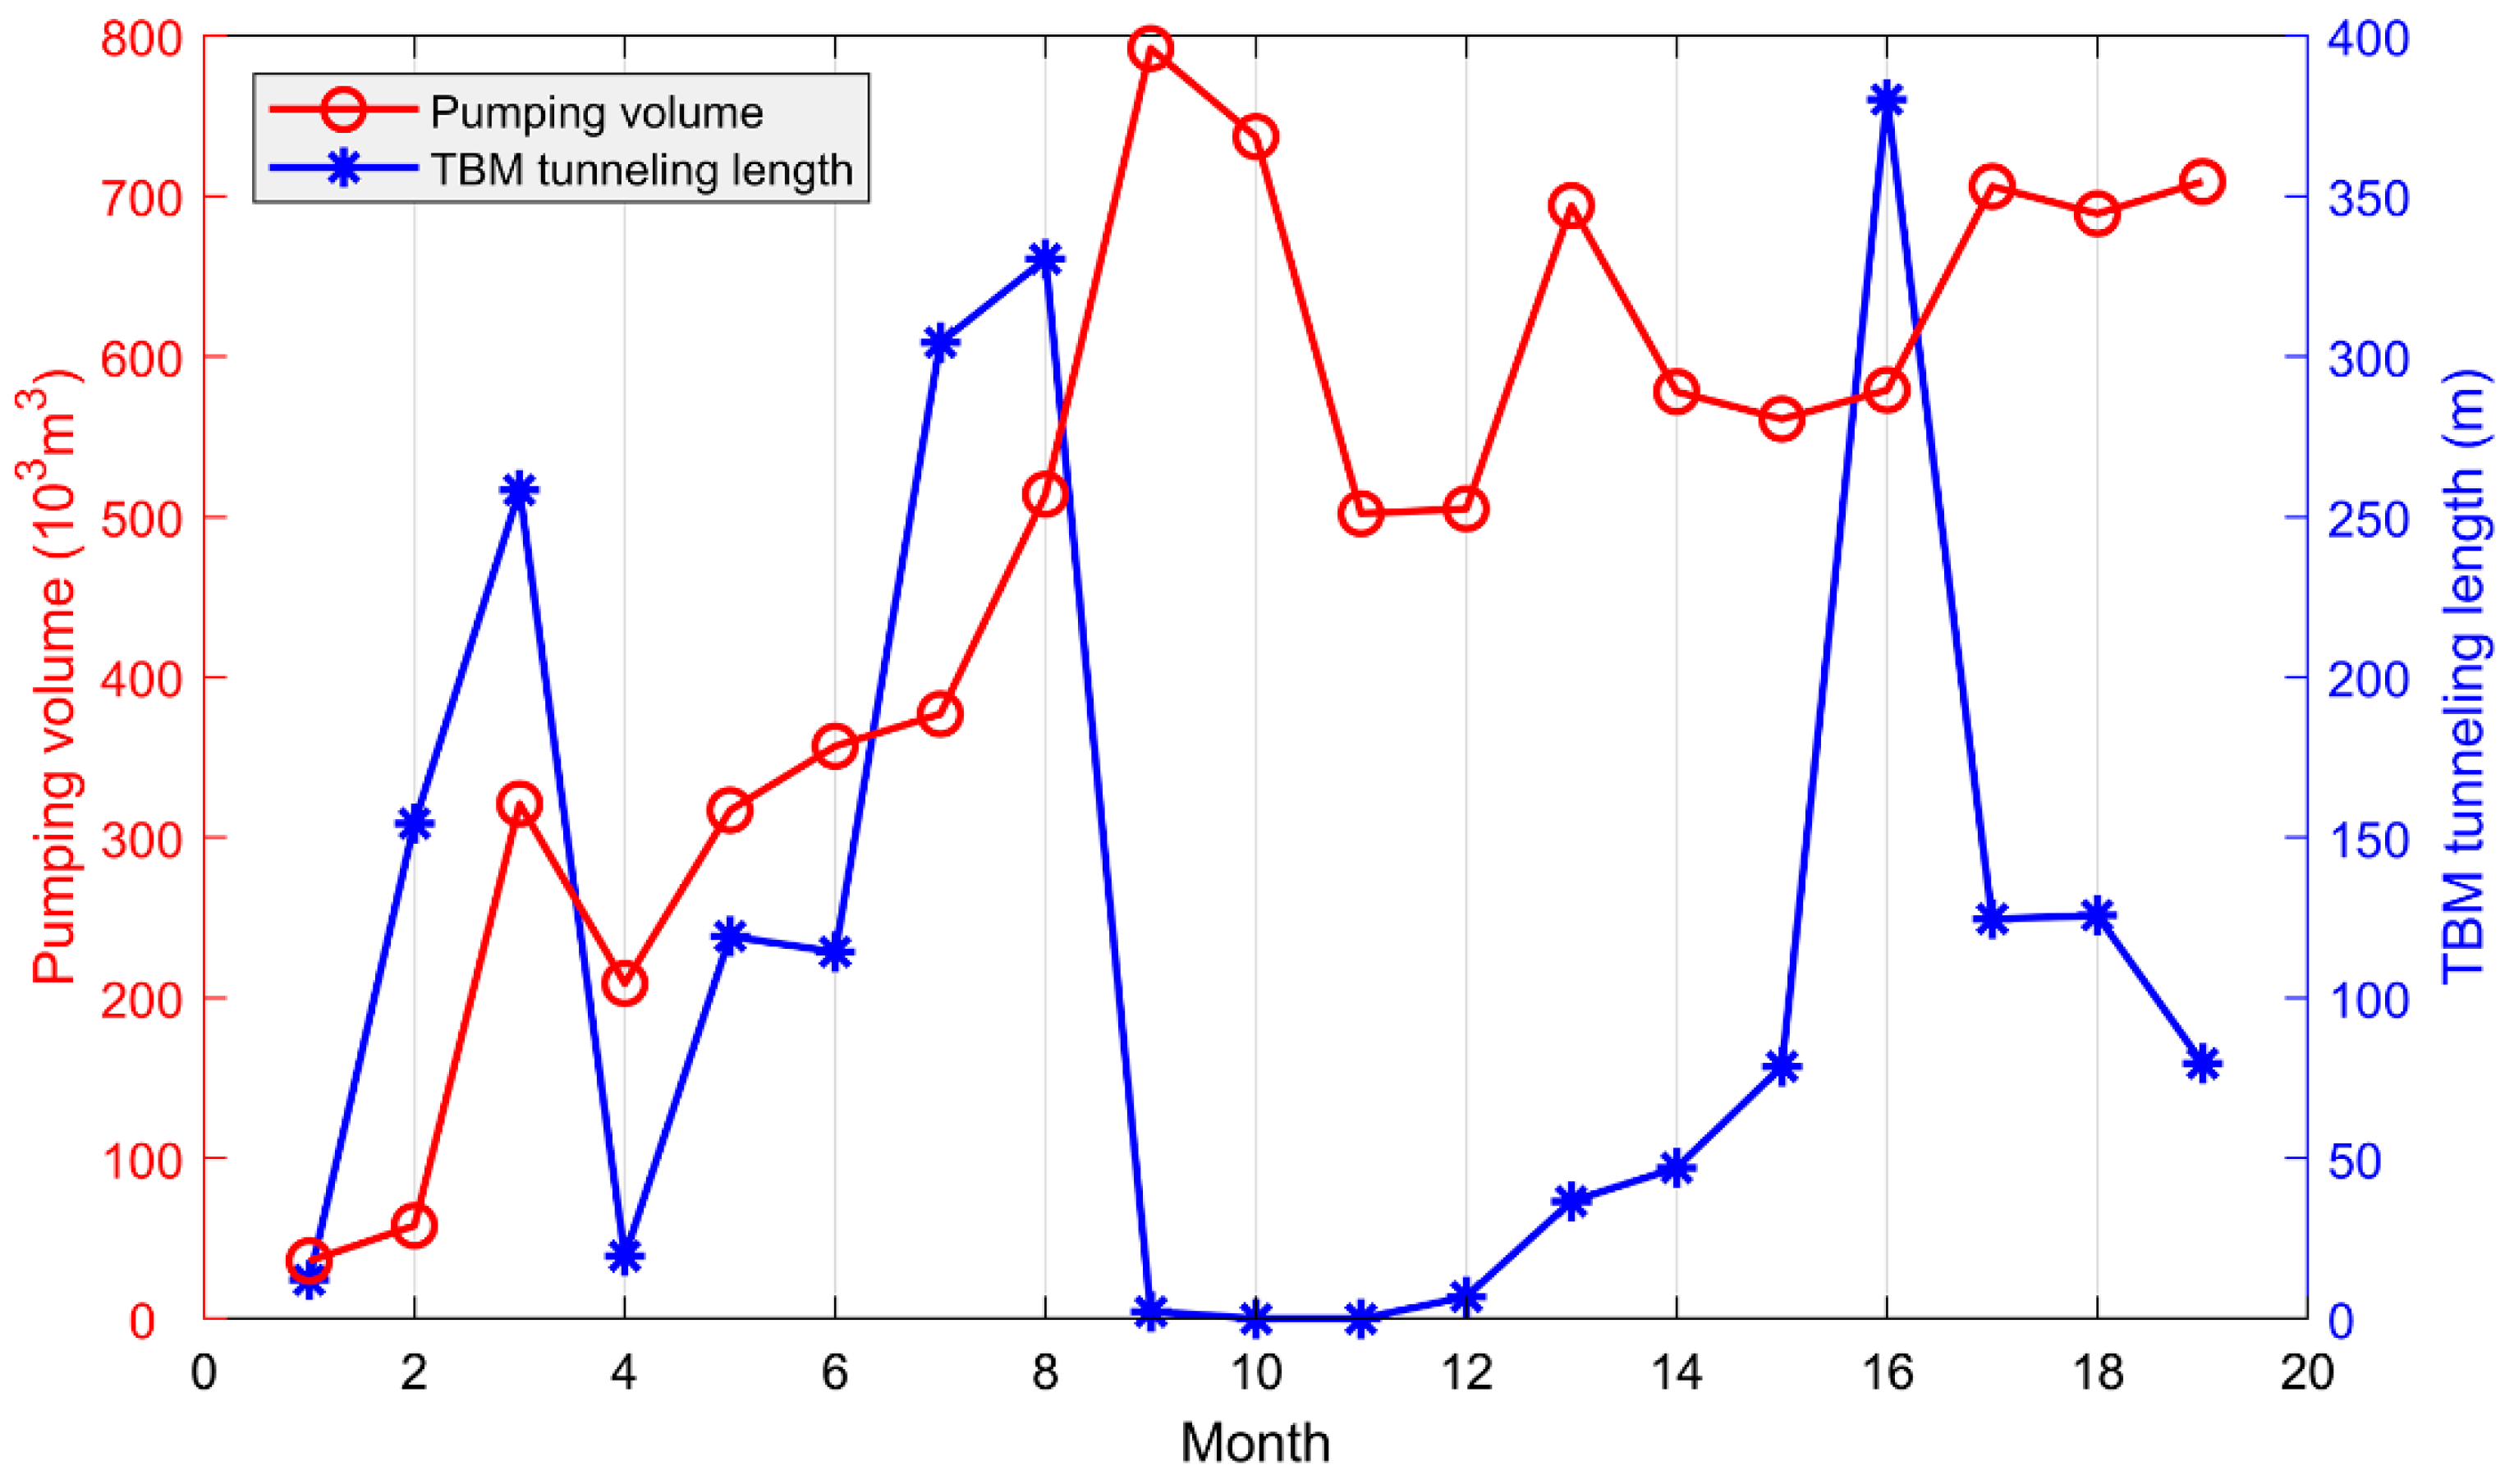
Engineering Background
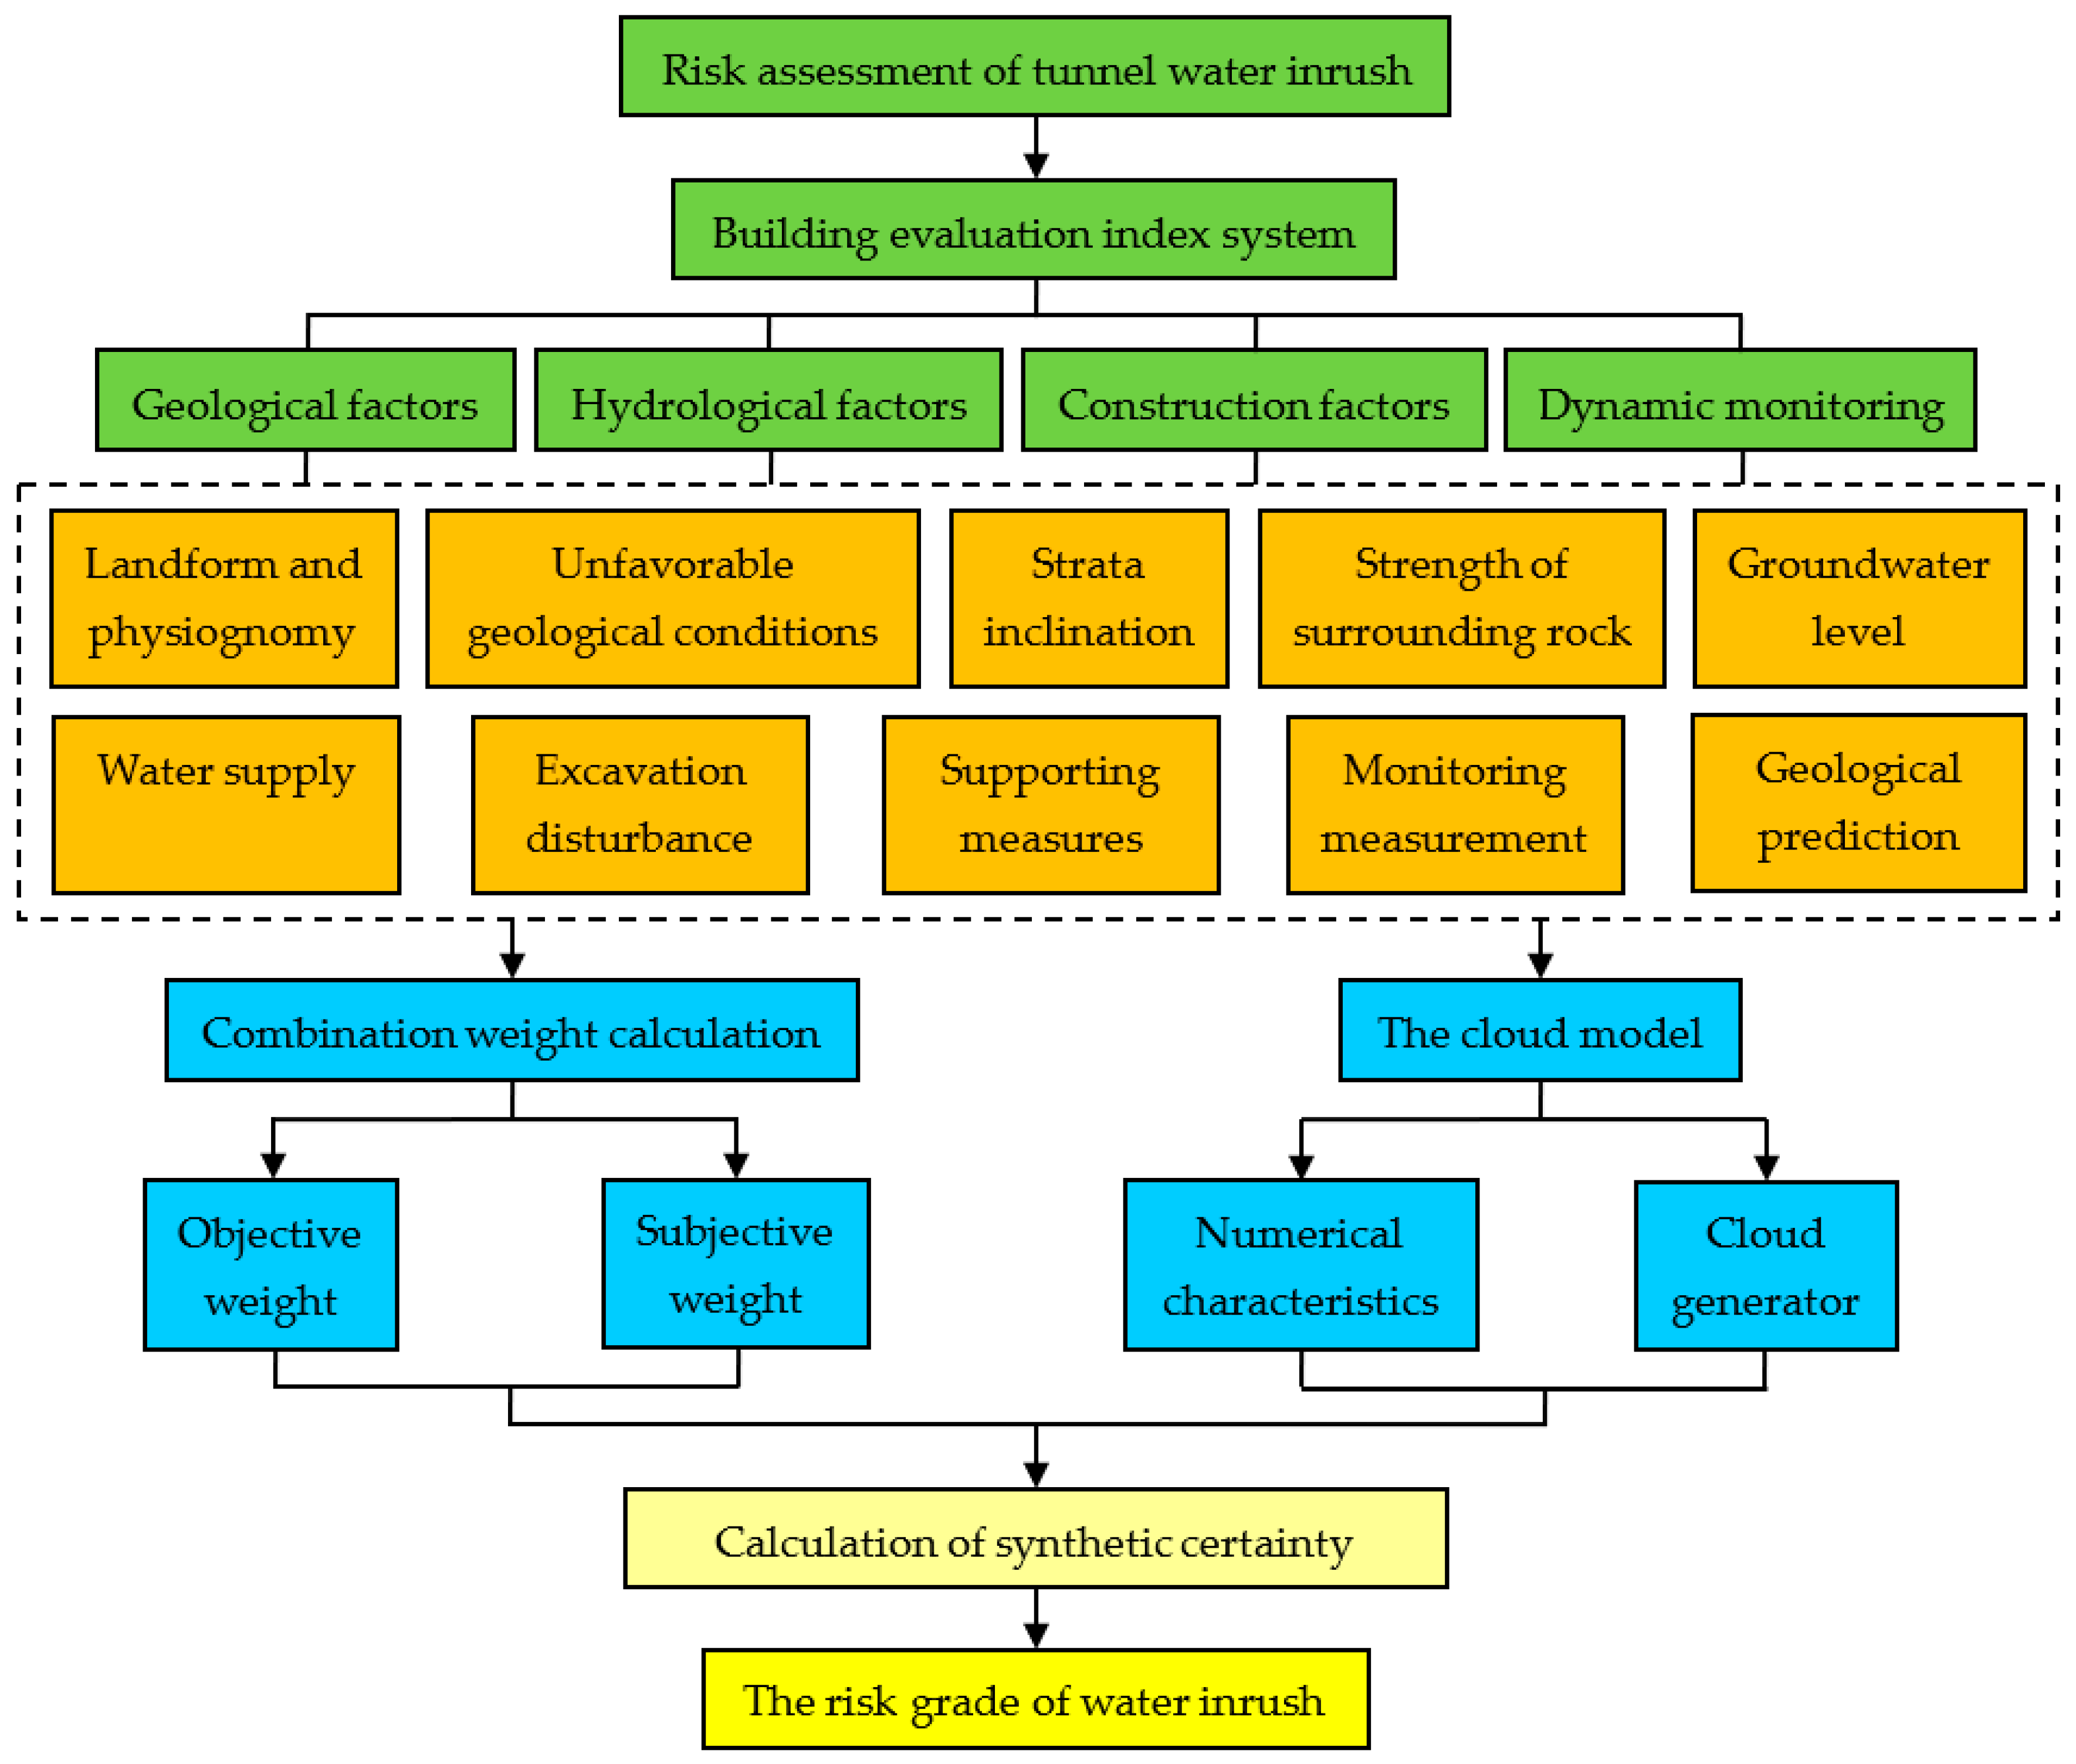
3. Risk Assessment of Water Inrush
3.1. Evaluation Index System
3.1.1. Landform and Physiognomy (C1)
3.1.2. Unfavorable Geological Conditions (C2)
3.1.3. Strata Inclination (C3)
3.1.4. Strength of Surrounding Rock (C4)
3.1.5. Groundwater Level (C5)
3.1.6. Water Supply (C6)
3.1.7. Excavation Disturbance (C7)
3.1.8. Supporting Measure (C8)
3.1.9. Monitoring Measurement (C9)
3.1.10. Geological Prediction (C10)
3.2. The Normal Cloud Model
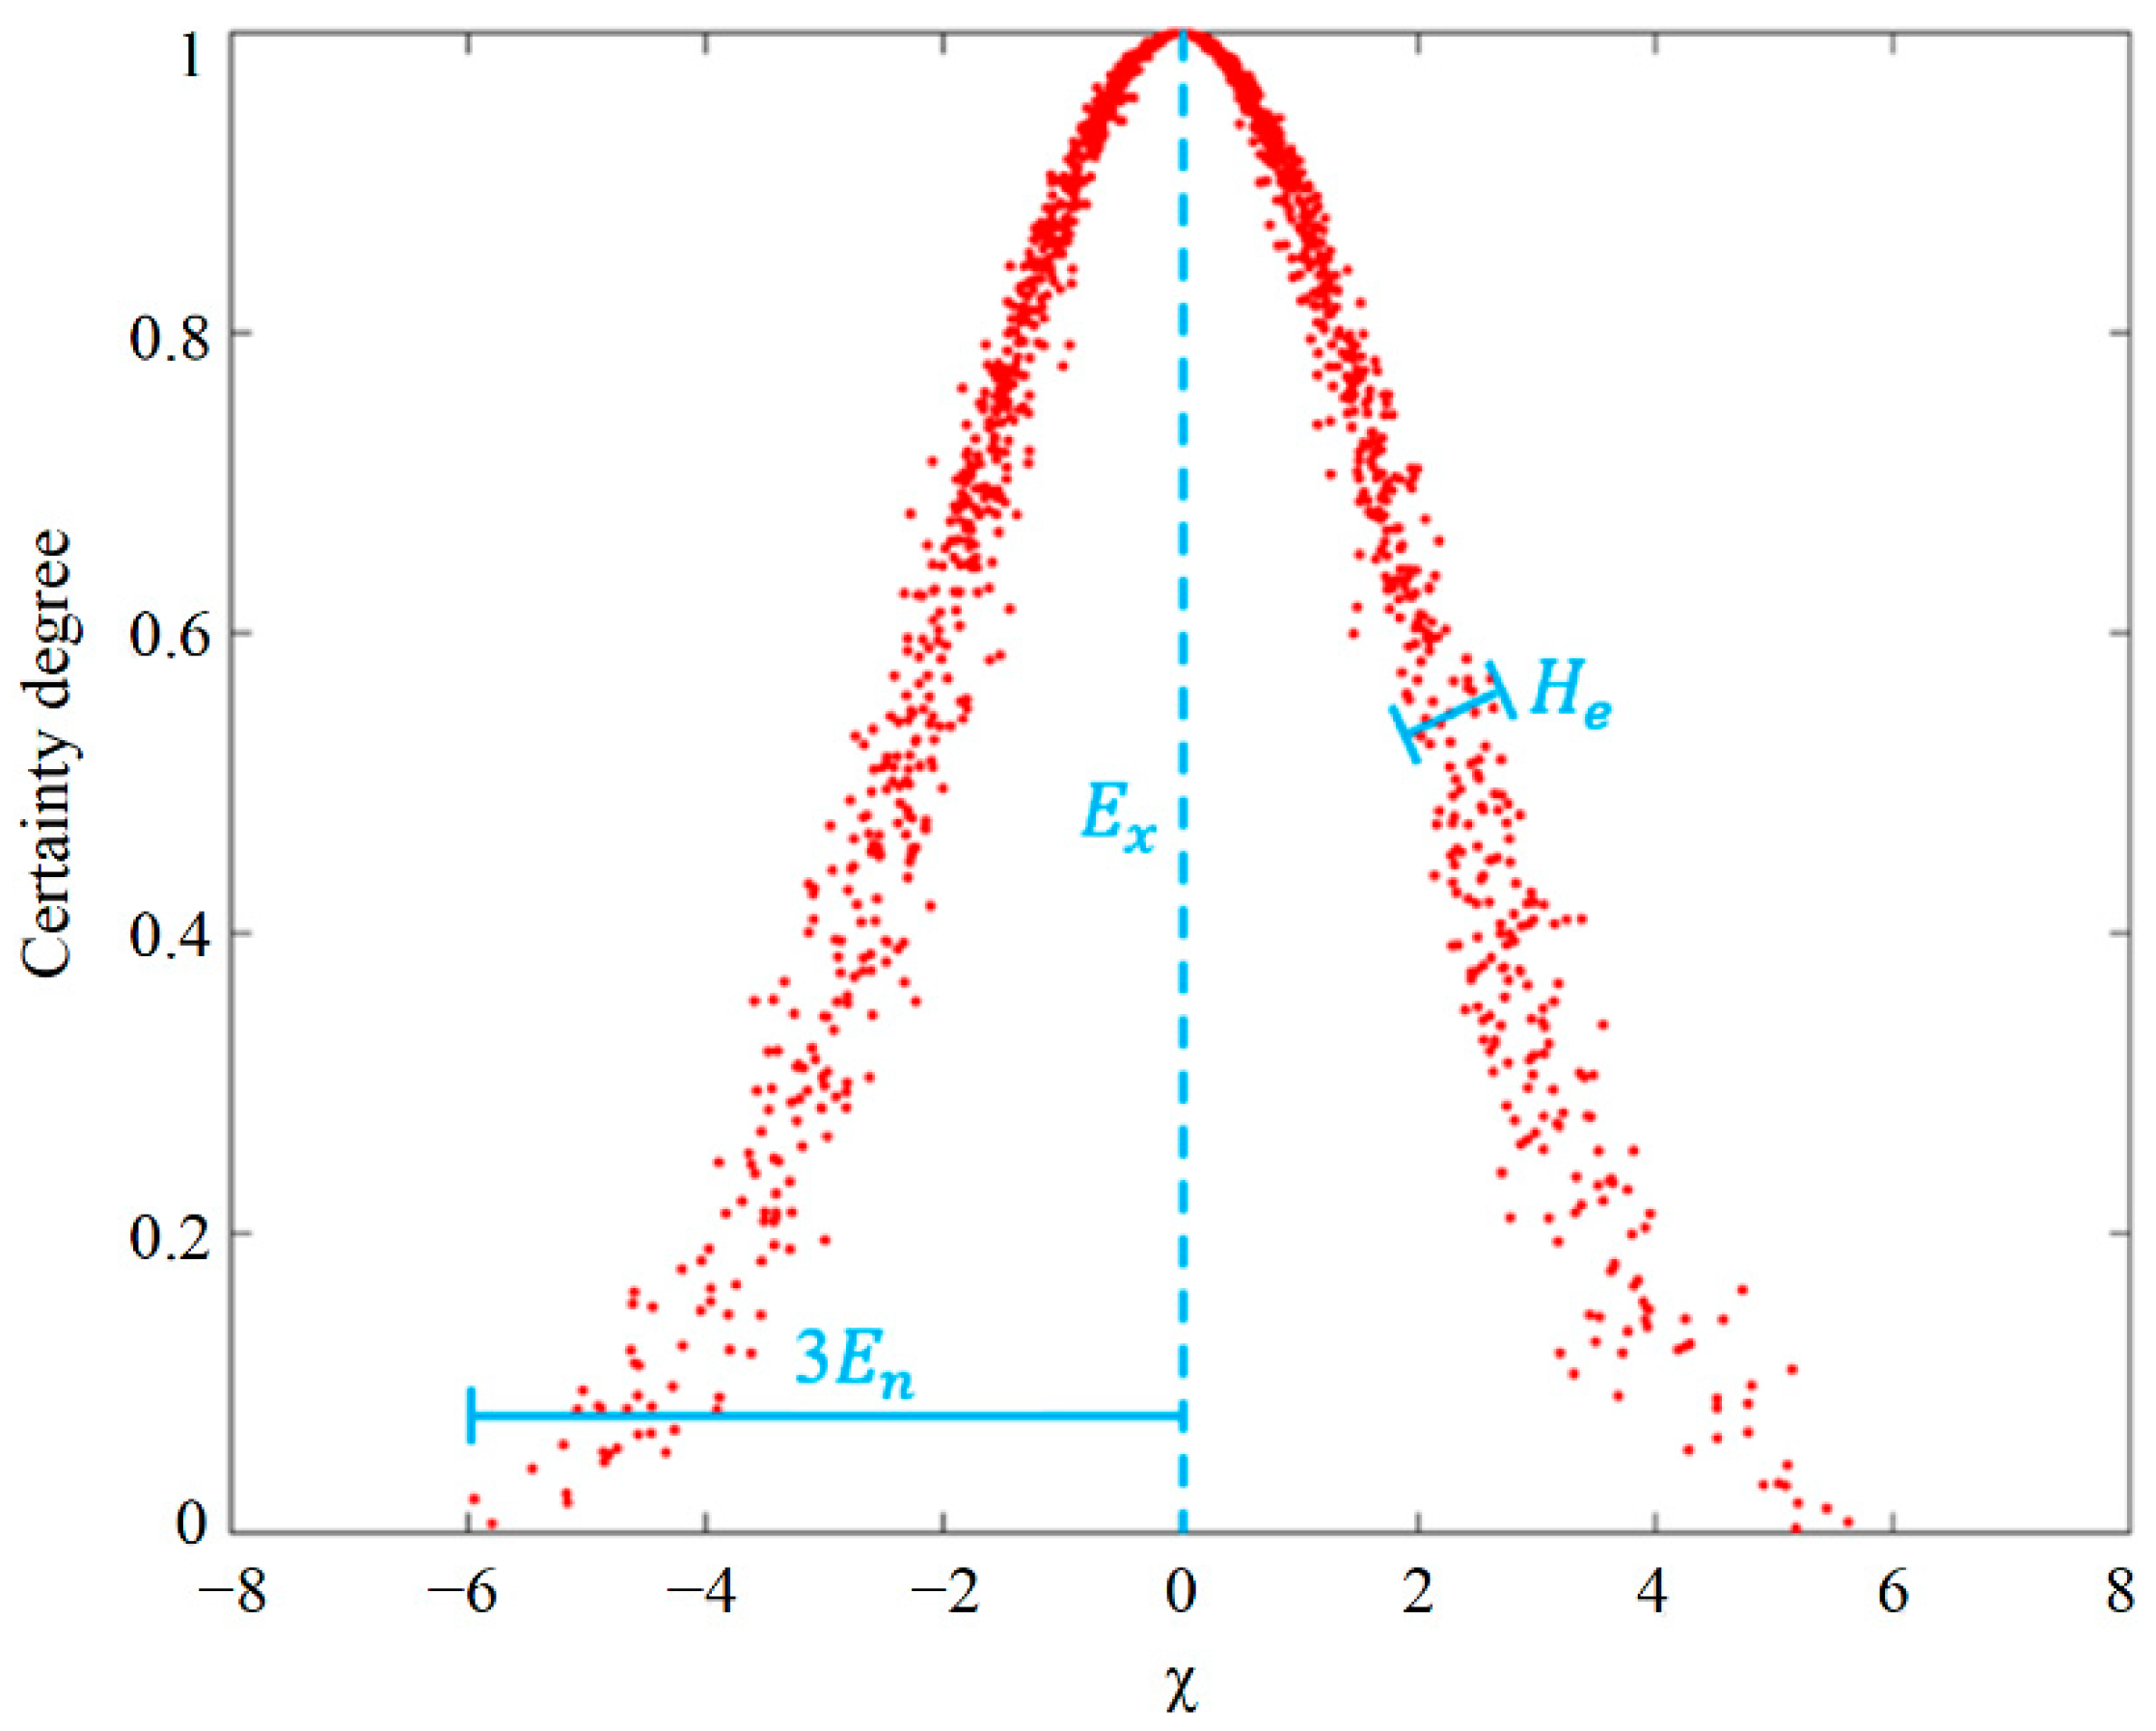
3.2.1. Cloud and Cloud Droplets
3.2.2. Numerical Characteristics of Cloud
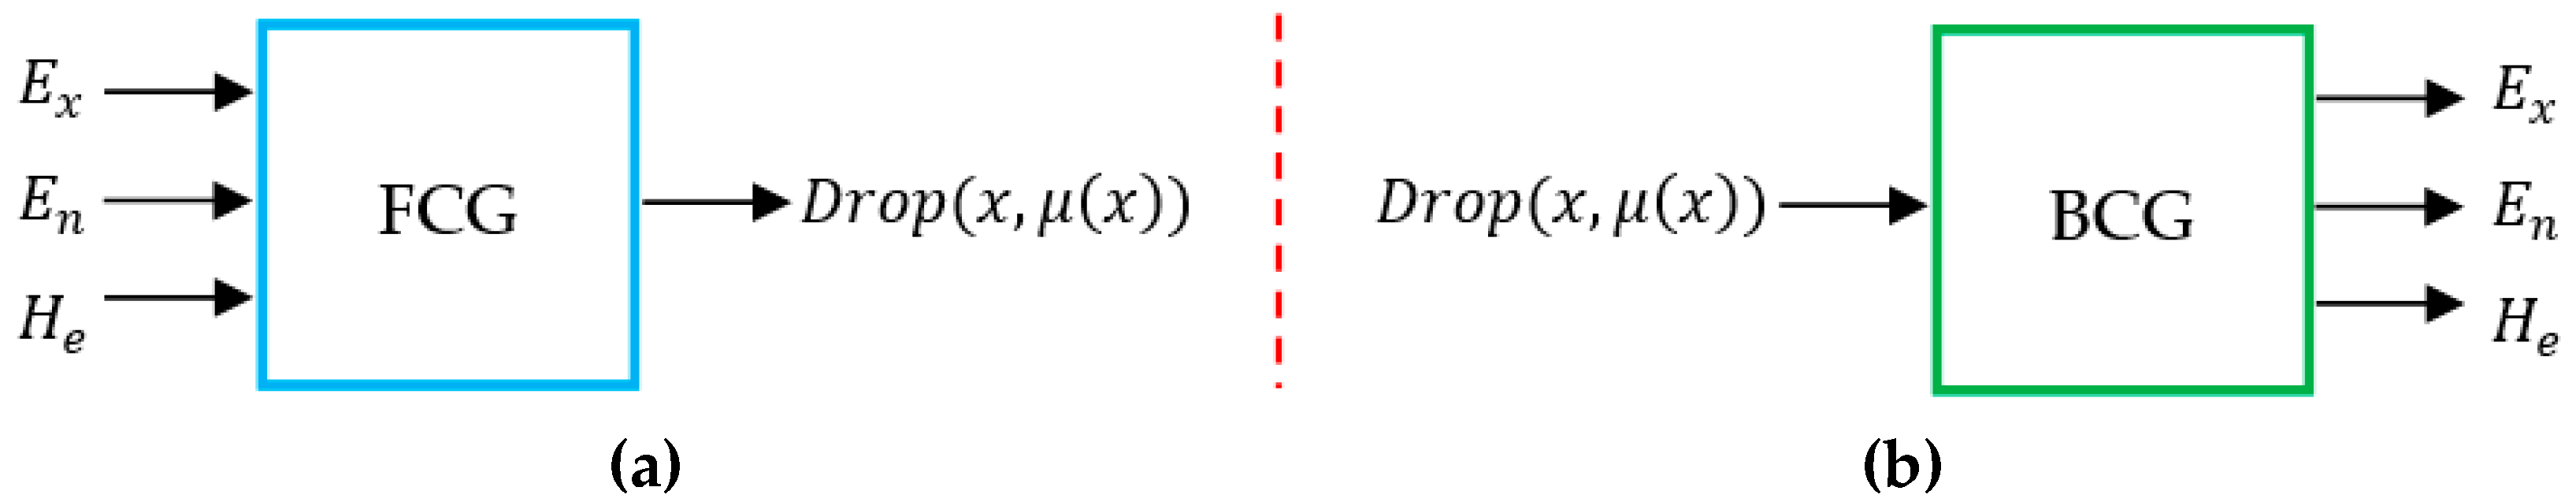
3.2.3. Cloud Generator
- Calculate expectation , entropy , and hyper entropy ;
- Generate a normally distributed random number with expectation and variance : ;
- Generate a normally distributed random number with expectation and variance : ;
- Calculate the certainty degree of , ;
- Generate a cloud drop (), and repeat steps 1 to 5 until N cloud drops are generated.
3.3. Evaluation Index Weight Calculation
3.3.1. Subjective Weight Calculation
3.3.2. Objective Weight Calculation
3.3.3. Combination Weight Calculation
3.4. Calculation of the Synthetic Certainty Degree
4. Results and Discussion
4.1. Weight Calculation
4.1.1. Subjective Weight Calculation Based on AHP
4.1.2. Objective Weight Calculation Based on Entropy
4.1.3. Combination Weight Calculation
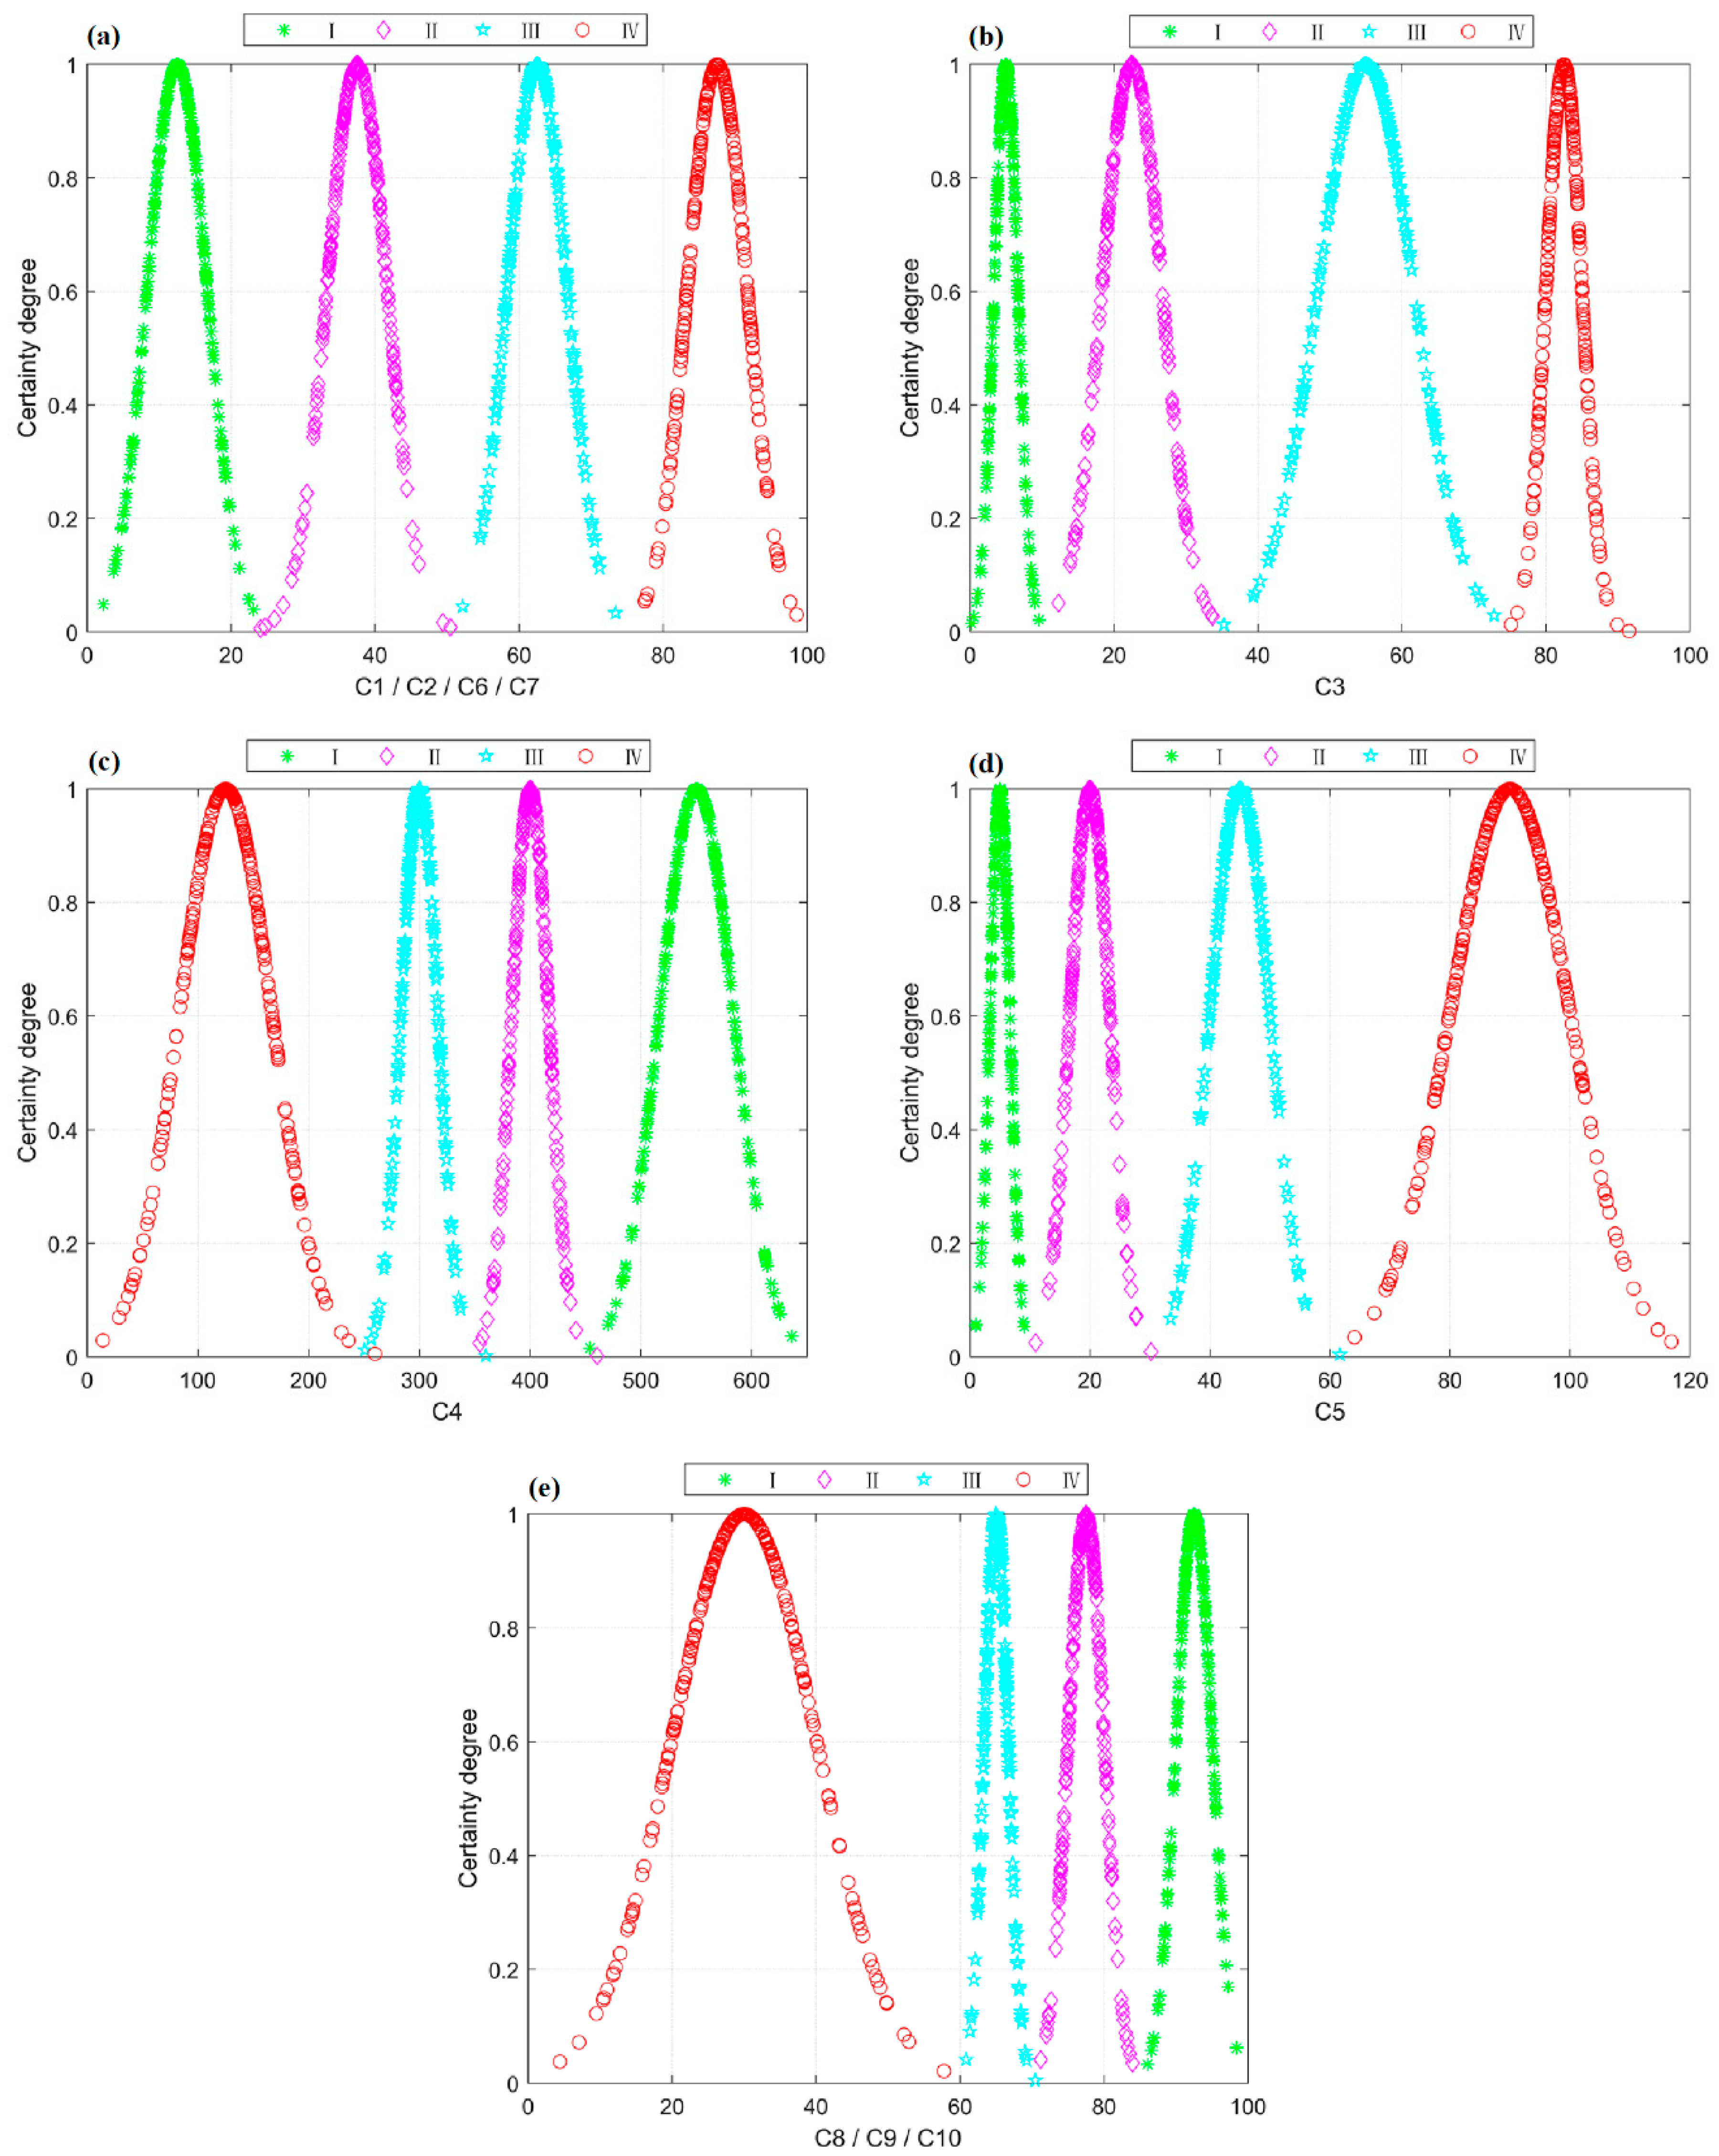
4.2. Cloud Model of Water Inrush
4.3. Risk Level Assessment
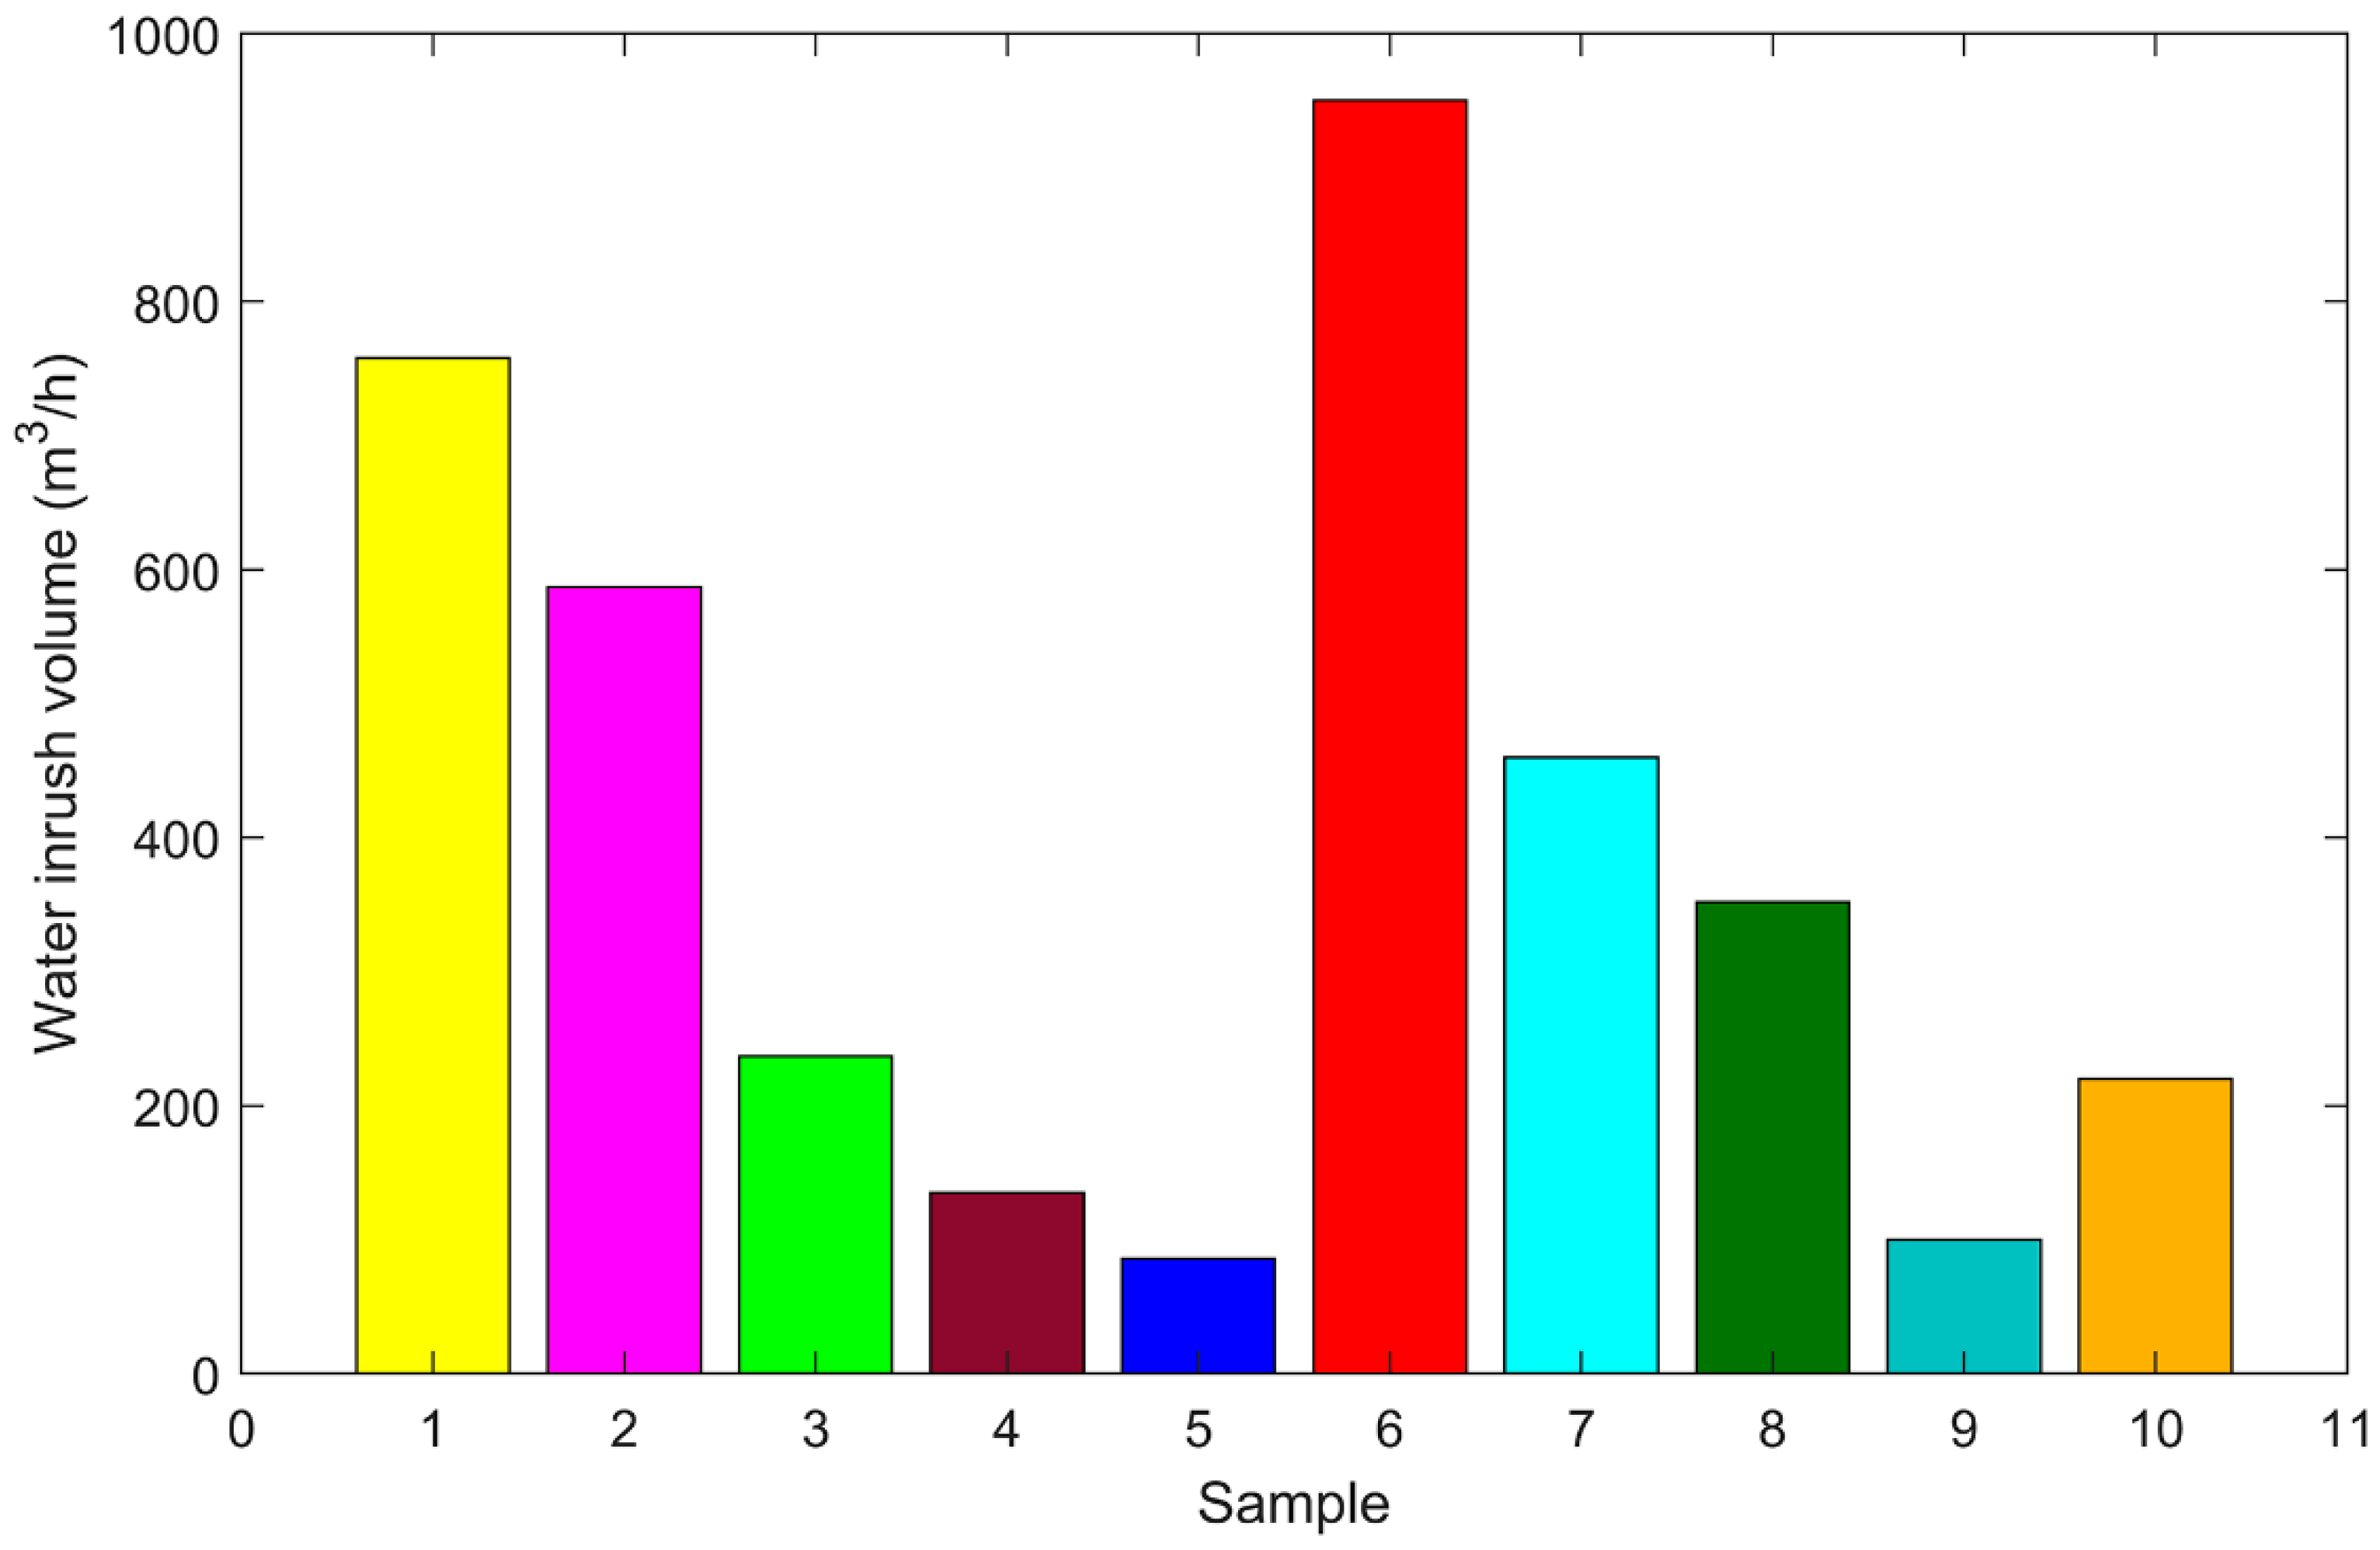
5. Excavation Verification
6. Conclusions
Author Contributions
Funding
Acknowledgments
Conflicts of Interest
References
- Liu, G.; Ma, F.; Liu, G.; Zhao, H.; Guo, J.; Cao, J. Application of Multivariate Statistical Analysis to Identify Water Sources in A Coastal Gold Mine, Shandong, China. Sustainability 2019, 11, 3345. [Google Scholar] [CrossRef]
- Xue, Y.; Liu, Y.; Dang, F.N.; Liu, J. Assessment of the Nonlinear Flow Characteristic of Water Inrush Based on the Brinkman and Forchheimer Seepage Model. Water 2019, 11, 855. [Google Scholar] [CrossRef]
- Wu, H.N.; Shen, S.L.; Liao, S.M.; Yin, Z.Y. Longitudinal structural modelling of shield tunnels considering shearing dislocation between segmental rings. Tunn. Undergr. Sp. Tech. 2015, 50, 317–323. [Google Scholar] [CrossRef]
- Yang, W.M.; Fang, Z.D.; Yang, X.; Shi, S.S. Experimental Study of Influence of Karst Aquifer on the Law of Water Inrush in Tunnels. Water 2018, 10, 1211. [Google Scholar] [CrossRef]
- Shen, S.L.; Wu, H.N.; Cui, Y.J.; Yin, Z.Y. Long-term settlement behavior of metro tunnels in the soft deposits of Shanghai. Tunn. Undergr. Sp. Tech. 2014, 40, 309–323. [Google Scholar] [CrossRef]
- Zhang, Q.S.; Li, S.C.; Ge, Y.H.; Xu, Z.H.; Liu, R.T. Study on Risk Evaluation Method of Water Inrush and Integrated Geological Prediction Technology in High-Risk Karst Tunnel. In Proceedings of the Geohunan International Conference 2011, Hunan, China, 9–11 June 2011. [Google Scholar]
- Lyu, H.M.; Shen, J.S.; Arulrajah, A. Assessment of Geohazards and Preventative Countermeasures Using AHP Incorporated with GIS in Lanzhou, China. Sustainability 2018, 10, 304. [Google Scholar] [CrossRef]
- Zhang, J.; Yang, T. Study of a roof water inrush prediction model in shallow seam mining based on an analytic hierarchy process using a grey relational analysis method. Arab. J. Geosci. 2018, 11, 153. [Google Scholar] [CrossRef]
- Chen, Y.F.; Hong, J.M.; Zheng, H.K.; Li, Y. Evaluation of Groundwater Leakage into a Drainage Tunnel in Jinping-I Arch Dam Foundation in Southwestern China: A Case Study. Rock Mech. Rock Eng. 2016, 49, 961–979. [Google Scholar] [CrossRef]
- Hao, Y.Q.; Rong, X.L.; Ma, L.J.; Fan, P.X.; Lu, H. Uncertainty Analysis on Risk Assessment of Water Inrush in Karst Tunnels. Math Probl. Eng. 2016, 2, 1–11. [Google Scholar] [CrossRef]
- Lyu, H.M.; Sun, W.J.; Shen, S.L. Flood risk assessment in metro systems of megacities using a GIS-based modeling approach. Sci. Total Environ. 2018, 626, 1012–1025. [Google Scholar] [CrossRef]
- Li, X.P.; Li, Y.N. Research on risk assessment system for water inrush in the karst tunnel construction based on GIS: Case study on the diversion tunnel groups of the Jinping II hydropower station. Tunn. Undergr. Sp. Tech. 2014, 40, 182–191. [Google Scholar] [CrossRef]
- Li, S.C.; Zhou, Z.Q.; Li, L.P.; Xu, Z.H.; Zhang, Q.Q.; Shi, S.S. Risk assessment of water inrush in karst tunnels based on attribute synthetic evaluation system. Tunn. Undergr. Sp. Tech. 2013, 38, 50–58. [Google Scholar] [CrossRef]
- Chu, H.D.; Xu, G.L. Risk assessment of water inrush in karst tunnels based on two-class fuzzy comprehensive evaluation method. Arab. J. Geosci. 2017, 10, 179. [Google Scholar] [CrossRef]
- Yang, X.L.; Zhang, S. Risk assessment model of tunnel water inrush based on improved attribute mathematical theory. J. Cent. South Univ. 2018, 25, 379–391. [Google Scholar] [CrossRef]
- Li, T.Z.; Yang, X.L. Risk assessment model for water and mud inrush in deep and long tunnels based on normal grey cloud clustering method. KSCE J. Civ. Eng. 2018, 22, 1991–2001. [Google Scholar] [CrossRef]
- Li, L.P.; Lei, T.; Li, S.C.; Zhang, Q.Q.; Xu, Z.H. Risk assessment of water inrush in karst tunnels and software development. Arab. J. Geosci. 2015, 8, 1843–1854. [Google Scholar] [CrossRef]
- Li, S.C.; Wu, J. A multi-factor comprehensive risk assessment method of karst tunnels and its engineering application. Bull. Eng. Geol. Environ. 2019, 78, 1761–1776. [Google Scholar] [CrossRef]
- Li, S.C.; Wu, J.; Xu, Z.H. Unascertained Measure Model of Water and Mud Inrush Risk Evaluation in Karst Tunnels and Its Engineering Application. KSCE J. Civ. Eng. 2017, 4, 1170–1182. [Google Scholar] [CrossRef]
- Wang, J.; Li, S.C.; Li, L.P.; Lin, P.; Xu, Z.H. Attribute recognition model for risk assessment of water inrush. Bull. Eng. Geol. Environ. 2019, 78, 1057–1071. [Google Scholar] [CrossRef]
- Moon, J.; Fernandez, G. Effect of excavation-induced groundwater level drawdown on tunnel inflow in a jointed rock mass. Eng. Geol. 2010, 110, 33–42. [Google Scholar] [CrossRef]
- Shin, J.H. Analytical and combined numerical methods evaluating pore water pressure on tunnels. Geotechnique 2010, 60, 141–145. [Google Scholar] [CrossRef]
- Wang, Y.C.; Jing, H.W.; Yu, L.Y.; Su, H.J. Set pair analysis for risk assessment of water inrush in karst tunnels. Bull. Eng. Geol. Environ. 2017, 76, 1199–1207. [Google Scholar] [CrossRef]
- Wang, X.T.; Li, S.C.; Xu, Z.H.; Lin, P. Analysis of Factors Influencing Floor Water Inrush in Coal Mines: A Nonlinear Fuzzy Interval Assessment Method. Mine Water Environ. 2019, 38, 81–92. [Google Scholar] [CrossRef]
- Xu, Z.H.; Li, S.C.; Li, L.P. Risk assessment of water or mud inrush of karst tunnels based on analytic hierarchy process. Rock Soil Mech. 2011, 32, 1757–1766. [Google Scholar]
- Li, D.Y.; Meng, H.J.; Shi, X.M. Membership clouds and membership cloud generators. J. Comput. Res. Dev. 1995, 6, 15–20. [Google Scholar]
- Li, D.Y.; Liu, C.G.; Gan, W.Y. A new cognitive model: Cloud model. Int. J. Intell. Syst. 2009, 24, 357–375. [Google Scholar] [CrossRef]
- Wang, J.C.; Guo, J. Research on Rock Mass Quality Classification Based on An Improved Rough Set-Cloud Model. IEEE Access 2019, 7, 123710–123724. [Google Scholar] [CrossRef]
- Guan, X.J.; Qin, H.D.; Meng, Y.; Wu, Z.N. Comprehensive evaluation of water-use efficiency in China’s Huai river basin using a cloud-compound fuzzy matter element-entropy combined model. J. Earth Syst. Sci. 2019, 128, 179. [Google Scholar] [CrossRef]
- Yang, S.M.; Han, X.Q.; Cao, B.; Li, B.; Yan, F. Cloud-Model-Based Method for Risk Assessment of Mountain Torrent Disasters. Water 2018, 10, 830. [Google Scholar] [CrossRef]
- Wang, G.Y.; Xu, C.L.; Li, D.Y. Generic normal cloud model. Inf. Sci. 2014, 280, 1–15. [Google Scholar] [CrossRef]
- Liu, Z.B.; Shao, J.F.; Xu, W.Y.; Xu, F. Comprehensive Stability Evaluation of Rock Slope Using the Cloud Model-Based Approach. Rock Mech. Rock Eng. 2014, 47, 2239–2252. [Google Scholar] [CrossRef]
- Wang, X.T.; Li, S.C.; Ma, X.Y.; Xue, Y.G. Risk Assessment of Rockfall Hazards in a Tunnel Portal Section Based on Normal Cloud Model. Pol. J. Environ. Stud. 2017, 26, 2295–2306. [Google Scholar] [CrossRef]
- Li, X.C.; Zhong, D.H.; Ren, B.Y. Study on evaluation of rock mass groutability of dam foundation based on Fuzzy RES-cloud model. J. Hydraul. Eng. 2017, 48, 1311–1323. [Google Scholar] [CrossRef]
- Deng, W.H.; Wang, G.Y.; Zhang, X.R. A novel hybrid water quality time series prediction method based on cloud model and fuzzy forecasting. Chemom. Intell. Lab. Syst. 2015, 149, 39–49. [Google Scholar] [CrossRef]
- Yang, X.J.; Yan, L.L.; Peng, H.; Gao, X.D. Encoding words into Cloud models from interval-valued data via fuzzy statistics and membership function fitting. Knowl. Based Syst. 2014, 55, 114–124. [Google Scholar] [CrossRef]
- Wang, Y.C.; Yin, X.; Jing, H.W.; Liu, R.C.; Su, H.J. A novel cloud model for risk analysis of water inrush in karst tunnels. Environ. Earth Sci. 2016, 75, 1450. [Google Scholar] [CrossRef]
- Lin, Y.; Zhou, K.; Li, J. Application of cloud model in rock burst prediction and performance comparison with three machine learning algorithms. IEEE Access 2018, 6, 30958–30968. [Google Scholar] [CrossRef]
- Zhang, T.; Yan, L.S.; Yang, Y. Trust evaluation method for clustered wireless sensor networks based on cloud model. Wirel. Netw. 2018, 24, 777–797. [Google Scholar] [CrossRef]
- Saaty, T.L. How to Make a Decision: The Analytic Hierarchy Process. Inf. J. Appl. Anal. 1994, 24, 19–43. [Google Scholar] [CrossRef]
- Saaty, T.L. Decision-making with the AHP: Why is the principal eigenvector necessary. Eur. J. Oper. Res. 2003, 145, 85–91. [Google Scholar] [CrossRef]
- Long, Y.; Yang, Y.; Lei, X.; Tian, Y.; Li, Y. Integrated Assessment Method of Emergency Plan for Sudden Water Pollution Accidents Based on Improved TOPSIS, Shannon Entropy and a Coordinated Development Degree Model. Sustainability 2019, 11, 510. [Google Scholar] [CrossRef]
- Won, K.; Chung, E.-S.; Choi, S.-U. Parametric Assessment of Water Use Vulnerability Variations Using SWAT and Fuzzy TOPSIS Coupled with Entropy. Sustainability 2015, 7, 12052–12070. [Google Scholar] [CrossRef]
- Li, Z.; Liu, W.B.; Dong, F. Research on Capability Evaluation of Equipment Support Based on Comprehensive Weighting Method and Cloud Model. Command Control Simul. 2018, 40, 69–74. [Google Scholar] [CrossRef]
- Xu, C.; Liu, X.L.; Wang, E.Z.; Zheng, Y.L.; Wang, S.J. Rockburst prediction and classification based on the ideal-point method of information theory. Tunn. Undergr. Sp. Tech. 2018, 81, 382–390. [Google Scholar] [CrossRef]
- Tahmasebi, S.; Moradi, P.; Ghodsi, S. An ideal point based many-objective optimization for community detection of complex networks. Inf. Sci. 2019, 502, 125–145. [Google Scholar] [CrossRef]
- Chen, L.Y.; Deng, Y. A new failure mode and effects analysis model using Dempster-Shafer evidence theory and grey relational projection method. Eng. Appl. Artif. Intel. 2018, 76, 13–20. [Google Scholar] [CrossRef]


| Assessment Indices | I (Low Risk) | II (Medium Risk) | III (High Risk) | IV (Higher Risk) |
|---|---|---|---|---|
| Landform and physiognomy (C1) | <25 | 25~50 | 50~75 | 75~100 |
| Unfavorable geological conditions (C2) | <25 | 25~50 | 50~75 | 75~100 |
| Strata inclination (C3) | <10 | 10~35 | 35~75 | 75~90 |
| Strength of surrounding rock (C4) | (BQ) > 450 | 350 < (BQ) ≤ 450 | 250 < (BQ) ≤ 350 | (BQ) ≤ 250 |
| Groundwater level (C5) | <10 | 10~30 | 30~60 | >60 |
| Water supply (C6) | <25 | 25~50 | 50~75 | 75~100 |
| Excavation disturbance (C7) | <25 | 25~50 | 50~75 | 75~100 |
| Supporting measures (C8) | 85~100 | 70~85 | 60~70 | <60 |
| Monitoring measurement (C9) | 85~100 | 70~85 | 60~70 | <60 |
| Geological prediction (C10) | 85~100 | 70~85 | 60~70 | <60 |
| Two-by-Two Comparison | |
|---|---|
| 1 | and are equally important |
| 3 | is slightly more important than |
| 5 | is more important than |
| 7 | is substantially more important than |
| 9 | is absolutely more important than |
| 2, 4, 6, 8 | the middle value of two adjacent judgements |
| Explanation | When and are compared, the value is the reciprocal of and scalar. |
| n | 1 | 2 | 3 | 4 | 5 | 6 | 7 | 8 | 9 | 10 |
|---|---|---|---|---|---|---|---|---|---|---|
| 0 | 0 | 0.58 | 0.90 | 1.12 | 1.24 | 1.32 | 1.41 | 1.45 | 1.49 |
| Sample | C1 | C2 | C3 | C4 | C5 | C6 | C7 | C8 | C9 | C10 |
|---|---|---|---|---|---|---|---|---|---|---|
| SD52+160–SD52+135 | 45 | 85 | 66 | 320 | 104 | 30 | 70 | 55 | 65 | 50 |
| SD52+135–SD52+060 | 40 | 80 | 62 | 320 | 102 | 20 | 65 | 60 | 70 | 50 |
| SD52+060–SD51+980 | 20 | 45 | 60 | 400 | 115 | 10 | 40 | 85 | 80 | 85 |
| SD51+980–SD51+917 | 10 | 35 | 63 | 330 | 112 | 10 | 45 | 80 | 80 | 80 |
| SD51+917–SD51+280 | 10 | 20 | 62 | 380 | 115 | 10 | 30 | 90 | 85 | 90 |
| SD51+280–SD51+264 | 15 | 85 | 60 | 300 | 118 | 10 | 80 | 65 | 75 | 40 |
| SD51+264–SD51+212 | 20 | 50 | 55 | 280 | 113 | 10 | 60 | 70 | 75 | 65 |
| SD51+212–SD51+170 | 10 | 60 | 54 | 340 | 108 | 10 | 65 | 75 | 75 | 70 |
| SD51+170–SD50+660 | 10 | 15 | 65 | 380 | 117 | 10 | 35 | 90 | 80 | 90 |
| SD50+660–SD50+617 | 10 | 35 | 62 | 420 | 120 | 10 | 40 | 80 | 80 | 80 |
| Index | C1 | C2 | C3 | C4 | C5 |
| AHP-based Weight | 0.1084 | 0.2672 | 0.0320 | 0.0541 | 0.2043 |
| Entropy-based Weight | 0.1029 | 0.1287 | 0.1005 | 0.0985 | 0.1074 |
| Combination Weight | 0.1062 | 0.2118 | 0.0594 | 0.0719 | 0.1655 |
| Index | C6 | C7 | C8 | C9 | C10 |
| AHP-based Weight | 0.1591 | 0.0290 | 0.0210 | 0.0180 | 0.1067 |
| Entropy-based Weight | 0.0771 | 0.1010 | 0.1037 | 0.0720 | 0.1082 |
| Combination Weight | 0.1263 | 0.0578 | 0.0541 | 0.0396 | 0.1073 |
| Index | I | II | III | IV |
|---|---|---|---|---|
| C1 | (12.5, 4.1667, 0.01) | (37.5, 4.1667, 0.01) | (62.5, 4.1667, 0.01) | (87.5, 4.1667, 0.01) |
| C2 | (12.5, 4.1667, 0.01) | (37.5, 4.1667, 0.01) | (62.5, 4.1667, 0.01) | (87.5, 4.1667, 0.01) |
| C3 | (5, 1.6667, 0.01) | (22.5, 4.1667, 0.01) | (55, 6.6667, 0.01) | (82.5, 2.5, 0.01) |
| C4 | (550, 33.3333, 0.01) | (400, 16.6667, 0.01) | (300, 16.6667, 0.01) | (125, 41.6667, 0.01) |
| C5 | (5, 1.6667, 0.01) | (20, 3.3333, 0.01) | (45, 5, 0.01) | (90, 10, 0.01) |
| C6 | (12.5, 4.1667, 0.01) | (37.5, 4.1667, 0.01) | (62.5, 4.1667, 0.01) | (87.5, 4.1667, 0.01) |
| C7 | (12.5, 4.1667, 0.01) | (37.5, 4.1667, 0.01) | (62.5, 4.1667, 0.01) | (87.5, 4.1667, 0.01) |
| C8 | (92.5, 2.5, 0.01) | (77.5, 2.5, 0.01) | (65, 1.6667, 0.01) | (30, 10, 0.01) |
| C9 | (92.5, 2.5, 0.01) | (77.5, 2.5, 0.01) | (65, 1.6667, 0.01) | (30, 10, 0.01) |
| C10 | (92.5, 2.5, 0.01) | (77.5, 2.5, 0.01) | (65, 1.6667, 0.01) | (30, 10, 0.01) |
| Sample | C1 | C2 | C3 | C4 | C5 |
| SD52+160–SD52+135 | 0.1987 | 0.8350 | 0.2579 | 0.4864 | 0.3761 |
| SD52+135–SD52+060 | 0.8366 | 0.1959 | 0.5776 | 0.4864 | 0.4871 |
| SD52+060–SD51+980 | 0.1944 | 0.1987 | 0.7557 | 1.0000 | 0.0441 |
| SD51+980–SD51+917 | 0.8359 | 0.8355 | 0.4875 | 0.1985 | 0.0888 |
| SD51+917–SD51+280 | 0.8359 | 0.1944 | 0.5776 | 0.4869 | 0.0441 |
| SD51+280–SD51+264 | 0.8355 | 0.8350 | 0.7557 | 1.0000 | 0.0199 |
| SD51+264–SD51+212 | 0.1944 | 0.0112 | 1.0000 | 0.4873 | 0.0707 |
| SD51+212–SD51+170 | 0.8359 | 0.8352 | 0.9888 | 0.0562 | 0.1985 |
| SD51+170–SD50+660 | 0.8359 | 0.8355 | 0.3264 | 0.4869 | 0.0259 |
| SD50+660–SD50+617 | 0.8359 | 0.8355 | 0.5776 | 0.4860 | 0.0110 |
| Sample | C6 | C7 | C8 | C9 | C10 |
| SD52+160–SD52+135 | 0.2022 | 0.1975 | 0.0442 | 1.0000 | 0.1355 |
| SD52+135–SD52+060 | 0.1944 | 0.8352 | 0.0113 | 0.0111 | 0.1355 |
| SD52+060–SD51+980 | 0.8359 | 0.8355 | 0.0111 | 0.6036 | 0.0111 |
| SD51+980–SD51+917 | 0.8359 | 0.1984 | 0.6036 | 0.6036 | 0.6036 |
| SD51+917–SD51+280 | 0.8359 | 0.1966 | 0.6038 | 0.0111 | 0.6038 |
| SD51+280–SD51+264 | 0.8359 | 0.1979 | 1.0000 | 0.6047 | 0.6064 |
| SD51+264–SD51+212 | 0.8359 | 0.8352 | 0.0111 | 0.6047 | 1.0000 |
| SD51+212–SD51+170 | 0.8359 | 0.8357 | 0.6047 | 0.6047 | 0.0118 |
| SD51+170–SD50+660 | 0.8359 | 0.8361 | 0.6038 | 0.6036 | 0.6038 |
| SD50+660–SD50+617 | 0.8359 | 0.8355 | 0.6036 | 0.6036 | 0.6036 |
| Sample | Synthetic Certainty Degree | The Cloud Model Method | Ideal Point Method | Gray Relation Projection Method | |||
|---|---|---|---|---|---|---|---|
| U(I) | U(II) | U(III) | U(IV) | ||||
| SD52+160–SD52+135 | 0 | 0.0466 | 0.1013 | 0.2561 | IV | IV | IV |
| SD52+135–SD52+060 | 0.0245 | 0.0889 | 0.1180 | 0.1373 | IV | III | IV |
| SD52+060–SD51+980 | 0.1260 | 0.1880 | 0.0449 | 0.0073 | II | II | III |
| SD51+980–SD51+917 | 0.1943 | 0.3098 | 0.0432 | 0.0147 | II | II | II |
| SD51+917–SD51+280 | 0.3334 | 0.0464 | 0.0343 | 0.0073 | I | II | II |
| SD51+280–SD51+264 | 0.1943 | 0.0240 | 0.1709 | 0.2567 | IV | IV | IV |
| SD51+264–SD51+212 | 0.1262 | 0.0240 | 0.2530 | 0.0117 | III | III | III |
| SD51+212–SD51+170 | 0.1943 | 0.0567 | 0.2893 | 0.0329 | III | III | III |
| SD51+170–SD50+660 | 0.4688 | 0.1072 | 0.0194 | 0.0043 | I | II | II |
| SD50+660–SD50+617 | 0.1943 | 0.3816 | 0.0343 | 0.0018 | II | II | II |
© 2020 by the authors. Licensee MDPI, Basel, Switzerland. This article is an open access article distributed under the terms and conditions of the Creative Commons Attribution (CC BY) license (http://creativecommons.org/licenses/by/4.0/).
Share and Cite
Wang, X.; Shi, K.; Shi, Q.; Dong, H.; Chen, M. A Normal Cloud Model-Based Method for Risk Assessment of Water Inrush and Its Application in a Super-Long Tunnel Constructed by a Tunnel Boring Machine in the Arid Area of Northwest China. Water 2020, 12, 644. https://doi.org/10.3390/w12030644
Wang X, Shi K, Shi Q, Dong H, Chen M. A Normal Cloud Model-Based Method for Risk Assessment of Water Inrush and Its Application in a Super-Long Tunnel Constructed by a Tunnel Boring Machine in the Arid Area of Northwest China. Water. 2020; 12(3):644. https://doi.org/10.3390/w12030644
Chicago/Turabian StyleWang, Xin, Kebin Shi, Quan Shi, Hanwei Dong, and Ming Chen. 2020. "A Normal Cloud Model-Based Method for Risk Assessment of Water Inrush and Its Application in a Super-Long Tunnel Constructed by a Tunnel Boring Machine in the Arid Area of Northwest China" Water 12, no. 3: 644. https://doi.org/10.3390/w12030644
APA StyleWang, X., Shi, K., Shi, Q., Dong, H., & Chen, M. (2020). A Normal Cloud Model-Based Method for Risk Assessment of Water Inrush and Its Application in a Super-Long Tunnel Constructed by a Tunnel Boring Machine in the Arid Area of Northwest China. Water, 12(3), 644. https://doi.org/10.3390/w12030644