Operational Efficiency of Mexican Water Utilities: Results of a Double-Bootstrap Data Envelopment Analysis

 ,
,  , and
, and
Abstract
1. Introduction
2. Literature Review
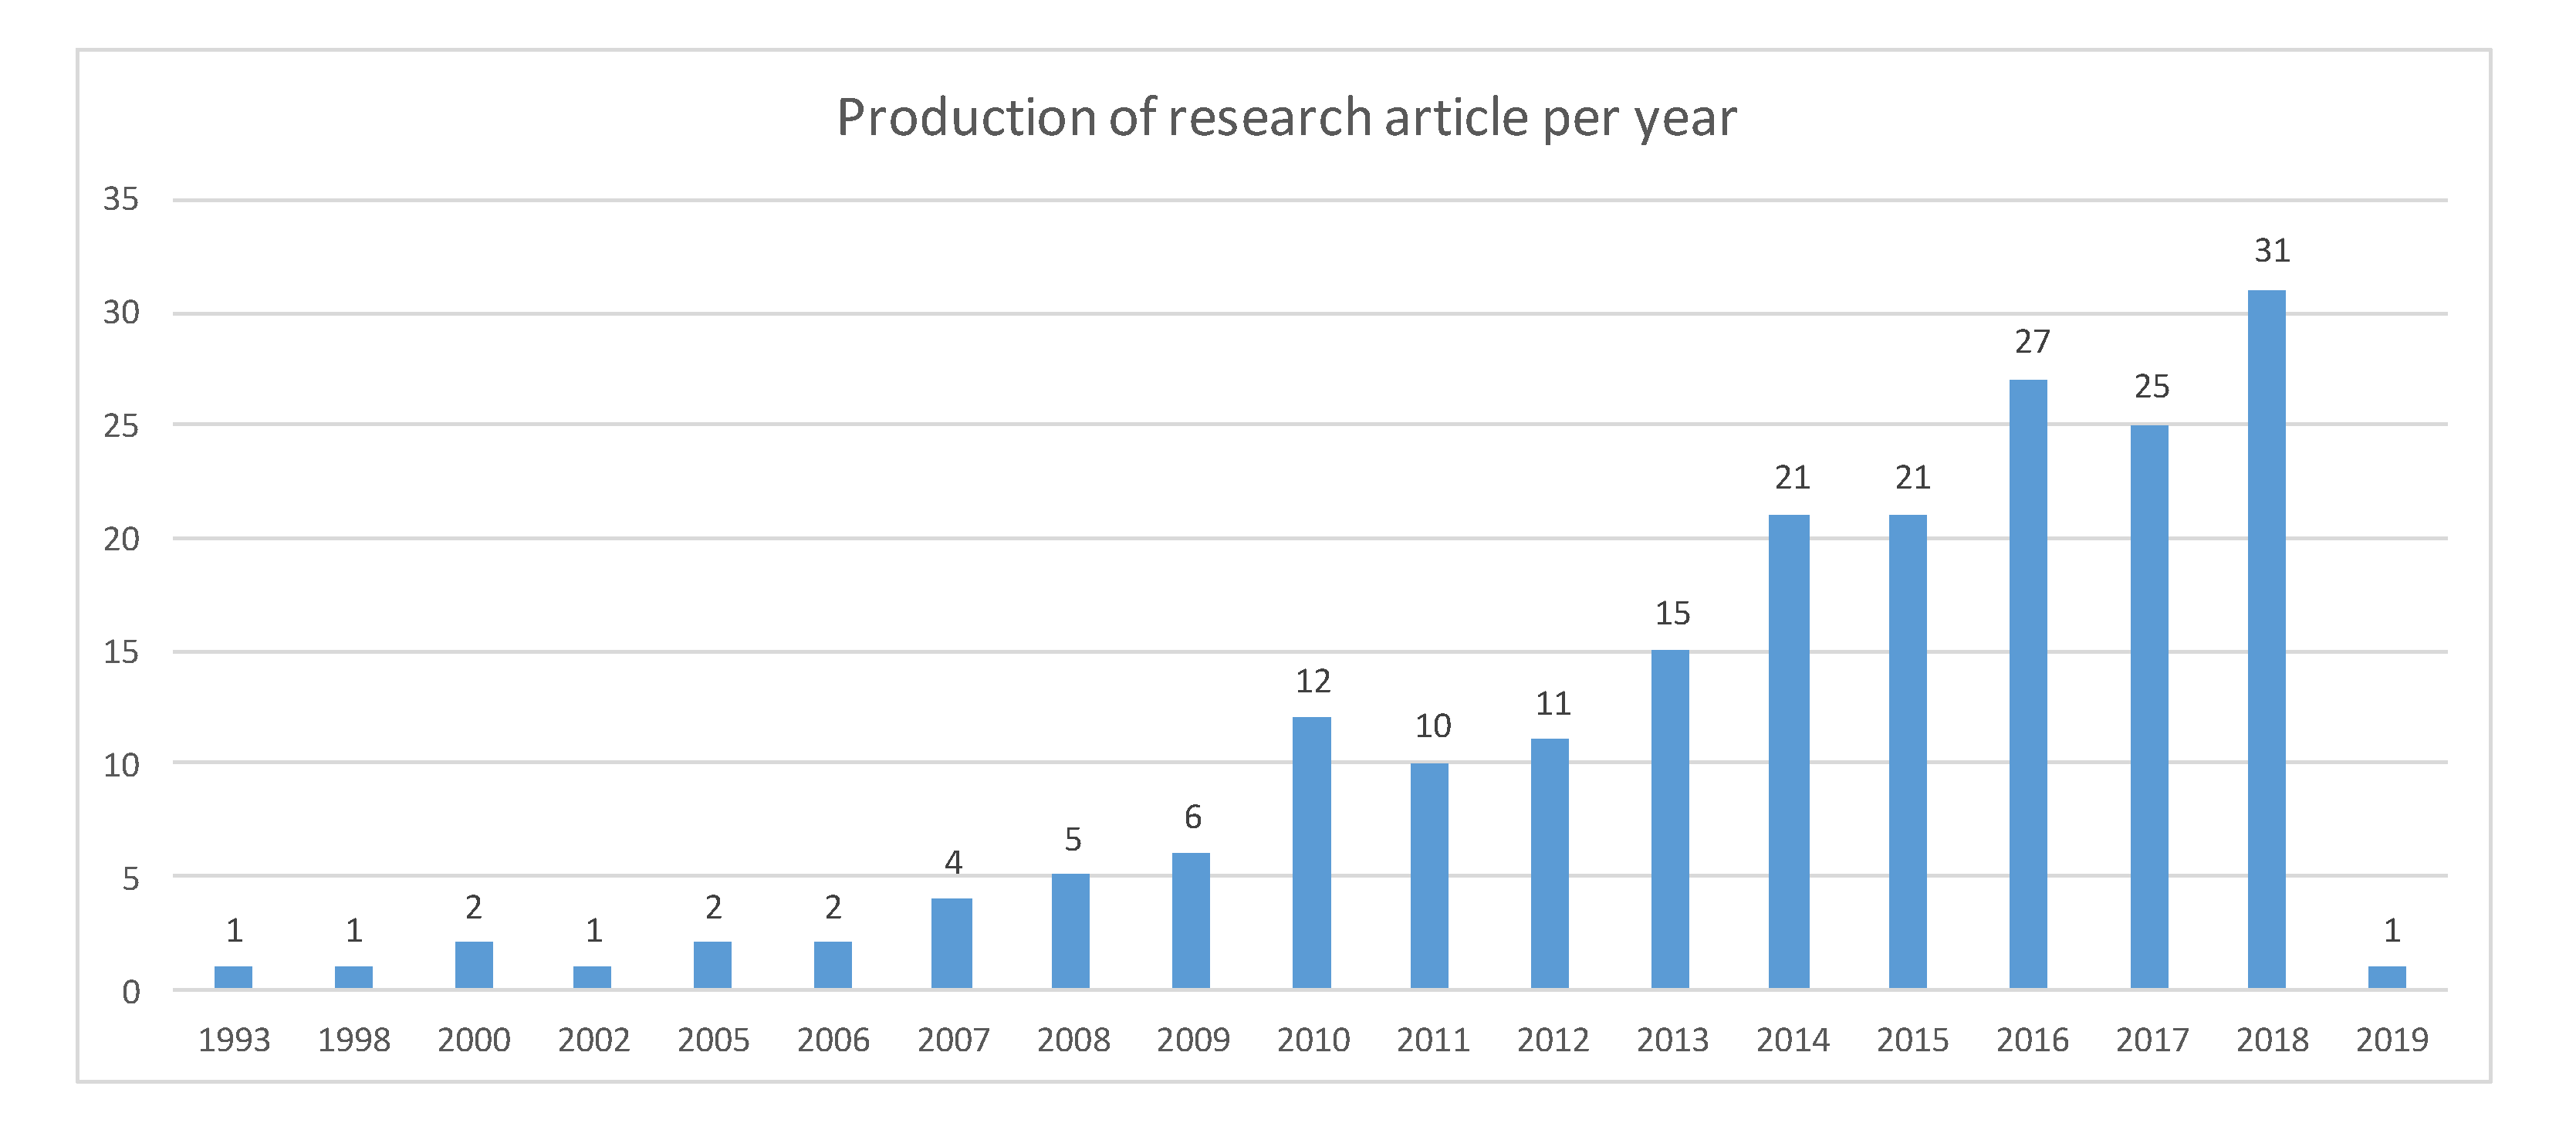
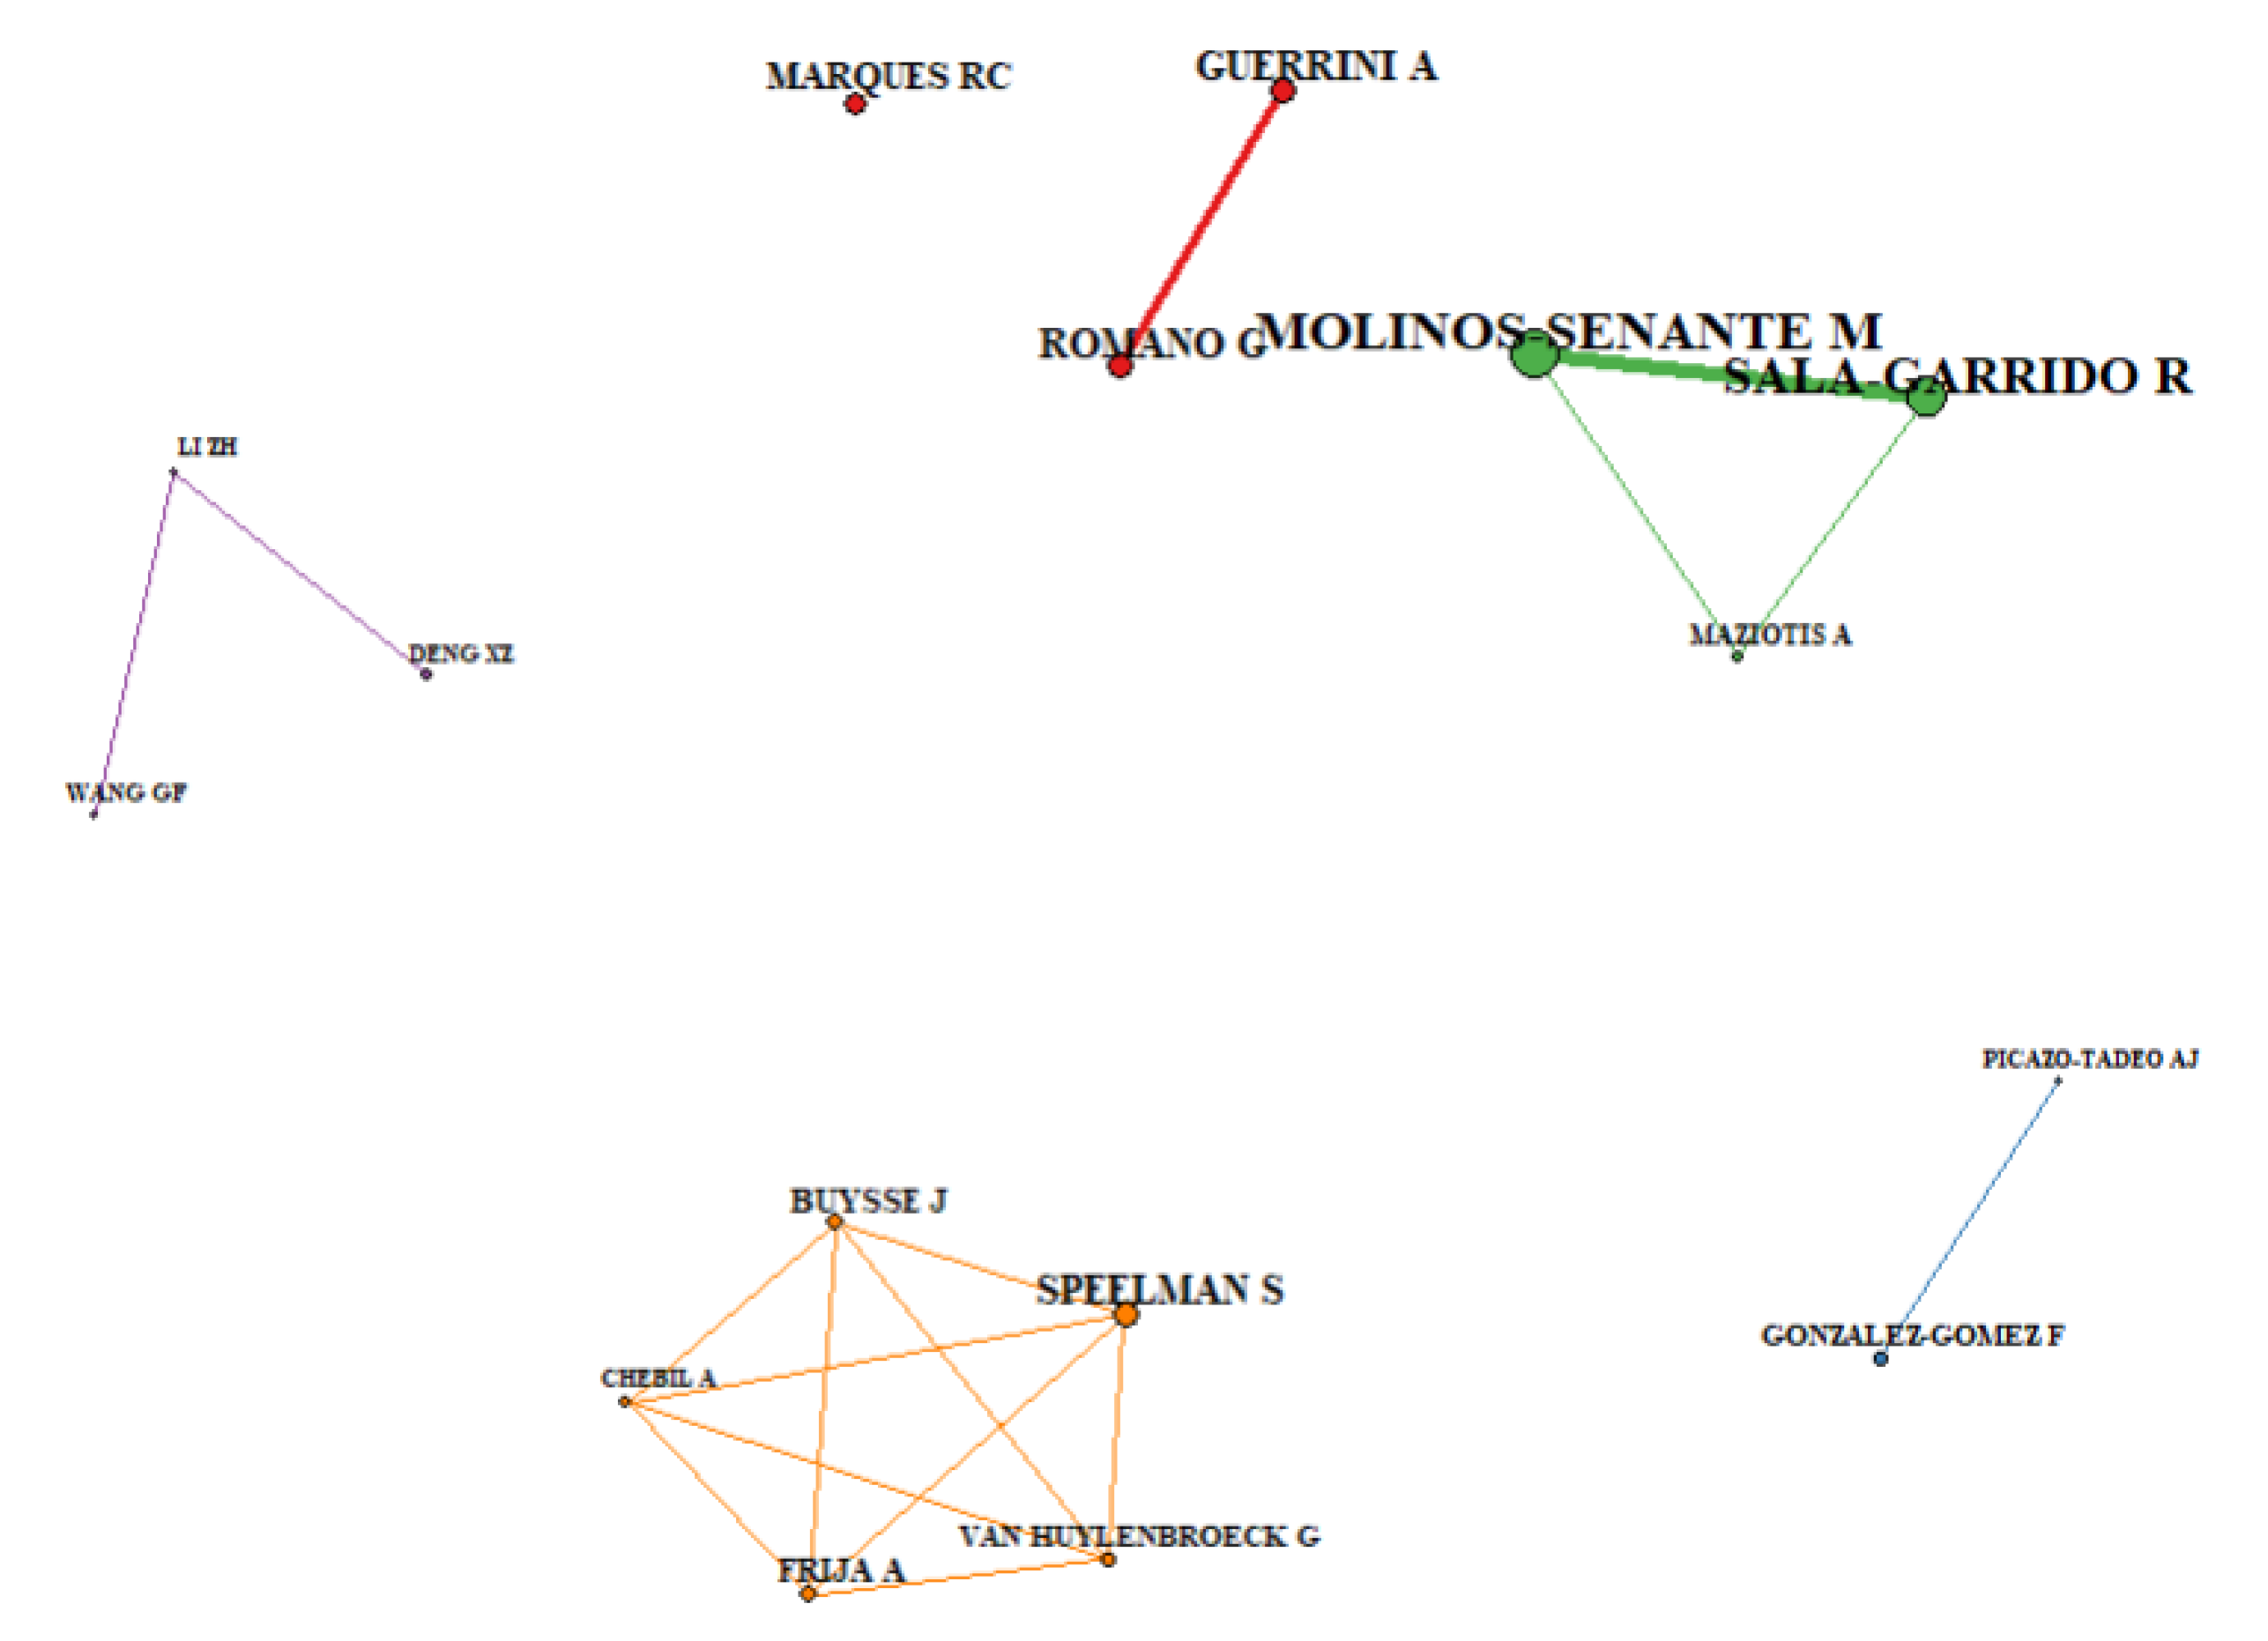
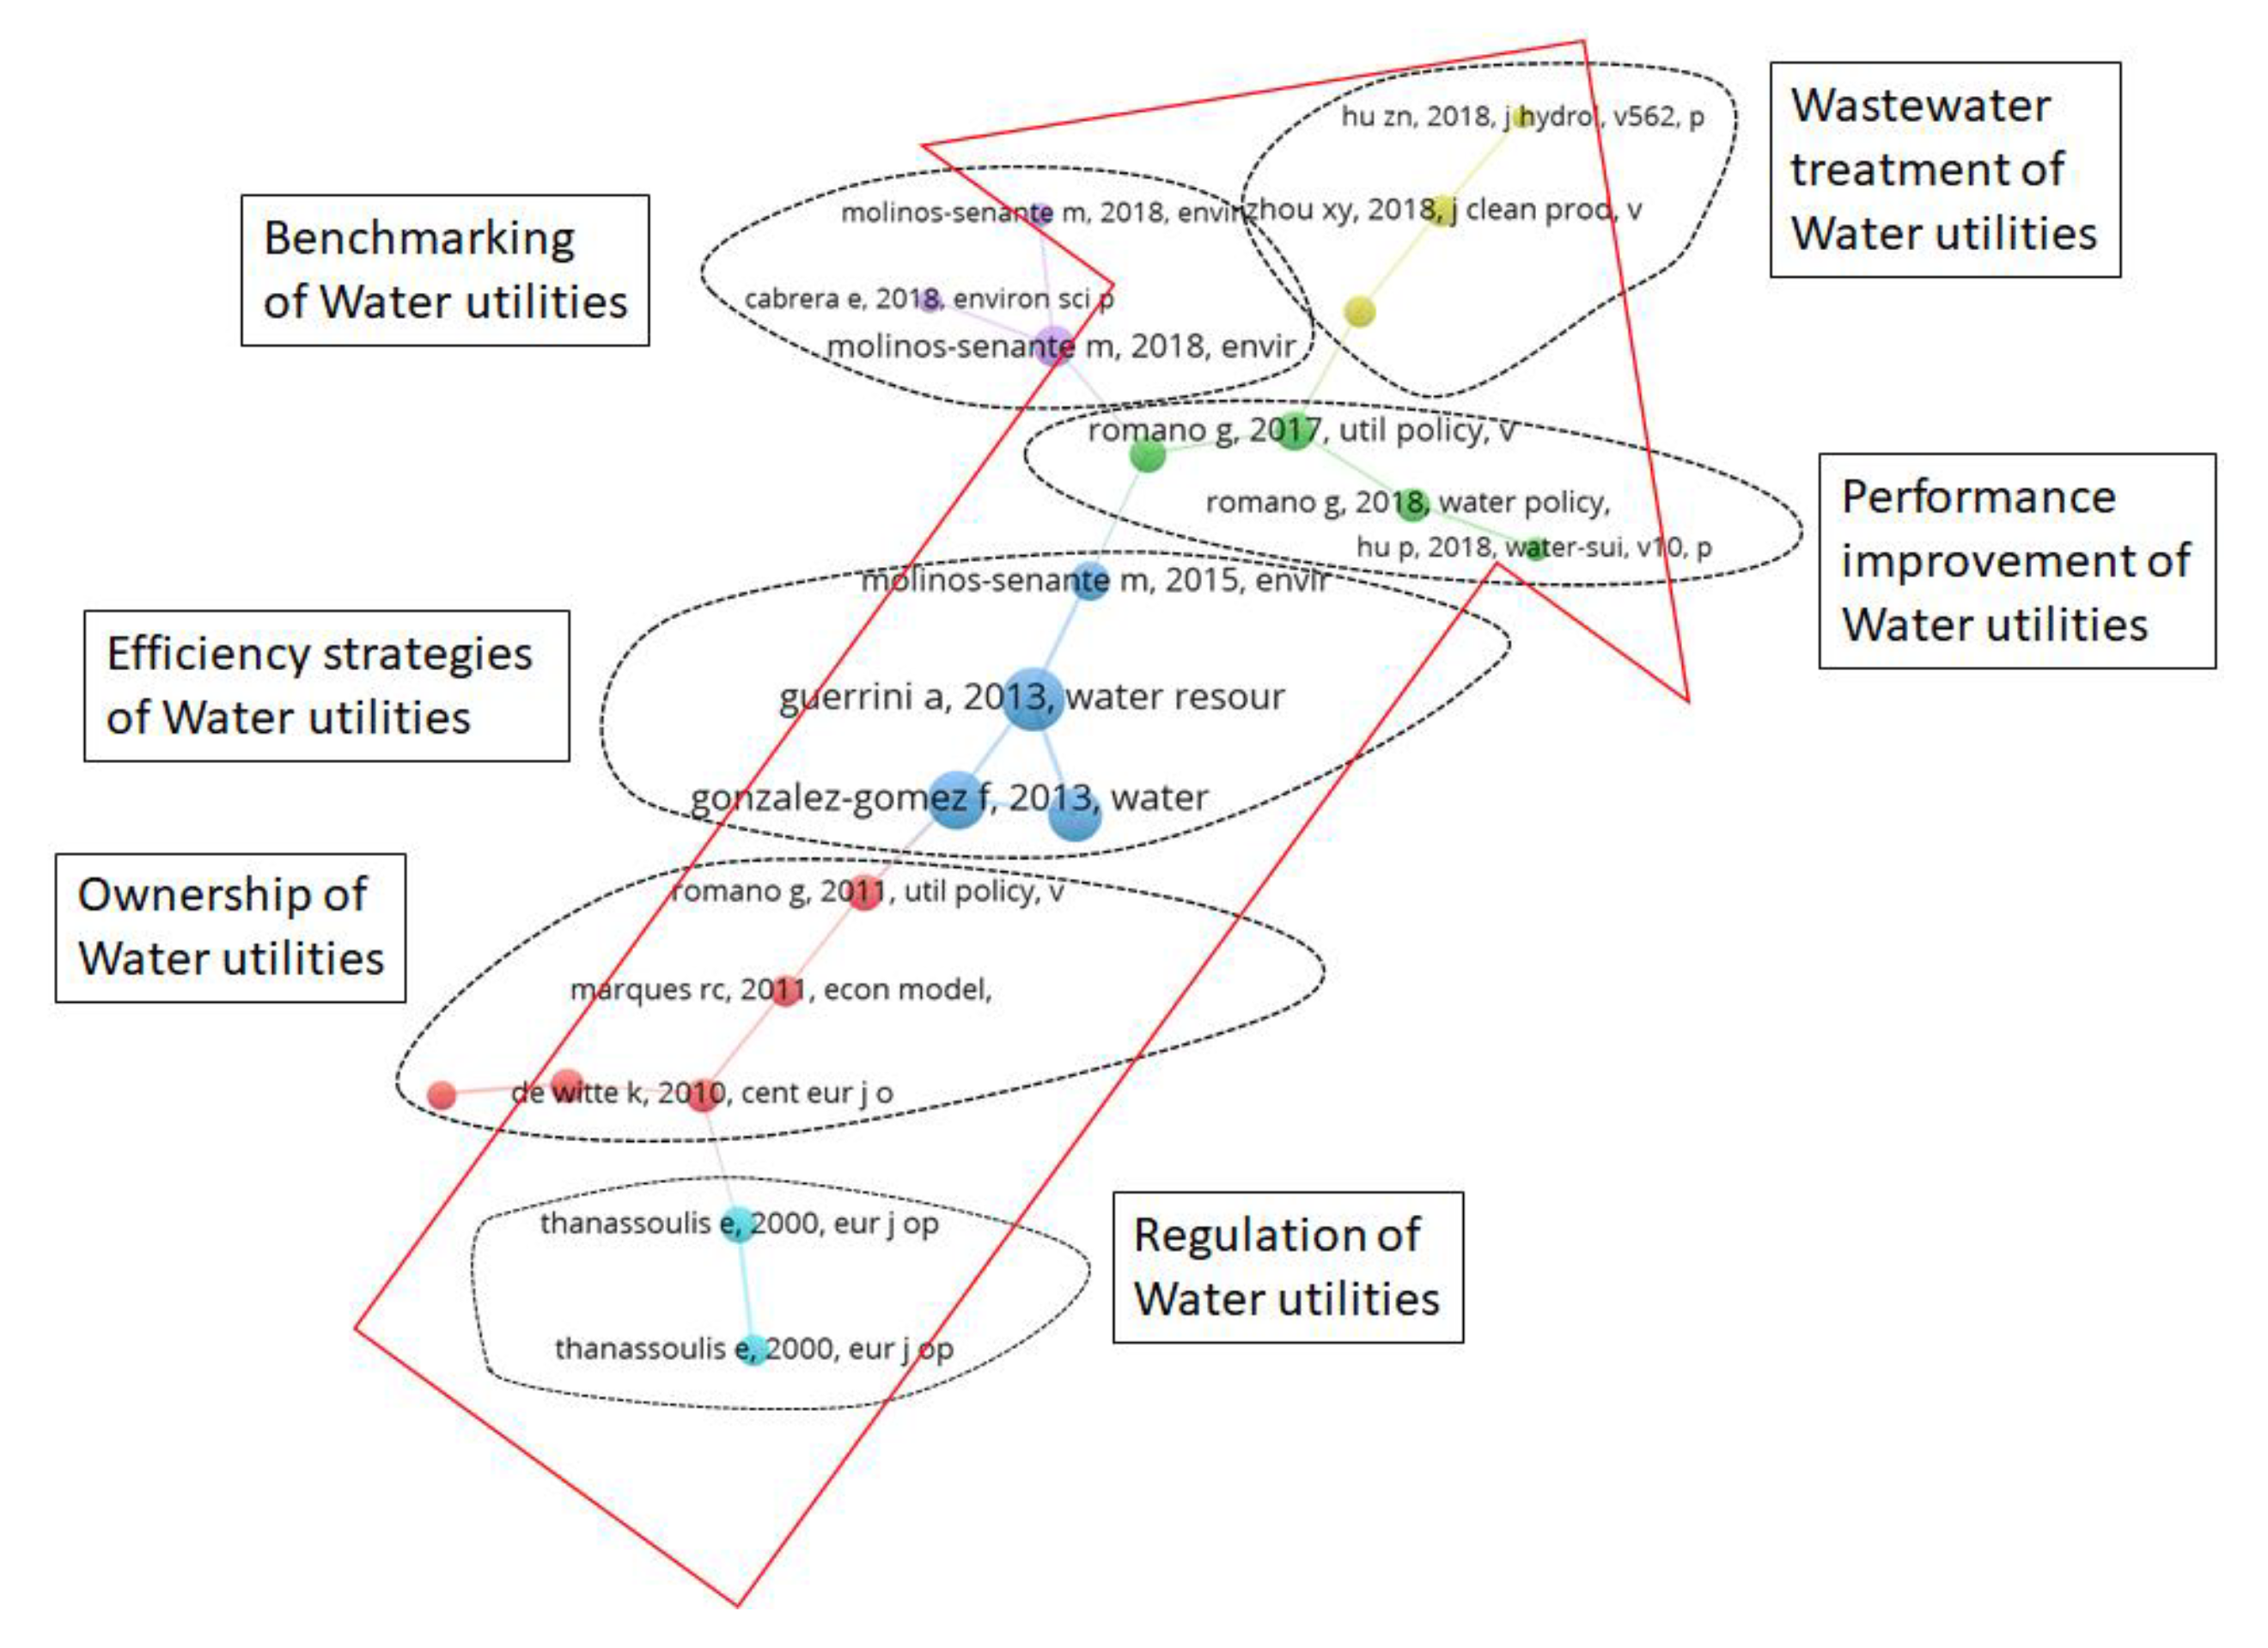
2.1. Bibliometric and Main Path Analysis
2.2. Bootstrap DEA
2.3. Mexican Water Utilities
3. Proposed Methodology
4. Case Study
4.1. Inputs
4.2. Outputs
4.3. Context Variables
4.4. Results and Discussion
5. Conclusions
Author Contributions
Funding
Acknowledgments
Conflicts of Interest
References
- Halkos, G.E.; Tzeremes, N.G. The effect of access to improved water sources and sanitation on economic efficiency: The case of sub-Saharan African countries. S. Afr. J. Econ. 2012, 80, 246–263. [Google Scholar] [CrossRef]
- Connor, R. The United Nations World Water Development Report 2015: Water for a Sustainable World, 1st ed.; UNESCO World Water Assessment Programme, Ed.; UNESCO Publishing: Paris, France, 2015. [Google Scholar]
- OECD. OECD Environmental Outlook to 2050; OECD Environmental Outlook; OECD: Paris, France, 2012; ISBN 9789264122161. [Google Scholar]
- Anwandter, L.; Ozuna, T.J. Can public sector reforms improve the efficiency of public water utilities? Environ. Dev. Econ. 2002, 7, 687–700. [Google Scholar] [CrossRef]
- Badillo-Piña, I.; Orduñez-Zavala, E.; Tejeida-Padilla, R. Rainfall use to improve the sustainability of the hydraulic system in the valley of Mexico. In Proceedings of the 54th Annual Conference of the International Society for the Systems Sciences, Waterloo, ON, Canada, 18–23 July 2010; Volume 5, pp. 428–446. [Google Scholar]
- CONAGUA. Numeragua; CONAGUA: Mexico City, México, 2017. [Google Scholar]
- Kauffer, E. Contrasting water securities: The Mexican state facing downstream stakeholders in the Suchiate transboundary river basin. Int. J. Water Resour. Dev. 2019, 35, 30–48. [Google Scholar] [CrossRef]
- De Faraia, R.C.; Moreira, T.B.S.; Souza, G.S. Public versus private water utilities: Empirical evidence for Brazilian companies. Econ. Bull. 2005, 8, 1–7. [Google Scholar]
- Feigenbaum, S.; Teeples, R. Public Versus Private Water Delivery: A Hedonic Cost Approach. Rev. Econ. Stat. 1983, 65, 672. [Google Scholar] [CrossRef]
- García-Rubio, M.A.; González-Gómez, F.; Guardiola, J. Performance and ownership in the governance of urban water. Proc. Inst. Civ. Eng. Munic. Eng. 2010, 163, 51–58. [Google Scholar] [CrossRef]
- González-Gómez, F.; García-Rubio, M.A.; Alcalá-Olid, F.; Ortega-Díaz, M.I. Outsourcing and Efficiency in the Management of Rural Water Services. Water Resour. Manag. 2013, 27, 731–747. [Google Scholar] [CrossRef]
- Kirkpatrick, C.; Parker, D.; Zhang, Y.-F. An Empirical Analysis of State and Private-Sector Provision of Water Services in Africa. World Bank Econ. Rev. 2006, 20, 143–163. [Google Scholar] [CrossRef]
- Shaoul, J. A Critical Financial Analysis of the Performance of Privatised Insustries: The Case of the Water Industry in England and Wales. Crit. Perspect. Account. 1997, 8, 479–505. [Google Scholar] [CrossRef]
- Marques, R.C. Comparing private and public performance of Portuguese water services. Water Policy 2008, 10, 25–42. [Google Scholar] [CrossRef]
- De Witte, K.; Marques, R.C. Capturing the environment, a metafrontier approach to the drinking water sector. Int. Trans. Oper. Res. 2009, 16, 257–271. [Google Scholar] [CrossRef]
- Sáez-Fernández, F.J.; González-Gómez, F.; Picazo-Tadeo, A.J. Opportunity Costs of Ensuring Sustainability in Urban Water Services. Int. J. Water Resour. Dev. 2011, 27, 693–708. [Google Scholar] [CrossRef]
- Vishwakarma, A.; Kulshrestha, M.; Amulya Nyathikala, S.; Kulshreshtha, M. Cost efficiency benchmarking of urban water supply utilities: The case of an Indian state. Water Environ. J. 2016, 30, 77–87. [Google Scholar] [CrossRef]
- Cabrera, E.; Estruch-Juan, E.; Molinos-Senante, M. Adequacy of DEA as a regulatory tool in the water sector. The impact of data uncertainty. Environ. Sci. Policy 2018, 85, 155–162. [Google Scholar] [CrossRef]
- Gadanakis, Y.; Bennett, R.; Park, J.; Areal, F.J. Improving productivity and water use efficiency: A case study of farms in England. Agric. Water Manag. 2015, 160, 22–32. [Google Scholar] [CrossRef]
- Maziotis, A.; Molinos-Senante, M.; Sala-Garrido, R. Assesing the Impact of Quality of Service on the Productivity of Water Industry: A Malmquist-Luenberger Approach for England and Wales. Water Resour. Manag. 2017, 31, 2407–2427. [Google Scholar] [CrossRef]
- Pointon, C.; Matthews, K. Dynamic efficiency in the English and Welsh water and sewerage industry. Omega 2016, 58, 86–96. [Google Scholar] [CrossRef]
- Song, M.; Wang, R.; Zeng, X. Water resources utilization efficiency and influence factors under environmental restrictions. J. Clean. Prod. 2018, 184, 611–621. [Google Scholar] [CrossRef]
- Wang, S.; Zhou, L.; Wang, H.; Li, X. Water Use Efficiency and Its Influencing Factors in China: Based on the Data Envelopment Analysis (DEA)—Tobit Model. Water 2018, 10, 832. [Google Scholar] [CrossRef]
- Zhou, X.; Luo, R.; Yao, L.; Cao, S.; Wang, S.; Lev, B. Assessing integrated water use and wastewater treatment systems in China: A mixed network structure two-stage SBM DEA model. J. Clean. Prod. 2018, 185, 533–546. [Google Scholar] [CrossRef]
- Garfield, E. Citation Analysis as a Tool in Journal Evaluation: Journals can be ranked by frequency and impact of citations for science policy studies. Science 1972, 178, 471–479. [Google Scholar] [CrossRef] [PubMed]
- Narin, F.; Olivastro, D.; Stevens, K.A. Bibliometrics/Theory, Practice and Problems. Eval. Rev. 1994, 18, 65–76. [Google Scholar] [CrossRef]
- Bonilla, C.A.; Merigó, J.M.; Torres-Abad, C. Economics in Latin America: A bibliometric analysis. Scientometrics 2015, 105, 1239–1252. [Google Scholar] [CrossRef]
- Berg, S.; Marques, R.C. Quantitative studies of water and sanitation utilities: A benchmarking literature survey. Water Policy 2011, 13, 591–606. [Google Scholar] [CrossRef]
- De Witte, K.; Marques, R.C. Designing performance incentives, an international benchmark study in the water sector. Cent. Eur. J. Oper. Res. 2010, 18, 189–220. [Google Scholar] [CrossRef]
- Thanassoulis, E. DEA and its use in the regulation of water companies. Eur. J. Oper. Res. 2000, 127, 1–13. [Google Scholar] [CrossRef]
- Aida, K.; Cooper, W.W.; Pastor, J.T.; Sueyoshi, T. Evaluating Water Supply Services in Japan with RAM: A Range-adjusted Measure of Inefficiency. Omega 1998, 26, 207–232. [Google Scholar] [CrossRef]
- Thanassoulis, E. The use of data envelopment analysis in the regulation of UK water utilities: Water distribution. Eur. J. Oper. Res. 2000, 126, 436–453. [Google Scholar] [CrossRef]
- Liu, J.S.; Lu, L.Y.Y. An integrated approach for main path analysis: Development of the Hirsch index as an example. J. Am. Soc. Inf. Sci. Technol. 2012, 63, 528–542. [Google Scholar] [CrossRef]
- Molinos-Senante, M.; Farías, R. Evaluation of the influence of economic groups on the efficiency and quality of service of water companies: An empirical approach for Chile. Environ. Sci. Pollut. Res. 2018, 25, 23251–23260. [Google Scholar] [CrossRef]
- Hu, Z.; Yan, S.; Yao, L.; Moudi, M. Efficiency evaluation with feedback for regional water use and wastewater treatment. J. Hydrol. 2018, 562, 703–711. [Google Scholar] [CrossRef]
- Simar, L.; Wilson, P.W. Estimation and inference in two-stage, semi-parametric models of production processes. J. Econ. 2007, 136, 31–64. [Google Scholar] [CrossRef]
- Pawsey, N.; Ananda, J.; Hoque, Z. Rationality, accounting and benchmarking water businesses. Int. J. Public Sect. Manag. 2018, 31, 290–315. [Google Scholar] [CrossRef]
- De Witte, K.; Marques, R.C. Designing Incentives in Local Public Utilities: An International Comparison of the Drinking Water Sector. SSRN Electron. J. 2007. [Google Scholar] [CrossRef]
- Mbuvi, D.; De Witte, K.; Perelman, S. Urban water sector performance in Africa: A step-wise bias-corrected efficiency and effectiveness analysis. Util. Policy 2012, 22, 31–40. [Google Scholar] [CrossRef]
- Ananda, J. Evaluating the Performance of Urban Water Utilities: Robust Nonparametric Approach. J. Water Resour. Plan. Manag. 2014, 140, 04014021. [Google Scholar] [CrossRef]
- Carvalho, P.; Marques, R.C. The influence of the operational environment on the efficiency of water utilities. J. Environ. Manag. 2011, 92, 2698–2707. [Google Scholar] [CrossRef]
- Guerrini, A.; Romano, G.; Campedelli, B. Economies of Scale, Scope, and Density in the Italian Water Sector: A Two-Stage Data Envelopment Analysis Approach. Water Resour. Manag. 2013, 27, 4559–4578. [Google Scholar] [CrossRef]
- Lo Storto, C. Are Public-Private Partnerships a Source of Greater Efficiency in Water Supply? Results of a Non-Parametric Performance Analysis Relating to the Italian Industry. Water 2013, 5, 2058–2079. [Google Scholar] [CrossRef]
- Marques, R.C.; Berg, S.; Yane, S. Nonparametric benchmarking of Japanese water utilities: Institutional and environmental factors affecting efficiency. J. Water Resour. Plan. Manag. 2014, 140, 562–571. [Google Scholar] [CrossRef]
- Molinos-Senante, M.; Donoso, G.; Sala-Garrido, R.; Villegas, A. Benchmarking the efficiency of the Chilean water and sewerage companies: A double-bootstrap approach. Environ. Sci. Pollut. Res. 2018, 25, 8432–8440. [Google Scholar] [CrossRef] [PubMed]
- Pinto, F.S.; Simões, P.; Marques, R.C. Water services performance: Do operational environment and quality factors count? Urban Water J. 2017, 14, 773–781. [Google Scholar] [CrossRef]
- Zschille, M.; Walter, M. The performance of German water utilities: A (semi)-parametric analysis. Appl. Econ. 2012, 44, 3749–3764. [Google Scholar] [CrossRef]
- Güngör-Demirci, G.; Lee, J.; Keck, J. Measuring water utility performance using nonparametric linear programming. Civ. Eng. Environ. Syst. 2018, 34, 206–220. [Google Scholar] [CrossRef]
- Güngör-Demirci, G.; Lee, J.; Keck, J. Assessing the Performance of a California Water Utility Using Two-Stage Data Envelopment Analysis. J. Water Resour. Plan. Manag. 2018, 144, 05018004. [Google Scholar] [CrossRef]
- Renzetti, S.; Dupont, D.P. Measuring the Technical Efficiency of Municipal Water Suppliers: The Role of Environmental Factors. Land Econ. 2009, 85, 627–636. [Google Scholar] [CrossRef]
- Cabrera, E.; Cabrera, E. Regulation of Urban Water Services. An Overview; IWA Publishing: London, UK, 2016; Volume 15, p. 9781780408187. [Google Scholar]
- Charnes, A.; Cooper, W.W.; Rhodes, E. Measuring the efficiency of decision making units. Eur. J. Oper. Res. 1978, 2, 429–444. [Google Scholar] [CrossRef]
- Liu, J.S.; Lu, L.Y.Y.; Lu, W.-M.; Lin, B.J.Y. Data envelopment analysis 1978–2010: A citation-based literature survey. Omega 2013, 41, 3–15. [Google Scholar] [CrossRef]
- Banker, R.D.; Charnes, A.; Cooper, W.W. Some Models for Estimating Technical and Scale Inefficiencies in Data Envelopment Analysis. Manag. Sci. 1984, 30, 1078–1092. [Google Scholar] [CrossRef]
- Andersen, P.; Petersen, N.C. A Procedure for Ranking Efficient Units in Data Envelopment Analysis. Manag. Sci. 1993, 39, 1261–1264. [Google Scholar] [CrossRef]
- Sexton, T.R.; Silkman, R.H.; Hogan, A.J. Data envelopment analysis: Critique and extensions. New Dir. Progr. Eval. 1986, 1986, 73–105. [Google Scholar] [CrossRef]
- Doyle, J.; Green, R. Efficiency and Cross-Efficiency in DEA: Derivations, Meanings and Uses. J. Oper. Res. Soc. 1994, 45, 567. [Google Scholar] [CrossRef]
- Hollingsworth, B.; Smith, P. Use of ratios in data envelopment analysis. Appl. Econ. Lett. 2003, 10, 733–735. [Google Scholar] [CrossRef]
- Emrouznejad, A.; Amin, G.R. DEA models for ratio data: Convexity consideration. Appl. Math. Model. 2009, 33, 486–498. [Google Scholar] [CrossRef]
- Hatami-Marbini, A.; Toloo, M. Data envelopment analysis models with ratio data: A revisit. Comput. Ind. Eng. 2019, 133, 331–338. [Google Scholar] [CrossRef]
- Dong, X.; Du, X.; Li, K.; Zeng, S.; Bledsoe, B.P. Benchmarking sustainability of urban water infrastructure systems in China. J. Clean. Prod. 2018, 170, 330–338. [Google Scholar] [CrossRef]
- Wibowo, A.; Alfen, H.W. Benchmarking the efficiencies of Indonesia’s municipal water utilities using Stackelberg data envelopment analysis. Benchmarking An Int. J. 2015, 22, 588–609. [Google Scholar] [CrossRef]
- Ablanedo-Rosas, J.H.; Gao, H.; Zheng, X.; Alidaee, B.; Wang, H. A study of the relative efficiency of Chinese ports: A financial ratio-based data envelopment analysis approach. Expert Syst. 2010, 27, 349–362. [Google Scholar] [CrossRef]
- Ablanedo-Rosas, J.H.; Gemoets, L.A. Measuring the efficiency of Mexican airports. J. Air Transp. Manag. 2010, 16, 343–345. [Google Scholar] [CrossRef]


| Author | Number of Articles |
|---|---|
| Molinos-Senante M | 21 |
| Sala-Garrido R | 18 |
| Guerrini A | 11 |
| Marques RC | 11 |
| Romano G | 11 |
| Speelman S | 8 |
| Frija A | 6 |
| Gonzalez-Gomez F | 6 |
| Buysse J | 5 |
| Maziotis A | 5 |
| Van Huylenbroeck G | 5 |
| Paper | Total Citations |
|---|---|
| Kirkpatrick C. et al. [12] The World Bank Economic Review | 97 |
| De Witte K, and Marques R. C. [29] Central European Journal of Operations Research | 87 |
| Thanassoulis E. [30] European Journal of Operations Research | 78 |
| Aida K., et al. [31] Omega The International Journal of Management Science | 74 |
| Thanassoulis E. [32] European Journal of Operations Research | 66 |
| Country | Number of Articles |
|---|---|
| China | 37 |
| USA | 20 |
| Chile | 17 |
| Italy | 16 |
| Spain | 14 |
| Belgium | 10 |
| India | 10 |
| Australia | 9 |
| Portugal | 8 |
| Brazil | 6 |
| Germany | 6 |
| Source | Number of Articles |
|---|---|
| Water Policy | 14 |
| Water Resources Management | 14 |
| Utilities Policy | 11 |
| Sustainability | 8 |
| Journal of Cleaner Production | 7 |
| Water | 7 |
| Applied Economics | 6 |
| Environmental Science and Pollution Research | 6 |
| Agricultural Water Management | 5 |
| Journal of Productivity Analysis | 5 |
| Journal of Water Resources Planning and Management | 5 |
| Water Science and Technology: Water Supply | 5 |
| Author Keywords | Frequency |
|---|---|
| Data Envelopment Analysis | 95 |
| Efficiency | 32 |
| Water utilities | 21 |
| Technical efficiency | 17 |
| Stochastic frontier analysis | 14 |
| Water use efficiency | 14 |
| Benchmarking | 13 |
| Performance | 13 |
| China | 10 |
| Water supply | 9 |
| Paper | Inputs | Outputs | Environmental Variables |
|---|---|---|---|
| Anwandter and Ozuna [4] | Personnel Electricity Materials Chemical Outside services Other costs | Water supply Primary treatment Secondary Treatment | State or municipal water utility Autonomous regulation Service cut allowed Water lost/water produced Population density Non-residential users |
| Wang et al. [23] | Labor Capital Water | Sewage Per capita GDP | Technological progress Government intervention Education Industrial structure Export |
| Paper | Inputs | Outputs | Environmental Variables |
|---|---|---|---|
| De Witte & Marques [29,38] | Number of employees Length of mains | Volume of water Number of connections | Leakage Groundwater extraction Industry water/household delivery Gross regional product Water unique activity Corporatization Delivery in one municipality Regulator Benchmarking |
| Renzetti & Dupont [50] | Materials Labor Distribution length | Sum of annual deliveries | Elevation Population density Residential water usage/total water agency output Surface or groundwater Private dwellings Summer temperature Precipitation |
| Carvalho & Marques [41] | Staff cost Operations and maintenance expenses Capital expenses | Volume of water delivered Number of customers | Scope (combinations of water & wastewater) Ownership Regulation % Purchased water % of surface water provided % surface water source Customer density-water Customer density-wastewater Peak factor % Residential customers |
| Halkos & Tzeremes [1] | Gross fixed capital formation (% of GDP) Labor force | GDP | Pop. with sustainable access to water Pop. with sustainable access to sanitation |
| Mbuvi et al. [39] | Employees Network Length | Population served Water sold Total water connections Daily water supply Pop. served/Target pop. Water sold/Target pop Water connections/Target pop. | Independent regulation Performance contract use GDP Network density |
| Zschille & Walter [47] | Revenues | Water meters Water delivered to households Water delivered to nonhouseholds Network length Population Volume of water intake | Output density Leak ratio Groundwater ratio Elevation difference Debt per capita Dummy for east Dummy for private Dummy for sewage |
| Guerrini et al. [42] | Depreciation + interest paid Staff costs Operating costs Length of mains | Population served Total revenues | Degree of investment diversification Customer density Size |
| Lo Storto [43] | Aqueduct network length Sewerage network length Total production cost | Revenue from service delivered | Number of municipalities Number of connections Population Num. of connections/total network length Num. of connections/num. of municipalities |
| Ananda [40] | Operating expenditure Length of water mains | Total urban water supplied Output quality | % surface water % recycling water % groundwater Total connected properties Properties served per km of water main % residential consumption Leak Production density |
| Marques et al. [44] | Capital cost Staff cost Other operational expenditures | Volume of water billed Number of customers | Region Prefecture Owner Water source Vertical integration Peak factor Consumption per capita Customer density Water losses Monthly water charge Outsourcing Subsidies Gross domestic product (GDP) Time |
| Pointon & Mathews [21] | Labor Capital Other | Water delivered Equivalent population served | Water abstraction from rivers Total water pop./length of mains Total sewerage pop./length of sewers Leakage Trade effluent |
| Pinto et al. [46] | Mains length Staff Other operational costs | Volume of water sold Number of households | Different types of water sources Vertical integration of the services Economies of scope Corporatization Private sector participation, Customer density Economies of scale Household disposable income Desired quality of service. |
| Güngӧr-Demirci et al. [48] | Operating expenses Energy | Operating revenue | Number of connections Customer density Groundwater volume/total water production Leak Precipitation |
| Güngӧr-Demirci et al. [49] | Operating expenses Energy | Financial model: Operating revenue Production Model: Volume of water sold | Number of connections Customer density Groundwater volume/total water production Nonrevenue water Precipitation |
| Molinos-Senante et al. [45] | Operating costs Labor Network length | Water distributed Customers with wastewater treatment service Indicator of drinking water quality | Non-revenue water Peak factor Customer density Ownership Water source |
| Attribute | Units | Min | Mean | Max | Std. Dev. |
|---|---|---|---|---|---|
| Inputs | |||||
| Water distribution | liters/per capita/day | 149.42 | 249.99 | 400.18 | 63.92 |
| Number of employees per thousand consumers | number of employees | 2.13 | 5.02 | 14.58 | 2.39 |
| Accounts with on-time payment | % | 3.64 | 62.09 | 94.00 | 21.46 |
| Outputs | |||||
| Ratio production cost/volume produced | $/M3 | 3.56 | 7.57 | 14.45 | 2.67 |
| Ratio water volume paid/water volume produced | % | 7.63 | 45.33 | 79.00 | 16.02 |
| Ratio Total expenses/Total income | % | 70.75 | 95.64 | 183.62 | 20.41 |
| Context Factor | |||||
| Water macro-metering | Dummy binary variable | 0.00 | 0.81 | 1.00 | 0.40 |
| Water micro-metering | Dummy binary variable | 0.00 | 0.81 | 1.00 | 0.40 |
| Wastewater treatment | Dummy binary variable | 0.00 | 0.50 | 1.00 | 0.51 |
| Volume of water lost per connection | M3/connection | 40.27 | 126.86 | 302.83 | 64.38 |
| Sewer coverage | % | 59.00 | 91.91 | 100.00 | 9.25 |
| CRS Eff Score | Bootstrap CRS Eff Score | VRS Eff Score | Bootstrap VRS Eff Score | Scale Eff Score | Bootstrap Scale Eff Score | |
|---|---|---|---|---|---|---|
| DMU | ||||||
| COMAPA-G | 0.7770 | 0.7083 | 0.8536 | 0.8183 | 0.9103 | 0.8656 |
| SAPAS-LP | 1.0000 | 0.8619 | 1.0000 | 0.9065 | 1.0000 | 0.9508 |
| SIMAS-PN | 0.7941 | 0.7179 | 0.9659 | 0.9161 | 0.8221 | 0.7836 |
| CESPM | 1.0000 | 0.8707 | 1.0000 | 0.9219 | 1.0000 | 0.9444 |
| DAPA | 0.6895 | 0.6338 | 0.6959 | 0.6589 | 0.9909 | 0.9618 |
| JAPAC | 0.7138 | 0.6467 | 0.8266 | 0.7965 | 0.8636 | 0.8119 |
| JUMAPA | 0.8394 | 0.7430 | 0.8623 | 0.8093 | 0.9734 | 0.9182 |
| OOMAPAS | 0.5362 | 0.4854 | 0.5829 | 0.5443 | 0.9199 | 0.8918 |
| SIMAPAG | 1.0000 | 0.8548 | 1.0000 | 0.9091 | 1.0000 | 0.9403 |
| SOAPAMA | 0.7034 | 0.6464 | 0.7446 | 0.6964 | 0.9446 | 0.9282 |
| AGUAH | 0.9181 | 0.8089 | 1.0000 | 0.8344 | 0.9181 | 0.9695 |
| AMD | 1.0000 | 0.8238 | 1.0000 | 0.8301 | 1.0000 | 0.9923 |
| CAASIM | 1.0000 | 0.8967 | 1.0000 | 0.9142 | 1.0000 | 0.9809 |
| CAAMTROH | 0.8721 | 0.7779 | 1.0000 | 0.9371 | 0.8721 | 0.8301 |
| CAEV | 0.5743 | 0.5191 | 0.6757 | 0.6458 | 0.8500 | 0.8038 |
| CMAPS | 1.0000 | 0.8104 | 1.0000 | 0.8417 | 1.0000 | 0.9628 |
| CESPT | 1.0000 | 0.8933 | 1.0000 | 0.9674 | 1.0000 | 0.9235 |
| COMAPA-R | 0.7840 | 0.7046 | 0.8321 | 0.7788 | 0.9423 | 0.9048 |
| COMAPA-EM | 0.7556 | 0.6547 | 0.8092 | 0.7512 | 0.9338 | 0.8715 |
| CMAS | 0.4733 | 0.4226 | 0.5766 | 0.5447 | 0.8209 | 0.7759 |
| DAPASCH | 1.0000 | 0.8875 | 1.0000 | 0.9319 | 1.0000 | 0.9524 |
| JAPAM | 1.0000 | 0.8341 | 1.0000 | 0.9148 | 1.0000 | 0.9117 |
| JIAPAZ | 0.6424 | 0.5895 | 0.8202 | 0.7839 | 0.7832 | 0.7521 |
| SADM | 0.8720 | 0.7872 | 0.9902 | 0.9140 | 0.8806 | 0.8613 |
| SAPASNIR | 1.0000 | 0.8139 | 1.0000 | 0.9276 | 1.0000 | 0.8775 |
| SAPACG | 0.8550 | 0.7441 | 0.9500 | 0.8540 | 0.9000 | 0.8713 |
| SAPAS | 0.9181 | 0.8290 | 1.0000 | 0.8922 | 0.9181 | 0.9291 |
| SACMEX | 0.4821 | 0.4256 | 0.6197 | 0.5850 | 0.7779 | 0.7276 |
| SIAPASF | 0.9633 | 0.8716 | 0.9809 | 0.9239 | 0.9820 | 0.9433 |
| SMAPA | 0.5033 | 0.4492 | 0.5796 | 0.5475 | 0.8683 | 0.8204 |
| SIMAPARG | 1.0000 | 0.8818 | 1.0000 | 0.9432 | 1.0000 | 0.9349 |
| SIMAPACO | 1.0000 | 0.8276 | 1.0000 | 0.9211 | 1.0000 | 0.8985 |
| SIMAS-A | 0.6814 | 0.6088 | 0.6851 | 0.6394 | 0.9947 | 0.9521 |
| SOSAPAMIM | 0.5537 | 0.4987 | 0.6737 | 0.6424 | 0.8219 | 0.7763 |
| SOAPAP | 1.0000 | 0.8461 | 1.0000 | 0.9208 | 1.0000 | 0.9188 |
| SOSAPAZ | 0.8066 | 0.7222 | 0.9637 | 0.9103 | 0.8370 | 0.7934 |
| Min | 0.4733 | 0.4226 | 0.5766 | 0.5443 | 0.7779 | 0.7276 |
| Mean | 0.8252 | 0.7249 | 0.8802 | 0.8132 | 0.9313 | 0.8870 |
| Max | 1.0000 | 0.8967 | 1.0000 | 0.9674 | 1.0000 | 0.9923 |
| Std. dev. | 0.1784 | 0.1455 | 0.1512 | 0.1317 | 0.0731 | 0.0717 |
| CRS Eff Score | Bootstrap CRS Eff Score | Lower Bound | Upper Bound | VRS Eff Score | Bootstrap VRS Eff Score | Lower Bound | Upper Bound | |
|---|---|---|---|---|---|---|---|---|
| DMU | ||||||||
| COMAPA-G | 0.7770 | 0.7083 | 0.6541 | 0.7861 | 0.8536 | 0.8183 | 0.7877 | 0.8630 |
| SAPAS-LP | 1.0000 | 0.8619 | 0.7620 | 0.9933 | 1.0000 | 0.9065 | 0.8316 | 1.0906 |
| SIMAS-PN | 0.7941 | 0.7179 | 0.6580 | 0.7969 | 0.9659 | 0.9161 | 0.8725 | 0.9949 |
| CESPM | 1.0000 | 0.8707 | 0.7743 | 1.0554 | 1.0000 | 0.9219 | 0.8576 | 1.0940 |
| DAPA | 0.6895 | 0.6338 | 0.5952 | 0.6768 | 0.6959 | 0.6589 | 0.6287 | 0.7008 |
| JAPAC | 0.7138 | 0.6467 | 0.5991 | 0.7291 | 0.8266 | 0.7965 | 0.7748 | 0.8395 |
| JUMAPA | 0.8394 | 0.7430 | 0.6772 | 0.8171 | 0.8623 | 0.8093 | 0.7669 | 0.8742 |
| OOMAPAS | 0.5362 | 0.4854 | 0.4490 | 0.5223 | 0.5829 | 0.5443 | 0.5201 | 0.5740 |
| SIMAPAG | 1.0000 | 0.8548 | 0.7513 | 0.9830 | 1.0000 | 0.9091 | 0.8362 | 1.0784 |
| SOAPAMA | 0.7034 | 0.6464 | 0.6031 | 0.6926 | 0.7446 | 0.6964 | 0.6582 | 0.7522 |
| AGUAH | 0.9181 | 0.8089 | 0.7318 | 0.9301 | 1.0000 | 0.8344 | 0.7210 | 1.0080 |
| AMD | 1.0000 | 0.8238 | 0.7300 | 0.9085 | 1.0000 | 0.8301 | 0.7237 | 0.8996 |
| CAASIM | 1.0000 | 0.8967 | 0.8206 | 0.9787 | 1.0000 | 0.9142 | 0.8459 | 0.9886 |
| CAAMTROH | 0.8721 | 0.7779 | 0.7137 | 0.8532 | 1.0000 | 0.9371 | 0.9108 | 0.9742 |
| CAEV | 0.5743 | 0.5191 | 0.4860 | 0.5563 | 0.6757 | 0.6458 | 0.6294 | 0.6698 |
| CMAPS | 1.0000 | 0.8104 | 0.7153 | 0.9049 | 1.0000 | 0.8417 | 0.7671 | 0.8967 |
| CESPT | 1.0000 | 0.8933 | 0.8102 | 1.0809 | 1.0000 | 0.9674 | 0.9377 | 1.0557 |
| COMAPA-R | 0.7840 | 0.7046 | 0.6471 | 0.7677 | 0.8321 | 0.7788 | 0.7376 | 0.8450 |
| COMAPA-EM | 0.7556 | 0.6547 | 0.5940 | 0.7283 | 0.8092 | 0.7512 | 0.7094 | 0.8035 |
| CMAS | 0.4733 | 0.4226 | 0.3879 | 0.4600 | 0.5766 | 0.5447 | 0.5229 | 0.5735 |
| DAPASCH | 1.0000 | 0.8875 | 0.8021 | 0.9971 | 1.0000 | 0.9319 | 0.8740 | 1.0803 |
| JAPAM | 1.0000 | 0.8341 | 0.7206 | 1.0631 | 1.0000 | 0.9148 | 0.8458 | 1.0969 |
| JIAPAZ | 0.6424 | 0.5895 | 0.5573 | 0.6278 | 0.8202 | 0.7839 | 0.7567 | 0.8134 |
| SADM | 0.8720 | 0.7872 | 0.7304 | 0.8779 | 0.9902 | 0.9140 | 0.8530 | 1.0137 |
| SAPASNIR | 1.0000 | 0.8139 | 0.6924 | 1.0091 | 1.0000 | 0.9276 | 0.8670 | 1.0857 |
| SAPACG | 0.8550 | 0.7441 | 0.6684 | 0.8352 | 0.9500 | 0.8540 | 0.7821 | 0.9303 |
| SAPAS | 0.9181 | 0.8290 | 0.7625 | 0.9187 | 1.0000 | 0.8922 | 0.8084 | 1.0818 |
| SACMEX | 0.4821 | 0.4256 | 0.3925 | 0.4623 | 0.6197 | 0.5850 | 0.5643 | 0.6128 |
| SIAPASF | 0.9633 | 0.8716 | 0.8064 | 0.9535 | 0.9809 | 0.9239 | 0.8806 | 1.0224 |
| SMAPA | 0.5033 | 0.4492 | 0.4184 | 0.4832 | 0.5796 | 0.5475 | 0.5326 | 0.5672 |
| SIMAPARG | 1.0000 | 0.8818 | 0.7940 | 0.9791 | 1.0000 | 0.9432 | 0.8941 | 1.0819 |
| SIMAPACO | 1.0000 | 0.8276 | 0.7120 | 1.0434 | 1.0000 | 0.9211 | 0.8558 | 1.0883 |
| SIMAS-A | 0.6814 | 0.6088 | 0.5623 | 0.6601 | 0.6851 | 0.6394 | 0.6098 | 0.6938 |
| SOSAPAMIM | 0.5537 | 0.4987 | 0.4615 | 0.5370 | 0.6737 | 0.6424 | 0.6229 | 0.6684 |
| SOAPAP | 1.0000 | 0.8461 | 0.7390 | 1.0099 | 1.0000 | 0.9208 | 0.8554 | 1.0917 |
| SOSAPAZ | 0.8066 | 0.7222 | 0.6622 | 0.7887 | 0.9637 | 0.9103 | 0.8669 | 0.9702 |
| Min | 0.4733 | 0.4226 | 0.3879 | 0.4600 | 0.5766 | 0.5443 | 0.5201 | 0.5672 |
| Mean | 0.8252 | 0.7249 | 0.6567 | 0.8185 | 0.8802 | 0.8132 | 0.7641 | 0.9021 |
| Max | 1.0000 | 0.8967 | 0.8206 | 1.0809 | 1.0000 | 0.9674 | 0.9377 | 1.0969 |
| Std. dev. | 0.1784 | 0.1455 | 0.1241 | 0.1877 | 0.1512 | 0.1317 | 0.1191 | 0.1760 |
| Context Factor | Estimate | Std. Error | t-ratio |
|---|---|---|---|
| Water macro-measuring | −0.23132 | 0.30854 | −0.74973 |
| Water micro-measuring | −0.10930 | 0.31267 | −0.34956 |
| Wastewater treatment | 0.31406 | 0.26304 | 1.19398 |
| Number of connections per M3 of water lost | 0.69709 | 0.31215 | 2.23321* |
| Sewer coverage | 0.01491 | 0.01023 | 1.45680 |
| Note: n = 36 | * Significant at 5% |
© 2020 by the authors. Licensee MDPI, Basel, Switzerland. This article is an open access article distributed under the terms and conditions of the Creative Commons Attribution (CC BY) license (http://creativecommons.org/licenses/by/4.0/).
Share and Cite
Ablanedo-Rosas, J.H.; Guerrero Campanur, A.; Olivares-Benitez, E.; Sánchez-García, J.Y.; Nuñez-Ríos, J.E. Operational Efficiency of Mexican Water Utilities: Results of a Double-Bootstrap Data Envelopment Analysis. Water 2020, 12, 553. https://doi.org/10.3390/w12020553
Ablanedo-Rosas JH, Guerrero Campanur A, Olivares-Benitez E, Sánchez-García JY, Nuñez-Ríos JE. Operational Efficiency of Mexican Water Utilities: Results of a Double-Bootstrap Data Envelopment Analysis. Water. 2020; 12(2):553. https://doi.org/10.3390/w12020553
Chicago/Turabian StyleAblanedo-Rosas, Jose Humberto, Aaron Guerrero Campanur, Elias Olivares-Benitez, Jacqueline Y. Sánchez-García, and Juan Enrique Nuñez-Ríos. 2020. "Operational Efficiency of Mexican Water Utilities: Results of a Double-Bootstrap Data Envelopment Analysis" Water 12, no. 2: 553. https://doi.org/10.3390/w12020553
APA StyleAblanedo-Rosas, J. H., Guerrero Campanur, A., Olivares-Benitez, E., Sánchez-García, J. Y., & Nuñez-Ríos, J. E. (2020). Operational Efficiency of Mexican Water Utilities: Results of a Double-Bootstrap Data Envelopment Analysis. Water, 12(2), 553. https://doi.org/10.3390/w12020553