Case Report

Pollution of Sedimentary Ponds at an Industrial Plant in Janikowo (Poland)

Department of Technology in Environmental Engineering, Bialystok University of Technology, Wiejska 45A, 15-351 Białystok, Poland
*
Author to whom correspondence should be addressed.
Water 2020, 12(2), 536; https://doi.org/10.3390/w12020536
Submission received: 28 November 2019 / Revised: 7 February 2020 / Accepted: 10 February 2020 / Published: 14 February 2020
(This article belongs to the Special Issue Innovations–Sustainability–Modernity–Openness in Water Research)

Abstract

:
The aim of the work was to determine whether the waste accumulated on the reclaimed sedimentary pond near the Janikosoda Production Plant in Janikowo is still a source of pollution of groundwater. On one of the ponds near the Production Plant in Janikowo, three points were located, in which drilling was done up to the bottom of the layer of solid waste. In each point, samples of sediments were taken to determine electrolytic conductivity and chloride concentration. In order to examine the level of groundwater pollution in the area of the Production Plant, four points around the sedimentary ponds were identified, in which regular monitoring of chloride ions has been carried out since the 1980s. Based on analysis, it was concluded that chlorides are leached from the sediments deep into the soil profile by rainwater and, with high probability, also by water seeping from the adjacent slag pond. Sedimentary ponds are still an important source of pollution released into soils and groundwater around the plant. Nevertheless, chloride concentration in solid waste and groundwater in the area of sedimentary ponds has decreased in the last 20 years.

1. Introduction

The turn of the 19th and 20th centuries was synonymous with the rapid development of industry, which often led to major changes in all elements of the natural environment (soils, groundwater, surface water, air, plants, animals) [1,2,3,4]. A great example of this is the chemical industry related to the production of soda ash—formerly by the Leblanc method, now by the Solvay method. The implementation of the Solvay process was supposed to be a step towards ecologization of the production of soda ash [3,5]. The raw materials used in the production are primarily brine, limestone and coke. Nevertheless, in this technology, high quantities of solid and liquid waste are generated [2,5,6,7,8,9].
Wastewater from the Janikosoda Production Plant (Poland)—a producer of, among others, soda ash—is characterized by a liquid consistency, an alkaline reaction and high concentration of calcium salts (in the form of hydroxides, carbonates, and chlorides). This wastewater, after initial treatment, is discharged to sediment ponds, where its temperature is lowered and the suspended matter settles to the bottom, forming solid waste [8,9]. For each kilogram of soda ash, approximately 0.5 kg of sodium chloride and 1 kg of calcium chloride is formed [3,4]. A significant amount of liquid form, high salt concentration and high wastewater reactions create technical, economic and ecological problems. The deposition of strongly saline waste products in the sedimentary ponds without proper sealing, located directly on permeable grounds, contributes to the salinisation of groundwater, surface water and soils [3,5,6,8,10,11,12,13,14,15,16,17,18].
Contact with waste from the soda ash industry changes the properties of soils and groundwater. They are characterised by higher electrolytic conductivity (EC) and sodium, chlorides and calcium concentrations [8,9,10,12,15,17,19]. Chlorides became an excellent indicator of the surface and underground water pollution caused by waste from soda production [10,20]. These ions remain in the environment dissolved in water or in the form of easily soluble salts, because they do not form insoluble compounds and are not sorbed by soil material or bottom sediments in surface waters. They are also not emitted to the atmosphere. Such properties of chloride ions mean that they accompany the water cycle from their source [5,20,21,22,23].
The aim of the work was to determine whether the waste accumulated on the reclaimed sedimentary ponds near the Janikosoda Production Plant in Janikowo is still a source of pollution of groundwater.

2. Materials and Methods

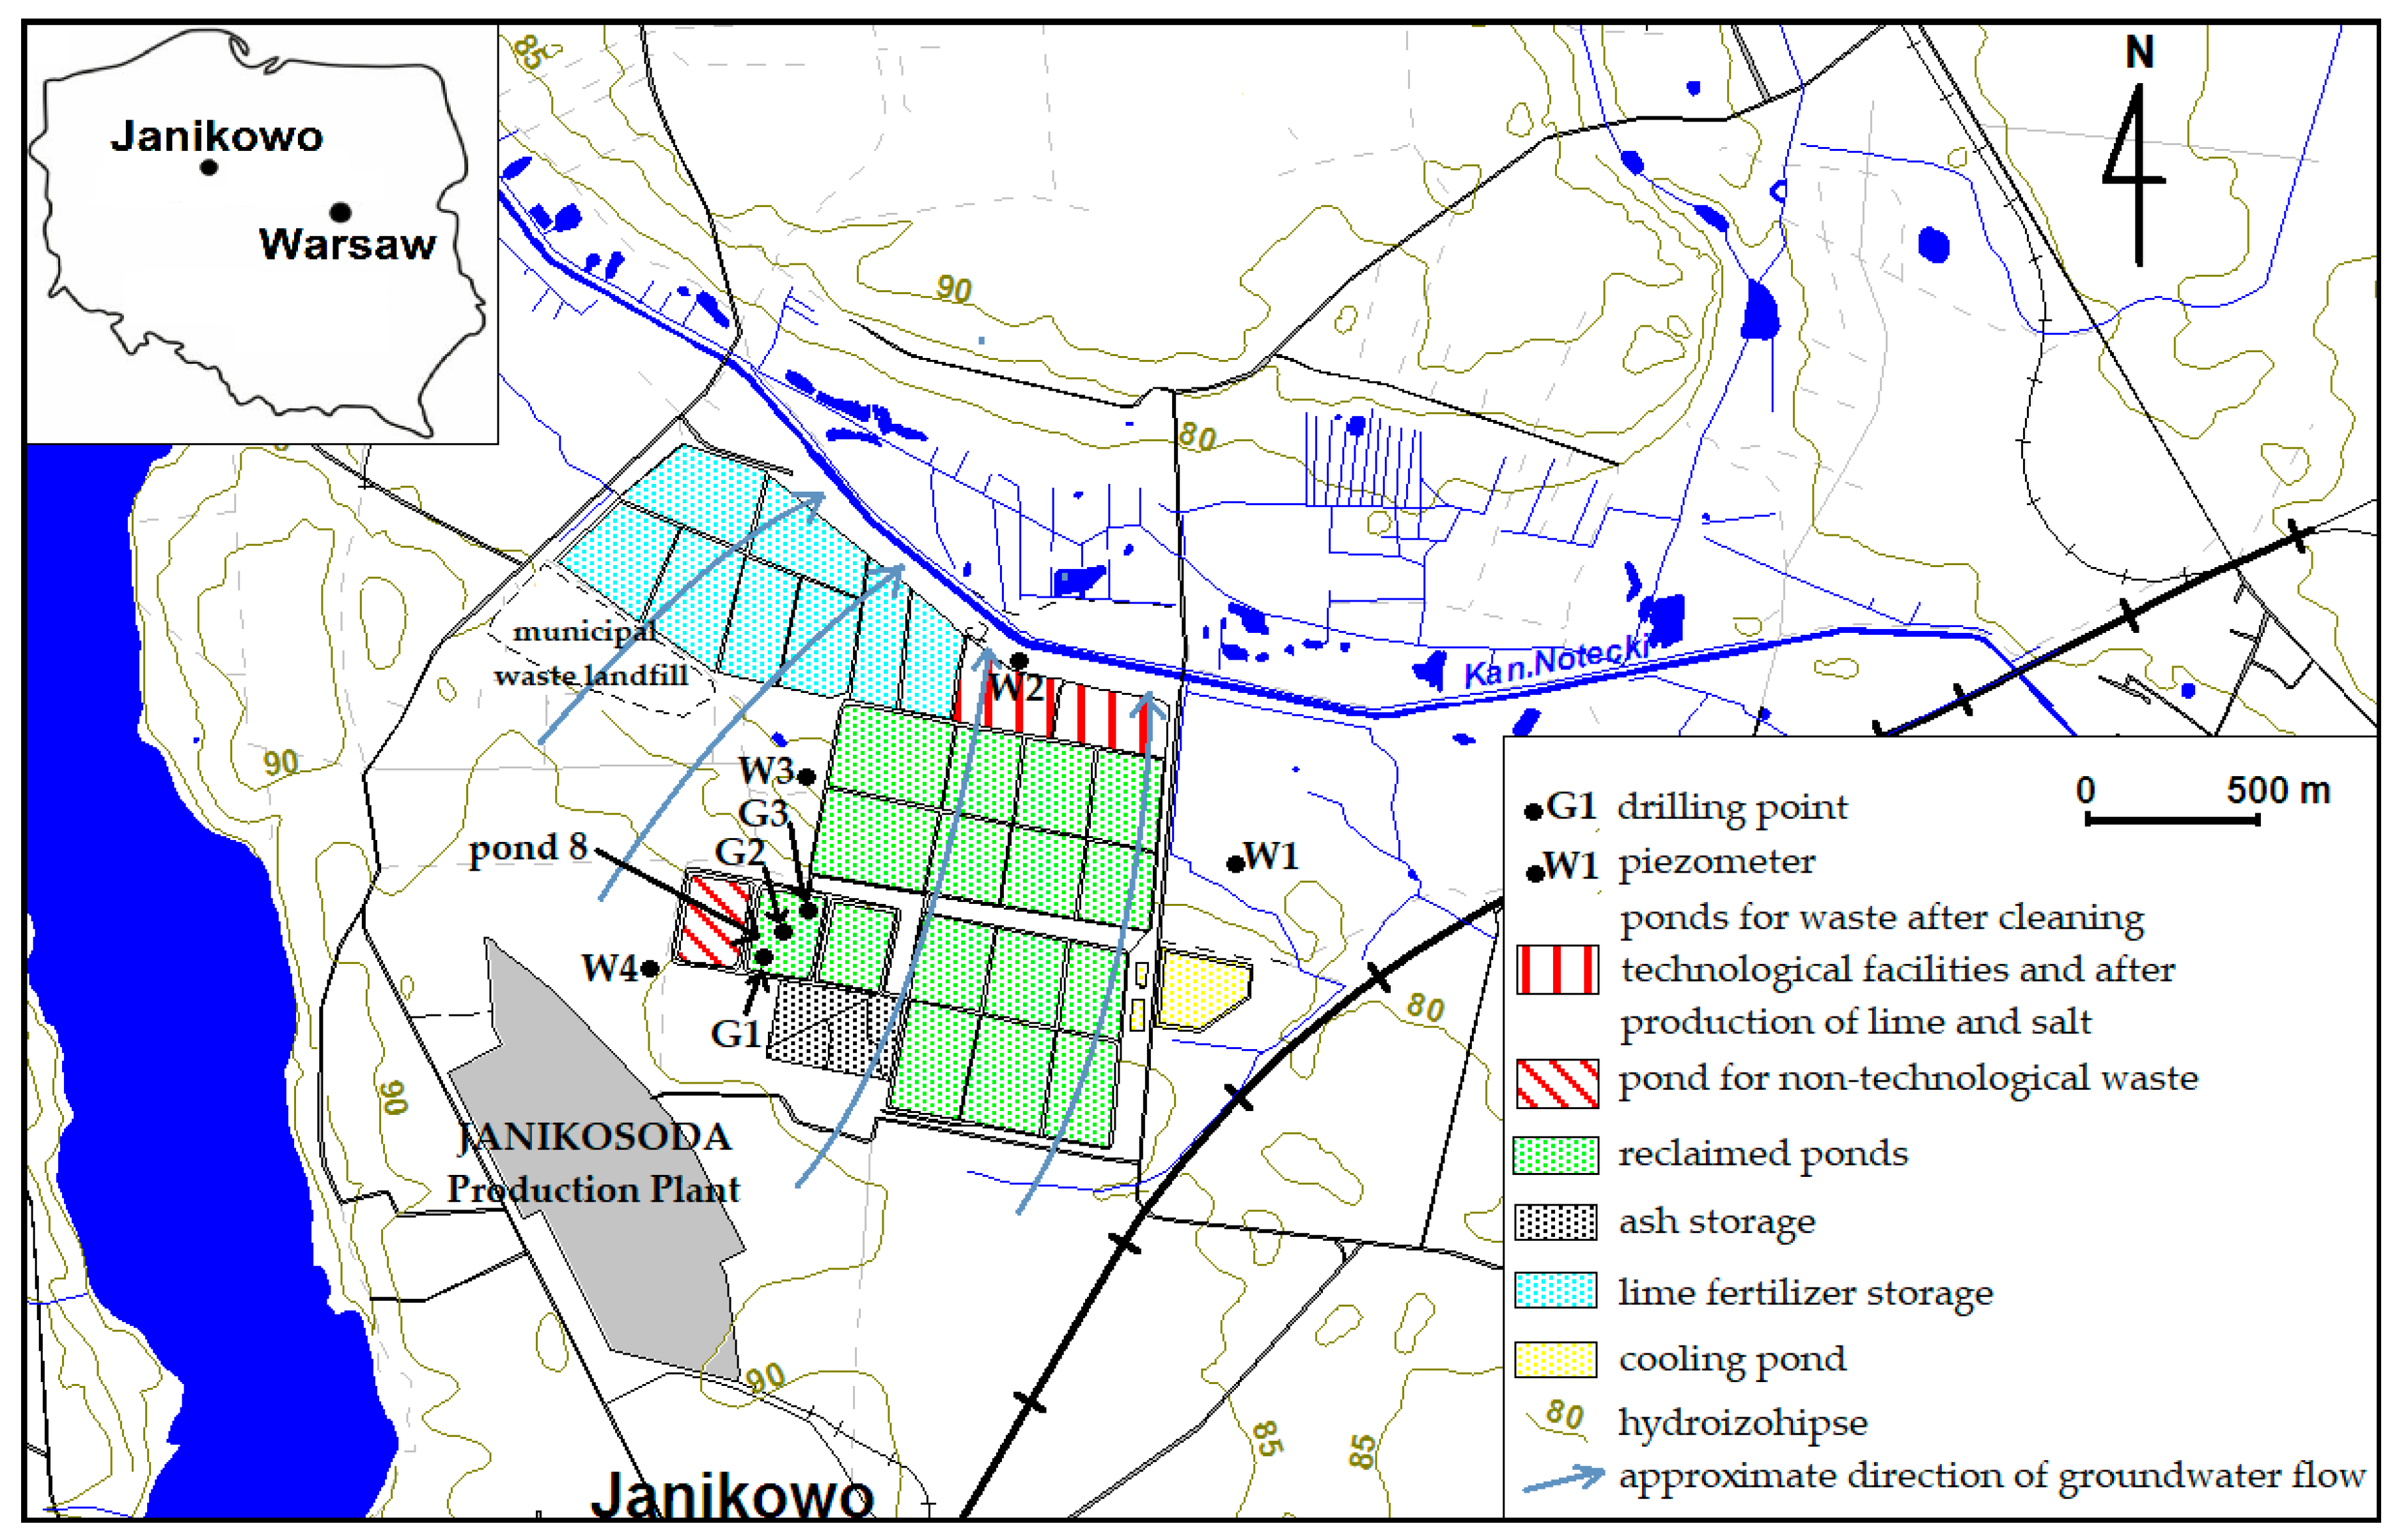
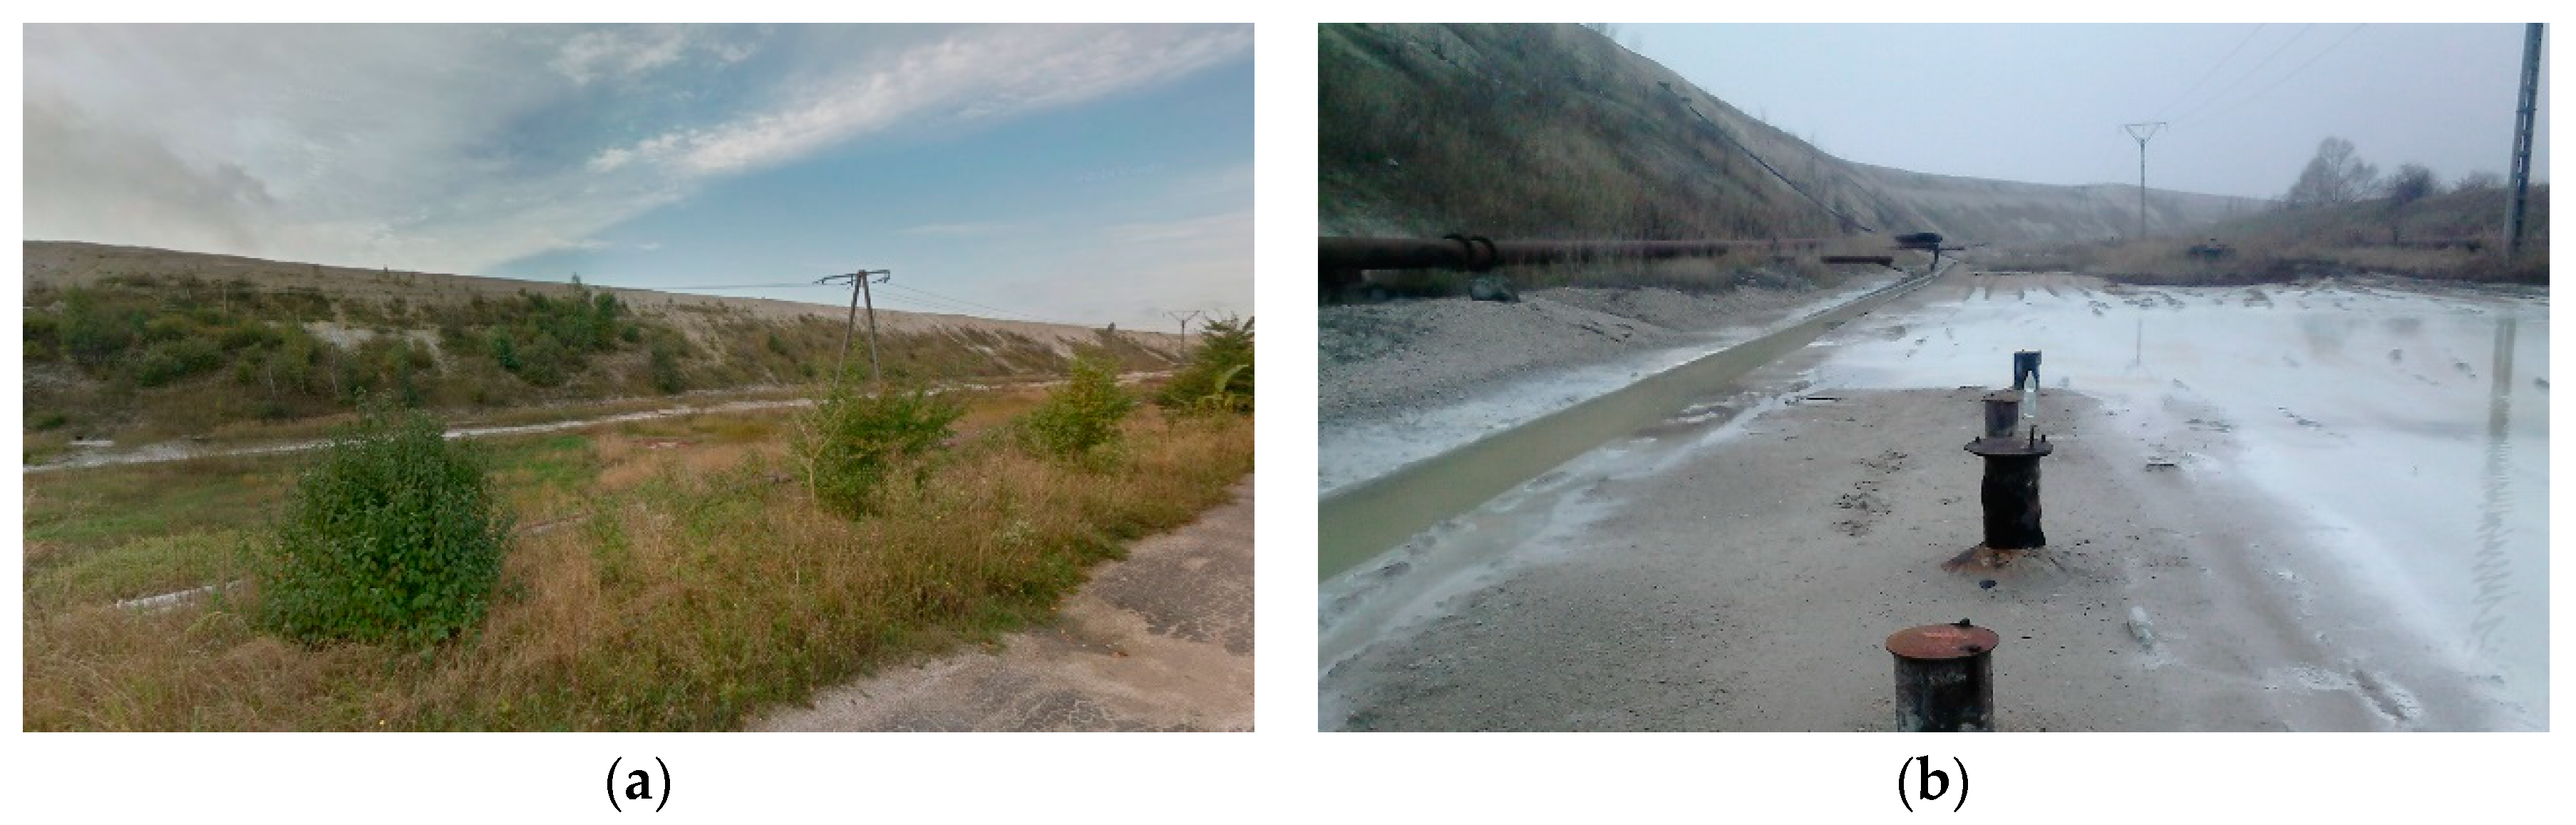
2.1. Characteristics of the Research Area

Sedimentary ponds of the Janikosoda Production Plant are located at the northern end of Janikowo. Some of them are unused and are now reclaimed. Others are ash and lime fertilizer storages. There is a municipal waste landfill in the direct neighborhood of lime fertilizer storage (Figure 1).
Deposition of the suspension from the discharged wastewater at the bottom of the ponds resulted in the necessity of raising their walls. Nowadays, ponds form a heap ofseveral meters above the natural ground level (Figure 2). In the past, the most polluted wastewater was discharged to pond 8 (Figure 1). According to the plant’s internal documentation (not published), initially, it was the effluent formed in the production of soda ash that was characterized by a concentration of chloride ions in the range 70–80 g/dm3. In the years 1988–1991, leachate from Salt Works was directed there, in which the chloride concentration was even 200 g/dm3. After 1991, the pond was no longer flooded, and in 2002 its surface was reclaimed. Sedimentary pond 8 borders with a pond to which slags have been directed since at least 1985, with lower salt concentrations than wastewater from soda production (Figure 1).
At pond 8, three points were located: G1–G3 (Figure 1), in which drilling was made up to the bottom of the waste layer, i.e., 12.7–13.9 m below ground level. The soil profile of each point is shown in Figure 3.
In order to examine the level of groundwater pollution in the area of the production plant, four points around the sedimentary ponds were identified, W1–W4 (Figure 1), in which regular monitoring of water quality has been carried out since the 1980s. All the piezometers have a filter in the Quaternary aquifer. Their specification is shown in Table 1.

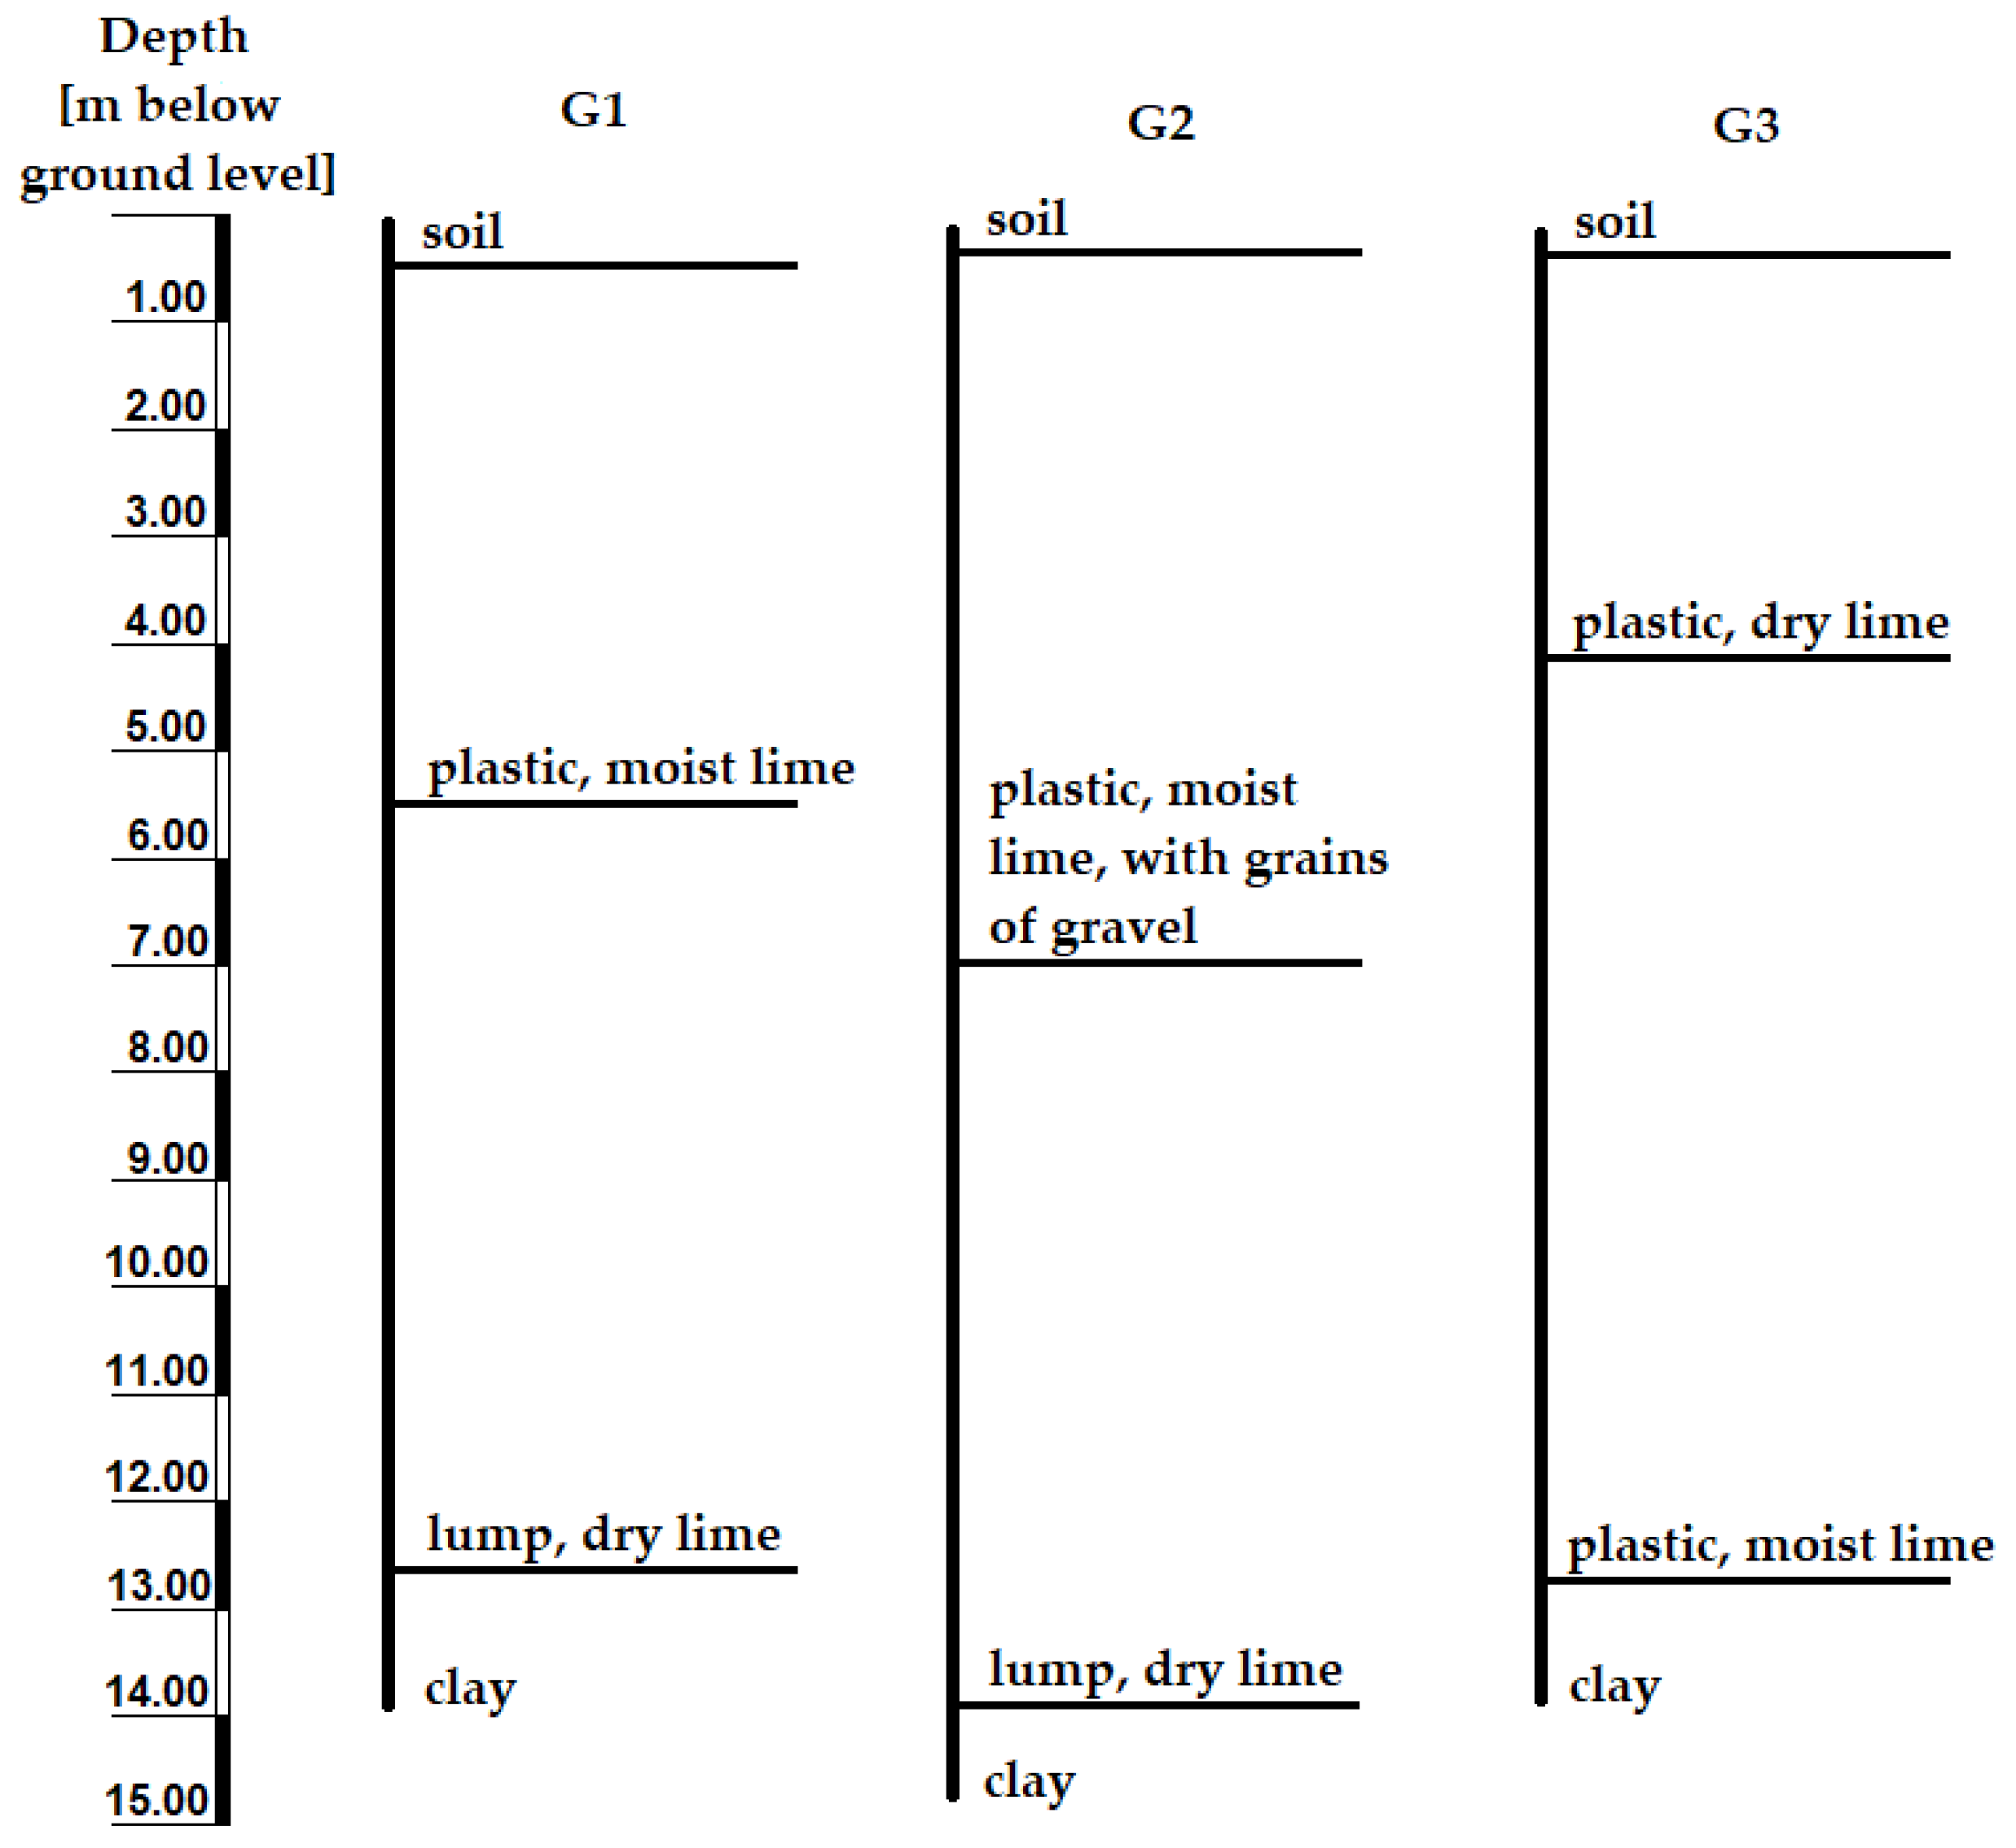
2.2. Examination of Waste and Groundwater Samples

During drilling works, sediment samples were taken every 1 m deep at points G1–G3 (Figure 1). In order to examine the EC of the sediment water extract, 50 g of waste (without drying) was weighted into a vessel and then 100 g of distilled water was added. The contents of the vessel were shaken for about 1 minute. The EC was measured directly in the field.
In addition, the chloride content was determined in two samples of soil from each point, one from the top and another one from the bottom of the layer of plastic, moist lime. The purpose of this was to assess if chlorides had already been rinsed out of the layer where the water flow was the highest. The chlorides were determined by applying the Mohr method in accordance with EN 12457-2:2002 [24] and ISO 9297:1989 [25].
The sampling of water for analyses was carried out in accordance with ISO 5667-20:2008 [26], with a frequency resulting from the production plant’s environmental monitoring programs applicable in a year of measurements. Chloride ion concentrations, determined in accordance with ISO 9297:1989 [25], were analyzed in all measurement history available for these points.

3. Results and Discussion

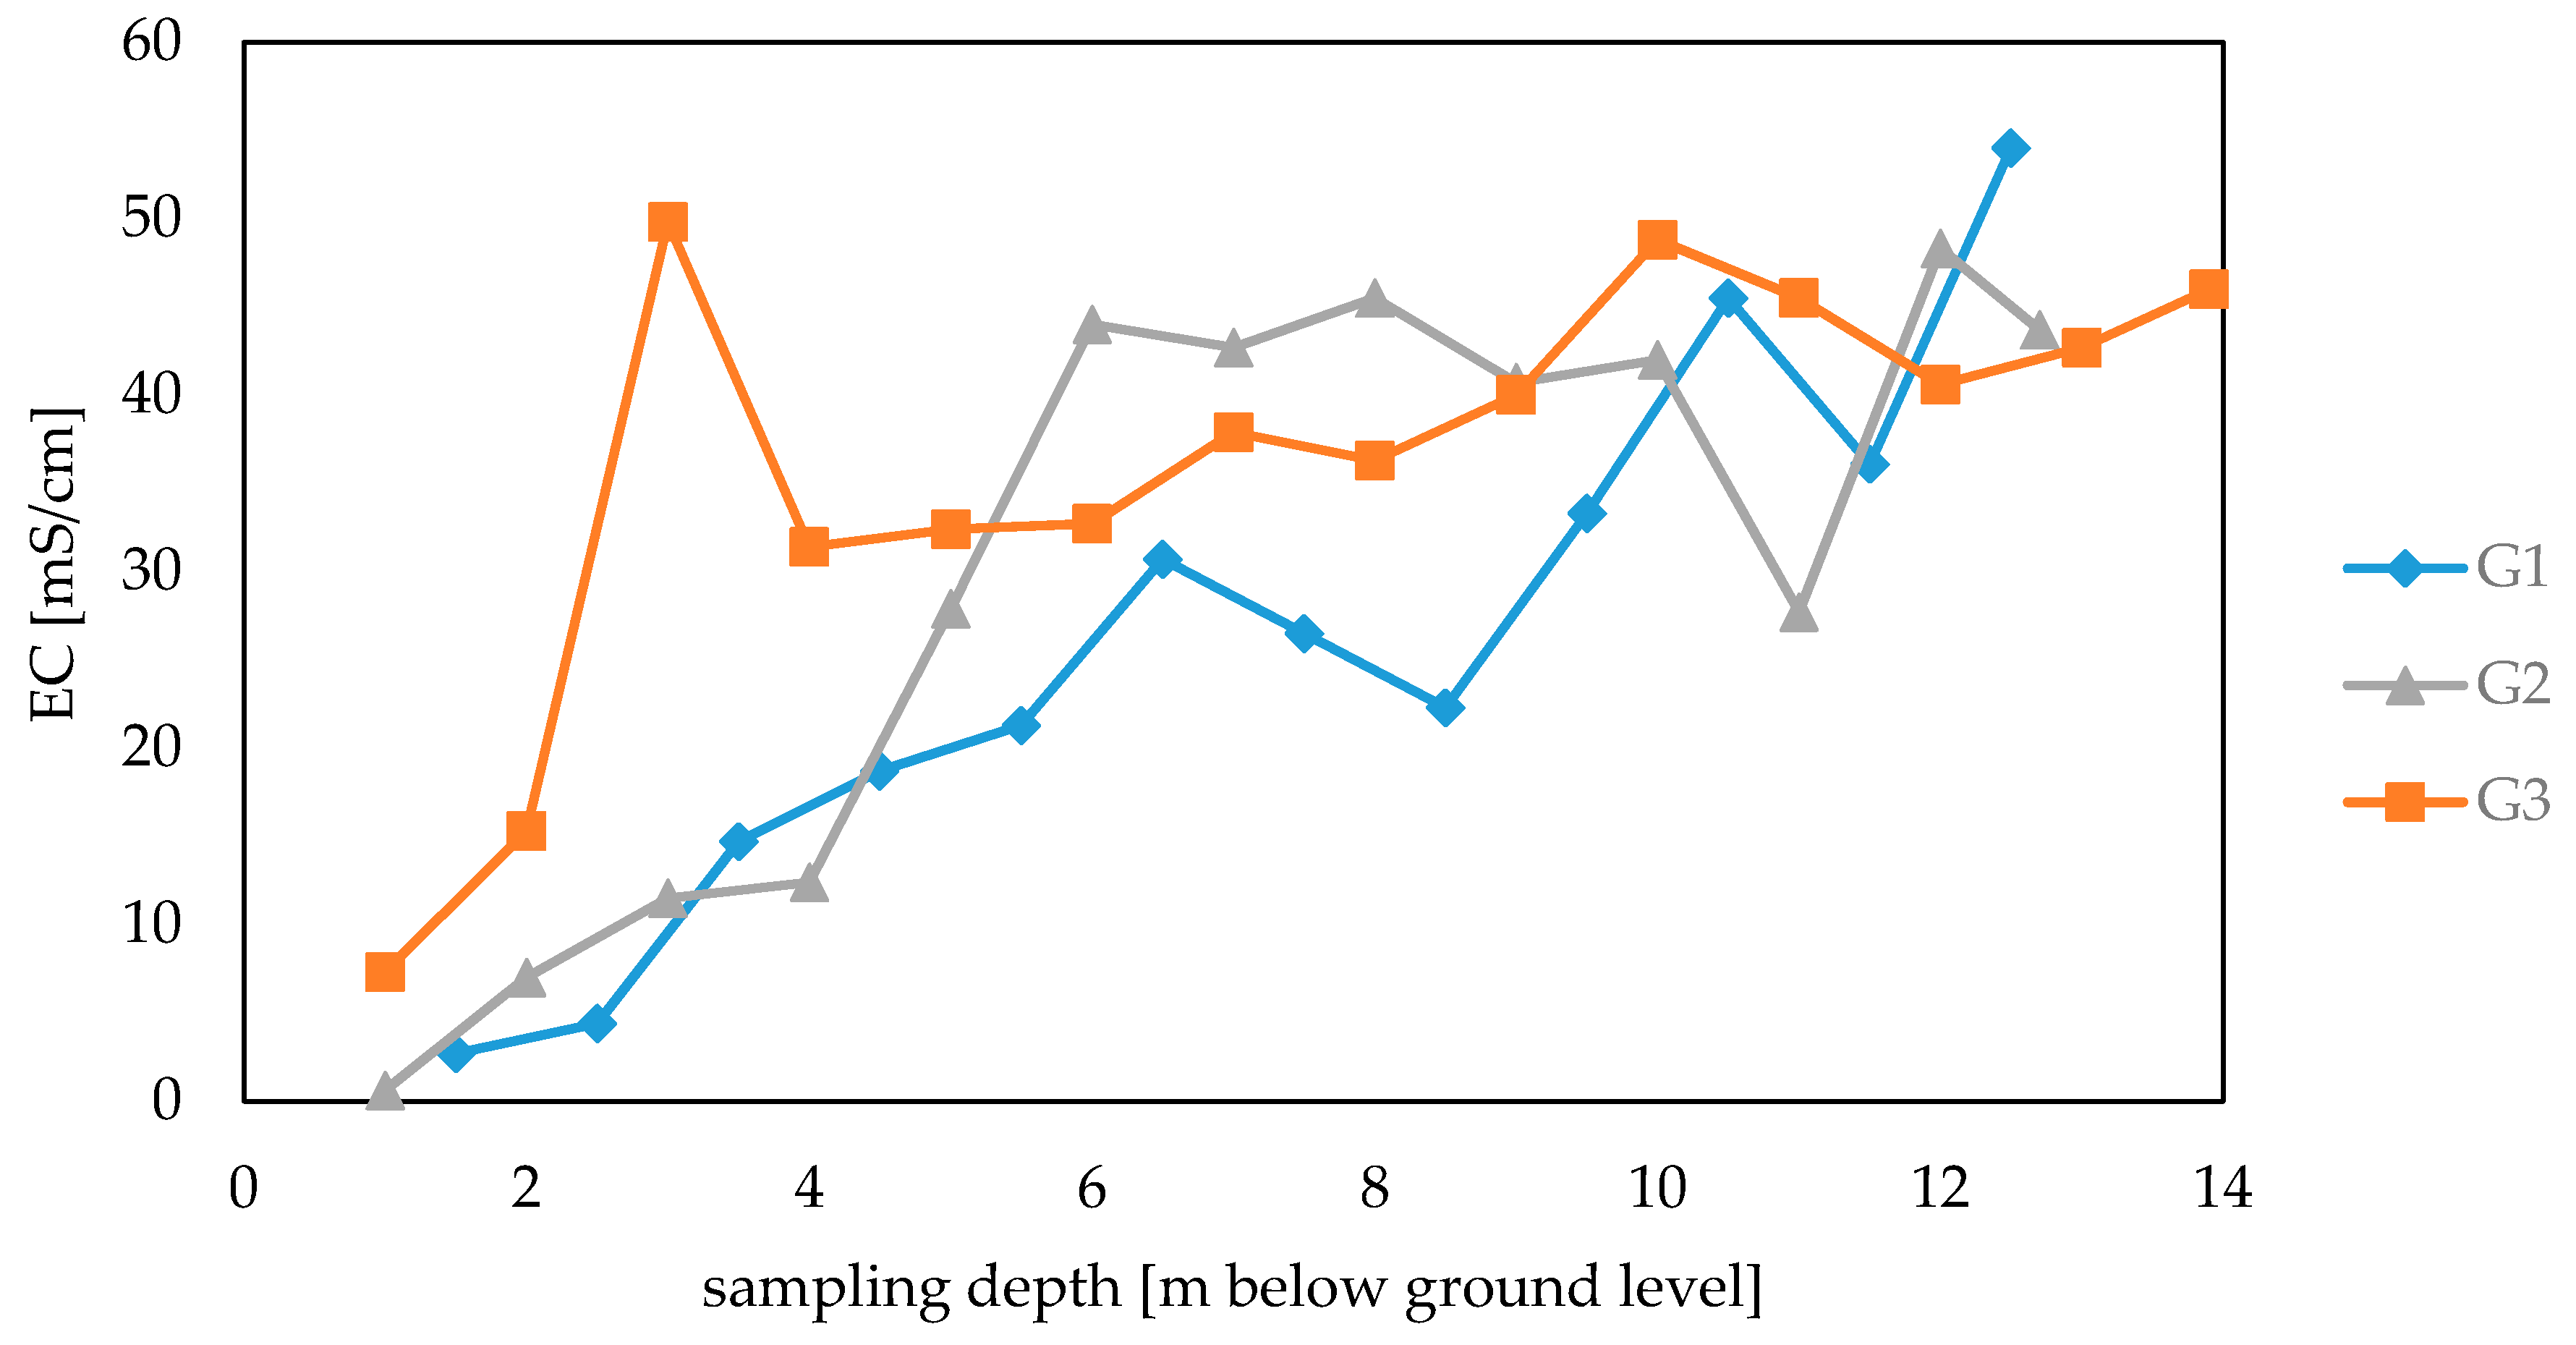
3.1. Electrolytic Conductivity of Waste Samples

The results of the EC of water extracts of the solid waste taken are presented in Figure 4. They show that the pond is characterized by a rapid increase in conductivity with depth. The lowest one occurs just below the layer of soil or embankment and ranges from 0.6 to 7.3 mS/cm. However, the highest values in points G1 and G2 are in the bottom layer of waste, at a depth of over 12 m below ground level, and range from 48.3 to 54 mS/cm. In point G3, the highest value occurs at a depth of 3 m below ground level and is equal to 49.8 mS/cm. The most rapid increase in the EC is observed in the upper layer of drilled sediments, up to about 6 m below ground level in the points G1 and G2 (where it reaches the value of 30–45 mS/cm) and up to about 3 m below the ground level in point G3 (where it is equal to 50 mS/cm). Below those depths, a further large increase is observed only at point G1. In other points, values are changing in a similar range.
It is worth noting that at point G1, which is located closest to the slag ponds, a gradual increase in electrolytic conductivity is observed, reaching the maximum at the bottom of the waste layer (Figure 4). It is different at points G2 and G3, which are further away from the slag ponds; there, high values already occur at smaller depths, after which they remain at a similar level. This may indicate the filtration of less polluted waters from the sedimentary pond, leaching ions from surface of waste heap and transporting them to the lower layers at point G1 [27,28,29]. This phenomenon does not occur at G2 and G3, hence the ions are washed away there much more slowly (only by infiltrating rainwater) and their higher concentrations persist at small depths.
Research carried out by Wiatrowska et al. (2018) [30] consisted, among other things, of measuring the EC in soil samples taken from two depths from the area adjacent to the sedimentary ponds of the soda ash plant in Inowrocław. At the first depth (0–0.2 m below ground level), the EC was found to be from 0.91 to 15.43 mS/cm (the average result was 2.05 mS/cm), while deeper (0.8–1 m below ground level), the EC was observed in the range 1.06–87.2 mS/cm (the average result was 9.87 mS/cm). Piernik et al. (2015) [17] obtained even higher EC values in the upper soil layer near the plant in Inowrocław. The results ranged from 16.2 to 141 mS/cm (when the average value was 58 mS/cm). These results testify to the high concentrations of ions in the ground in the area of sedimentary ponds, which are therefore still a source of the release of ions that cause high EC and the spread of salinity to areas adjacent to the ponds.
Ion concentrations, the indirect measure of which is EC, are still very high in the waste forming the heap. The process of leaching them from the aeration zone of soils is very slow [5,31]. This is why they will be a source of pollution of the surrounding lands and groundwater for many more years. For comparison, the Soda Production Plant SOLVAY in Cracow (Poland) ended their production activity in 1990. In the topsoil on the area of former sedimentary ponds, the EC is in the range of 0.2–1.59 mS/cm [9]. Research carried out in 2013 [32] proved the still existing, significant impact of former settlers on the deterioration of water quality in the Wilga river. However, a lower level of pollutant penetration into the river, compared to previous years, was observed [32]. Another study [5] shows that there is still impact of an over one hundred-year-old heap of soda ash waste in Jaworzno (Poland) on the soil environment in its vicinity. Production by the Solvay method took place there from 1885 to 1909, but concentrations of metals characteristic for this industry are still higher than those of Polish soils generally [5].

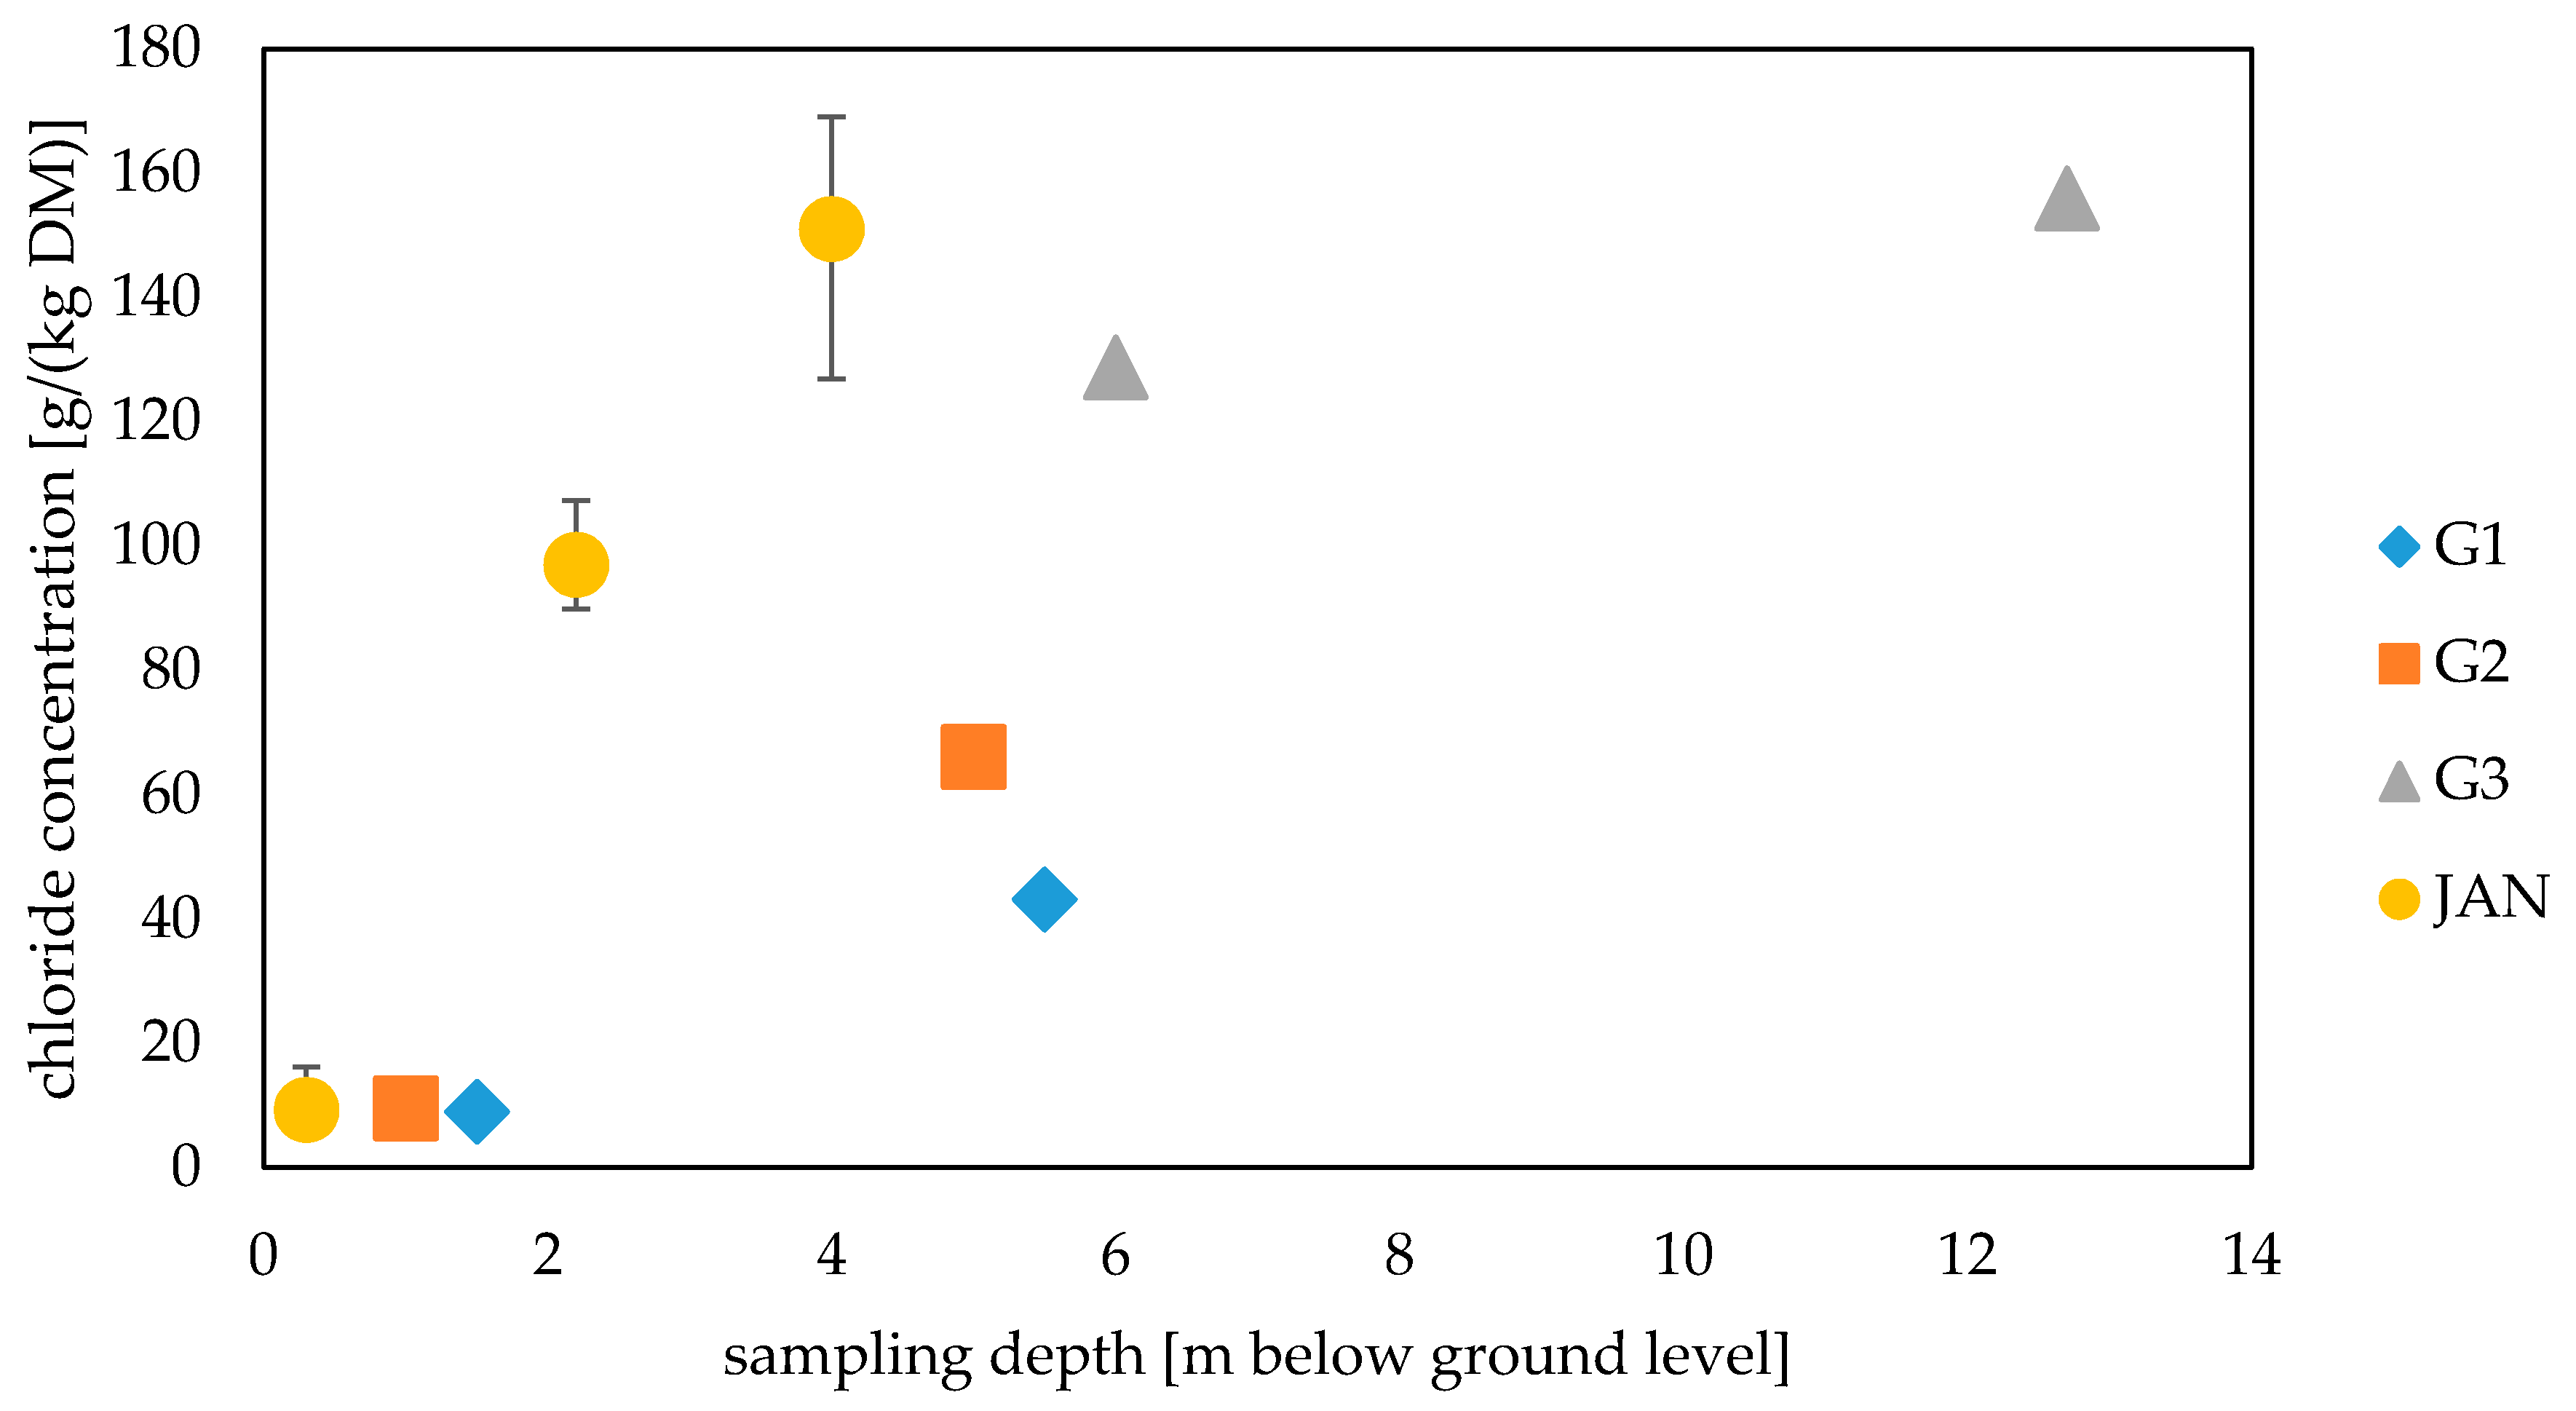
3.2. Chloride Ion Concentration in Waste Samples

Figure 5 shows the concentration of chloride ions in samples of solid waste taken at pond 8. Similarly to electrolytic conductivity, the chloride content in the sediments increases with depth. In the layer at the ground, it is less than 10 g/(kg DM) (in G1 and G2 points); at a depth of 5–6 m below ground level, it is much higher (43–66 g/(kg DM), in points G1 and G2, respectively, or almost 130 g/(kg DM) in point G3) and reaches its highest value of about 155 g/(kg DM) in point G3 at a depth of 12.7 m below ground level.
Considering the chloride ion concentration in wastewater directed to pond 8 in the past (up to 200 g/dm3), the results show a reduction in the concentration of these ions, especially in the upper sediment layer (to a depth of 5–6 m below ground level). Comparing them to the results obtained by Janikosoda in the years 1994–1996 (point JAN in Figure 5) [11], it can be seen that the chloride concentration at the surface practically did not change, but a decrease in their content occurred at deeper levels (up to 6 m below ground level) in the last 20 years. At a depth of 5–6 m below ground level, the lowest chloride ion concentration is in the G1 point, slightly higher in the G2 point and the highest in the G3 point. One possible reason for this may be chloride leaching through the leachate from the adjacent slag ponds (Figure 1). In point G1, located closest to these ponds, the degree of reduction of these ions’ concentration is the highest. In the G3 point, furthest from slag ponds, the degree of the decrease is the lowest. Properties of chlorides mean that they are not retained in the soil, but are migrated from the pond washing water (rain or infiltrate from the neighboring slag pond) [1,8]. Concentrations of chloride ions in the sediments near the sedimentary ponds of soda production plants are higher than in the area of municipal or even industrial waste landfills, where they most often reach a maximum of a few g Cl/dm3 [33,34,35,36].
Wiatrowska et al. (2018) [30] tested about 60 soil samples taken from the vicinity of the ponds of the Production Plant in Inowrocław for chloride content. Results for the first depth of 0–0.2 m below ground level ranged from 0.0142 to 1.971 g/(kg DM) (the average result was 0.1093 g/(kg DM)), while for the second depth, 0.8–1 m below ground level, results were in the range of 0.0071–6.271 g/(kg DM) (the average result was 0.6056 g/(kg DM)). Similarly to the high electrolytic conductivity, the high concentration of chlorides in the ground in the area of sedimentary ponds proves that this area is contaminated with waste from the production of soda ash. These results are confirmed by Piernik et al. (2015) [17] and Strzelecka et al. (2011) [10]. The authors have shown that the mean chloride content in soil on agricultural fields neighboring with the production plant in Inowrocław was equal to 35.5 g/dm3 and varied from 9.9 g/dm3 to 115 g/dm3.
One of the possible ways of managing the waste deposits from the production of soda ash is their agricultural use [3,8]. However, it should be remembered that the excess of Cl ions may cause disturbances in the ionic economy of the plant, caused by the limited uptake of K+, Ca2+, Mg2+, and NO3 ions. Disruption of the synthesis of many basic organic compounds is the cause of yellowing of leaves, tissue dieback and inhibition of cell division, among others, cambium cells and apical meristem [37,38,39,40]. For this reason, despite the fact that waste deposits are abundant in calcium, sodium, potassium and magnesium nutrients, their agricultural use for plant fertilizing seems to be excluded due to the high concentration of chlorides.

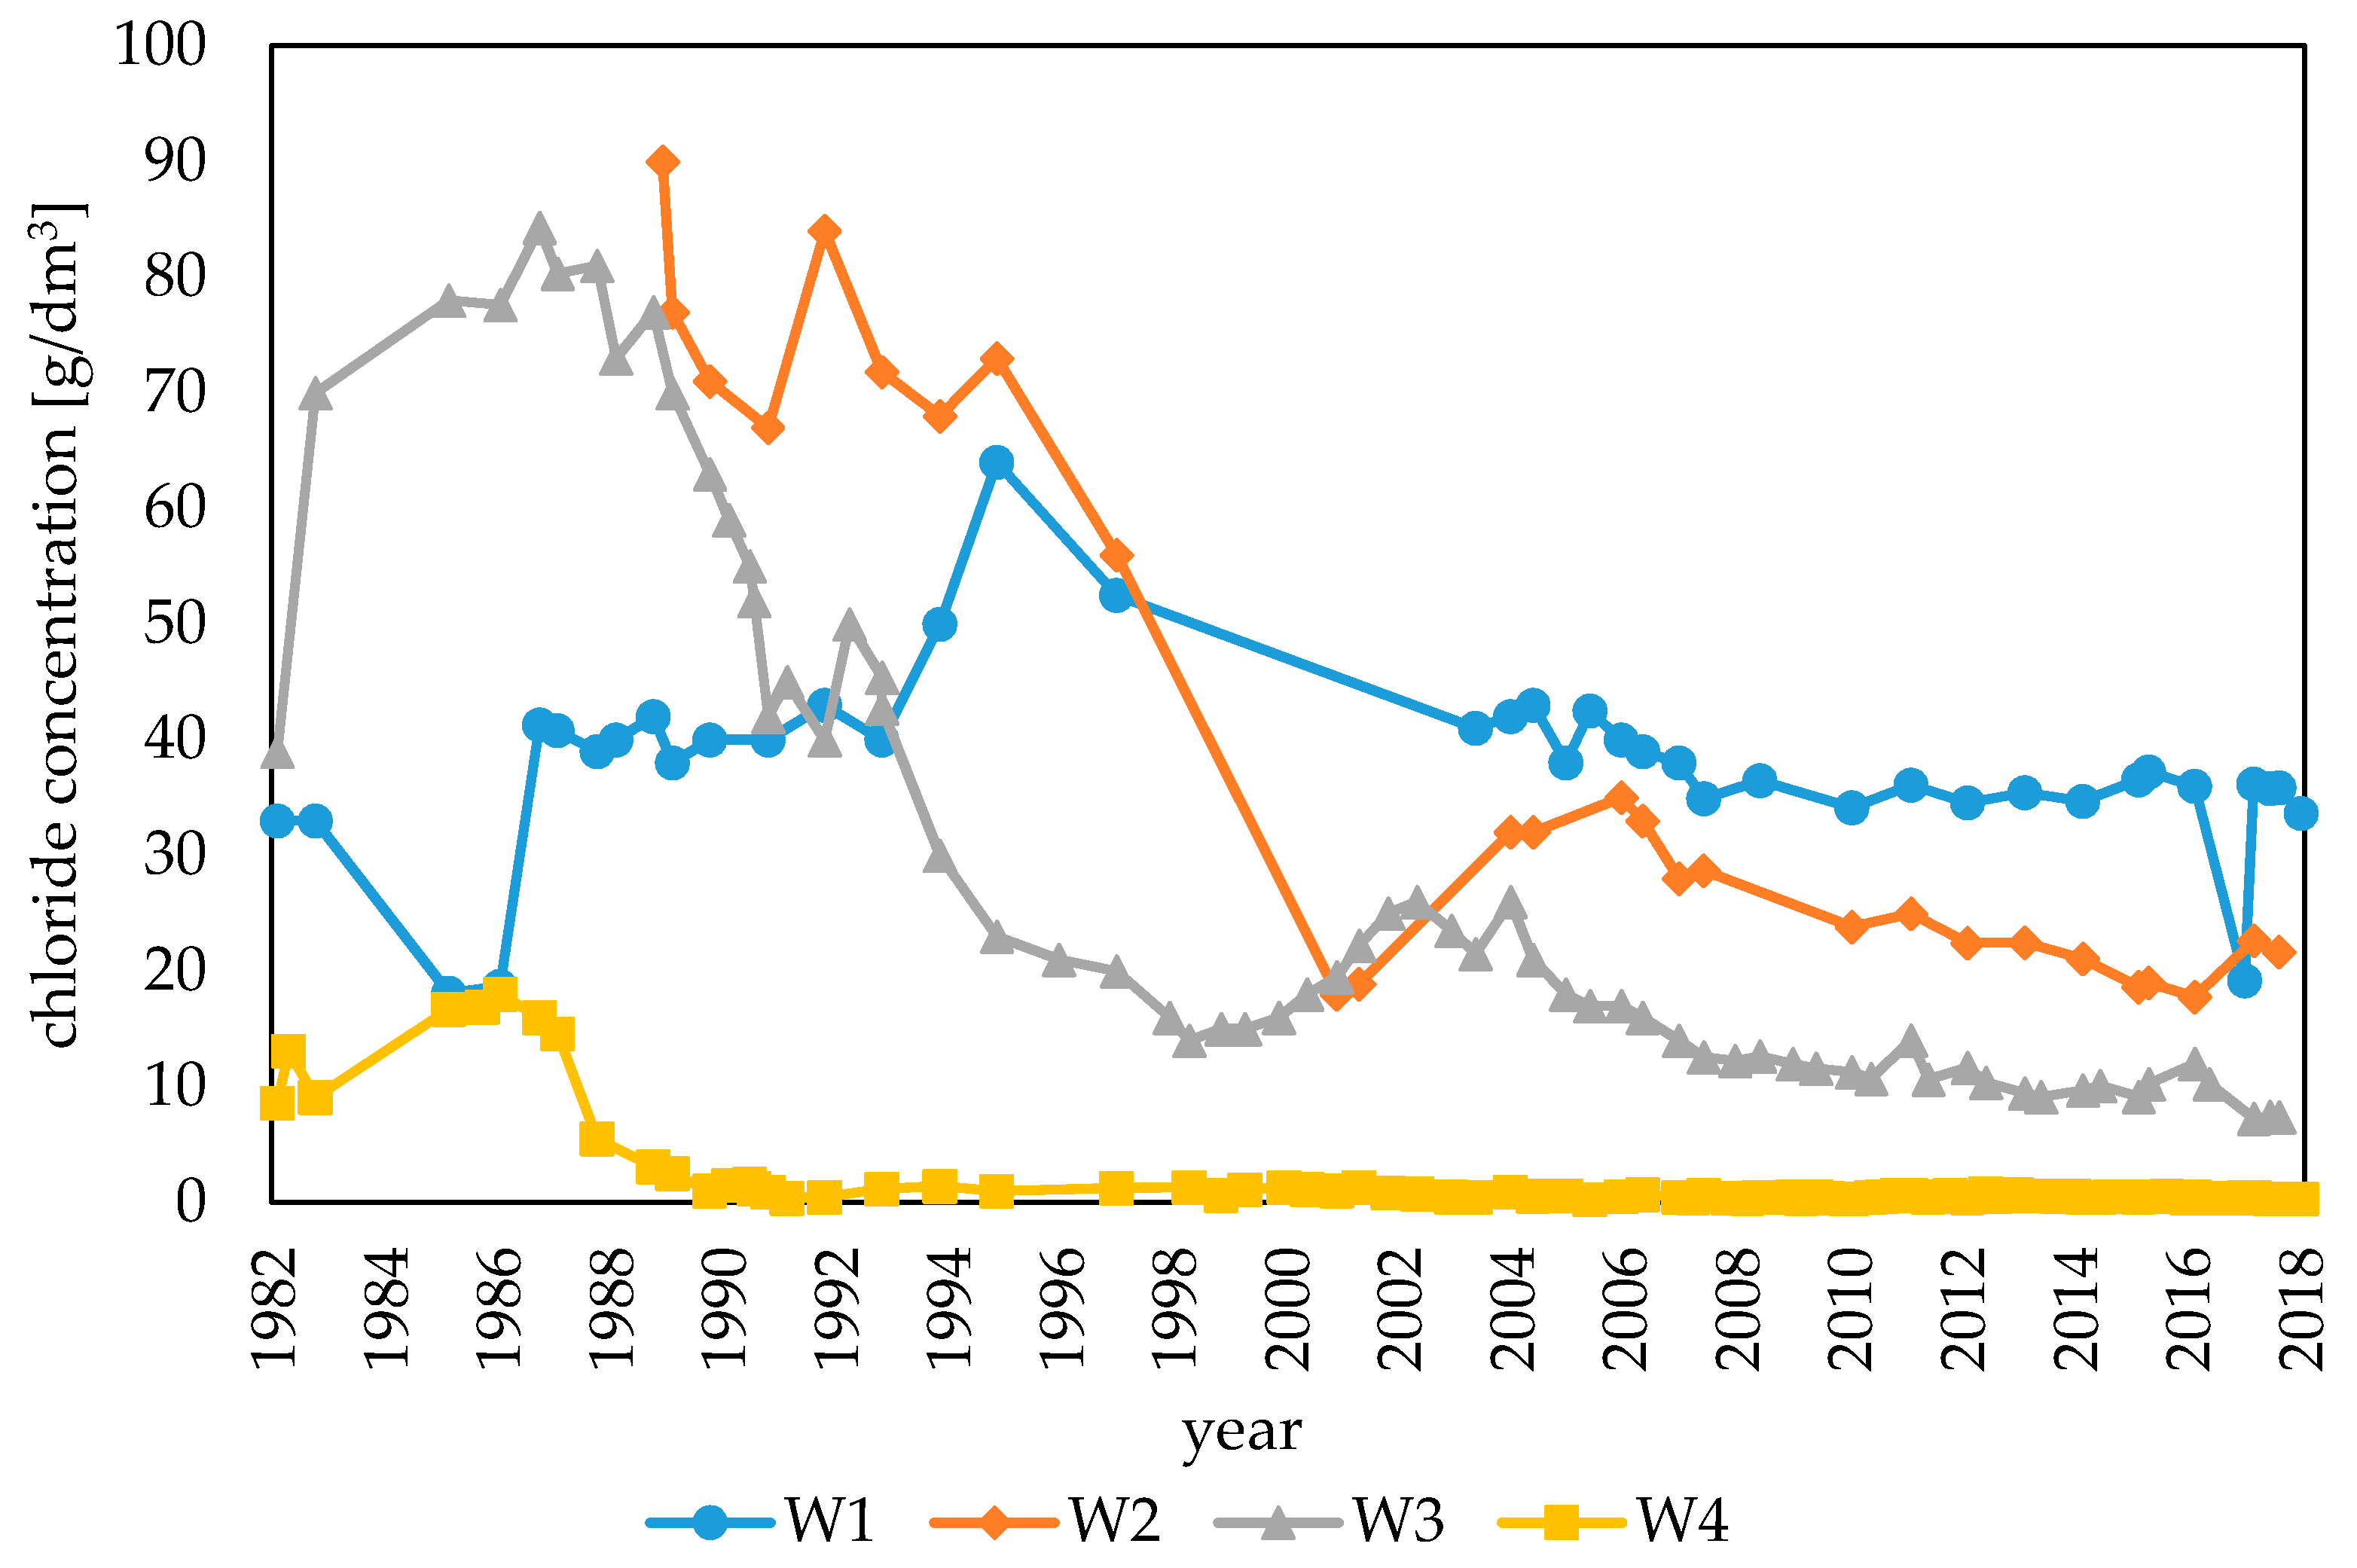
3.3. Chloride Ion Concentration in Groundwater

The concentration of chlorides in groundwater collected from piezometers located around sedimentary ponds is shown in Figure 6. The level of these ions in W1 in the entire history of measurements (since the early 1980s), despite fluctuations, generally remains at a similar level of about 35–45 g/dm3. Concentrations in all other points have decreased since the 1980s, decreasing in W2 in recent years by up to 80%, in W3 by over 90%, while in W4 by almost 100%.
The quality of groundwater indicates its contact with wastewater discharged to the sedimentary ponds. The reason of this may be the leaky bottom of the pond, which means that the leachate created by infiltrating rainfall, penetrating through its subsoil and escarpments, becomes a source of a long-term soil and groundwater pollution [1,2,5]. However, due to the cessation of wastewater discharge to pond 8 and leaching of pollution by infiltrating rainwater [41,42], the content of chloride ions in groundwater is reduced compared to the 1980s. The improvement of its quality is also a result of actions taken by the plant to reduce the environmental impact of waste and limit leachate leaks, such as constructing drainage barriers, limiting use, sealing and reclaiming sludge ponds or starting the waste utilization process.
As a result of testing the shallow groundwater samples by Wiatrowska et al. (2018) [30] near sedimentary ponds in Inowrocław, it was found that their chloride content was in the range of 0.028–16.522 g/dm3, with an average value of 1.364 g/dm3. Similar concentrations are observed at points W2–W4 in Janikowo, however, point W1 is characterized by about twice as high a concentration (Figure 6). A high chloride concentration of up to 51 g/dm3 in groundwater near soda ash production plant is confirmed by Strzelecka et al. (2011) [10] and Kaczor-Kurzawa (2018) [16]. Further from the heap, it already contains less chloride ions (up to 1.76 g/dm3) [15]. Wastewater generated in the soda production process using the Solvay method in the state of Gujarat, in India, is discharged into the Arabian Sea and has a chloride concentration close to 100 g/dm3 [18]. In Polish production plants using the Solvay method, chloride concentration reaches 60–80 g/dm3. Therefore, it should be noted that since the 1980s, when the chloride concentration in groundwater was sometimes equal to the chloride concentration in post-production wastewater, there have been major changes and these levels are now several times lower (Figure 6).
Research conducted by Sapek (2009) [21] included the determination of chlorides in over 3500 samples of groundwater collected in rural areas in various parts of Poland. They showed that the chloride content in the tested samples ranges from 0.034 to 0.272 g/dm3, which is much lower than those obtained in Janikowo. Groundwater is therefore contaminated with waste from the production of soda ash. Pursuant to the Polish Ministry of Environment (2017) [43], water intended for human consumption must not contain more than 0.25 g/dm3 chloride. This requirement is not met at any of the points examined.

4. Conclusions

Based on the results, the following conclusions were drawn:
  • Waste deposits accumulated in the former sedimentary ponds are characterized by high electrolytic conductivity and high concentration of chloride ions, which excludes their agricultural use;
  • Chlorides are leached from the sediments deep into the soil profile by rainwater and, with high probability, also by water seeping from the adjacent slag pond;
  • Sedimentary ponds are still an important source of pollution released into soils and groundwater around the plant;
  • Chloride concentration in waste has decreased in the last 20 years;
  • Quality of groundwater in the area of sedimentary ponds has improved in the last 30 years in terms of chloride ion content, but still is not proper for human consumption.

Author Contributions

A.G. performed the experiment; A.G. and J.P. conceived and designed the experiments, analyzed the data and then wrote the paper. All authors have read and agreed to the published version of the manuscript.

Funding

This research was funded by Ministry of Science and Higher Education, grant number WZ/WBiIŚ/8/2019 and grant number MB/WBiIS/13/2019.

Acknowledgments

The research was carried out as part of research work no. WZ/WBiIŚ/8/2019 and part of the work MB/WBiIS/13/2019 at the Białystok University of Technology and financed from a subsidy provided by the Ministry of Science and Higher Education.

Conflicts of Interest

The authors declare no conflict of interest. The founding sponsors had no role in the design of the study, in the collection, analyses, or interpretation of data, in the writing of the manuscript, and in the decision to publish the results.

References

  1. Wiater, J. Influence of waste disposal sites on the ground water quality and soil properties. Inż. Ekol. 2011, 26, 133–146. [Google Scholar]
  2. Urbańska, J.; Urbański, K. Selected aspects of reclamation of soda waste landfill sites. Geomat. Environ. Eng. 2012, 6, 83–90. [Google Scholar] [CrossRef]
  3. Kasikowski, T.; Buczkowski, R.; Lemanowska, E. Cleaner production in the ammonia–soda industry: An ecological and economic study. J. Environ. Manag. 2004, 73, 339–356. [Google Scholar] [CrossRef] [PubMed]
  4. Matthews, D.A.; Effler, S.W. Decreases in pollutant loading from residual soda ash production waste. Water Air Soil Pollut. 2003, 146, 55–73. [Google Scholar] [CrossRef]
  5. Sutkowska, K.; Teper, L.; Stania, M. Tracing potential soil contamination in the historical Solvay soda ash plant area, Jaworzno, Southern Poland. Environ. Monit. Assess. 2015, 187, 704. [Google Scholar] [CrossRef] [PubMed] [Green Version]
  6. Gromiec, M.; Sadurski, A.; Zalewski, M.; Rowiński, P. Hazards related to water quality. Nauka 2014, 1, 99–122. [Google Scholar]
  7. Sroczyński, W. Prospects of biale morza (the “white seas”) management on the area after former solvay krakow soda works. Zarządzanie Krajobrazem Kulturowym Prace Komisji Krajobrazu Kulturowego 2008, 10, 423–430. [Google Scholar]
  8. Gliniak, M.; Betlej, M.; Mitura, A. The application of the PAN reclamation model on the example of former landfills Cracow soda works Solvay. Inz. Miner. 2015, 16, 131–136. [Google Scholar]
  9. Zając, E.; Zarzycki, J. Revegetation of reclaimed soda waste dumps: Effects of topsoil parameters. J. Elem. 2012, 17, 525–536. [Google Scholar] [CrossRef]
  10. Strzelecka, J.; Dąbrowski, M.; Hulisz, P.; Piernik, A. Changes in soil properties and plant biomass under the influence of soda waste ponds in Inowrocław, Poland. Ecol. Quest. 2011, 14, 69–71. [Google Scholar] [CrossRef] [Green Version]
  11. Siuta, J. Reclamation efficiency of sewage sludge at the post-sodium waste landfill in Janikowo. Inż. Ekol. 2014, 36, 98–119. [Google Scholar] [CrossRef]
  12. Hulisz, P.; Piernik, A. Soils affected by soda industry in Inowrocław. In Technogenic Soils of Poland; Charzyński, P., Hulisz, P., Bednarek, R., Eds.; Polish Society of Soil Science: Toruń, Poland, 2013; pp. 125–140. [Google Scholar]
  13. Gur, N.; Aktas, Y.; Oztekin, E. Utilization of soda ash plant solid wastes in manufacture of cement. Cement. Concr. Comp. 2012, 47, 8866–8873. [Google Scholar]
  14. Çalban, T.; Kavci, E. Removal of calcium from soda liquid waste containing calcium chloride. Energy Sources Part A 2010, 32, 407–418. [Google Scholar] [CrossRef]
  15. Hulisz, P.; Krawiec, A.; Pindral, S.; Mendyk, Ł.; Pawlikowska, K. The impact of environmental conditions on water salinity in the area of the city of Inowrocław (north-central Poland). Bull. Geogr. Phys. Geogr. Ser. 2017, 13, 5–15. [Google Scholar] [CrossRef] [Green Version]
  16. Kaczor-Kurzawa, D. Tectonically conditioned brine leakage into usable freshwater aquifers—Implications for the quality of groundwater exploited in central Poland. In Proceedings of the E3S Web of Conferences, Gdańsk, Poland, 17–22 June 2018; Volume 54, pp. 1–5. [Google Scholar] [CrossRef]
  17. Piernik, A.; Hulisz, P.; Rokicka, A. Micropattern of halophytic vegetation on technogenic soils affected by the soda industry. Soil Sci. Plant Nutr. 2015, 61, 98–112. [Google Scholar] [CrossRef] [Green Version]
  18. Raghunathan, C.; Tewari, A.; Khambhaty, Y.; Jothinayagam, J.T. Effect of soda ash industry effluent on seaweed epiphytic and ambient fauna in in situ condition in northwest coast of India. Nat. Environ. Pollut. Technol. 2007, 6, 1–14. [Google Scholar] [CrossRef]
  19. Kaszubkiewicz, J.; Musiał, A.; Waścińska, A.; Ochman, D. Changes of the physical and physico-chemical properties of selected soils during the processes of salinization and desalinization. Rocz. Glebozn. 2003, 54, 5–25. [Google Scholar]
  20. Sieczka, A.; Koda, E. Evaluation of chlorides transport parameters in natural soils based on laboratory studies. In MendelNet 2017 Proceedings of 24th International PhD Students Conference; Cerkal, R., Brezinova Belcredi, N., Eds.; Mendel University in Brno: Brno, Czech Republic, 2017; pp. 921–926. [Google Scholar]
  21. Sapek, A. Contemporary chloride sources in environment of inland waters. Ochr. Śr. Zas. Nat. 2009, 40, 455–464. [Google Scholar]
  22. Bojarska, K.; Bzowski, Z. Leaching test results of mining wastes from Upper Silesia Coal Basin Mines in aspect of influence on the environment. Gór. Geol. 2012, 7, 101–113. [Google Scholar]
  23. Effler, S.W.; Matthews, D.A. Impacts of a Soda Ash Facility on Onondaga Lake and the Seneca River, NY. Lake Reserv. Manag. 2003, 19, 285–306. [Google Scholar] [CrossRef] [Green Version]
  24. EN 12457-2:2002. Characterisation of Waste-Leaching-Compliance Test for Leaching of Granular Waste Materials and Sludges—One Stage Batch Test at a Liquid to Solid Ratio of 10 L/kg for Materials with Particle Size below 4 mm (without or with Size Reduction). Available online: https://infostore.saiglobal.com/en-us/Standards/EN-12457-2-2002-332867_SAIG_CEN_CEN_765046/ (accessed on 12 February 2020).
  25. ISO 9297:1989. Water Quality—Determination of Chloride—Silver Nitrate Titration with Chromate Indicator (Mohr’s Method). Available online: https://www.iso.org/standard/16952.html (accessed on 12 February 2020).
  26. ISO 5667-20:2008. Water Quality—Sampling—Part 20: Guidance on the Use of Sampling Data for Decision Making—Compliance with Thresholds and Classification Systems. Available online: https://www.iso.org/standard/40003.html (accessed on 12 February 2020).
  27. Krasowska, M.; Banaszuk, P. Leaching of dissolved components from a small agricultural catchment during snowmelt induced high flow event. Woda Środowisko Obszary Wiejskie 2011, 11, 139–157. [Google Scholar]
  28. Krasowska, M. Effect of intense precipitation on the leaching of biogenic compounds from agricultural catchment. Inż. Ekol. 2016, 47, 1–9. [Google Scholar] [CrossRef]
  29. Fajer, M.; Rzetala, M.A. Mill pond sediments as the indicator of the environment of the drainage area (an example of Liswarta River, Odra basin, Poland). Environ. Sci. Pollut. Res. 2018, 25, 5832–5847. [Google Scholar] [CrossRef] [Green Version]
  30. Wiatrowska, K.M.; Komisarek, J.; Marcinek, J.; Kozłowski, M. Evaluation of the soil quality in the vicinity of Inowrocław soda plants. Arch. Environ. Prot. 2018, 44, 58–67. [Google Scholar] [CrossRef]
  31. Vangelas, K.M.; Looney, B.B.; Early, T.O.; Gilmore, T.; Chapelle, F.H.; Adams, K.M.; Sink, C.H. Monitored natural Attenuation of Clorinated Solvents—Moving beyond reductive dechlorination. Remediation 2006, 16, 5–23. [Google Scholar] [CrossRef]
  32. Gliniak, M.; Pawul, M.; Sobczyk, W. Impact of the transport and postindustrial landfills of Cracow Soda Works “Solvay” on the status and quality of water in Wilga river in Krakow. Logistyka 2014, 4, 4295–4302. [Google Scholar]
  33. Wiercik, P.; Szymańska-Pulikowska, A. The influence of municipal waste dumping ground in Wojczyce on groundwater quality. Infrastruktura i Ekologia Terenów Wiejskich 2010, 2010, 151–162. [Google Scholar]
  34. Janas, M.; Zawadzka, A. The impact of industrial waste landfill on the environment. Inż. Ekol. 2017, 18, 64–73. [Google Scholar]
  35. Gałko, G. Influence of landfill leachate on physical and chemical properties of loamy soil. Arch. Waste Manag. Environ. Prot. 2015, 17, 83–92. [Google Scholar]
  36. Ma, W.; Rotter, S.; Hoffmann, G.; Lehmann, A. Origins of chlorine in MSW and RDF: Species and analytical methods. Wit Trans. Ecol. Environ. 2008, 109, 551–558. [Google Scholar] [CrossRef] [Green Version]
  37. Jakubiak, M.; Śliwka, M. Management and reclamation of lands with raised soil salinity degraded by activity of mining industry. Gospod. Surowcami Miner. 2008, 24, 129–138. [Google Scholar]
  38. Małuszyńska, I.; Małuszyński, M.J. Study of soil salinity on growth and advancementof selected plants species. Inż. Ekol. 2009, 21, 32–39. [Google Scholar]
  39. Wójcik, P. Balanced Fertilization of Horticultural Plants; Instytut Ogrodnictwa: Skierniewice, Poland, 2014. [Google Scholar]
  40. Saraswathy, R.; Muralidhar, M.; Sanjoy, D.; Kumararaja, P.; Suvana, S.; Lalitha, N.; Katneni, V.K.; Nagavel, A.; Vijayan, K.K. Changes in soil and water quality at sediment-water interface of Penaeus vannamei culture pond at varying salinities. Aquac. Res. 2019, 50, 1096–1106. [Google Scholar] [CrossRef]
  41. Małecki, Z.J.; Wira, J.; Moshynsky, V.; Małecka, I. The threat of worsening the quality of surface and underground waters caused by an unrecultivated waste dumping site in Tłokinia Kościelna near Kalisz. Inż. Ekol. 2016, 46, 77–87. [Google Scholar] [CrossRef] [Green Version]
  42. Wychowaniak, D.; Koda, E. Assessment of the soil-water system quality in the vicinity of old landfill with a vertical barrier. In Remediation, Reclamation and Revitalization; PZITS Oddział Wielkopolski: Poznań, Poland, 2014. [Google Scholar]
  43. Dz.U. 2017 poz. 2294. Order of the Minister of Environment of 7 December 2017 on the Quality of Water Intended for Human Consumption. Available online: http://prawo.sejm.gov.pl/isap.nsf/DocDetails.xsp?id=WDU20170002294 (accessed on 12 February 2020).
Figure 1. Location of sedimentary ponds (G1–G3 are the waste sampling points, and W1–W4 are the underground water sampling points). Source: own study.
Water 12 00536 g001
Figure 2. Heaps formed by sedimentary ponds: view from the north-east corner (a) and from the north, near piezometer W2 (b). In Figure 2b there is visible flooding area, which began to appear as the height of heaps increased. Source: own study.
Water 12 00536 g002
Figure 3. Soil profiles of points G1–G3. Source: own study.
Water 12 00536 g003
Figure 4. Electrolytic conductivity of water extracts of solid waste collected at the pond 8. Source: own study.
Water 12 00536 g004
Figure 5. Concentration of chloride ions in solid waste samples collected at pond 8 (points G1–G3 were drilled as part of ongoing work; points JAN are the average results with minimum and maximum values obtained by the Janikosoda Production Plant in 1994–1996). Source: own study based on [11].
Water 12 00536 g005
Figure 6. Concentration of chloride ions in groundwater collected from piezometers located around sedimentary ponds. Source: own study.
Water 12 00536 g006
Table 1. Specification of piezometers W1–W4. Source: own study based on internal, not published, plant’s documentation.
PiezometerDate of EstablishmentDepth [m below Ground Level]Depth of the Filter [m below Ground Level]
W119821311.5–12.5
W2198920.119–20
W319821311.5–12.5
W419821311.5–12.5

