Drought Trends in Balochistan


Abstract
Featured Application
Abstract
1. Introduction
2. Methods
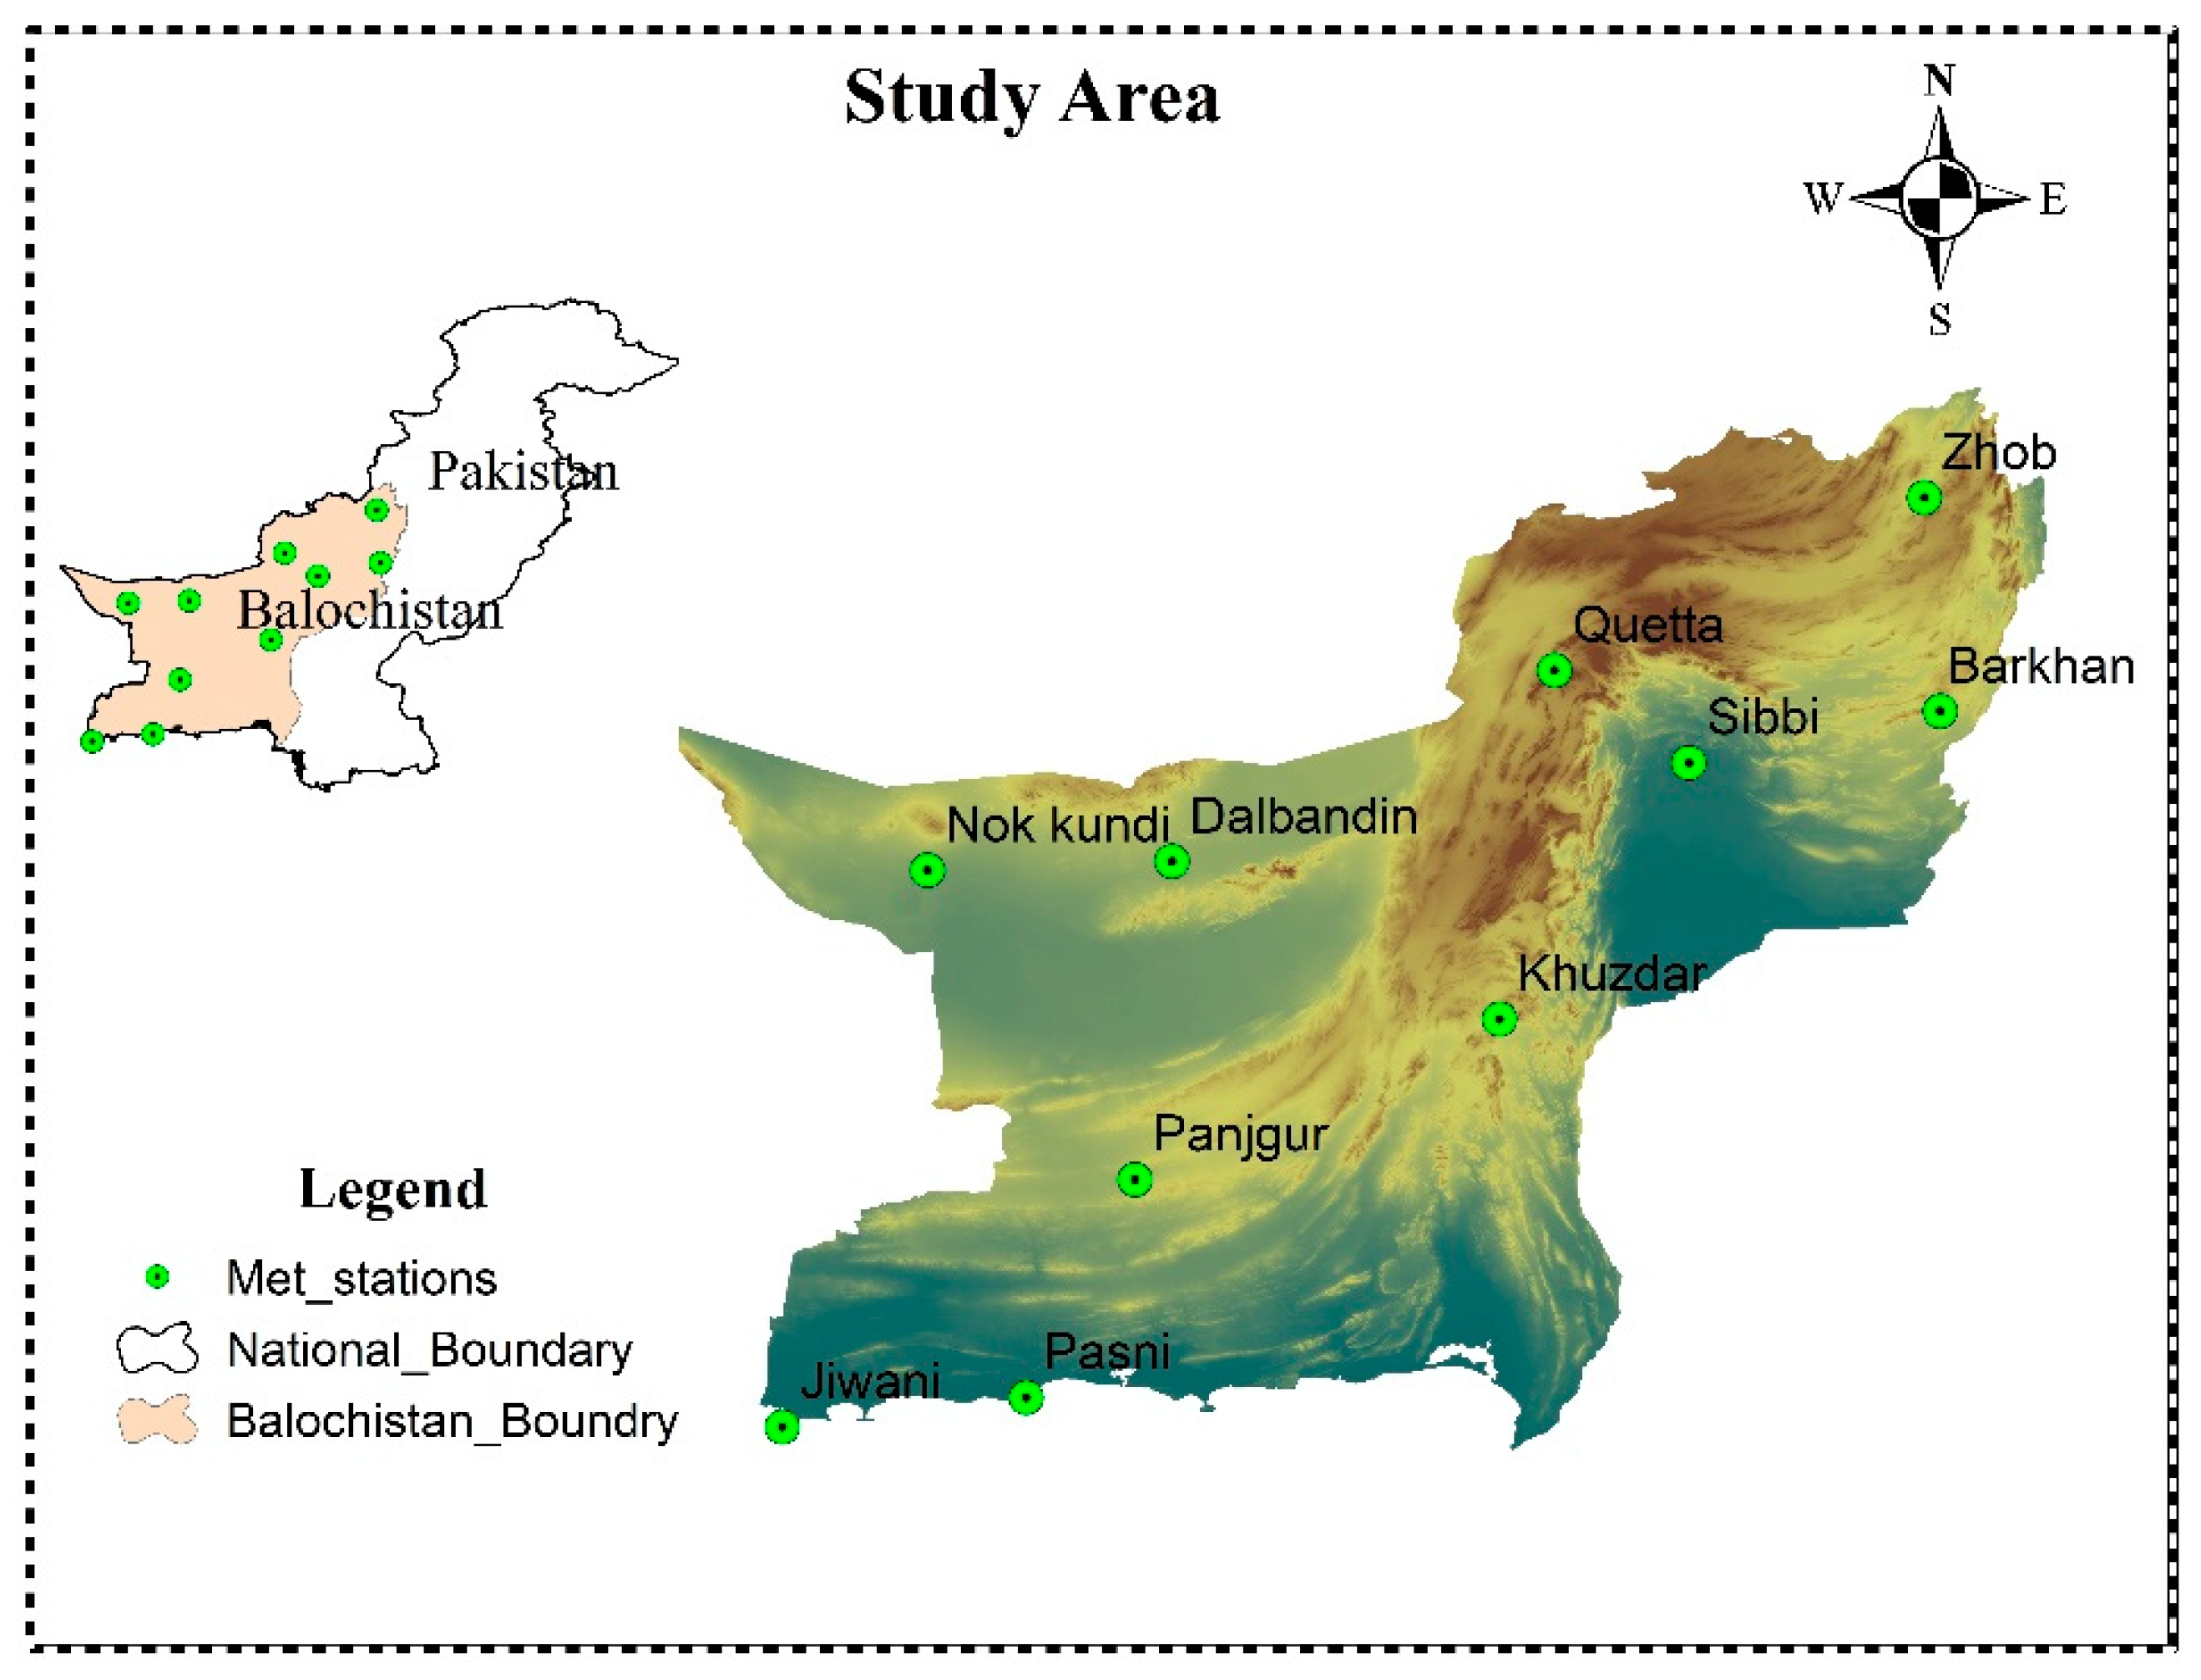
2.1. Study Area
2.2. Methodology
2.2.1. Data Collection
2.2.2. Standardized Precipitation Index
2.2.3. Trend Analysis
2.2.4. Characteristics of Drought
Drought Indicators
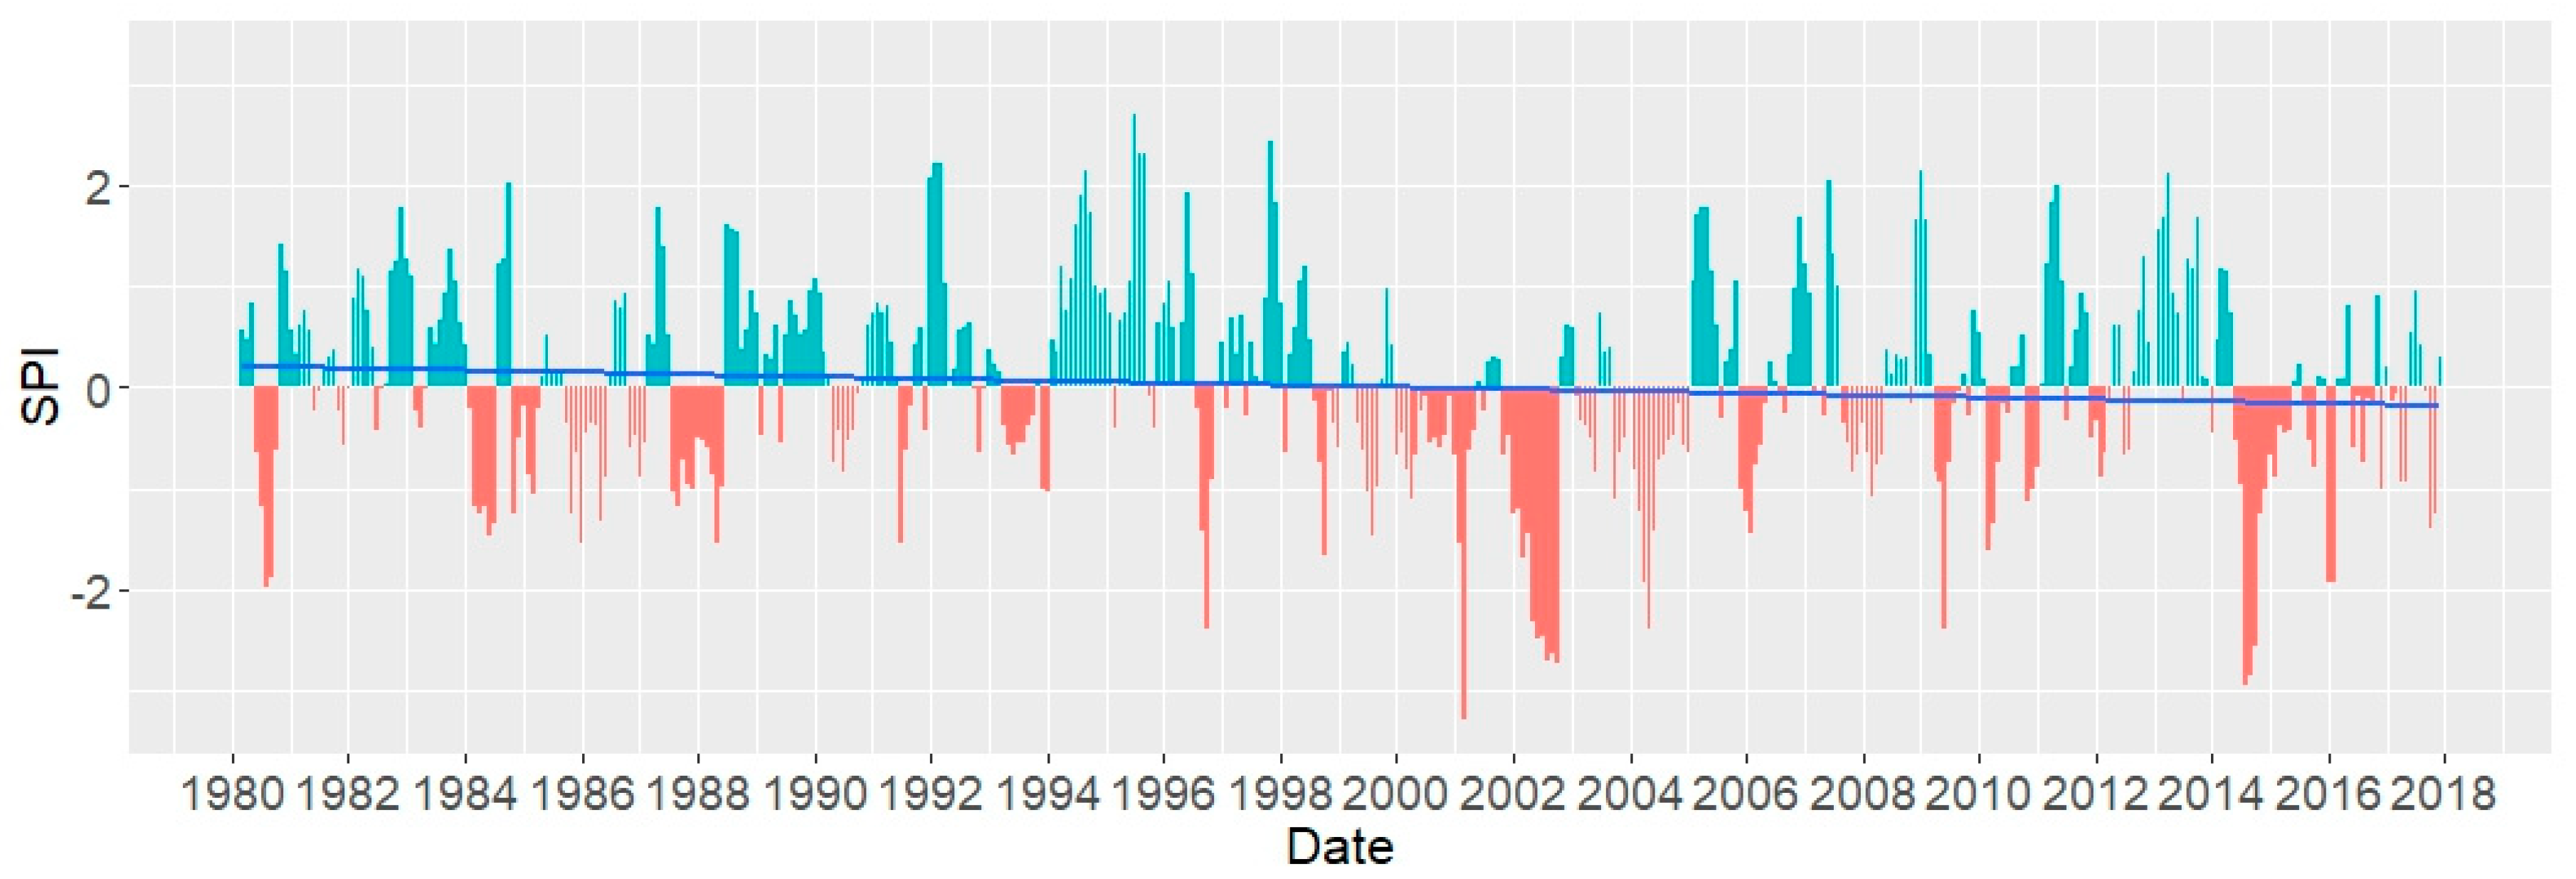
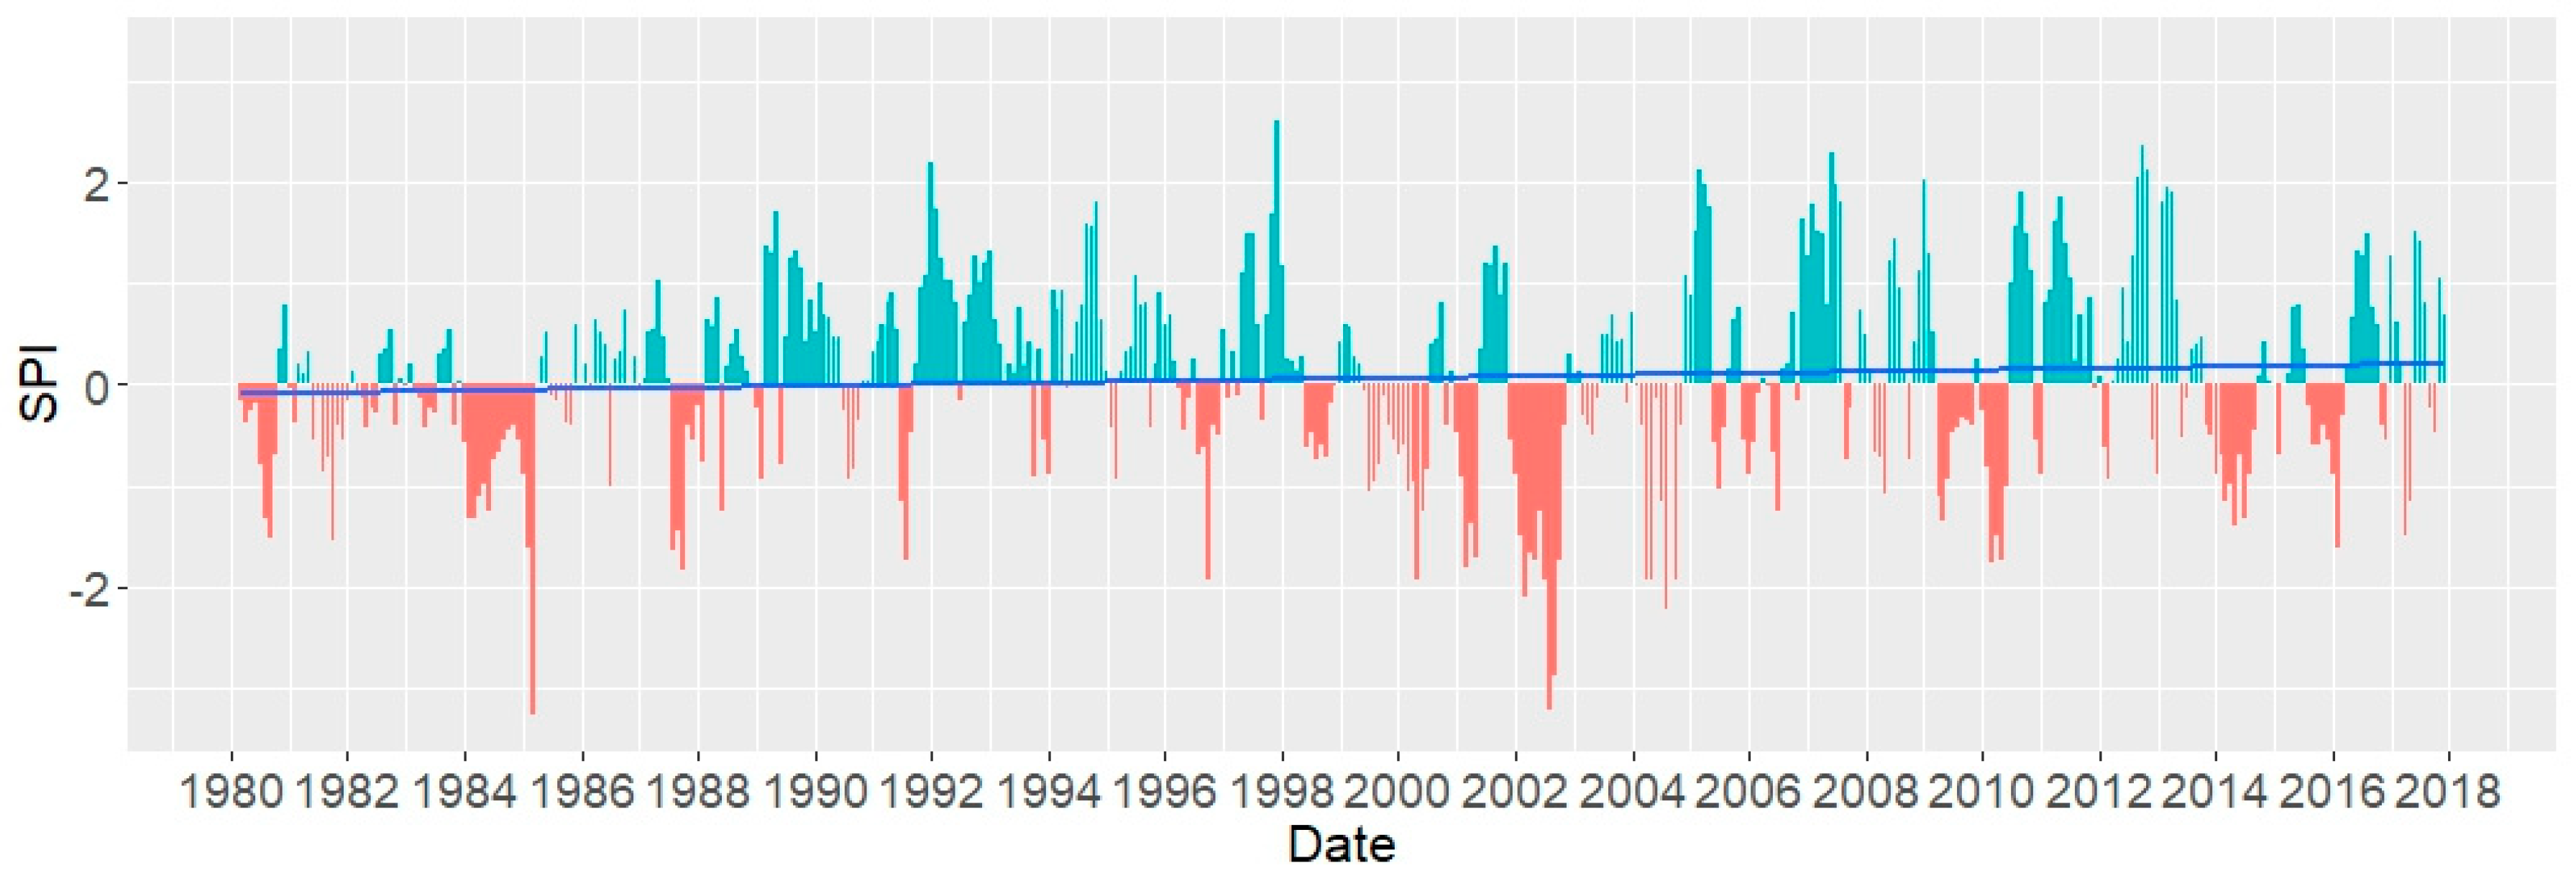
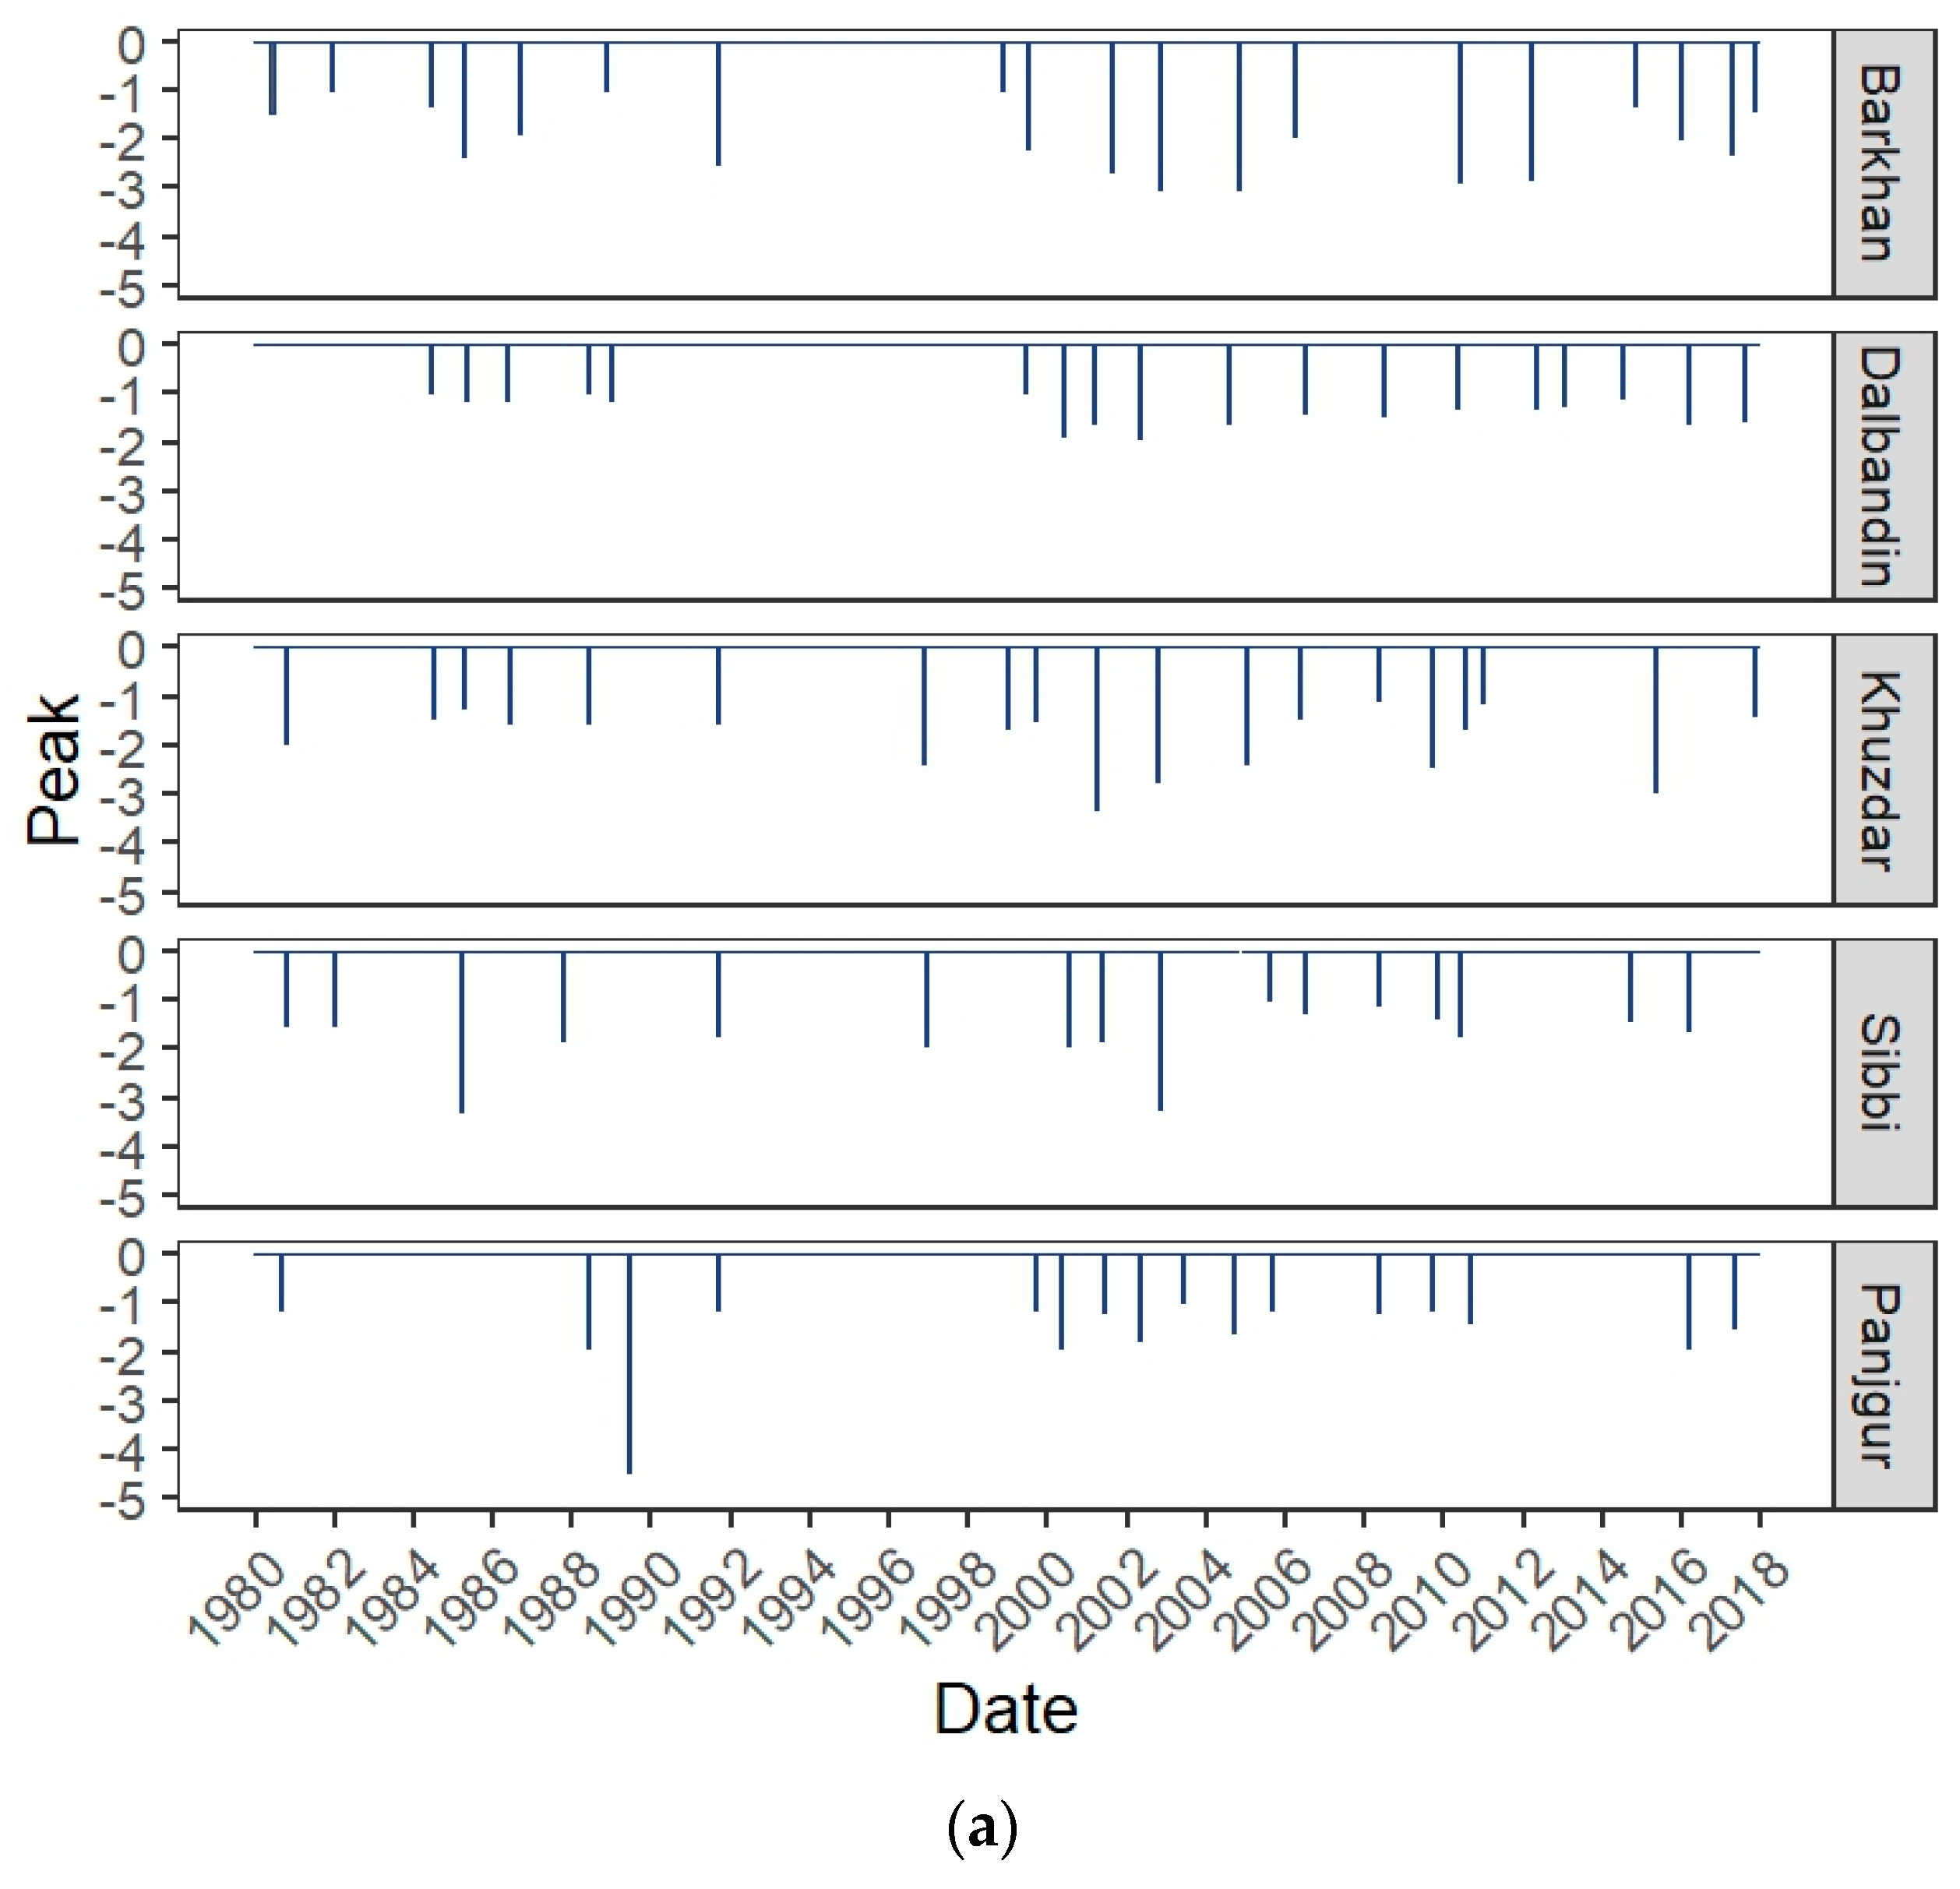
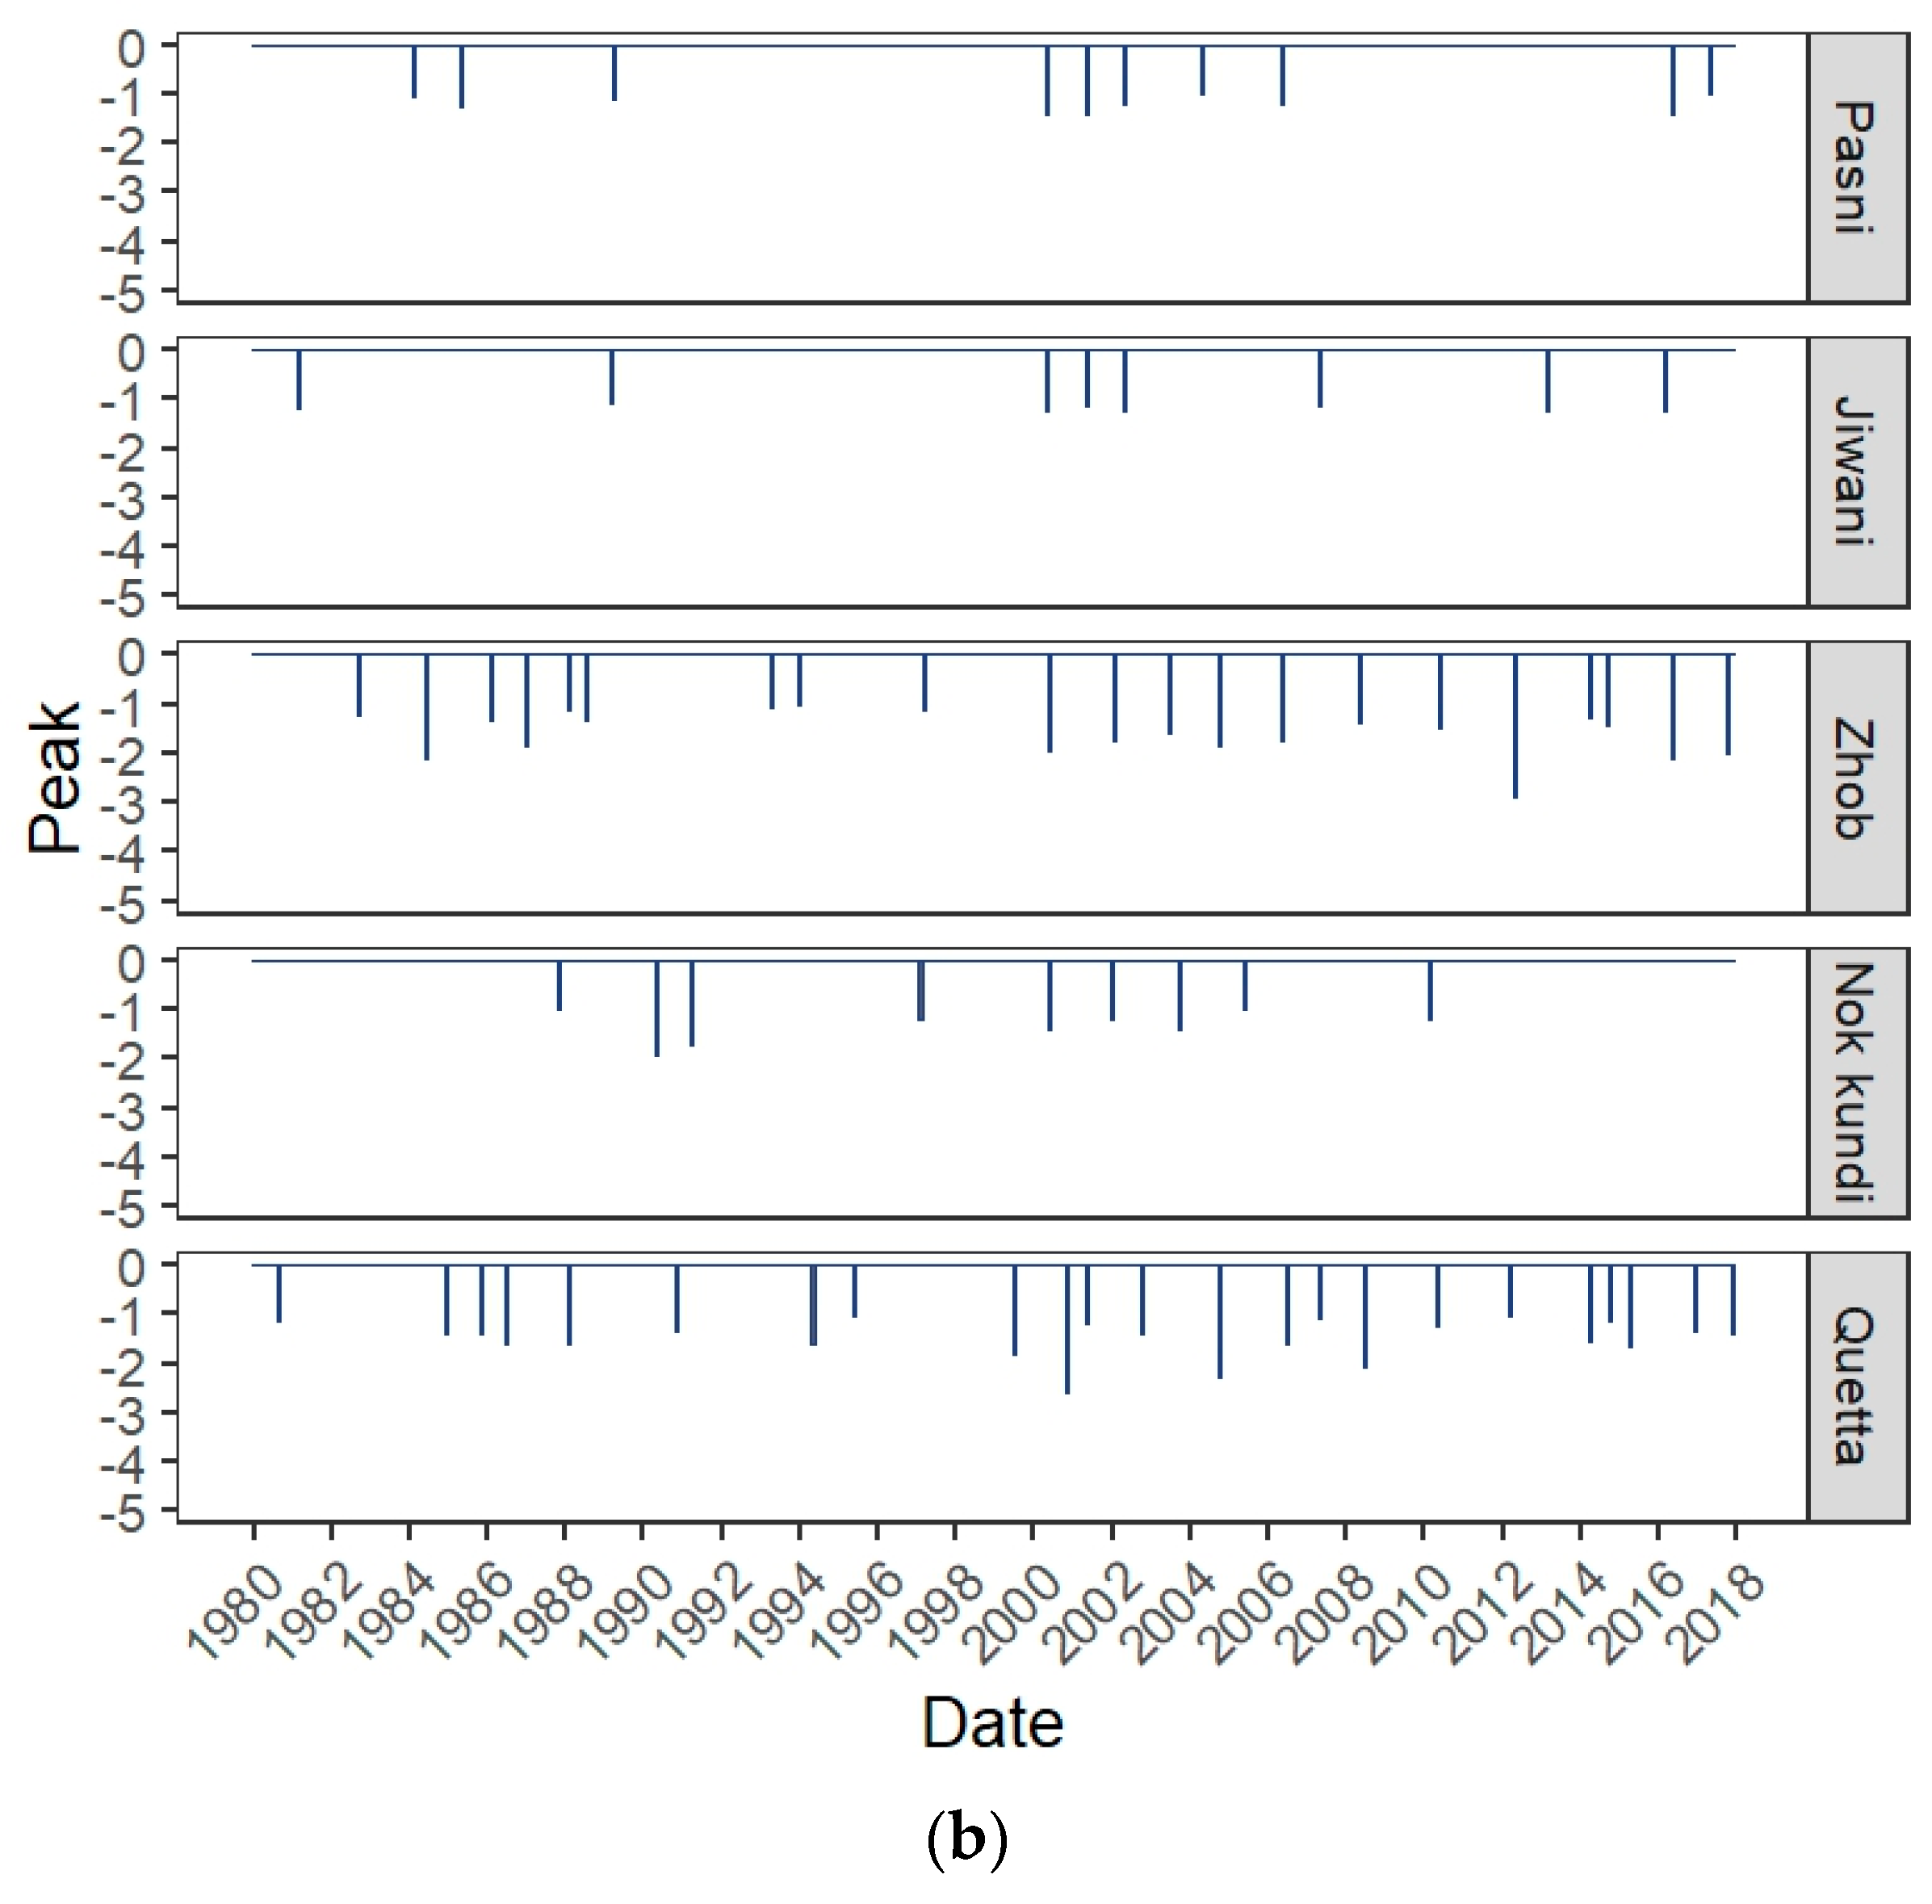
3. Results
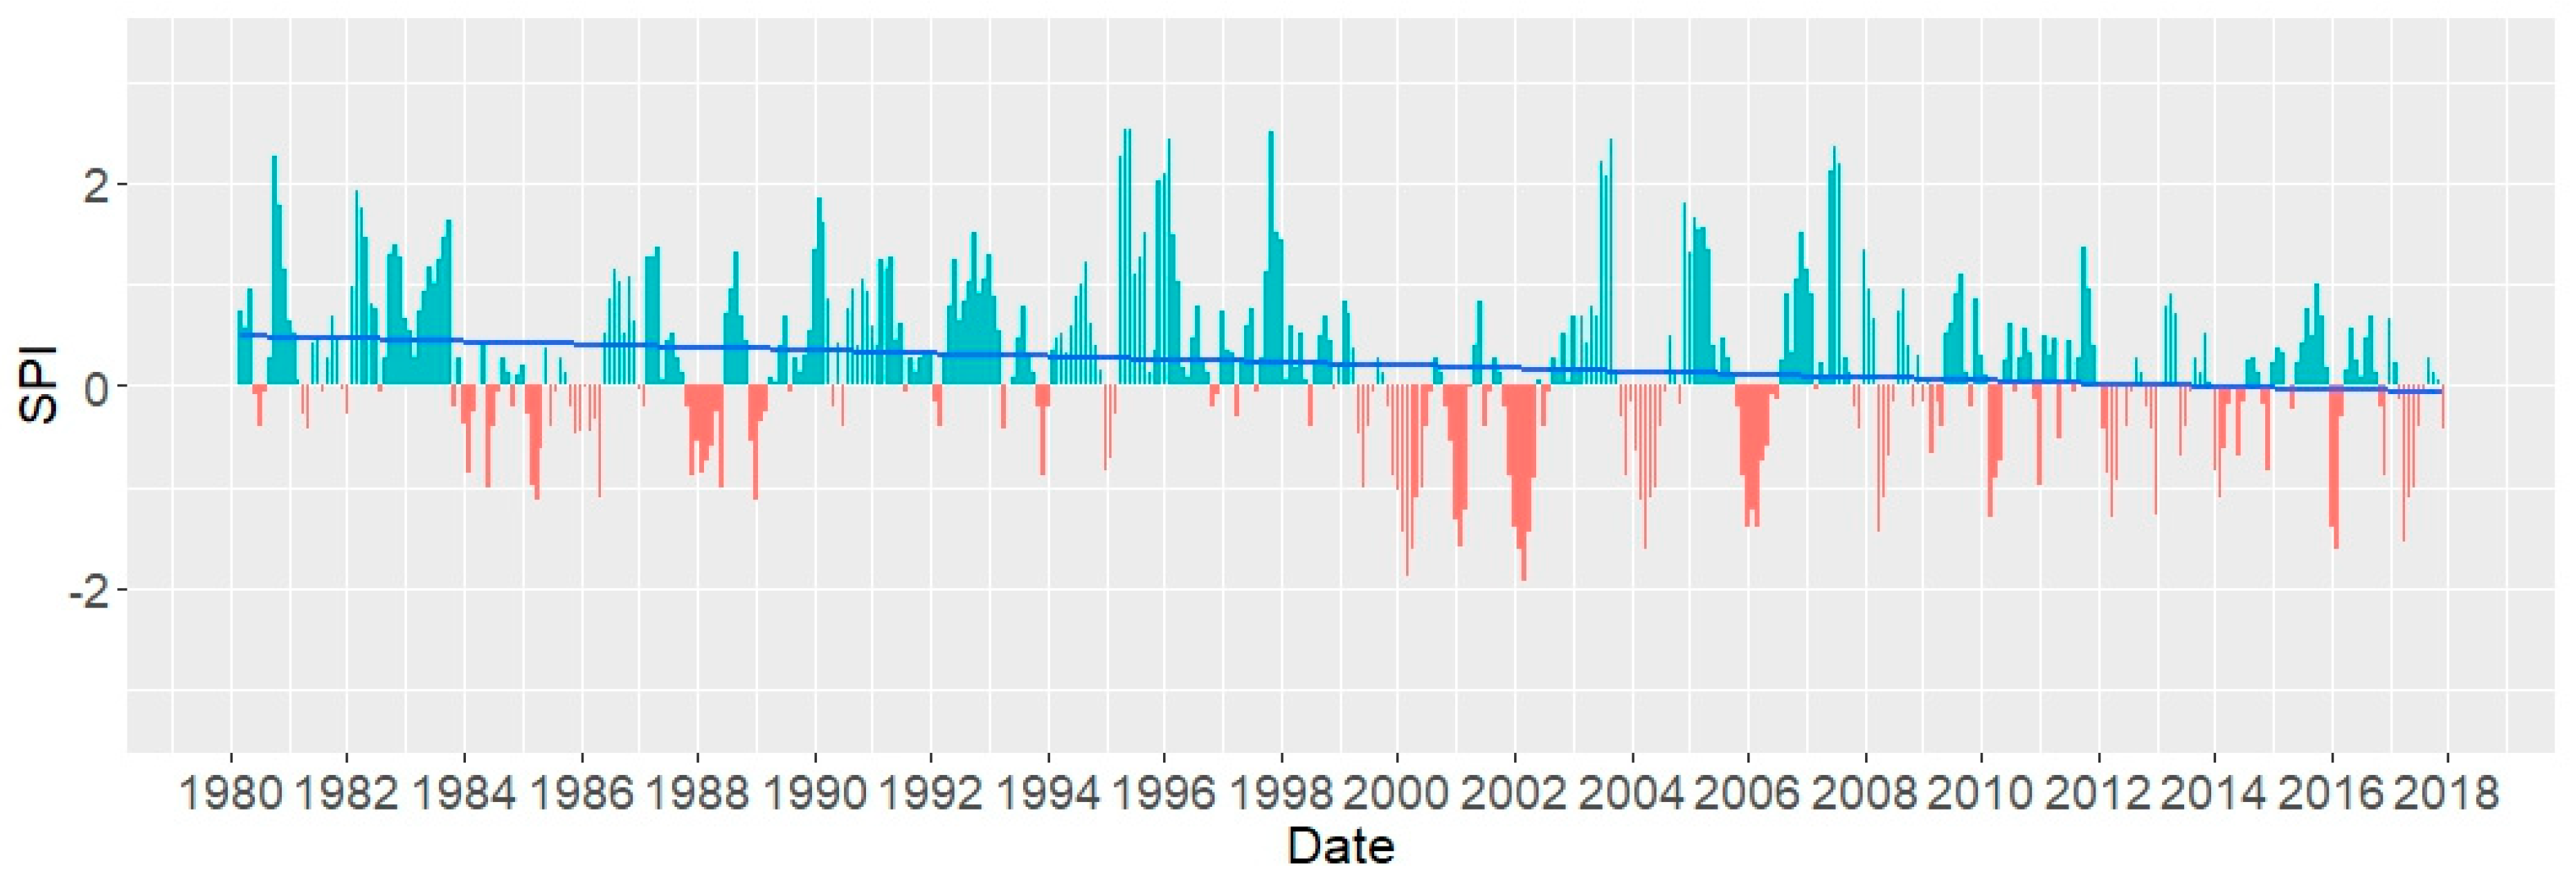
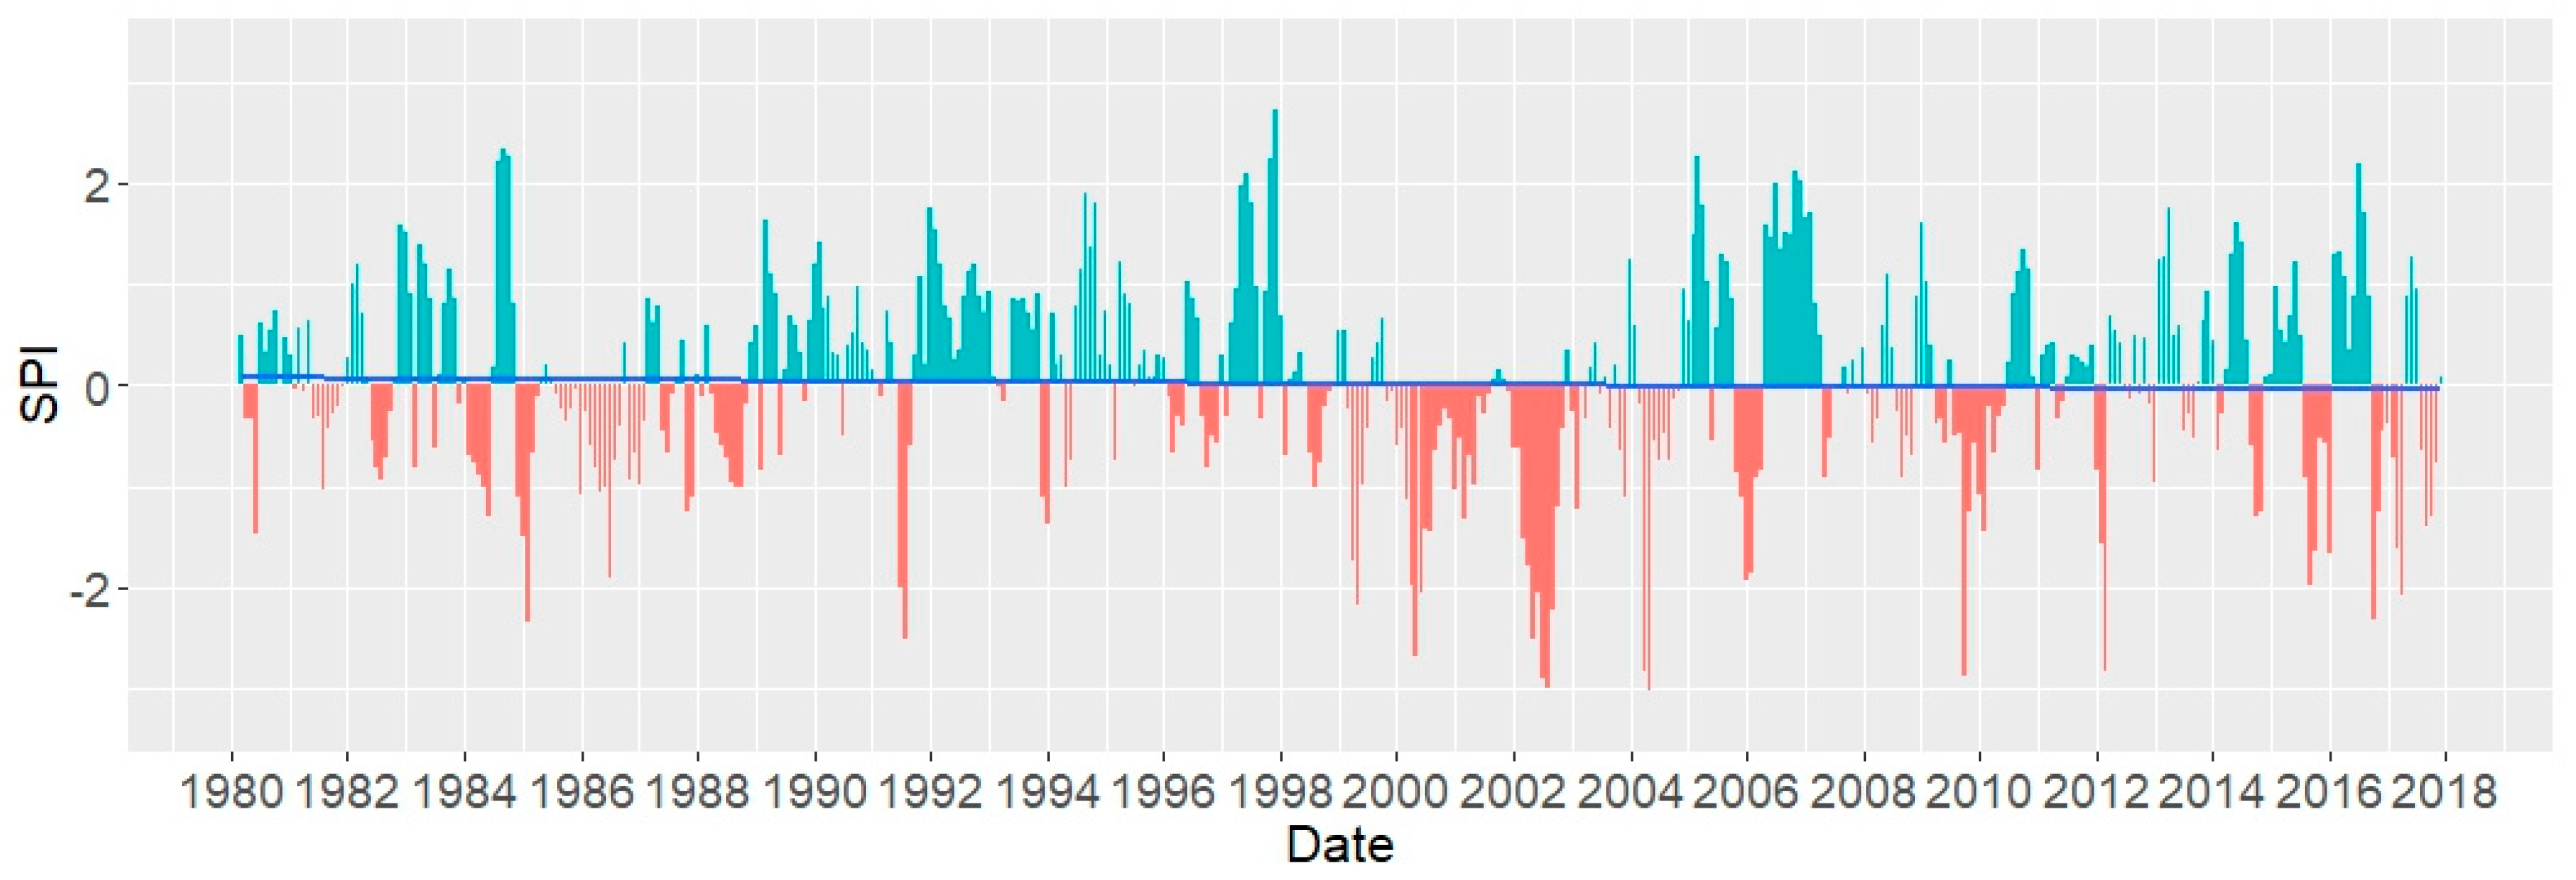
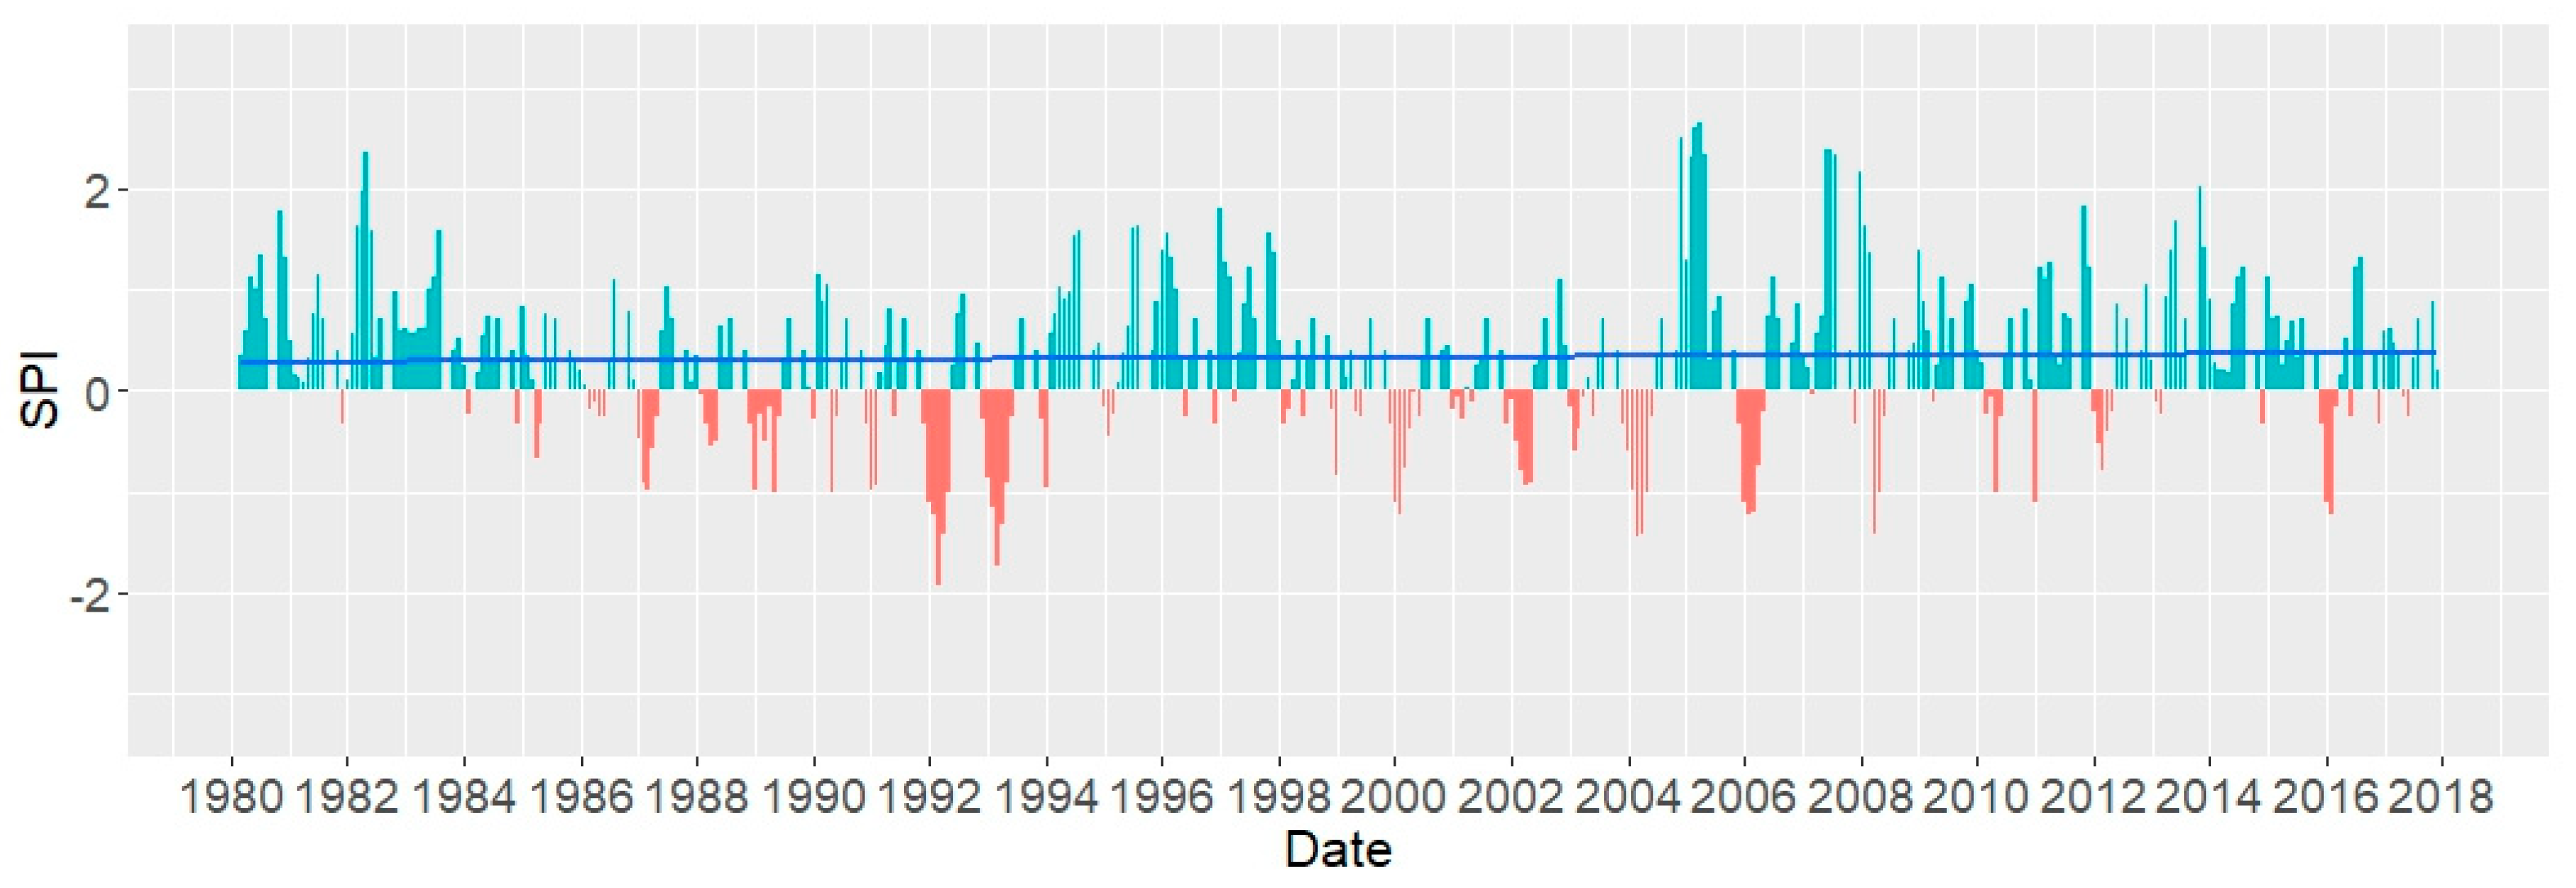
3.1. Temporal Analysis of Meteorological Droughts
3.2. Analysis of Drought Trends
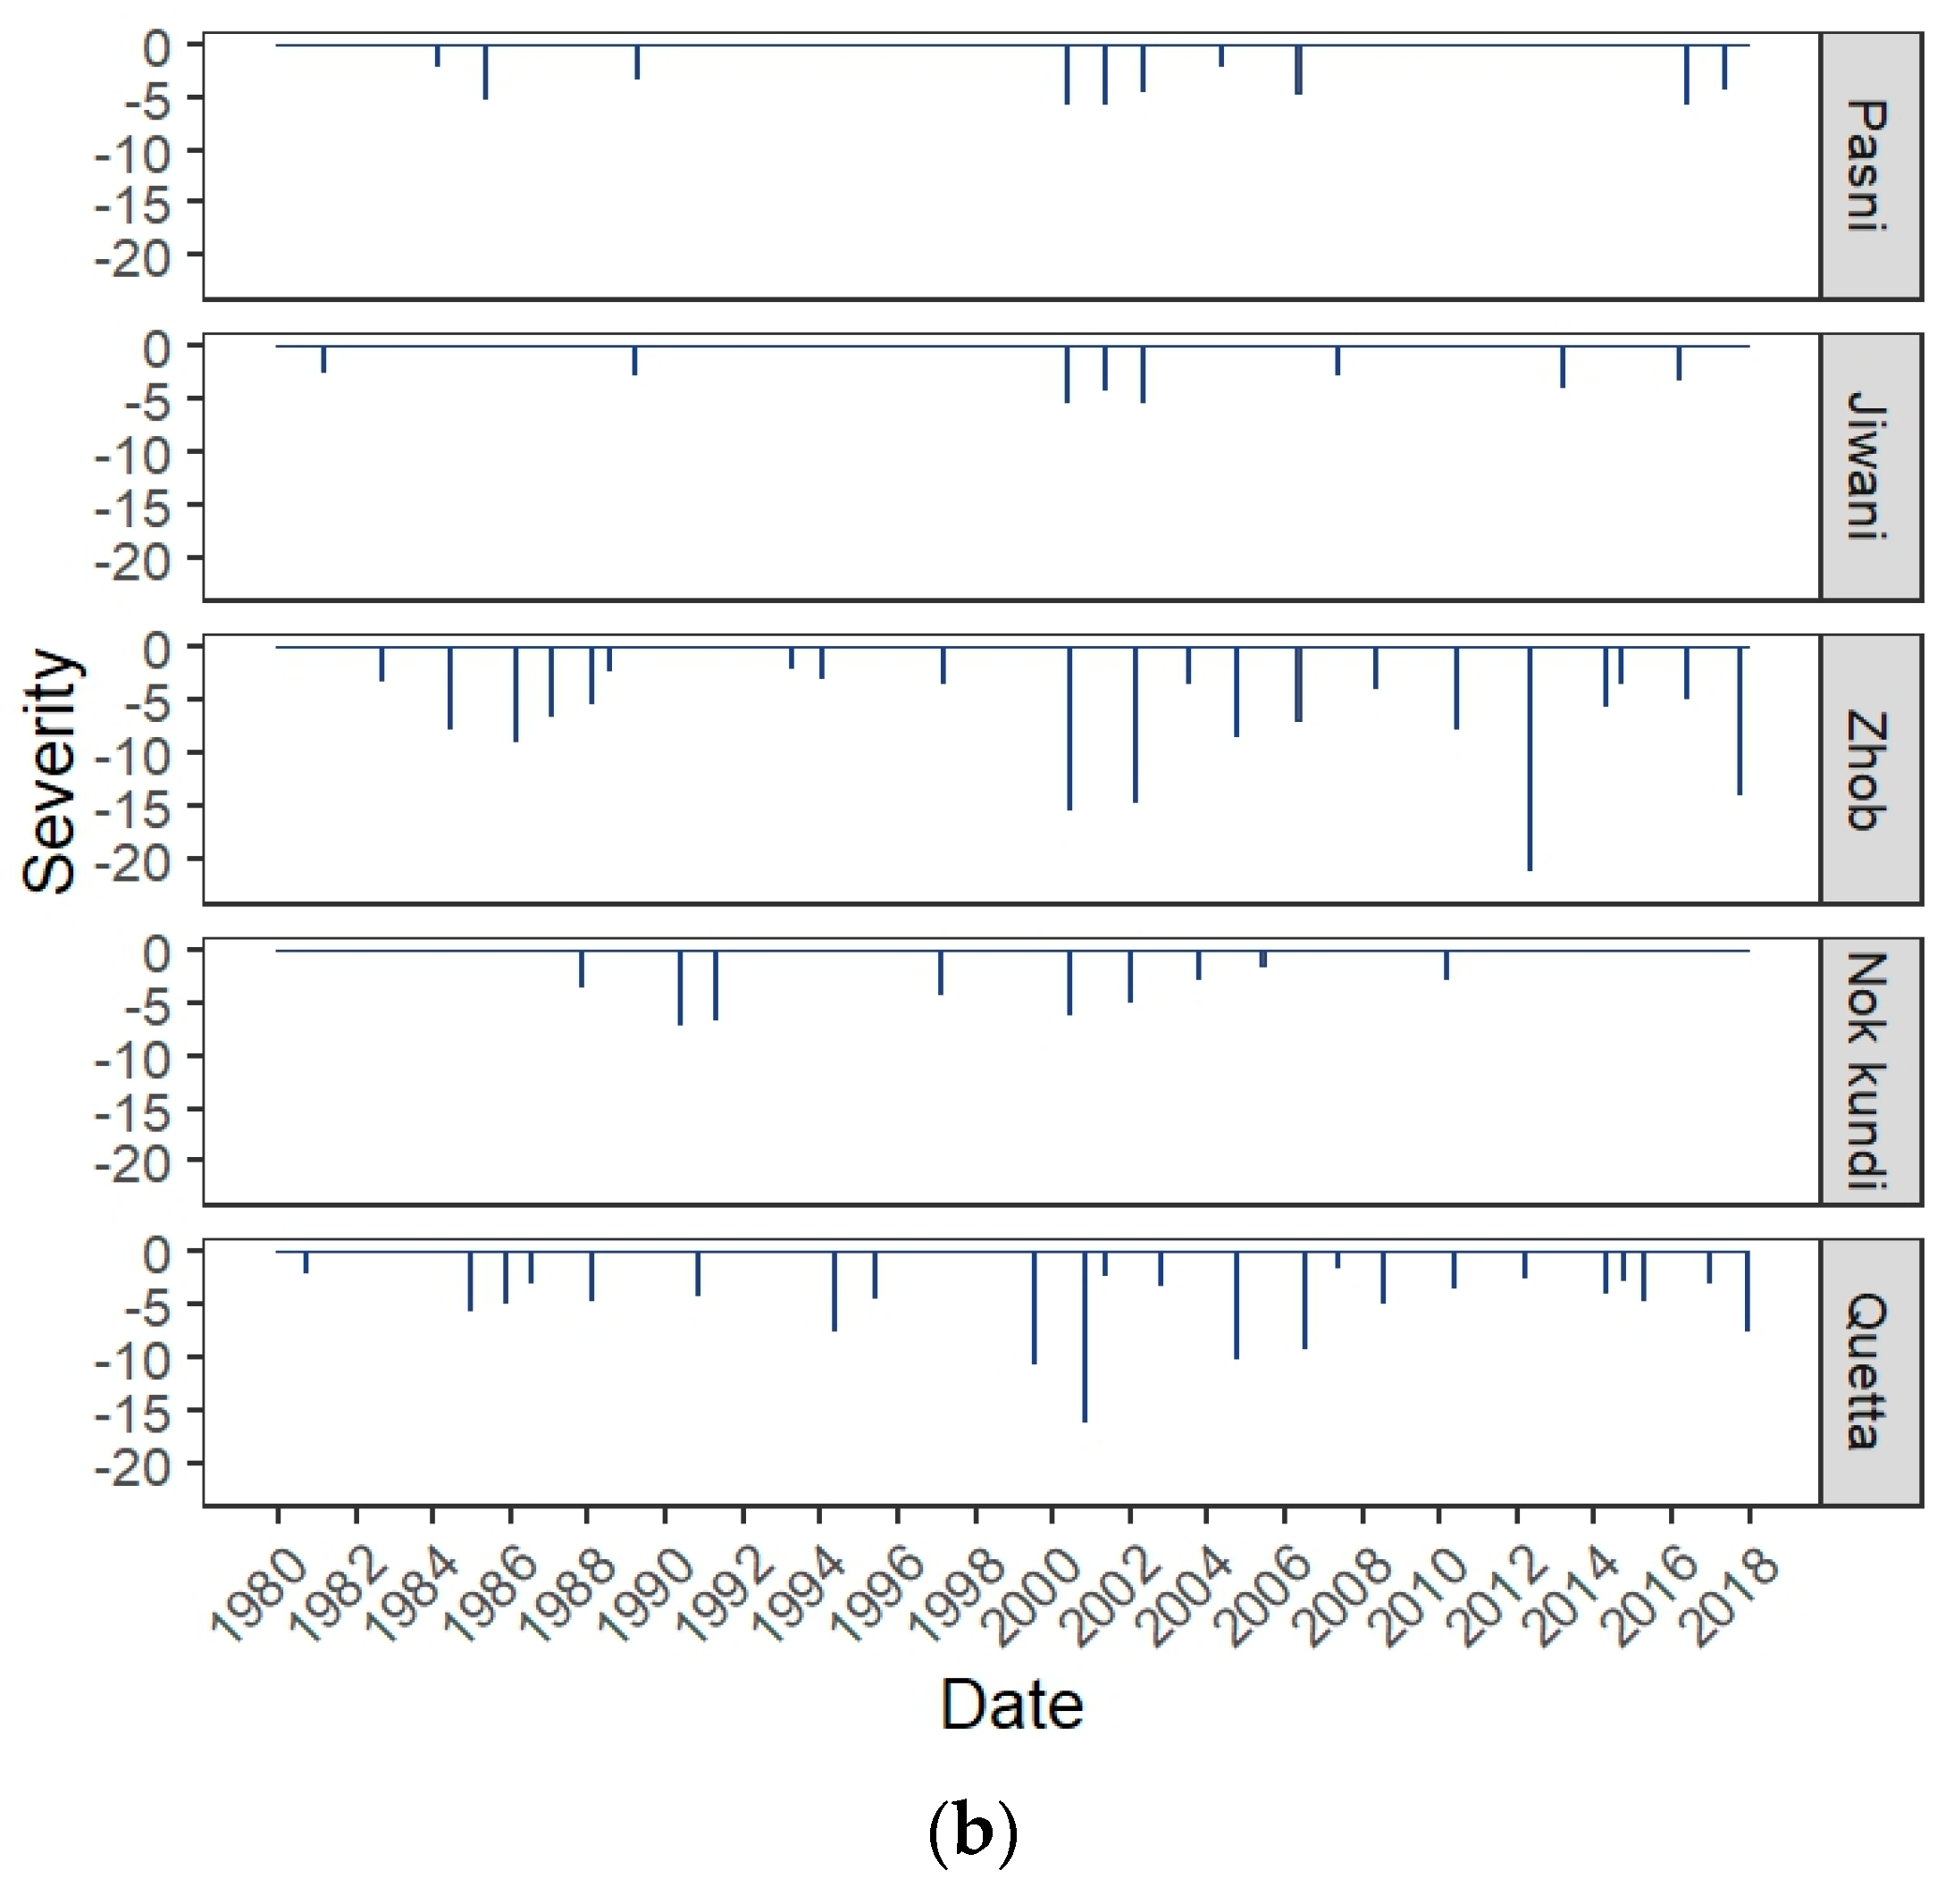
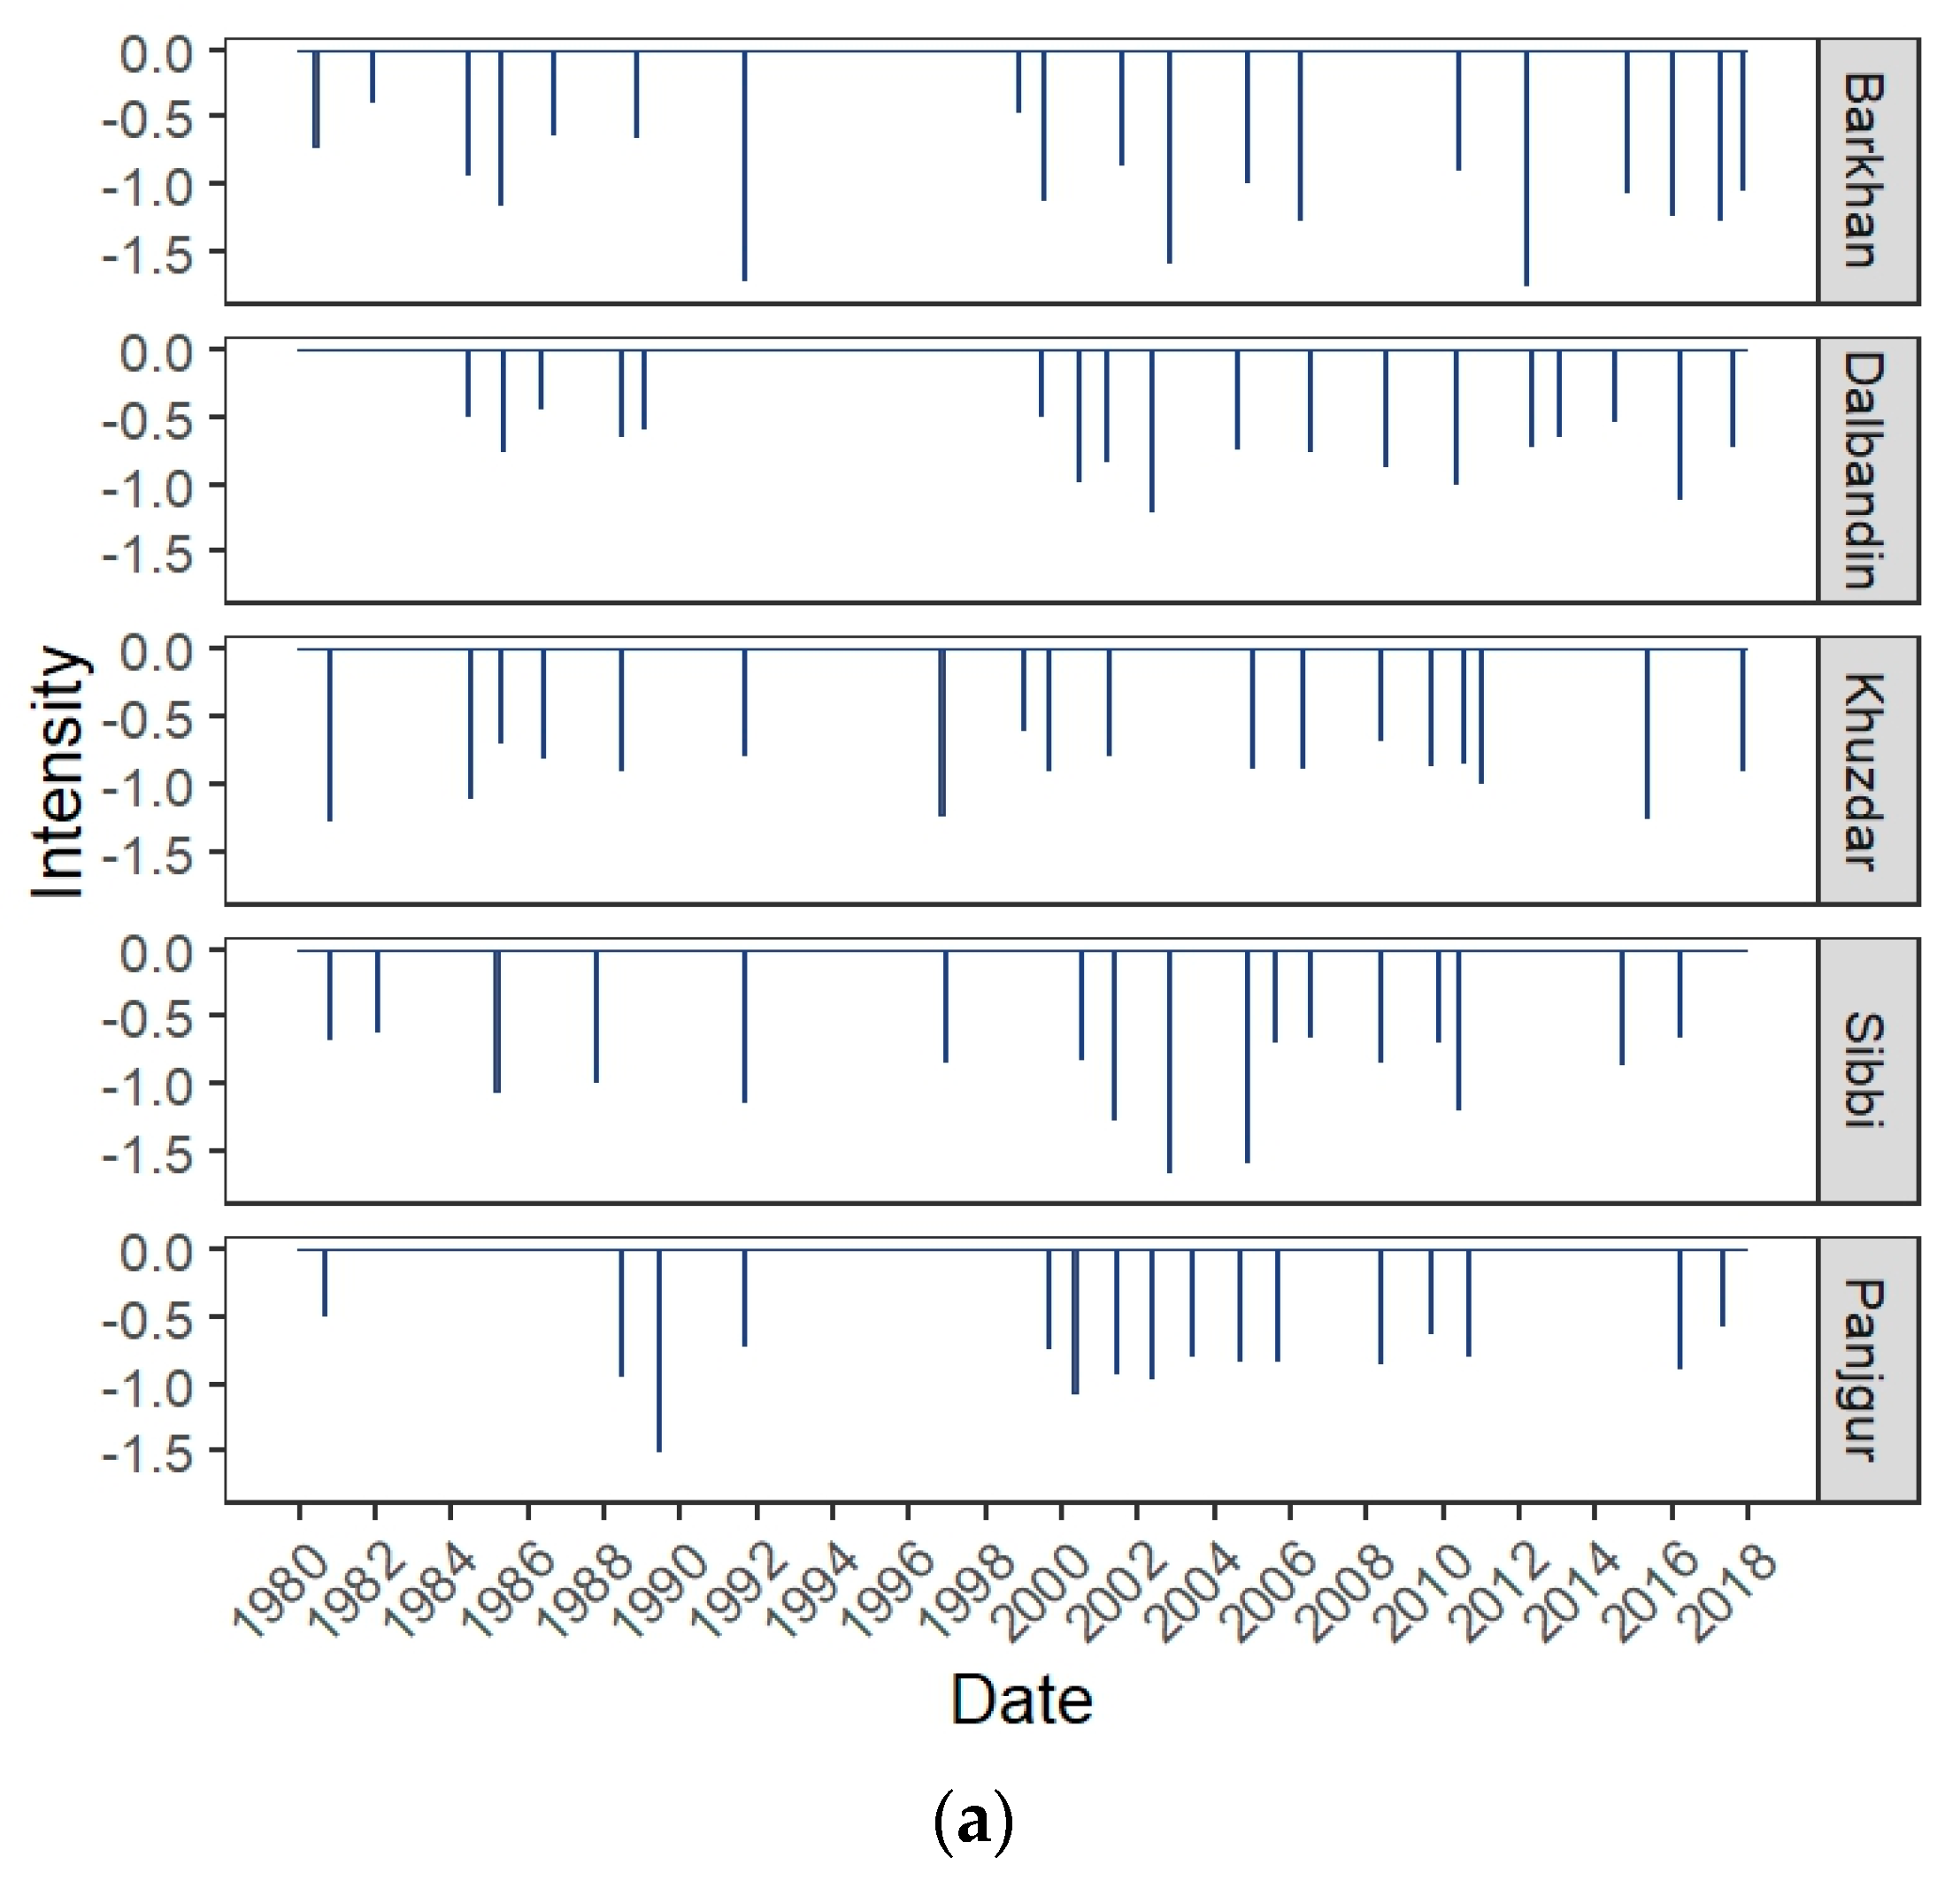
3.3. Drought Indicators
4. Discussion
5. Conclusions
Author Contributions
Funding
Conflicts of Interest
References
- Eckstein, D.; Hutfils, M.L.; Winges, M. Global Climate Risk Index 2019: Who Suffers Most From Extreme Weather Events? In Weather-Related Loss Events in 2017 and 1998 to 2017; Germanwatch Nord-Süd Initiative e.V: Bonn, Germany, 2018. [Google Scholar]
- Patt, A.G.; Schröter, D. Perceptions of climate risk in Mozambique: Implications for the success of adaptation strategies. Glob. Environ. Chang. 2008, 18, 458–467. [Google Scholar] [CrossRef]
- Unfccc.Int. Available online: https://unfccc.int/resource/docs/publications/impacts.pdf (accessed on 28 November 2019).
- Schilling, J.; Vivekananda, J.; Khan, M.A.; Pandey, N. Vulnerability to environmental risks and effects on community resilience in mid-west Nepal and south-east Pakistan. Environ. Nat. Resour. J. 2013, 3, 27. [Google Scholar] [CrossRef]
- Smit, B.; Skinner, M.W. Adaptation options in agriculture to climate change: A typology. Mitig. Adapt. Strateg. Glob. Chang. 2002, 7, 85–114. [Google Scholar] [CrossRef]
- Mahessar, A.A.; Qureshi, A.L.; Siming, I.A.; Kori, S.M.; Dars, G.H.; Channa, M.; Laghari, A.N. Flash Flood Climatology in the Lower Region of Southern Sindh. Eng. Technol. Appl. Sci. Res. 2019, 9, 4474–4479. [Google Scholar]
- Anjum, S.; Saleem, M.; Cheema, M.; Bilal, M.; Khaliq, T. An assessment to vulnerability, extent, characteristics and severity of drought hazard in Pakistan. Pak. J. Sci. 2012, 64, 138–143. [Google Scholar]
- Jamro, S.; Dars, G.H.; Ansari, K.; Krakauer, N.Y. Spatio-temporal variability of drought in Pakistan using standardized precipitation evapotranspiration index. Appl. Sci. 2019, 9, 4588. [Google Scholar] [CrossRef]
- Ashraf, M.; Routray, J.K.; Saeed, M. Determinants of farmers’ choice of coping and adaptation measures to the drought hazard in northwest Balochistan, Pakistan. Nat. Hazards 2014, 73, 1451–1473. [Google Scholar] [CrossRef]
- Ashraf, M.; Routray, J.K. Spatio-temporal characteristics of precipitation and drought in Balochistan Province, Pakistan. Nat. Hazards 2015, 77, 229–254. [Google Scholar] [CrossRef]
- Jairath, J. Droughts and Integrated Water Resource Management in South Asia: Issues, Alternatives and Futures; Sage Publications: Sauzendeaux, CA, USA, 2008. [Google Scholar]
- Shahid, A.; Zahid, H.; Qureshi, A.S.; Rashida, M.; Mohammad, S. Drought mitigation in Pakistan: Current status and options for future strategies. IWMI Work. Paper 2004, 85. Available online: http://www.iwmi.cgiar.org/Publications/Working_Papers/working/WOR85.pdf (accessed on 8 February 2020).
- Zahid, M.; Rasul, G. Changing trends of thermal extremes in Pakistan. Clim. Chang. 2012, 113, 883–896. [Google Scholar] [CrossRef]
- IPCC. Climate Change 2014: Synthesis Report. Available online: https://www.ipcc.ch/site/assets/uploads/2018/05/SYR_AR5_FINAL_full_wcover.pdf (accessed on 24 September 2019).
- Ahmed, K.; Shahid, S.; Nawaz, N. Impacts of climate variability and change on seasonal drought characteristics of Pakistan. Atmos. Res. 2018, 214, 364–374. [Google Scholar] [CrossRef]
- Ahmed, K.; Shahid, S.; Bin Harun, S.; Wang, X.J. Characterization of seasonal droughts in Balochistan Province, Pakistan. Stoch. Environ. Res. Risk Assess. 2016, 30, 747–762. [Google Scholar] [CrossRef]
- Ahmed, K.; Shahid, S.; Chung, E.S.; Wang, X.J.; Harun, S.B. Climate change uncertainties in seasonal drought severity-area-frequency curves: Case of arid region of Pakistan. J. Hydrol. 2019, 570, 473–485. [Google Scholar] [CrossRef]
- Xie, H.; Ringler, C.; Zhu, T.; Waqas, A. Droughts in Pakistan: A spatiotemporal variability analysis using the Standardized Precipitation Index. Water Int. 2013, 38, 620–631. [Google Scholar] [CrossRef]
- Adnan, S.; Ullah, K.; Gao, S. Characterization of drought and its assessment over Sindh, Pakistan during 1951–2010. J. Meteorol. Res. 2015, 29, 837–857. [Google Scholar] [CrossRef]
- Khan, M.A.; Gadiwala, M.S. A Study of drought over Sindh (Pakistan) using standardized precipitation index (SPI) 1951 to 2010. Pak. J. Meteorol. 2013, 9, 15–22. [Google Scholar]
- Hina, S.; Saleem, F. Historical analysis (1981–2017) of drought severity and magnitude over a predominantly arid region of Pakistan. Clim. Res. 2019, 78, 189–204. [Google Scholar] [CrossRef]
- Adnan, S.; Ullah, K.; Shuanglin, L.; Gao, S.; Khan, A.H.; Mahmood, R. Comparison of various drought indices to monitor drought status in Pakistan. Clim. Dyn. 2018, 51, 1885–1899. [Google Scholar] [CrossRef]
- Adnan, S.; Ullah, K.; Shouting, G. Investigations into precipitation and drought climatologies in South Central Asia with special focus on Pakistan over the period 1951–2010. J. Clim. 2016, 29, 6019–6035. [Google Scholar] [CrossRef]
- Haroon, M.A.; Zhang, J.; Yao, F. Drought monitoring and performance evaluation of MODIS-based drought severity index (DSI) over Pakistan. Nat. Hazards 2016, 84, 1349–1366. [Google Scholar] [CrossRef]
- Krakauer, N.Y.; Lakhankar, T.; Dars, G.H. Precipitation Trends over the Indus Basin. Climate 2019, 7, 116. [Google Scholar] [CrossRef]
- McKee, T.B.; Doesken, N.J.; Kleist, J. The Relationship of Drought Frequency and Duration to Time Scales. In Proceedings of the 8th Conference on Applied Climatology; American Meteorological Society: Boston, MA, USA, 1993; Volume 17. [Google Scholar]
- Heim, R.R., Jr. A review of twentieth-century drought indices used in the United States. Bull. Am. Meteorol. Soc. 2002, 83, 1149–1166. [Google Scholar] [CrossRef]
- Keyantash, J.; Dracup, J.A. The quantification of drought: An evaluation of drought indices. Bull. Am. Meteorol. Soc. 2002, 83, 1167–1180. [Google Scholar] [CrossRef]
- Yevjevich, V. An objective approach to definitions and investigations of continental hydrologic droughts. J. Hydrol. 1969, 7, 353. [Google Scholar]
- Svoboda, M.; Hayes, M.; Wood, D. Standardized Precipitation Index User Guide; World Meteorological Organization: Geneva, Switzerland, 2012. [Google Scholar]
- Edwards, D.C.; McKee, T.B. Characteristics of 20th century drought in the United States at multiple time scales. In Atmospheric Science Paper; Colorado State University Fort Collins: Fort Collins, CO, USA, 1997; Available online: https://apps.dtic.mil/dtic/tr/fulltext/u2/a325595.pdf (accessed on 8 February 2020).
- Thom, H.C. A note on the gamma distribution. Mon. Weather Rev. 1958, 86, 117–122. [Google Scholar] [CrossRef]
- Yue, S.; Pilon, P.; Cavadias, G. Power of the Mann–Kendall and Spearman’s rho tests for detecting monotonic trends in hydrological series. J. Hydrol. 2002, 259, 254–271. [Google Scholar] [CrossRef]
- Samo, S.R.; Bhatti, N.; Saand, A.; Keerio, M.A.; Bangwar, D.K. Temporal analysis of temperature and precipitation trends in Shaheed Benazir Abad Sindh, Pakistan. Eng. Technol. Appl. Sci. Res. 2017, 7, 2171–2176. [Google Scholar]
- Bae, S.; Lee, S.H.; Yoo, S.H.; Kim, T. Analysis of Drought Intensity and Trends Using the Modified SPEI in South Korea from 1981 to 2010. Water 2018, 10, 327. [Google Scholar] [CrossRef]
- Spinoni, J.; Naumann, G.; Vogt, J.V.; Barbosa, P. The biggest drought events in Europe from 1950 to 2012. J. Hydrol. Reg. Stud. 2015, 3, 509–524. [Google Scholar] [CrossRef]
- Spinoni, J.; Naumann, G.; Carrao, H.; Barbosa, P.; Vogt, J. World drought frequency, duration, and severity for 1951–2010. Int. J. Climatol. 2014, 34, 2792–2804. [Google Scholar] [CrossRef]
- Iqbal, M.F.; Athar, H. Variability, trends, and teleconnections of observed precipitation over Pakistan. Theor. Appl. Climatol. 2018, 134, 613–632. [Google Scholar] [CrossRef]
- Deo, R.C.; Byun, H.R.; Adamowski, J.F.; Begum, K. Application of effective drought index for quantification of meteorological drought events: A case study in Australia. Theor. Appl. Climatol. 2017, 128, 359–379. [Google Scholar] [CrossRef]


| SPI | Drought Categories |
|---|---|
| 0 to −0.99 | Near normal |
| −1 to −1.49 | Moderately dry |
| −1.5 to −1.99 | Severely dry |
| −2 and less | Extremely dry |
| Stations | z-Value | p-Value |
|---|---|---|
| Barkhan | −0.4777 | 0.632 |
| Dalbandin | −2.1121 | 0.034 |
| Jiwani | −2.036 | 0.041 |
| Quetta | −2.061 | 0.039 |
| Khuzdar | −1.1063 | 0.268 |
| Nokkundi | 0 | 1 |
| Panjgur | −1.4835 | 0.137 |
| Pasni | −0.528 | 0.597 |
| Sibbi | 1.3326 | 0.182 |
| Zhob | −1.9864 | 0.046 |
| Stations | Starting | Ending | Duration (Month) | Severity | Intensity | Peak |
|---|---|---|---|---|---|---|
| Barkhan | 1 August 1985 | 1 September 1986 | 14 | −8.81 | −0.62 | −1.90 |
| 1 November 1999 | 1 August 2001 | 22 | −18.61 | −0.84 | −2.67 | |
| 1 December 2001 | 1 November 2002 | 12 | −18.94 | −1.57 | −3.00 | |
| 1 August 2009 | 1 June 2010 | 11 | −9.63 | −0.87 | −2.88 | |
| Dalbandin | 1 November 1999 | 1 August 2000 | 10 | −9.67 | −0.96 | −1.87 |
| 1 November 2003 | 1 August 2004 | 10 | −7.34 | −0.73 | −1.61 | |
| Khuzdar | 1 August 1987 | 1 June 1988 | 11 | −9.84 | −0.89 | −1.54 |
| 1 January 2000 | 1 April 2001 | 16 | −12.39 | −0.77 | −3.29 | |
| 1 November 2001 | 1 October 2002 | 12 | −22.08 | −1.84 | −2.72 | |
| 1 October 2003 | 1 January 2005 | 16 | −13.83 | −0.86 | −2.39 | |
| 1 June 2014 | 1 May 2015 | 12 | −14.88 | −1.24 | −2.93 | |
| Sibbi | 1 January 1984 | 1 March 1985 | 15 | −15.70 | −1.04 | −3.27 |
| 1 June 1999 | 1 July 2000 | 14 | −11.26 | −0.80 | −1.93 | |
| 1 December 2001 | 1 November 2002 | 12 | −19.86 | −1.65 | −3.21 | |
| 1 February 2004 | 1 November 2004 | 10 | −15.79 | −1.57 | −5.63 | |
| 1 November 2013 | 1 September 2014 | 11 | −9.36 | −0.85 | −1.39 | |
| Panjgur | 1 Dec 2003 | 1 September 2004 | 10 | −8.27 | −0.82 | −1.61 |
| Zhob | 1 Feb 1985 | 1 February 1986 | 13 | −8.79 | −0.67 | −1.30 |
| 1 April 1999 | 1 June 2000 | 15 | −15.16 | −1.01 | −1.96 | |
| 1 October 2000 | 1 February 2002 | 17 | −14.40 | −0.84 | −1.75 | |
| 1 November 2010 | 1 May 2012 | 19 | −20.85 | −1.09 | −2.87 | |
| 1 July 2013 | 1 April 2014 | 10 | −5.32 | −0.53 | −1.27 | |
| 1 July 2016 | 1 October 2017 | 16 | −13.79 | −0.86 | −2.00 | |
| Quetta | 1 March 1984 | 1 Dec 1984 | 10 | −5.42 | −0.54 | −1.41 |
| 1 April 1993 | 1 May 1994 | 14 | −7.49 | −0.53 | −1.61 | |
| 1 September 1998 | 1 July 1999 | 11 | −10.44 | −0.94 | −1.82 | |
| 1 November 1999 | 1 November 2000 | 13 | −15.94 | −1.22 | −2.59 | |
| 1 August 2005 | 1 July 2006 | 12 | −9.13 | −0.76 | −1.61 |
© 2020 by the authors. Licensee MDPI, Basel, Switzerland. This article is an open access article distributed under the terms and conditions of the Creative Commons Attribution (CC BY) license (http://creativecommons.org/licenses/by/4.0/).
Share and Cite
Naz, F.; Dars, G.H.; Ansari, K.; Jamro, S.; Krakauer, N.Y. Drought Trends in Balochistan. Water 2020, 12, 470. https://doi.org/10.3390/w12020470
Naz F, Dars GH, Ansari K, Jamro S, Krakauer NY. Drought Trends in Balochistan. Water. 2020; 12(2):470. https://doi.org/10.3390/w12020470
Chicago/Turabian StyleNaz, Falak, Ghulam Hussain Dars, Kamran Ansari, Shoaib Jamro, and Nir Y. Krakauer. 2020. "Drought Trends in Balochistan" Water 12, no. 2: 470. https://doi.org/10.3390/w12020470
APA StyleNaz, F., Dars, G. H., Ansari, K., Jamro, S., & Krakauer, N. Y. (2020). Drought Trends in Balochistan. Water, 12(2), 470. https://doi.org/10.3390/w12020470