Article

An Innovative Tool for the Management of the Surface Drinking Water Resources at European Level: GOWARE—Transnational Guide Towards an Optimal WAter REgime

1
Regional Models and Geo-Hydrological Impacts (REMHI Division), Fondazione CMCC Centro Euro-Mediterraneo sui Cambiamenti Climatici, 73100 Lecce, Italy
2
Faculty of Civil and Geodetic Engineering, University of Ljubljana, 1000 Ljubljana, Slovenia
3
Impacts on Agriculture, Forests and Ecosystem Services (IAFES Division), Fondazione CMCC Centro Euro-Mediterraneo sui Cambiamenti Climatici, 73100 Lecce, Italy
*
Author to whom correspondence should be addressed.
Water 2020, 12(2), 370; https://doi.org/10.3390/w12020370
Submission received: 24 November 2019 / Revised: 25 January 2020 / Accepted: 26 January 2020 / Published: 29 January 2020

Abstract

:
GOWARE (transnational Guide toward an Optimal WAter REgime) represents a Decision Support Tool (DST) developed to support the implementation of innovative Best Management Practices (BMPs) for drinking water protection and flood/drought risk mitigation. The tool is one of the main outputs of the PROLINE-CE Project, an EU project funded within the Interreg Central Europe (CE) Programme (2014–2020). The aim of this paper is illustrating the design and the methodological approaches proposed for the operative development of the tool. Furthermore, the paper provides the results of a number of tests carried out to evaluate the understandability of the analysis’s processes and assessing the stakeholders’ acceptance. Specifically, GOWARE-DST has been developed for supporting single users or groups of users in the decision-making process. The tool has been provided with a catalogue of 92 BMPs to handle water issues in different land use contexts. The selection of practices suitable for addressing the specific user’s requirements is supported by the Analytic Hierarchy Process, a method that allows filtering a subset of BMPs by accounting for the relative importance that the user assigns to each characterizing criterion. GOWARE-DST represents an innovative tool for supporting users at different levels of planning (operational and strategic) by promoting sustainable land and water management and defining long-term governance activities.

1. Introduction

Availability and quality of drinking water resources are threatened by different natural processes and human activities, which include chemical and biological contamination from agricultural and urban activities [1,2,3,4], direct impacts of land and ecosystems’ services overexploitation [5], and direct and indirect impacts of a variety of weather related events, such as floods and droughts [6,7]. These processes and dynamics are expected to be exacerbated by global warming and connected climate change [8,9,10] whose most widely expected and accepted consequence is the increase in both frequency and severity of extreme weather events, as strongly emphasized by the Intergovernmental Panel on Climate Change (IPCC) Assessment Reports [11,12,13,14] and, at European level, by the European Environmental Agency (EEA) [15,16] and still by the IPCC [17]. In this context, water-related issues have received increasing attention and have been recognized as priority challenges in the recent international agreements such as the Sendai Framework for Disaster Risk Reduction 2015–2030, the 2015 Paris Agreement, the 2030 United Nations Agenda for Sustainable Development and its related Sustainable Development Goals (SDGs). In detail, SDG6 specifically requires by 2030 to, “improve water quality by reducing pollution, eliminating dumping and minimizing release of hazardous chemicals”, “implement integrated water resources management at all levels, including through transboundary cooperation as appropriate”, and, by 2020, “protect and restore water-related ecosystems, including mountains, forests, wetlands, rivers, aquifers and lakes”. In addition, SDG13, which is focused on the climate change issue, requires to, “take urgent action to combat climate change and its impacts” also by “promoting the integration of climate change measures into national policies, strategies and planning” (Agenda 2030). However, as suggested by [18], there are strong trade-offs between SDG6 and SDG12 related to sustainable consumption and production and aiming at achieving by 2020, “the environmentally sound management of chemicals and all wastes [...] and significantly reduce their release to air, water and soil in order to minimize their adverse impacts on human health and the environment” and, by 2030, “the sustainable management and efficient use of natural resources”. Furthermore, the effective and integrated management of the water resources at the basin scale is explicitly required by the European Union (EU) Water Framework Directive (WFD, 2000), which was adopted in order to ensure the availability of good quality groundwater and surface water resources. The recently published IPCC Special Report on Climate Change and Land [19] emphasizes the international relevance of the sustainable land management in the context of climate change adaptation and mitigation. The report deeply describes the interactions between climate change and land uses by exploring both how the land uses contribute to climate change and how climate change affects land conservation and sustainability. Furthermore, the report provides a deep insight in the analysis of synergies and trade-offs of response options that affect sustainable development and climate change adaptation/mitigation strategies.
Since environmental challenges related to sustainable land use and water management have a transnational relevance, several projects (especially in the frame of Horizon2020, Interreg and LIFE + calls) have been funded to support research and implementation activities aiming at improving knowledge and increasing the awareness of administrators, policy-makers and general stakeholders about the urgency of implementing effective management and adaptation strategies, even accounting for the potential climate change impacts (such as Horizon2020 projects Operandum, Phusicos, Recare, and Interreg project Orientgate).
The outcomes of these projects are also aimed at providing decision-makers/stakeholders with new information and innovative Decision Support Tools (DSTs) that can operatively support the protection of drinking water resources and the management of water-related risks by promoting Best Management Practices (BMPs, or also simply “measures” hereafter), defined as “methods, measures, or practices, including structural and non-structural controls, operation and maintenance procedures, and other requirements, scheduling, and distribution of activities” (U.S. Forest Service Glossary).
In this context, the PROLINE-CE Project, an EU project founded within the Interreg Central Europe Programme (2014–2020), was implemented for addressing the water-related issue by proposing a common methodology to support the sustainable drinking water management and to mitigate the impacts of flood/drought events in the participating regions. One of the main outputs of the Project is represented by GOWARE (transnational Guide toward Optimal WAter REgime), an interactive DST designed for selecting, prioritizing, and promoting the most suitable management practices for the integrated water resource protection and land use management, accounting for a number of specific user’s requirements. In GOWARE-DST, BMPs are ranked by applying the analytic hierarchy process (AHP) [20], a MCDA model widely used in decision-making processes related to the management of natural and environment resources [21,22,23,24,25,26,27], since it is recognized as one of the most effective ways to achieve tailored solutions taking into account requirements of single or specific categories of users.
The main objective of this paper is to illustrate the design of GOWARE-DST, which in its present form is available as on-line (web) tool and off-line (file) tool and it is suitable for supporting decision-making processes carried out by both single user and groups of users, as in case of workshops, meetings and conferences. The paper also shows the results of the GOWARE-DST trial phase carried out during the last period of the PROLINE-CE Project lifetime, which was aimed at evaluating the overall acceptance of different stakeholders’ categories in using GOWARE-DST as supporting tool for their operative management actions.

2. Decision Support Tools for Environmental Resources Management: an Overview

DSTs developed for addressing issues related to natural resources and sustainable development are generally supported by a Multi-Criteria Decision Analysis (MCDA), which is recognized as a valuable and consolidate method for choosing, sorting and ranking alternative solutions [28,29] allowing therefore the identification of the most suitable management strategies in contexts that require achieving multiple, and usually conflicting, objectives. In recent years, several DSTs (both standalone and web-based) have been developed in order to assist stakeholders in the decision-making processes in the field of environmental protection, water resources management, water-related risks mitigation and climate change adaptation. Many of these tools allow the user selecting BMPs in relation to the characteristics of the issue that they are addressing and the context in which they are operating (e.g., land use, scale, and location). A detailed state-of-art review of the DSTs suitable for the identification of suitable solutions for hydro-meteorological risk reduction is provided in [30].
Specifically, examples of recently developed web-based tools include the Climate Adaptation App [31], which has been developed for worldwide applications and it has been tested in six cities. It provides a selection of feasible climate adaptation measures based on the user’s input related to six specific filters for the definition of local conditions (adaptation target, land use, dominant soil type, surface level and slope, scale, project type). The Green-blue design tool [32] allows selecting a specific issue among seven themes (water, heat, biodiversity, urban agriculture, air quality, energy, social, and economic importance) and supports a catalogue of 118 management practices. Furthermore, the Naturally Resilient Communities Solutions DST [33] has been developed with the aim of offering a set of 30 solutions to manage hazards like flooding (coastal and riverine) and erosion, taking into account 23 case studies in U.S. In this case, the practices can be filtered by cost, region, hazard type, scale, and community type. The PEARL Knowledge Base [34] has been proposed for supporting the selection of strategies against extreme hydro-meteorological events and it allows filtering the available solutions accounting for four filters: problem types, measure types, spatial scales, land use. The RISC-KIT toolbox provides a set of tools developed in the framework of the RISC-KIT Project that allow selecting of Disaster Risk Reduction (DRR) measures and evaluating their effectiveness in addressing weather related impacts in vulnerable coastal areas [35,36]. The LaRiMiT Toolbox [37] has been developed for supporting the landslide risk reduction and it includes approximately 70 structural mitigation measures, which are divided into ten categories and belong to class of measures either reducing hazard or reducing consequences. It is worth noting that many DSTs are GIS-based tools, as in the case of the Adaptation Support Tool (AST) [38] that is based on a catalogue of 62 local adaptation strategies and allows mapping their localization and evaluating their effectiveness by means of a set of key-indicators.
Most of the web-based DSTs have been developed for the identification of BMPs mainly suitable to be applied in urban areas. Nevertheless, specifically accounting for the Sustainable Land Management (SLM) at large scale, the worldwide reference catalogue of practices has been developed by the World Overview of Conservation Approaches and Technologies (WOCAT Network). The open access Global Database on SLM [39] contains over 2000 practices applied in different places of the world aimed at preventing and reducing land degradation and restoring degraded lands.

3. Materials and Methods

As sketched out in Figure 1, the design of GOWARE-DST includes two stages of analysis:
Stage 1 - Analysis scoping: this phase consists in defining the context that appropriately represents the issues that the user is facing. According to the user-defined context, the BMPs suitable to address the user’s issue are filtered and pre-selected among the entire set of available practices by dis-qualifying the ones that do not meet the user-defined requirements (Box A in Figure 1);
Stage 2 - Criteria ranking: this phase consists in assigning a “relative importance” between pre-defined characterizing criteria, by means of pairwise comparisons (i.e., considering the criteria two-by-two). The criteria ranking allows the prioritization of the pre-selected BMPs, which consists in giving to each BMP an order of suitability, according to the users’ judgments about the relative importance of the criteria based on the AHP analysis (Box B in Figure 1).
GOWARE-DST design and development stages were widely discussed and agreed with stakeholders during 1-to-1 interviews, roundtables and national meetings to achieve an output fully consistent with users’ requirements and wishes.
At present, GOWARE-DST is available to work both as off-line and on-line tool. The Excel-based version is primarily devoted to support the decision-making processes carried out off-line by both single user and groups of users, for example during dedicated workshops. It is directly downloadable from the GOWARE-DST web-page (http://proline-ce.fgg.uni-lj.si/goware/goware-toolkit/).
On the other hand, the on-line tool is available at http://proline-ce.fgg.uni-lj.si/goware/goware-webtool/ and it is aimed at supporting the decision-making processes carried out by single user.

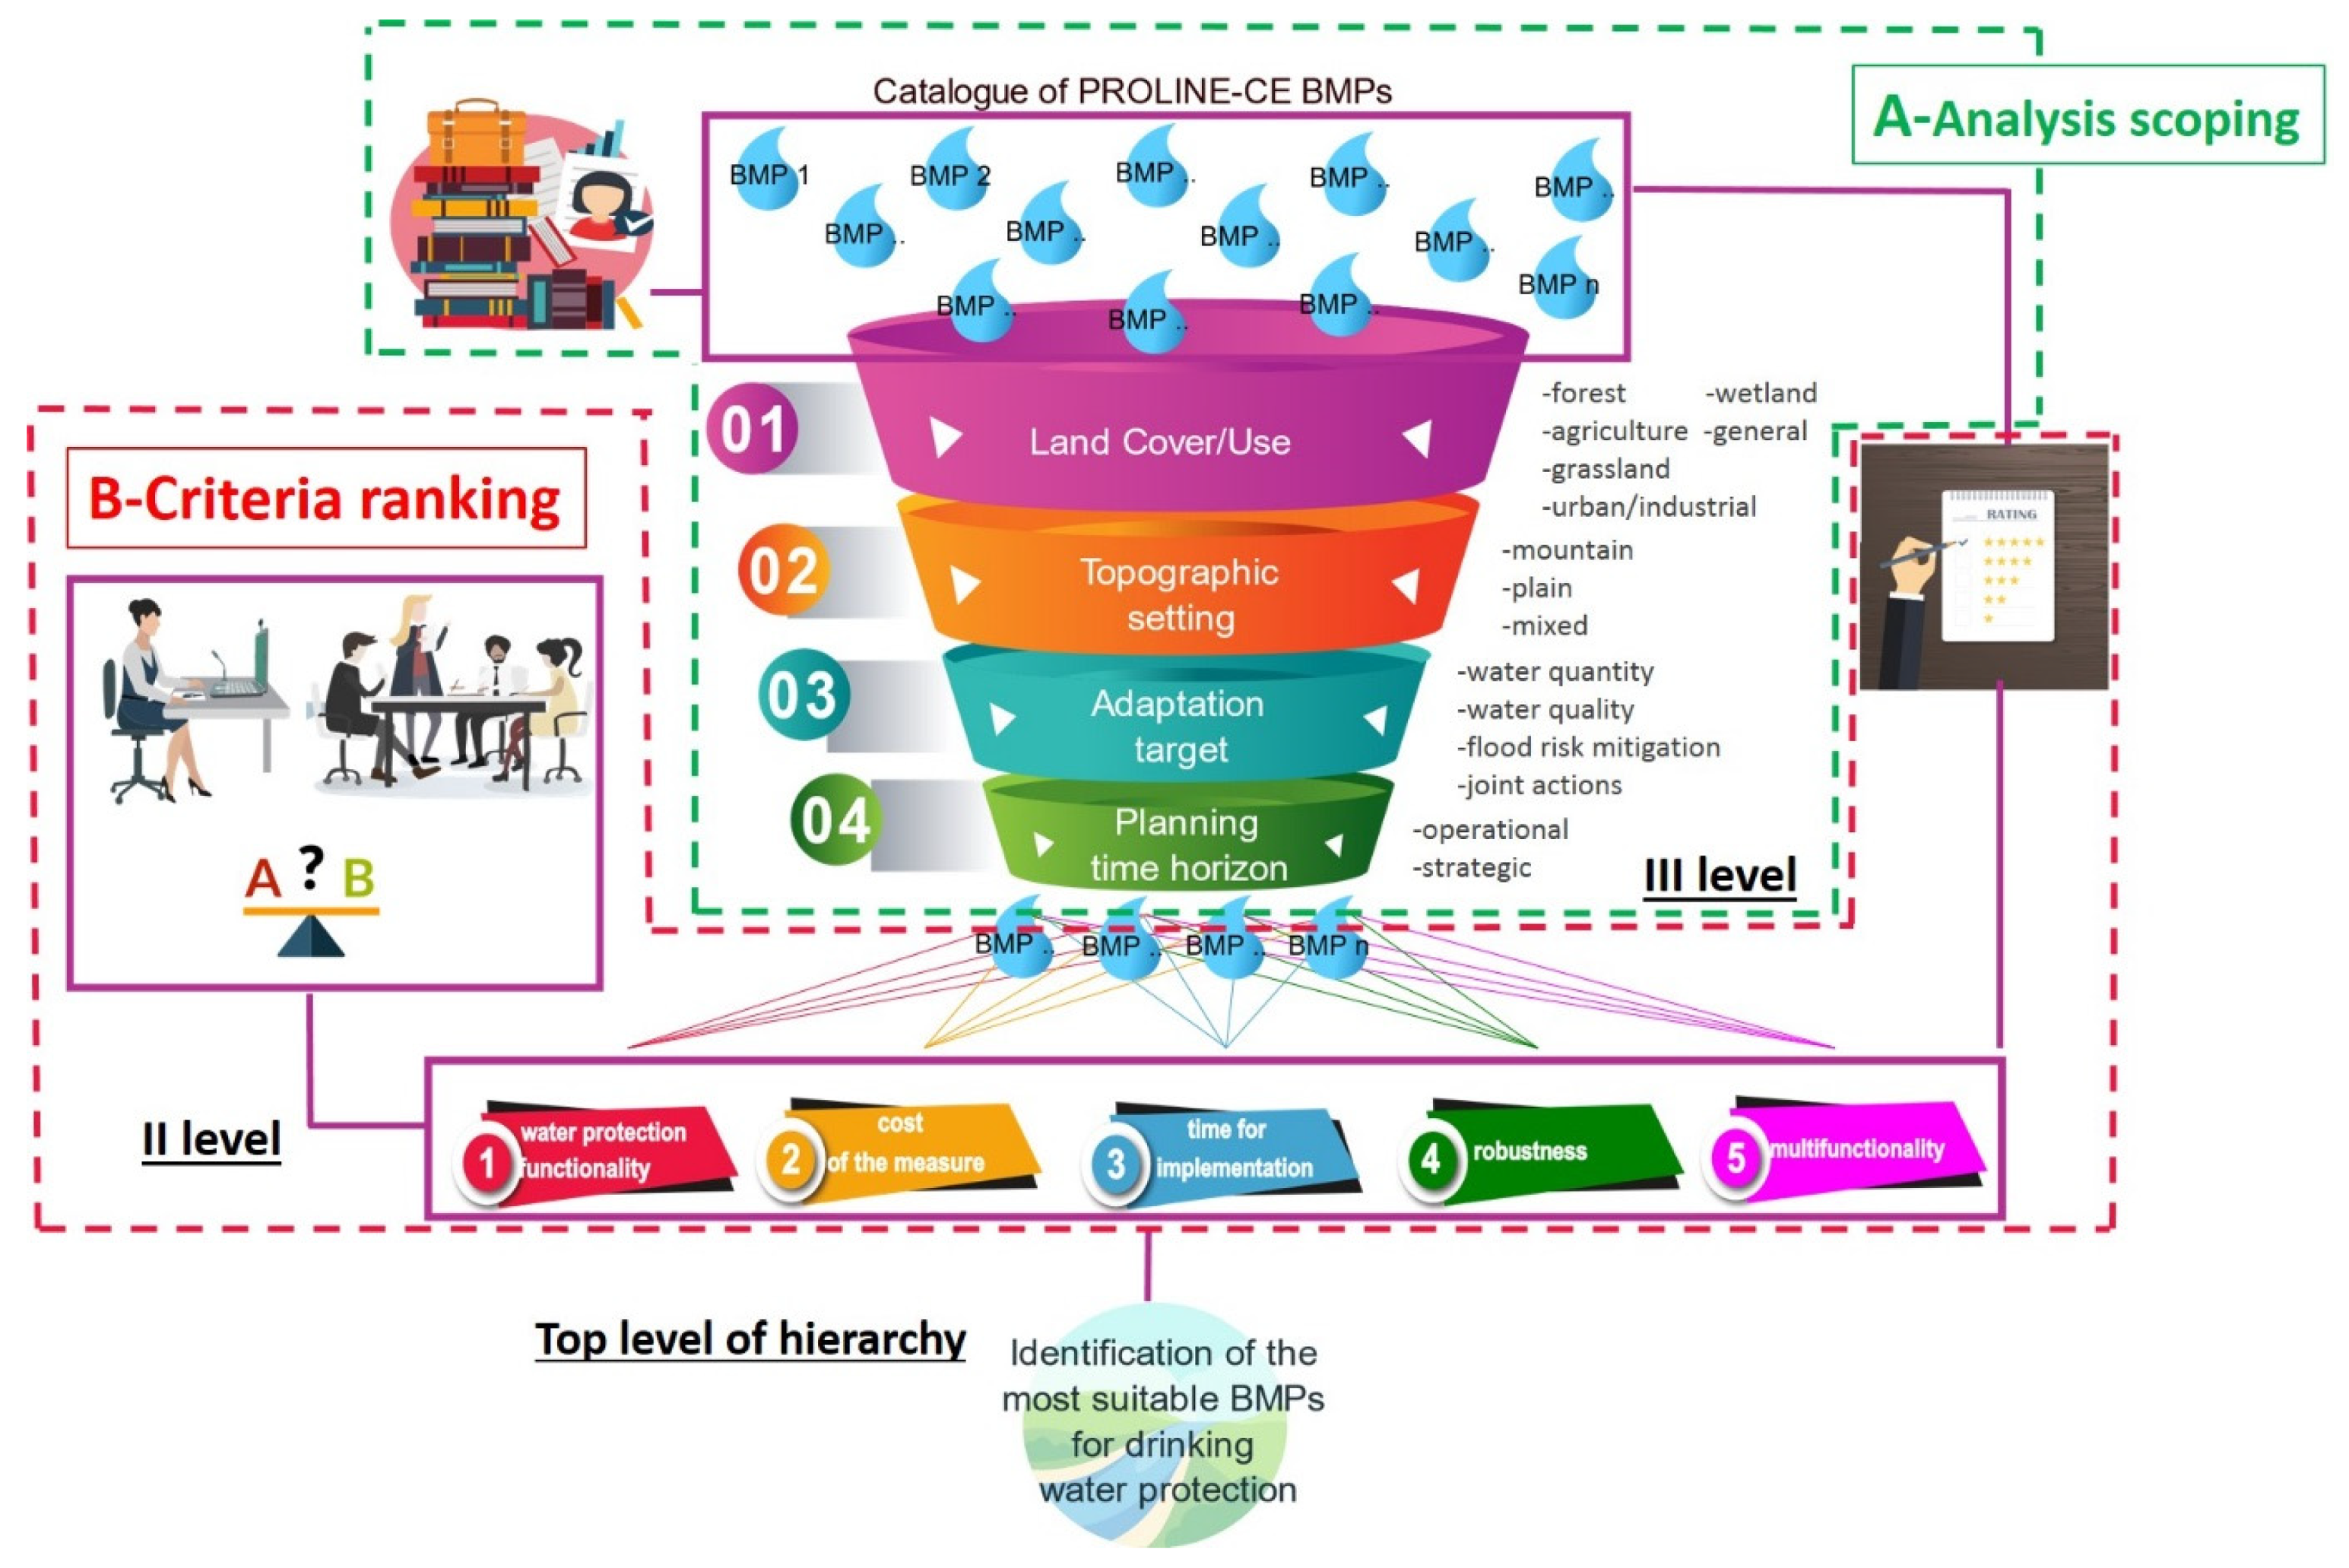
3.1. BMPs Identification

GOWARE-DST relies on a catalogue of BMPs that have been selected and reviewed at national scale by experts, involved in the PROLINE-CE Project, who provided specific information about the level of suitability of each practice in terms of land use, topographic setting, adaptation target, planning time horizon (§3.2). Furthermore, the expert-based approach has allowed characterizing the practices taking into account the following criteria:
  • Water protection functionality, intended as the BMP effectiveness for the main adaptation target in terms of protection of water resources (quality and quantity) and flood risk mitigation;
  • Cost, intended as the relevance of the economic constrains;
  • Time necessary for the implementation of the BMP;
  • Robustness of BMP, intended as the BMP resilience to further external forcing neither planned in design phase nor perfectly recognizable;
  • Multi-functionality, intended as the BMP capability to address also further functions and foster co-benefits (e.g., provisioning, climate regulation, recreational).
For each of the proposed criterion, sectoral experts provided quantitative judgments (Ji with i = 1,...,5) in rates from 1 to 5, where "1" stands for worst performances (low functionality, high costs compared to benefits, long implementation times, low robustness, reduced multi-functionality) while "5" stands for best-performing conditions. It is clear that the expert-based judgments are strongly influenced by the expertise of the single individual that provides the evaluation based on her/his sectoral-specific knowledge and accounting for the specific geographic context in which she/he is acting. The provided judgments could be therefore revised if the context of interest changes, in terms of both accounted issues (e.g., erosion, landslides) and geographic location of the investigated areas.
Finally, different types of additional information have been provided for a better characterization of the practices. Specifically, the following additional aspects have been accounted:
(i)
nature/typology of the practice (governance, structural, land use management);
(ii)
the Key Type of Measures (KTM) provided in the Water Framework Directive (2000/60/EC; https://ec.europa.eu/environment/water/water-framework/index_en.html) potentially associated to the practice;
(iii)
the EU legislation (mainly Directives) of reference for the practice;
(iv)
scientific resources relevant for the implementation of the practice (including grey literature, peer-reviewed papers and EU projects);
(v)
additional project measures (APM), corresponding to five typologies of measures specifically proposed in PROLINE-CE Project (Table 1).

3.2. Analysis Scoping

The first stage implemented through GOWARE-DST (Analysis scoping) allows the User defining the specific context in which she/he is operating, taking into account four filters:
  • Land Cover/Use: forests, agriculture, wetlands, grasslands, urban and industrial areas and general water management measures for heterogeneous landscapes;
  • Topographic Setting: plain, mountain or composite landscape;
  • Adaptation Target: one or more targets among water quantity, water quality, and flood risk mitigation;
  • Planning Time Horizon: operational (day-by-day), strategic (up to five years).
The filters “Land use/cover” and “Topographic setting” refer to the physical context in which the BMPs have to be implemented while “Adaptation target” and “Planning time horizon” identify specific characteristics of the BMPs.
The selection of these options allows filtering a sub-set of BMPs, extracted among those constituting the catalogue at the basis of GOWARE-DST.

3.3. AHP Analysis and Criteria Ranking

In the second stage of analysis (criteria ranking), the user provides her/his judgments in order to assign a relative importance value to each of the characterization criteria (functionality, cost, implementation time, robustness, multi-functionality) and prioritize the BMPs among those passing the pre-selection in Stage 1. For this purpose, GOWARE-DST adopts the Analytic Hierarchy Process (AHP), an analytical approach developed for assessing the relative importance among a number of alternatives [20]. The method is based on a number of comparisons among the criteria for the definition of a pairwise matrix and the calculation of a priority vector whose elements indicate the value of importance of each criterion. The comparison matrix obtained by accounting for the criteria proposed in GOWARE-DST is shown in Table 2, in which the five characterizing criteria are compared each other generating ten pairwise comparisons (cells above the principal diagonal).
Scores and judgments used for assigning a quantitative value to each comparison between the criteria are indicated in Table 3, where “Ai” indicates the Criterion 1 and “Aj” indicates the Criterion 2 accounted for in the comparison.
Details about the AHP method and its operative implementation are provided in Appendix A.

3.4. Consistency Evaluation and Missing Judgments

GOWARE-DST incorporates a technique for checking the consistency of the user’s judgments in order to reduce the bias in the decision-making process and therefore avoid rank reversal issue. Furthermore, the tool can provide a warning to cope with the case in which the user cannot provide her/his evaluation (missing judgment). A deep desk review concerning the approaches proposed in the scientific literature for the consistency evaluation and for the management of the missing judgments issue has allowed choosing the methods of analysis that better fit the State-of-the-art.
Details about the methodological approaches are provided in Appendix B and Appendix C.

3.5. Group Decisions

If the decision-making process is carried out by groups of decision makers such as boards or teams of experts and stakeholders, it is opportune accounting for all the opinions provided by each user and aggregating them in order to evaluate a synthetic score for each comparison to be inserted in the pairwise matrix. Different methods are available to cope with the aggregation of multiple judgments, such as the Aggregation of Individual Judgments (AIJ) and the Aggregation of Individual Priorities (AIP) [40]. In GOWARE-DST, the issue is addressed by applying the AIJ method.
Details about these methodological approaches are provided in Appendix D.

3.6. Data Collection for Testing GOWARE-DST

The trial phase of GOWARE-DST was aimed at evaluating the grade of users’ awareness respect to the AHP model and collecting their feedback about the operative implementation of web-tool.
Specifically, GOWARE-DST has been tested during dedicated meetings organized by Project Partners in February, June and September 2019. General information about the meeting organization is provided in Table 4.
The first test (Test 1) was carried out during the “Second Project Round Table” (held in Budapest in February 2019) and it was aimed at testing the understandability of AHP approach for non-experts. During the event, participants were asked to provide their own opinion about the relative importance of the criteria by providing a numerical score to each pairwise comparisons. To this purpose, a printed questionnaire was handled to each participant for collecting the individual judgments.
The second test (Test 2) was carried in June 2019 and it was aimed at testing the web-version of GOWARE-DST and evaluating its usability and usefulness by collecting feedback from potential users. The tool was tested during meetings and video-conferences that were organized in each Project’s participating country (Austria—AT, Slovenia—SI, Hungary—HU, Croatia—HR, Italy—IT, Poland—PL, Germany—DE). In this case, users were asked first to use the on-line version of the tool and then to highlight any weaknesses and bugs found by using it. To this purpose, a dedicated web survey, composed by five specific questions, was implemented to collect users’ opinions and suggestions. Specifically, 29 institutions have been involved in this testing phase, including national and regional authorities directly related to water and land management, water supply companies, research centers and municipalities. The total number is counted as follows: AT: 2; SI: 2; HU: 10; HR: 4; IT: 3; PL: 6; DE: 2.
The third test (Test 3) was carried out in September 2019 during a workshop with farmers and agronomists out of Central Europe Region (Paestum, Southern Italy). In order to test the AHP method, participants were asked to provide their judgments about the pairwise comparisons among the criteria by using a specific interactive presentation tool “MENTI”, which easily allows collecting multiple judgments and calculating the aggregated scores (as mean value) to be associated to each pairwise comparison. In order to define a typical context of analysis suitable for the audience, the four filters (Phase 1 of the analysis) were previously set as following: agricultural areas, mixed topographic setting, water quality, strategical and operational planning.
Data collected during the three tests have allowed calculating the priority vectors of the weights to be assigned to each criterion. Specifically, for data collected during Test 1 both the aggregation approaches (AIJ and AIP) have been applied while only the AIP approach has been applied for Test 2. Data collected during Test 3 were directly provided by the tool as aggregated results. Furthermore, when the AIP method was used, the synthetic priority vectors have been calculated by using both the geometric and the arithmetic weighted mean of all the set of individual priority vectors. In detail, for Test 1 and Test 2, the following vectors have been estimated:
(i)
the priority vector calculated by means of the arithmetic mean (w_mean1);
(ii)
the priority vector calculated by means of the geometric mean (w_mean2).

4. Results

4.1. Catalogue of BMPs

During the PROLINE-CE activities, Project Partners have collected at national and regional scale more than 150 BMPs suitable for coping with several water-related issues, mainly concerning the ensure of drinking water availability (especially during flood/drought events), the protection of water quality and the mitigation of flood impacts. These measures have been harmonized taking into account the specific context in which they can be applied. This review has allowed obtained a final catalogue of 92 BMPs (listed in Appendix E). Specifically, most of the identified practices are designed to address general water-related issues (26) and to be applied in urban/industrial areas (20) while, on the other hand, few of them are devoted to the water resources management in wetland and grassland areas (5 and 11, respectively). Furthermore, 13 measures are suitable to be implemented in forest areas and 17 measures propose practices to be applied in agricultural zones. The percentage of BMPs suitable to be implemented in each land use category is reported in Figure 2.
By analyzing the set of the BMPs it emerges that most of the investigated measures (almost 88%) are aimed at protecting water resources in terms of water quality: about 40% of the practices address specifically the water quality aspect, approximately 32% are able to cope with all the water-related issues considered in PROLINE-CE Project while some can address at the same time also water quantity (8%) or flood mitigation (11%) issues. In addition, the analysis shows that very few practices are exclusively devoted to ensure the protection of the water availability and the management of floods (7% and 5%, respectively). Accounting for the topographic setting, it resulted that most of the selected BMPs can be implemented in both mountain and plain areas and very few are appropriate for a specific zone. Furthermore, considering the planning time horizon, it results that half of the proposed measures are suitable for operative purposes (following a day-by-day implementation) and the other half is designed for strategical actions (with an acting time horizon up to five years).
Taking into account the value of the judgments “Ji” associated to each criterion of characterization, it emerges that most of the practices (44%) are characterized by high functionality in terms of both protection of water resources and flood risk mitigation. Considering the “economic issue”, most of the practices (41%) exhibit a medium cost/benefits ratio (J3 = 3). Accounting for the time necessary for the implementation, it emerges that, even if some practices have long implementation timeframe, most of the measures could be implemented quite rapidly (J5 = 5 in 47% of BMPs). In both cases (cost and time for implementation), less than 6% of the practices present the lowest rank value (Ji = 1). Furthermore, a very high number of practices presents high resilience to external factors not planned in the design phase and very few of them (<5% with J4 = 1) present a low robustness. Finally, almost half of the BMPs are also suitable to address issues not directly related to the water protection, being characterized by a high multi-functionality (J5 = 4–5) while very few of them are characterized by a low level of multi-functionality (J5 = 1 in <5% of BMPs).
Finally, considering the additional information provided for the contextualization of each BMP, it emerges that, most of the identified practices (59) are in the governance category, 44 are aimed at supporting structural actions and 39 provide operative land use management indications. Nevertheless, very few BMPs (9) are suitable to be used at the same time for governance, structural, land use management strategies. Furthermore, with regard to the EU legislations, the Groundwater Directive (2006/118/EC), the Nitrates Directive (91/676/EEC) and the Environmental Quality Standards Directive (2013/39/EU) result to be the reference Directives for most of the BMPs. In addition to the EU Directives, the following EU Regulations are also used as reference for the BMPs identified for the water protection in the agricultural areas: Fertilizers Regulation (EC Regulation N. 2003/2003), Regulation on the Registration, Evaluation, Authorization and Restriction of Chemicals (EC Regulation N. 1907/2006), Plant Protection Products Regulation (EC Regulation N. 1107/2009), Biocidal Products Regulation (EU Regulation N. 528/2012), Regulation on Invasive Alien Species (EU Regulation N. 1143/2014).

4.2. Analysis of Data Collected During the Trial Phase

During the first testing phase (Test 1), 42 questionnaires were collected and, among these, 40 were correctly filled in (95%). The analysis of the results (Table 5) shows that according to 90% of the answers, water protection functionality is more relevant than the cost of the measure; similarly, 85% of the people believe that this criterion is more relevant than the time necessary for the measure implementation. Furthermore, at least 60% of the participants indicated that water protection functionality is more relevant than BMP both robustness and multi-functionality. The cost of the measure is considered more relevant only when compared with the time necessary for its implementation (more than half of respondents). On the other hand, the implementation time has not high relevance compared to the other criteria: only when compared with the BMP robustness and cost, more than one third of participants (15 and 14, respectively) gave a positive feedback to this characteristic. In the case of robustness, stakeholders gave a higher relevance when compared to the cost of the measure and the time of implementation (55% and 42.5%, respectively). Finally, the multi-functionality has a higher relevance almost in all the pairwise comparisons (57.5%, 62.5%, and 40% compared with cost, implementation time and robustness, respectively) whilst it has a lower relevance only in the case of the comparison with water protection functionality (according to 20% of the interviews).
During the second test (Test 2), the web-tool was evaluated by 32 users, who have correctly filled in the web-questionnaire. Collected feedbacks highlight that users expressed a strong interest and approval in GOWARE-DST and in the methods of analysis implemented within. Furthermore, users have identified a number of minor bugs (e.g., compatibility with different browsers or visualization), which have been already fixed by tool developers.
During the third test (Test 3), 11 users’ judgments about the comparison among the criteria were collected and made available in aggregated terms (Table 6). Data elaborated from this survey indicates that multi-functionality results to be the most relevant criterion, since it is preferred in all the comparisons with the other criteria. Likewise, participants have considered the robustness of the measure an important characteristic, since it is preferred in the comparison with functionality, cost, and implementation time. The cost and time required for the implementation of the BMPs seem to have the same relevance. Differently from the results of the Test 1, comparisons’ judgments in Test 3 show that “water protection functionality” has been considered as the less relevant criterion, being equated only to the cost of the measures.
The users’ judgments collected during the GOWARE-DST trial phase have allowed applying the AHP model for the estimation of the priority vectors and therefore evaluating the weights to be assigned to each criterion. In detail, the quantitative score values (ranging from 1 to 9) provided by users to each comparison have been used to fill in the pairwise comparison matrix. To this aim, all the single quantitative users’ judgments collected in Test 1 and Test 2 have been taken in account to calculate the priority vector. In Test 1, the aggregation of all the matrices into a single comparison matrix (AIJ approach) has allowed estimating the following priority vector “w”:
w = (0.38; 0.12; 0.12; 0.17; 0.21)T
On the other hand, the Aggregation of Individual Priorities (AIP) method has been applied to data collected in both in Test 1 and Test 2. In this case, the priority vectors estimated from each single user’s judgment (40 in Test 1 and 28 in Test 2) have been aggregated by means of the arithmetic mean (w_mean1) and geometric mean (w_mean2) (Table 7).
Considering the priority vectors estimated for each Test, it emerges that in the case of Test 1 and Test 2, the criteria have almost the same relevance since the weights to be assigned to each of them have almost the same order.
In detail, the values of the elements in priority vectors of Test 1 (w1, w5, w4, w2, w3) show that “water protection functionality” results to be the most relevant criterion taken into account by stakeholders in their decisions (w1 = 0.34 and 0.31), as well as “time necessary for the implementation” of the BMPs is considered as the least relevant aspect in the selection of suitable water management strategies (w3 = 0.12 and 0.10). An important role is played by the capability of the measure to address more than one function and service (multi-functionality; w5 = 0.21 and 0.19). Finally, the “cost for the implementation” of the measures and their “robustness” have an intermediate level of relevance compared to the other criteria (w2 = 0.15 and 0.12; w3 = 0.18 and 0.15).
“Water protection functionality” turned out to be the most relevant aspect taken in consideration by key users also in Test 2 (w1, w4, w3, w5, w2). In this case, “robustness” results to be of strong interest, since it gained high relative weights (w4 = 0.21 and 0.20). Finally, both priority vectors show that users’ judgments gave low importance to the “economic issue” required for the measure implementation (w2 = 0.17 and 0.15).
Quantitative results of Test 3 (w5, w4, w3, w2, w1) confirm that “robustness” (w5 = 0.40) has resulted to be the most relevant factor taken into account by participants, which, on the other side, have shown low interest in the “cost required for the implementation” of the measures (w2 = 0.11) and in their “water protection functionality”(w1 = 0.09).
Taking into account the two approaches proposed for the aggregation of the users’ judgments (AIJ and AIP methods), the obtained results highlight that:
(1)
in Test 1, the priority order of the criteria does not change when the two methods are used (w1, w5, w4, w2, w3);
(2)
in the case of AIP method (Test 1 and Test 2), the differences between the vectors estimated by means of the arithmetic and geometric weighted mean are negligible (≤0.03 in Test 1 and ≤0.02 in Test 2); and
(3)
in Test 1 and Test 2, the priority order of the criteria does not change when two averaging methods (arithmetic and geometric mean) are used (AIP approach).
The consistency analysis has shown that most of the judgments provided by users during the Test 1 were characterized by low consistency; in detail, only 27.5% of them (11 questionnaires) gained a Consistency Ratio (CR) lower than the fixed threshold (0.1) resulting therefore consistent. On the contrary, the aggregated judgments’ scores evaluated from the data collected during Test 3, presented a CR equal to 0.07, resulting therefore comprehensively consistent. Finally, only in case of Test 2 it has not been possible to evaluate the consistency, since the downloadable data collected from the GOWARE-DST web-platform provides the estimated priority vectors, without indicating the quantitative judgments’ scores.

5. Discussion

The development of GOWARE in the form of a Decision Support Tool (DST), to select measures for the management of the user-defined issue, has required an agreement among all the involved Project Partners on the analysis procedures to be implemented in the tool. Furthermore, GOWARE-DST creation has been strongly supported by the participation of the stakeholders that, has potential tool’s users, have played a fundamental role in both the design and trial phase. In particular, the consultation process has involved stakeholders with different backgrounds, such as ecologists, hydrogeologists, foresters, urban planners, university researchers, policy as well as local water suppliers and farmers. From them, a number of considerations concerning advantages, limitations and possible future improvements of GOWARE-DST have emerged. In general, stakeholders expressed a strong interest and approval for the tool, which proved to be easily interpretable and usable and, therefore, an effective instrument to support the decision-making processes for the management of water resources at different planning levels. In this sense, GOWARE-DST meets the requirement of the European Commission [41], which specifically suggests developing and implementing innovative solutions and tools for dealing with water quantity and quality issues.
The analysis of the BMPs’ characteristics included in the catalogue confirms that GOWARE-DST is actually suitable to be applied by different categories of stakeholders since the proposed measures are characterized by different context of application (policy strategy and operational intervention level). Administrators and decision-makers could therefore benefit from the high availability of strategical practices that meet their long time territorial planning requirements while, on the other hand, operational measures, such as those devoted to the implementation of sustainable agricultural practices, can be of greatest interest for local users (e.g., farmers, individuals). Another relevant aspect emerging from the analysis is related to the type of issue that BMPs address, since most of the measures (up to 80) are devoted to the protection of the quality of the drinking water resources. Among these, very few are suitable to couple water quality protection with flood impacts mitigation (10 measures) and water availability management (7 measures). This aspect highlights that in the Project’s participating countries water pollution as consequence of the high use of chemicals in agricultural areas and weaknesses in sewage handling in urban zones has been viewed as a priority issue. On the other hand, water scarcity could play a minor relevance and drinking water availability mostly depends on the correct distribution of water resources and effective maintenance of the water supply systems rather than on the natural water recharge. This is probably due to the geographic distribution of the Project pilot cases, which are mainly located in the Central Europe region where drought events are less frequent than in arid-semiarid regions of Mediterranean basin, such as the southern area of Spain [42,43] and Italy [44,45], in which the impacts of climate change on water yields are already occurring [46,47,48,49,50]. Furthermore, model simulations carried out to assess the future impacts climate change on water cycle show that the drought-affected regions of Mediterranean basin have to deal with steadily decreasing availability of all water balance components [51]. Nevertheless, IPCC studies as well as other scientific papers agree that significant impacts on water-resources during the next few decades as consequence of rising temperature will affect also the central and northern areas of Europe [14,17,41,52].
It is worth noting that most of the selected measures represent categories of public services [53] commonly related to general management practices for environmental protection and restoration and therefore, if appropriately implemented, they can guarantee the preservation of the ecosystem and hydrological services provided by different land-use categories [54]. By way of example, considering “water-quality damage mitigation” as public service, several practices proposed in the GOWARE-DST catalogue can be implemented for ensuring the mitigation of the water contamination, such as “watercourses and riparian areas management” and “organic farming promotion” in agricultural areas. These practices can be considered themselves as public services characterized by high multi-functionality since they can guarantee at the same time other supporting and regulating services, such as soil maintenance and flood impact mitigation. In this way, GOWARE-DST meets the need to promote activities and strategies for the prevention of the loss of public goods as consequence of ecosystem degradation that, due to the complexity of ecological and social context in which public services are provided, require integrated systems of governance and engage a wide variety of actors [55].
Taking into consideration the pairwise comparison approach (AHP methodology) proposed for the evaluation of the weights to be assigned to each criterion of characterization, stakeholders have considered this approach as a new and interesting concept, worth to be extended to other decision/assessment processes not strictly related to water management issues. As improvement, they pointed out that providing more detailed information about how to choose the numerical judgments’ value (ranging between 1 and 9) could strongly facilitate the usability of the tool.
The outcomes of the user’s tests carried out during the trial phase (Test 1, Test 2, Test 3) allow confirming the users have easily understood the AHP approach and the concept of pairwise comparisons; nevertheless, the consistency analysis of the data collected in Test 1 showed that most of the judgments (29 users’ judgments, corresponding to 72.5% of the collected data) resulted inconsistent. This aspect points out that the consistency value fixed as threshold (0.1) is probably too challenging especially when the users are asked to try the tool within a limited time span and without getting real time feedback about the consistency of their judgments.
From the testing phase results, it has also emerged that the priority order gained by the characterizing criteria is not constant: in Test 1 and Test 2, the “functionality” of the measure is characterized by a very high relevance while in Test 3, this criterion gained the lowest score. In this case, the “multi-functionality” has resulted to be the most relevant criterion. This result may reflect the background of the workshops’ participants: In fact, researchers and water managers, which are potentially mainly interested in the scientific and effective evaluation of the functionality of a specific measure, have been involved in the events organized for Test 1 and Test 2. On the other hand, most of the participants who took part in the Test 3 were farmers and practitioners, who were deeply interested in measures able to cope with more than one issue. It is relevant that the “cost” required for the measure implementation has gained a low and very low relevance in all the three tests, highlighting that users that have already tested the tool are not influenced by the economic aspect for the selection of BMPs.
The availability of “additional information” has been well accepted and considered very useful for better contextualizing BMPs in the EU governance framework. Nevertheless, stakeholders have proposed to add further information specifically concerning the water-related national legislations and the national administrative requirements for each BMP, to facilitate the operative implementation of the measures at local scale.
In order to tailor the system to the main requirements of the users, most of the bugs and suggestions highlighted by key testers have been already fixed and implemented in the web-tool during the last period of the PROLINE-CE lifetime.
Further developments of the DST will be aimed at addressing a number of aspects that could improve the present version of the tool. First of all, a correlation analysis will be stressed and eventually introduced in order to run simple methods for reducing the number of pre-selected BMPs. Then, at this stage of the analysis, sensitivity tests are not carried out. Somehow, the tests carried out during the trial phase and also presented in the paper are used for “learning-by-doing”. Finally, the last aspect will concern the introduction of a number of correction tips to be provided in case of inconsistent results. This will help users in modifying their priority in order to provide consistent choice and achieving coherent results.
If compared with other interactive DSTs already available on-line, it emerges that GOWARE-DST tries to provide a more general frame of action, since it is not focused on a specific land use or environmental context. Furthermore, even if at this stage the tool is specifically devoted to address water-related issues, it can be easily extended by adding BMPs with focus on other relevant environmental topics, such as those related to the management of groundwater intakes of drinking water (e.g., boreholes), saltwater intrusion, slope instability, and soil erosion. In particular, special attention should be provided to the assessment of the direct and indirect impacts of climate change on ecosystems and water resources and to the identification of the most suitable adaptation practices. In this way, GOWARE-DST could bridge the gap with other approaches and tools that have been proposed to properly support the selection of effective climate adaptation strategies in a specific environment, such as the case of RISC-KIT for the coastal areas or CLIMATEAPP for the urban and rural areas. In order to allow the users in contributing to the improvement of the BMPs catalogue, further development of the web-tool could permit them to suggest suitable measures when they do not find that/those they consider suitable or they have already implemented/designed with satisfying results. After a proper validation procedure, the indicated measures will be added to the catalogue. In this way, the number of available BMPs will increase but at the same time, the risk of overlapping conditions will be reduced.

6. Conclusions

GOWARE-DST represents one of the main results achieved in the framework of the PROLINE-CE Project, whose development has taken advantage of the strong collaboration during the entire Project duration between the Project Partners and involved stakeholders. The tool has been designed to assist users by providing effective information about the management approaches for the improvement of surface drinking water resources protection and the enhancement of flood/drought impacts mitigation. It is therefore aimed at facilitating the implementation of existing strategies and management plans towards increasing effectiveness of land-use management actions and improving organizational structures.
The definition of GOWARE-DST design as well as the organization of the activities for the stakeholders’ engagement have favored the development of a productive network of researchers, decision-makers, administrators and local stakeholders, leading the foundations for further transnational cooperation. This will also simplify the transfer of the acquired knowledge and achieved results at local, regional, national, and transnational scale.
As final remark, it is worth to note that, due to the high relevance of climate change impacts on water resources, further developing activities will be aimed at promoting a more comprehensive review of practices for the water protection under different climate scenarios. In this way, GOWARE-DST will represent a basis for the improvement of the policy guidelines, supporting the definition and the mainstreaming of effective adaptation strategies and governance activities at national (guidelines issued by state agencies) and local (e.g., adaptation measures implemented by public water suppliers, municipalities) level. At the same time, it will also promote the fulfilling of the Second Cycle of Flood Risk Assessment and Management Plans (due in 2021) required by the Flood Directive, in which specific requirements on climate change are prescribed.

Author Contributions

M.S., A.R., and G.R. mainly worked on the design of GOWARE-DST and on the selection of methods to be implemented in the tool. They also worked on the implementation of the off-line version of GOWARE-DST, developing all the files included in the toolkit. A.C. and P.B. developed the web-tool and, after the test, they implemented all the suggestions provided by key users. Furthermore, A.R. and G.R. wrote the draft version that was revised by M.S., A.C. and P.B. All authors have read and agreed to the published version of the manuscript.

Funding

The activities of this research have been undertaken in the framework of PROLINE-CE Project, funded by the Interreg Central Europe Programme (2014–2020).

Acknowledgments

The authors thank Hubert Siegel from the Austrian Federal Ministry of Sustainability and Tourism as Project Leader, Elisabeth Gerhardt from the Federal Research Institution for Forests, Natural Hazards and Landscape (Austria) and Barbara Čenčur Curk from the University of Ljubljana (Slovenia) for a great deal of effort into all the development stages of the Project. Furthermore, the authors would like to thank all the PROLINE-CE Project Partners and sectoral experts who have contributed with their specific expertise to the BMPs revision and classification. Furthermore, they provided a strong contribution in the organization of the stakeholders’ engagement events.

Conflicts of Interest

The authors declare no conflict of interest.

Appendix A

Analytic Hierarchy Process (AHP)
The Analytic Hierarchy Process (AHP) is a Multi-Criteria Decision Analysis (MCDA) tool introduced and developed by Thomas Saaty in 1980 [20] for supporting the analysis of complex decision-making processes and the selection of the most suitable decisions among a number of alternative solutions. It, therefore, considers a set of options among which the best decision is to be made based on a number of evaluation criteria and user’s requirements.
The AHP allows assigning a priority to a series of decision-making alternatives and identifying the one(s) that achieves the most suitable trade-off among all the available solutions. The process starts with dividing the decision-making problem into different elements in order to form a hierarchical order that simplifies the decision analysis. Once the hierarchy is built, the users systematically evaluate the various elements by comparing them to each other by means of pair wise comparisons (considering the criteria two-by-two) and giving them a score with respect to their relative impact on an element above in the hierarchy. In making the comparisons, the users typically use judgments about the elements’ relative meaning and importance. The quantitative judgments’ scores are then transferred to a pairwise comparison matrix [23]. The process ends with the attribution of a weight to each of the available alternatives. In this way, it is possible to identify the most suitable solutions that better address the user’s issue.
The available alternatives (Ai; i = 1, …. j) represent the criteria that can be selected in the decision-making process. In general terms, Ai is defined as the i-alternative and “aij” is the numerical score resulting from the comparison between Ai and Aj. If the number of alternatives is “n”, the number of total comparisons is n (n−1)/2. These comparisons will generate the comparison matrix Anxn that will be used to calculate the weight values of each single alternative. The creation of the pairwise matrix requires therefore an evaluation process for indicating how much one alternative is more important than another one.
The diagonal elements of the pairwise matrix are always equal to 1 being the comparison made between the same alternatives, while the non-diagonal elements show the relative importance of the alternatives taken into account in the specific comparison. If the elements of the pairwise comparison matrix are shown with aij, which indicates the importance of alternative “i-th” over “j-th”, then “aji”could be calculated as 1/aij [56]. An example of a pairwise comparison matrix is shown in Table A1.
Table A1. A generic comparison matrix.
A1A2A3Aj
A11a12a13a1j
A21/a121a23a2j
A31/a131/a231a3j
Aj1/a1j1/a2j1/a3j1
From Table A1, it is clear that the comparisons are made between the elements of the upper region of the matrix (the cells above the principal diagonal) and that the score values in the lower part (the cells below the principal diagonal) are equal to the reciprocal values assigned in the upper cells.
Once the weight comparison matrix is obtained, the AHP method employs different techniques to determine the final weights of each alternative: one of the most used technique is the “eigenvector approach” (lambda max technique, λmax), in which a vector of weights is defined as the normalized eigenvector corresponding to the largest eigenvalue λmax. Nevertheless, this method requires hard efforts and for this reason, simplified methods, which provide a good approximation of the lambda max method and easily enforceable in programming codes, have been proposed [57,58].
Among the others, the mean of normalized values is a method that allows calculating an approximation of the eigenvector associated with the maximum eigenvalue through a simple arithmetic procedure. In this case, first the sum of the scores S (a) in each column of the pairwise comparison matrix is calculated (Equation (1)).
S ( a j ) = i = 1 n a i , j
Then, each element in the column is divided by the value calculated sum S(aj) (Equation (2)) in order to obtain normalized values N(a) and the corresponding normalized pairwise comparison matrix Anorm.
N ( a i , j ) = a i , j / S ( a j )
Last, the arithmetic average of the entries on each row of Anorm is calculated to build the Priority Weight Vector “w” that is an n-dimensional column vector obtained from (Equation (3)).
w i = j = 1 n N ( a i , j )   n
Based on the results of this analysis, it is possible to state how important each alternative is in the decision-making process (accounting for the percentage of weight values). The values provided by the AHP analysis are used to return the weighted sum (R) related to each BMP by applying (Equation (4)), where w i identifies the weight values evaluated for each alternative and J i is the quantitative judgments (Ji with I = 1,...,5) that sectoral experts have provided in rates from “1” to “5” for each of the proposed criterion.
R = i = 1 5 w i   J i
BMPs can be ranked according to the “R” values so obtained, returning the most suitable options tailored according to user’s preferences.

Appendix B

Consistency evaluation
It is good practice that AHP analysis incorporates an analytical technique for checking the consistency of the decision maker’s evaluations, thus reducing the bias in the decision-making process and therefore avoiding rank reversal issue.
In order to fulfil this purpose, the accuracy of the matrix, which is referred to the consistency of the pairwise preferences, is evaluated by means of the Consistency Ratio using the following formula [57]:
CR = CI / RI
where CI represents the Consistency Index and RI is the so-called Random Index.
The Consistency Index CI is expressed as:
CI = ( λ max n ) / ( n 1 )
where λmax is the principal eigenvalue of the matrix (it is a scalar) and “n” is the order of the matrix.
Operatively, CI can be calculated by the matrix product of the pairwise comparison matrix and the weight vector (multiplying each score in each column of pairwise comparison matrix by its weight) and then calculating the weighted mean of each row of the new matrix.
RI depends on the number of elements that are compared (n). RI values, referred to different values of n, are shown in Table A2.
Table A2. Random Index (RI) values for “n” ranging from 1 to 8 (adapted from [20]).
n12345678
RI0.000.000.580.901.121.241.321.41
According to [20], in a 5 by 5 matrix, a threshold equal to 10% (5% and 8% for the 3 by 3 and 4 by 4 matrices, respectively) has to be adopted for considering the matrix as consistent and therefore for accepting the estimation of the Priority Vector “w”.
Specifically, the value of CR = 0.1 indicates that the judgments are 10% inconsistent [59].

Appendix C

Missing comparisons
In complex decision-making processes, it can happen that user may not (does not want to) provide a score for the evaluation of the relative importance between two criteria. This could lead to an incomplete pairwise comparison matrix in which some entries are missing. In this case, the AHP model requires setting its parameters to avoid overestimating weights to be assigned to the accounted criteria. Several methods have been proposed for solving this issue, mainly based on the following two approaches: 1) the comparison matrix is completed by means of an expert based judgment and then the priority vector is calculated; 2) the priority vector is directly calculated by means of modified algorithms.
When the “the eigenvector approach” or “the mean of normalized values” procedure are applied, the missing comparisons issue is generally faced by applying the method proposed by [60], in which the priority vector is estimated without completing the comparison matrix but considering only the available comparison values for creating a supporting matrix. In details, the supporting matrix is constructed by setting “zero value” to the cells referring to the missing comparisons and increasing the score value in the diagonal by adding the number of missing comparisons present in the accounted row (1 + mi, where “m” refers to the number of missing values in the “i-th” row). By applying the proposed algorithm, the estimation of the priority vector is not affected by the presence of missing values.

Appendix D

Group decisions
Generally, in real context of analysis, decisions are made by groups of decision makers such as stakeholders, boards or teams of experts. In this case, it is opportune accounting for all the provided opinions and aggregating them in order to provide a synthetic weight priority vector. According to [40], there are two methods to derive a priority vector from a set of pairwise comparison matrices:
(1)
Aggregation of Individual Judgments (AIJ), in which the comparison matrices are aggregated into a single comparison matrix from which the priority vector is calculated. In this case, the priority vector estimation takes place after the aggregation of all the single judgments from a single pairwise comparison matrix.
(2)
Aggregation of Individual Priorities (AIP), in which a set of priority vectors is calculated from all the available pairwise matrices and then they are aggregated to obtain the representative priority vector. In this case, the priority vector estimation takes place after the derivation of all the priority vectors derivation.
In the second case, the aggregation of all the priority vectors derived from each single comparison matrix can be performed by calculating the weighted geometric mean or the weighted arithmetic mean. These two formulas clearly lead to different priority vectors, but they are both accepted in the literature [59].

Appendix E

List of BMPs
  • Adaptive livestock management close to dolines, swallow holes or streams
  • Structures (e.g., dams) which prevent precipitation water from direct and fast infiltration into dolines and swallow holes
  • Management of manure–timing of application, controls, supervisions and prohibitions of manuring in DWPZ
  • Implementation of measures for advisory and financial support to avoid conversion of grassland to field
  • Extensification of land-use activities on grasslands and reduction of the use of heavy machinery
  • Adaptive grazing strategies
  • Preservation of existing (permanent) grasslands
  • Low-input grasslands developed by converting arable land at risk of erosion or flooding and establishment of riparian buffer strips to prevent watercourses pollution
  • Evaluation and amendment of the Nitrate Action Plan every 4 years
  • Reduction of stocking density
  • Investments for storage of manure and training of farmers
  • New wetlands and/or wetlands restoration (re-establishment of the hydrology, plants and soils of former or degraded wetlands)
  • Water and environmental monitoring (site specific) for wetlands
  • Buffer strips between agricultural or urban areas and water bodies
  • Constructed wetlands for water treatment
  • Preservation and revitalization of wetlands on floodplains
  • Assessment of climate change impacts on drinking water resources and determination of adaptation and resilience of public water supply (e.g., reducing pipeline leakage and water reuse)
  • Climate Change adaptation and resilience in river basin management planning, Water Supplying Strategies (WSP) and water efficiency
  • Improvement of building standards for design, maintenance and operation of infrastructures (due to Climate Change: e.g., adapted urban drainage systems, integration in building regulations)
  • Voluntary agreements to prevent conflicts among the users during droughts (e.g., water use plans, drought management plans, observatories, incentives, monitoring and prevention activities)
  • Soil Protection Plans and spatial planning on water bodies
  • Assessment of flood impacts on drinking water supply systems and on water bodies (at river basin scale)
  • Identification of the pressures and responses on water quality/quantity using monitoring and modeling
  • Avoiding pardoning of illegal constructions on flood areas
  • Prevention of the surface water intrusion in the wells during flood events by sealing well heads in flood prone zones
  • Identification of the potential point pollution sources for efficient incident management in case of flood event
  • Joined and integrated management of drinking water resources (horizontal and vertical intersectoral co-operation)
  • Enforcement of Drinking Water Protection Zones restrictions
  • Prevention of saltwater intrusion into groundwater and surface waters considering impacts of climate change
  • Development of complex catchment modelling for hazards assessment and climate change impact evaluation on drinking water resources
  • Permanent, multi-aspects water monitoring at the catchment scale
  • Training and information activities for target categories of stakeholders on adequate exploitation and protection of water resources
  • Adoption of regulations to manage variable exploitation of water resources affecting water availability and quality
  • Nature-based Solutions (e.g., natural water retention measures)
  • Establishment of ecological models integrated with catchment models to predict water quality and possible impact of climate change on water resources
  • Flood plains and retention areas (protection, development, definition of what is allowed, determined separately for agricultural and urban areas)
  • Other non-structural measures (i.e., warning systems, insurances tools) not listed elsewhere
  • Improvement of water supply network to minimize water losses
  • Enhancement of catchment-oriented water management (interdisciplinary and intersectoral approach)
  • Improvement of monitoring of flood-induced groundwater pollution (included in RBMPs)
  • Integrative flood risk management plans (monitoring of the risk management plan, early warning system)
  • Enhancement of hydrological properties monitoring for water quantity (e.g., level and minimum flow rates) and/or quality (e.g., pollutants)
  • Optimization of the application of fertilisers (amount due to soil samples and redefinition of time ban of fertilizers and manure application)
  • Enhancement of the use of plants with improved nitrogen use efficiency
  • Vegetated buffer zones/strips along agricultural fields to reduce the water pollution from fertilizers and pesticides
  • Catch crops/cover crops/organic mulch to ensure the permanent soil cover
  • Regulation of pesticide application (e.g., application in spring preferred to autumn)
  • Prohibition of pesticide application in DWPZ (organic farming in DWPZ)
  • Proper crop rotation for the reduction of nitrates
  • Conservation Tillage Systems: type I - reduced or minimum tillage especially on slopes
  • Conservation Tillage Systems: type II - no tillage
  • Controlled traffic farming (using always the same tracks)
  • Contour / cross slope farming (strips of closely sown crops alternate with strips of row crops)
  • Establishment of riparian buffer strips in flood plains
  • Agro-Environmental schemes to financially support the design and the implementation of measures specifically devote to water protection
  • Evaluation and amendment of the Nitrate Action Plan every 4 years
  • Actuation of "Common Agricultural Policies" to increase the sustainable use and the protection of water resources (e.g., different Agro-environmental measures, strengthening of consultancy and research programs)
  • Organic farming (with biological pest control, permaculture) with guidelines for water protection
  • Enforcement preventing harvesting perpendicular to the slope
  • Avoidance of clear-cut applications (except sanitary cuts)
  • Continuous cover forest systems
  • Balance of the wild ungulate densities to a forest ecologically sustainable level
  • Ecological hunting practices to provide forest ecologically sustainable level
  • Resettlement of wild predators like wolves and lynx to provide a forest ecologically sustainable wild ungulate density
  • Avoidance of the tractor-skidder method
  • Resource-friendly exploitation system in order to reduce harvesting with heavy machinery
  • Restrictions of forest roads within Drinking Water Protection Zones (DWPZ)
  • Protection of old, huge, and vital tree individuals
  • Forest management considering forest fire prevention
  • Forest fire fighting practices and proper reforestation, especially on steep slopes
  • Conversion to mixed forests (according to the Natural Forest Community) in order to avoid coniferous monocultures
  • Adequate deadwood management
  • Remediation of contaminated sites
  • Flood hazard and risk mapping taking into consideration climate change and land use change within spatial planning procedures
  • Sludge management allowing adequate and safe storage and disposal
  • Wastewater collection and treatment according to EU and national standards
  • Monitoring and modeling systems of wastewater management
  • Separate systems for urban drainage and wastewater where appropriate
  • Nature-based Solutions in urban areas
  • Urban wastewater management systems to cope with the increase in population density and in seasonal variability (e.g., tourism)
  • Sewer leakage and intrusion prevention
  • Water and nutrients recycling/circular economy endorsement
  • Climate change adaptation process at municipal level
  • Innovative solutions and awareness raising activities for sustainable waste management and remediation of illegal waste disposal
  • Prevention of groundwater pollution caused by construction of big buildings with deep underground excavations
  • Wastewater treatment for industrial effluents permitting to cope also with accidental, catastrophic discharges
  • Waste management systems and storage for industrial effluents treatment systems (e.g., accidental, catastrophic discharge)
  • Emergency response measures to cope with accidental contamination
  • Optimization of the use of herbicides along railways
  • Collection and treatment of road rainwater discharge, particularly within drinking water protection areas
  • Green infrastructure and NBS considering geomorphological and climate features of the area
  • Demolition and restructuring practices, for buildings, not affecting water resources

References

  1. Mebrahtu, G.; Zerabruk, S. Concentration and health implication of heavy metals in drinking water from urban areas of Tigray region, Northern Ethiopia. Momona Ethiop. J. Sci. 2011, 3, 105–121. [Google Scholar] [CrossRef] [Green Version]
  2. Zia, H.; Harris, N.R.; Merrett, G.V.; Rivers, M.; Coles, N. The impact of agricultural activities on water quality: A case for collaborative catchment-scale management using integrated wireless sensor networks. Comput. Electron. Agric. 2013, 96, 126–138. [Google Scholar] [CrossRef] [Green Version]
  3. Mateo-Sagasta, J.; Zadeh, S.M.; Turral, H.; Burke, J. Water pollution from agriculture: a global review. Executive summary; FAO Colombo: Rome, Italy; International Water Management Institute on behalf of the Water Land ans Ecosystems research program: Colombo, Sri Lanka, 2017. [Google Scholar]
  4. Canter, L.W. Environmental Impact of Agricultural Production Activities; Informa UK Limited: London, UK, 2018. [Google Scholar]
  5. Bangash, R.F.; Passuello, A.; Sanchez-Canales, M.; Terrado, M.; López, A.; Elorza, F.J.; Ziv, G.; Acuña, V.; Schuhmacher, M. Ecosystem services in Mediterranean river basin: Climate change impact on water provisioning and erosion control. Sci. Total. Environ. 2013, 458, 246–255. [Google Scholar] [CrossRef] [PubMed]
  6. Cann, K.F.; Thomas, D.R.; Salmon, R.L.; Wyn-Jones, A.P.; Kay, D. Extreme water-related weather events and waterborne disease. Epidemiol. Infect. 2013, 141, 671–686. [Google Scholar] [CrossRef]
  7. Khan, S.J.; Deere, D.; Leusch, F.D.; Humpage, A.; Jenkins, M.; Cunliffe, D. Extreme weather events: Should drinking water quality management systems adapt to changing risk profiles? Water Res. 2015, 85, 124–136. [Google Scholar] [CrossRef]
  8. Delpla, I.; Jung, A.V.; Baures, E.; Clement, M.; Thomas, O. Impacts of climate change on surface water quality in relation to drinking water production. Environ. Int. 2009, 35, 1225–1233. [Google Scholar] [CrossRef]
  9. McFarlane, D.; Stone, R.; Martens, S.; Thomas, J.; Silberstein, R.; Ali, R.; Hodgson, G. Climate change impacts on water yields and demands in south-western Australia. J. Hydrol. 2012, 475, 488–498. [Google Scholar] [CrossRef]
  10. Mosley, L.M. Drought impacts on the water quality of freshwater systems; review and integration. Earth-Sci. Rev. 2015, 140, 203–214. [Google Scholar] [CrossRef]
  11. Parry, M.L.; Canziani, O.F.; Palutikof, J.P.; van der Linden, P.J.; Hanson, C.E. Climate Change 2007: Impacts, adaptation and vulnerability. Contribution of Working Group II to the Fourth Assessment Report of the Intergovernmental Panel on Climate Change; Cambridge University Press: Cambridge, UK, 2007. [Google Scholar]
  12. Field, C.B.; Barros, V.; Stocker, T.F.; Qin, D.; Dokken, D.J.; Ebi, K.L.; Mastrandrea, M.D.; Mach, K.J.; Plattner, G.-K.; Allen, S.K.; et al. Managing the Risks of Extreme Events and Disasters to Advance Climate Change Adaptation. A Special Report of Working Groups I and II of the Intergovernmental Panel on Climate Change; Cambridge University Press: Cambridge, UK, 2012. [Google Scholar]
  13. Field, C.B.; Barros, V.R.; Dokken, D.J.; Mach, K.J.; Mastrandrea, M.D.; Bilir, T.E.; Chatterjee, M.; Ebi, K.L.; Estrada, Y.O.; Genova, R.C.; et al. Climate Change 2014a: Impacts, adaptation and vulnerability; Fifth Assessment Report for IPCC; Cambridge University Press: Cambridge, UK, 2014. [Google Scholar]
  14. Masson-Delmotte, V.; Zhai, P.; Pörtner, H.-O.; Roberts, D.; Skea, J.; Shukla, P.R.; Pirani, A.; Moufouma-Okia, W.; Péan, C.; Pidcock, R.; et al. Global Warming of 1.5 °C; Special Report for IPCC; Cambridge University Press: Cambridge, UK, 2018. (in press) [Google Scholar]
  15. EEA (European Environment Agency). The European Environment – state and outlook; EEA: Copenhagen, Denmark, 2010. [Google Scholar]
  16. EEA (European Environment Agency). Climate change, impacts and vulnerability in Europe 2016. An indicator-based report; EEA: Copenhagen, Denmark, 2017. [Google Scholar]
  17. Barros, V.R.; Field, C.B.; Dokken, D.J.; Mastrandrea, M.D.; Mach, K.J.; Bilir, T.E.; Chatterjee, M.; Ebi, K.L.; Estrada, Y.O.; Genova, R.C.; et al. Climate Change 2014b: Impacts, Adaptation and Vulnerability; Fifth Assessment Report of the Intergovernmental Panel on Climate Change; Cambridge University Press: Cambridge, UK, 2014. [Google Scholar]
  18. Pradhan, P.; Costa, L.; Rybski, D.; Lucht, W.; Kropp, J.P. A Systematic Study of Sustainable Development Goal (SDG) Interactions. Earth’s Future 2017, 5, 1169–1179. [Google Scholar] [CrossRef] [Green Version]
  19. IPCC (Intergovernmental Panel on Climate Change). Climate Change and Land: An IPCC special report on climate change, desertification, land degradation, sustainable land management, food security, and greenhouse gas fluxes in terrestrial ecosystems; IPCC: Geneva, Switzerland, 2019. [Google Scholar]
  20. Saaty, T.L. The Analytic Hierarchy Process: Planning, Priority Setting, Resource Allocation; Mcgraw-Hill: New York, NY, USA, 1980. [Google Scholar]
  21. Girard, L.F.; De Toro, P. Integrated spatial assessment: A multicriteria approach to sustainable development of cultural and environmental heritage in San Marco dei Cavoti, Italy. Cent. Eur. J. Oper. Res. 2007, 15, 281–299. [Google Scholar] [CrossRef]
  22. Schmoldt, D.; Kangas, J.; Mendoza, G.A.; Pesonen, M. The analytic hierarchy process in natural resource and environmental decision-making, 3rd ed.; Springer Science & Business Media: Berlin, Germany, 2013. [Google Scholar]
  23. Siddayao, G.P.; Valdez, S.E.; Fernandez, P.L. Analytic hierarchy process (AHP) in spatial modeling for floodplain risk assessment. Int. J. Mach. Learn. Comput. 2014, 4, 450–457. [Google Scholar] [CrossRef]
  24. Pinto, D.; Shrestha, S.; Babel, M.S.; Ninsawat, S. Delineation of groundwater potential zones in the Comoro watershed, Timor Leste using GIS, remote sensing and analytic hierarchy process (AHP) technique. Appl. Water Sci. 2017, 7, 503–519. [Google Scholar] [CrossRef] [Green Version]
  25. Sun, H.; Wang, S.; Hao, X. An Improved Analytic Hierarchy Process Method for the evaluation of agricultural water management in irrigation districts of north China. Agric. Water Manag. 2017, 179, 324–337. [Google Scholar] [CrossRef]
  26. Sutadian, A.D.; Muttil, N.; Yilmaz, A.G.; Perera, B.J.C. Using the Analytic Hierarchy Process to identify parameter weights for developing a water quality index. Ecol. Indic. 2017, 75, 220–233. [Google Scholar] [CrossRef]
  27. Armaroli, C.; Duo, E.; Viavattene, C. From hazard to consequences: Evaluation of direct and indirect impacts of flooding along the Emilia-Romagna coastline, Italy. Front. Earth Sci. 2019, 7, 203. [Google Scholar] [CrossRef] [Green Version]
  28. Roy, B. Problems and methods with multiple objective functions. Math. Program. 1971, 1, 239–266. [Google Scholar] [CrossRef]
  29. Triantaphyllou, E. Multi-criteria decision-making methods: A comparative study; Springer: Boston, MA, USA, 2000; p. 289. [Google Scholar]
  30. Ruangpan, L.; Vojinovic, Z.; Di Sabatino, S.; Leo, L.S.; Capobianco, V.; Oen, A.M.P.; McClain, M.; Lopez-Gunn, E.; Leo, L.S. Nature-Based Solutions for hydro-meteorological risk reduction: A state-of-the-art review of the research area. Nat. Hazards Earth Syst. Sci. Discuss. 2019, 1–41. [Google Scholar] [CrossRef] [Green Version]
  31. Bosch Slabbers, Deltares, Swexo, Witteveen+Bos and KNMI: Climate Adaptive Solutions. Available online: http://www.climateapp.nl/ (accessed on 2 October 2019).
  32. Urban green-blue grids: Green-blue design tool. Available online: https://www.urbangreenbluegrids.com/design-tool/ (accessed on 21 June 2019).
  33. Naturally Resilient Communities: Naturally Resilient Communities solutions. Available online: http://nrcsolutions.org/strategies/#solutions (accessed on 21 June 2019).
  34. Karavokiros, G.; Lykou, A.; Koutiva, I.; Batica, J.; Kostaridis, A.; Alves, A.; Makropoulos, C. Providing evidence-based, intelligent support for flood resilient planning and policy: The PEARL knowledge base. Water 2016, 8, 392. [Google Scholar] [CrossRef]
  35. Stelljes, N.; Martinez, G.; McGlade, K. Introduction to the RISC-KIT web based management guide for DRR in European coastal zones. Coast. Eng. 2018, 134, 73–80. [Google Scholar] [CrossRef]
  36. Van Dongeren, A.; Ciavola, P.; Martinez, G.; Viavattene, C.; Bogaard, T.; Ferreira, O.; McCall, R. Introduction to RISC-KIT: Resilience-increasing strategies for coasts. Coast. Eng. 2018, 134, 2–9. [Google Scholar] [CrossRef] [Green Version]
  37. Norwegian Geotechnical Institue: The LaRiMiT Toolbox. Available online: https://www.larimit.com/ (accessed on 5 September 2019).
  38. van de Ven, F.H.M.; Snep, R.P.H.; Koole, S.; Brolsma, R.; van der Brugge, R.; Spijker, J.; Vergroesen, T. Adaptation Planning Support Toolbox: Measurable performance information based tools for co-creation of resilient, ecosystem-based urban plans with urban designers, decision-makers and stakeholders. Environ. Sci. Policy 2016, 66, 427–436. [Google Scholar] [CrossRef] [Green Version]
  39. World Overview of Conservation Approaches and Technologies (WOCAT Network): Global Database on SLM. Available online: https://qcat.wocat.net/en/wocat/ (accessed on 24 July 2019).
  40. Forman, E.; Peniwati, K. Aggregating individual judgments and priorities with the analytic hierarchy process. Eur. J. Oper. Res. 1998, 108, 165–169. [Google Scholar] [CrossRef]
  41. European Commission. Communication from the Commission to the European Parliament, the Council, the European Economic and Social Committee and the Committee of the Regions Report on the Review of the European Water Scarcity and Droughts Policy; European Commission: Brussels, Belgium, 2012. [Google Scholar]
  42. Armas, C.; Miranda, J.D.; Padilla, F.M.; Pugnaire, F.I. Special issue: The Iberian southeast. J. Arid Environ. 2011, 75, 1241–1243. [Google Scholar] [CrossRef]
  43. Sánchez, J.A.; Reca, J.; Martínez, J. Water productivity in a Mediterranean semi-arid greenhouse district. Water Resour. Manag. 2015, 29, 5395–5411. [Google Scholar]
  44. Santini, M.; Rulli, M.C. Water resources in Italy: The present situation and future trends. In The Water We Eat; Springer: Cham, Switzerland, 2015; pp. 139–143. [Google Scholar]
  45. Ronco, P.; Zennaro, F.; Torresan, S.; Critto, A.; Santini, M.; Trabucco, A.; Zollo, A.; Galluccio, G.; Marcomini, A. A risk assessment framework for irrigated agriculture under climate change. Adv. Water Resour. 2017, 110, 562–578. [Google Scholar] [CrossRef]
  46. García-Ruiz, J.M.; López-Moreno, J.I.; Vicente-Serrano, S.M.; Lasanta-Martínez, T.; Beguería, S. Mediterranean water resources in a global change scenario. Earth Sci. Rev. 2011, 105, 121–139. [Google Scholar]
  47. Ludwig, R.; Roson, R.; Zografos, C.; Kallis, G. Towards an inter-disciplinary research agenda on climate change, water and security in Southern Europe and neighboring countries. Environ. Sci. Policy 2011, 14, 794–803. [Google Scholar] [CrossRef]
  48. Estrela, T.; Pérez-Martin, M.; Vargas, E. Impacts of climate change on water resources in Spain. Hydrolog. Sci. J. 2012, 57, 1154–1167. [Google Scholar] [CrossRef]
  49. Sen, B.; Topcu, S.; Türkes, M.; Sen, B.; Warner, J.F. Projecting climate change, drought conditions and crop productivity in Turkey. Clim. Res. 2012, 52, 175–191. [Google Scholar] [CrossRef] [Green Version]
  50. Koutroulis, A.G.; Tsanis, I.K.; Daliakopoulos, I.N.; Jacob, D. Impact of climate change on water resources status: A case study for Crete Island, Greece. J. Hydrol. 2013, 479, 146–158. [Google Scholar] [CrossRef] [Green Version]
  51. Santini, M.; Collalti, A.; Valentini, R. Climate change impacts on vegetation and water cycle in the Euro-Mediterranean region, studied by a likelihood approach. Reg. Environ. Chang. 2014, 14, 1405–1418. [Google Scholar] [CrossRef]
  52. Forzieri, G.; Feyen, L.; Rojas, R.; Flörke, M.; Wimmer, F.; Bianchi, A. Ensemble projections of future streamflow droughts in Europe. Hydrol. Earth Syst. Sci. 2014, 18, 85–108. [Google Scholar] [CrossRef] [Green Version]
  53. Public Goods and Ecosystem Services. Available online: http://www.openness-project.eu/sites/default/files/SP-Public-Goods.pdf (accessed on 5 July 2019).
  54. Millennium Ecosystem Assessment (MEA). Ecosystems and human well-being: Synthesis, 5th ed.; Island Press: Washington, DC, USA, 2005. [Google Scholar]
  55. Gatzweiler, F.W. Organizing a public ecosystem service economy for sustaining biodiversity. Ecol. Econ. 2006, 59, 296–304. [Google Scholar] [CrossRef]
  56. Boroushaki, S.; Malczewski, J. Implementing an extension of the analytical hierarchy process using ordered weighted averaging operators with fuzzy quantifiers in ArcGIS. Comput. Geosci. 2008, 34, 399–410. [Google Scholar] [CrossRef]
  57. Malczewski, J. GIS and multiple-criteria decision analysis, Decision rules, New ed.; John Wiley and Sons: New York, NY, USA, 1999. [Google Scholar]
  58. Kordi, M. Comparison of fuzzy and crisp analytic hierarchy process (AHP) methods for spatial multicriteria decision analysis in GIS. Master’s Thesis, University of Gavle, Gavle, Sweden, September 2008. [Google Scholar]
  59. Brunelli, M. Introduction to Analytic Hierarchy Process; Springer Briefs in Operations Research: London, UK, 2015; p. 83. [Google Scholar]
  60. Harker, P.T. Incomplete pairwise comparisons in the analytic hierarchy process. Math. Model. 1987, 9, 837–848. [Google Scholar] [CrossRef] [Green Version]
Figure 1. Schematic representation of the GOWARE (transnational Guide toward an Optimal WAter REgime) Decision Support Tool (DST) design. The context scoping and the pre-selection of Best Management Practices (BMPs) (first stage of the analysis) are shown in the green dashed box while the criteria ranking and the BMPs prioritization (second stage of the analysis) are shown in the red dashed box.
Water 12 00370 g001
Figure 2. Percentage of BMPs identified for each land use category.
Water 12 00370 g002
Table 1. Additional Project Measures (APM) proposed by PROLINE-CE Project.
APMDescription
APM1Improved permitting, control and supervision procedures including regulatory supervision process, approvals, technical standards and their implementation
APM2Regulatory processes regarding flood risk management: spatial planning procedures, protection and restoration floodplains, integrated with the development of River Basin Management Plans (RBMPs) and water conflict resolution procedures
APM3Improved financing mechanisms for all water services
APM4Landslide and erosion control measures
APM5Improved understanding of the impacts of different man-made structures and infrastructure potentially affecting flood flows
APM6Reforestation/Afforestation management in order to increase water availability for water supply
Table 2. The pairwise comparison matrix has been built for assigning a relative importance among the characterizing criteria proposed in GOWARE-DST. The elements in the cells above the principal diagonal identify the value assigned to each comparison. By way of example, “a12” indicates the importance of alternative “1” (Functionality) over alternative “2” (Cost) and then the value “a21” is calculated as “1/a12”. The elements in the principal diagonal are always equal to “1” since the comparisons are made between the same alternatives.
FunctionalityCostImplementation TimeRobustnessMulti-functionality
Functionality1a12a13a14a15
Cost1/a121a23a24a25
Implementation time1/a131/a231a34a35
Robustness of BMP1/a141/a241/a341a45
Multi-functionality1/a151/a251/a351/a451
Table 3. Judgments’ interpretation and corresponding numerical values according to [20], modifird.
JudgmentScore (aij Values)
Ai is equally important than Aj1
Ai is moderately more important than Aj3
Ai is more important than Aj5
Ai is strongly more important than Aj7
Ai is absolutely more important than Aj9
Table 4. Characteristics of the three tests carried out during the trial phase of GOWARE-DST.
Events Organized by PROLINE-CE Project’s Participating CountryNumber of UsersData Collecting Method
Second PROLINE-CE Project Round Table42Questionnaire (for the AHP model)
4 meetings (2 in IT, 1 in SI, 1 in HU), 3 remote-surveys (HR, PL, DE), 1 video conference (IT), 2 direct interviews (AT)32Web-questionnaire about the web-version of GOWARE-DST
National conference (IT)11Menti.com (for the AHP model)
Table 5. Results of the comparisons among the criteria collected during the second testing phase. The number of respondents considering more relevant Criterion A, Criterion B, or equally relevant the two Criteria is reported.
Criterion ACriterion BABEqual
Water protection functionalityCost of the measure3631
Water protection functionalityTime necessary for implementation3415
Water protection functionalityRobustness2595
Water protection functionalityMulti-functionality2488
Cost of the measureTime necessary for implementation21145
Cost of the measureRobustness13225
Cost of the measureMulti-functionality13234
Time necessary for implementationRobustness15178
Time necessary for implementationMulti-functionality9256
RobustnessMulti-functionality81616
Table 6. Results of the comparisons among the criteria collected during the Test 3 and expressed as aggregated judgments (elaborated in Mentimeter - https://www.mentimeter.com/app/results/).
Criterion ACriterion BABEqual
Water protection functionalityCost of the measure ×
Water protection functionalityTime necessary for implementation ×
Water protection functionalityRobustness ×
Water protection functionalityMulti-functionality ×
Cost of the measureTime necessary for implementation ×
Cost of the measureRobustness ×
Cost of the measureMulti-functionality ×
Time necessary for implementationRobustness ×
Time necessary for implementationMulti-functionality ×
RobustnessMulti-functionality ×
Table 7. Priority vectors estimated from data collected during the three testing phases (Test 1, Test 2, Test 3). Data related to Test 1 and Test 2 are expressed as both arithmetic mean (w_mean1) and geometric mean (w_mean2). The individual judgments have been aggregated by applying the AIP method. Data related to Test 3 are provided by the Mentimeter tool.
Priority VectorCriterionTest 1 w_mean1Test 1 w_mean2Test 2 w_mean1Test 2 w_mean2Test 3
w1Water protection functionality0.340.310.250.230.09
w2Cost of the measure0.150.120.170.150.11
w3Time necessary for implementation0.120.100.190.180.14
w4Robustness0.180.150.210.200.26
w5Multi-functionality0.210.190.170.160.40

