Article

Modelling the 2012 Lahar in a Sector of Jamapa Gorge (Pico de Orizaba Volcano, Mexico) Using RAMMS and Tree-Ring Evidence

by
Osvaldo Franco-Ramos
1,*,
Juan Antonio Ballesteros-Cánovas
2,3,
José Ernesto Figueroa-García
4,
Lorenzo Vázquez-Selem
1,
Markus Stoffel
2,3,5 and
Lizeth Caballero
6
1
Instituto de Geografía, Universidad Nacional Autónoma de México, Ciudad Universitaria Coyoacán, México 04510, Mexico
2
Dendrolab.ch, Department of Earth Sciences, University of Geneva, 13 rue des Maraîchers, CH-1205 Geneva, Switzerland
3
Climate Change Impacts and Risks in the Anthropocene (C-CIA), Institute for Environmental Sciences, University of Geneva, 66 Boulevard Carl-Vogt, CH-1205 Geneva, Switzerland
4
Posgrado en Geografía Universidad Nacional Autónoma de México, Ciudad Universitaria Coyoacán, México 04510, Mexico
5
Department F.-A. Forel for Environmental and Aquatic Sciences, University of Geneva, 66 Boulevard Carl-Vogt, CH-1205 Geneva, Switzerland
6
Facultad de Ciencias, Universidad Nacional Autónoma de México, Ciudad Universitaria Coyoacán, México 04510, Mexico
*
Author to whom correspondence should be addressed.
Water 2020, 12(2), 333; https://doi.org/10.3390/w12020333
Submission received: 18 December 2019 / Revised: 18 January 2020 / Accepted: 21 January 2020 / Published: 23 January 2020
(This article belongs to the Special Issue Flood Risk Assessments: Applications and Uncertainties)

Abstract

:
A good understanding of the frequency and magnitude of lahars is essential for the assessment of torrential hazards in volcanic terrains. In many instances, however, data on past events is scarce or incomplete, such that the evaluation of possible future risks and/or the planning of adequate countermeasures can only be done with rather limited certainty. In this paper, we present a multiidisciplinary approach based on botanical field evidence and the numerical modelling of a post-eruptive lahar that occurred in 2012 on the northern slope of the Pico de Orizaba volcano, Mexico, with the aim of reconstructing the magnitude of the event. To this end, we used the debris-flow module of the rapid mass movement simulation tool RAMMS on a highly resolved digital terrain model obtained with an unmanned aerial vehicle. The modelling was calibrated with scars found in 19 Pinus hartwegii trees that served as paleo stage indicators (PSI) of lahar magnitude in a sector of Jamapa Gorge. Using this combined assessment and calibration of RAMMS, we obtain a peak discharge of 78 m3 s−1 for the 2012 lahar event which was likely triggered by torrential rainfall during hurricane “Ernesto”. Results also show that the deviation between the modelled lahar stage (depth) and the height of PSI in trees was up to ±0.43 m. We conclude that the combination of PSI and models can be successfully used on (subtropical) volcanoes to assess the frequency, and even more so to calibrate the magnitude of lahars. The added value of the approach is particularly obvious in catchments with very scarce or no hydrological data at all and could thus also be employed for the dating and modelling of older lahars. As such, the approach and the results obtained can be used directly to support disaster risk reduction strategies at Pico de Orizaba volcano, but also in other volcanic regions.

1. Introduction

Lahars are torrential mass movements on volcanic slopes and have been documented in various volcanic environments around the world. Being mixtures of water and sediment, they can mobilize large amounts of weakly consolidated debris, rocks, and wood. These processes are know for their high flow velocities, and for their potential to cause major destruction and loss of lives [1,2,3]. Lahars are commonly triggered by heavy rainfall, condensate gas coming from volcanoes, excessive pore water, or glacial and snow meltdown, but the process has also been reported to occur as a result of river erosion or dam overflow [4,5].
On active volcanoes, so-called syn-eruptive lahars may be formed after heavy downpours onto unconsolidated volcanic sediment or by the sudden melting of snow and ice during volcanic eruptions. Similar processes can occur in the absence of volcanic activity; in that case, they are referred to as intra-eruptive or post-eruptive lahars [6,7]. This last type of lahars can occur on active, dormant or extinct volcanic complexes and can persist long after the last volcanic activity [8,9,10]. Intra-eruptive and post-eruptive lahars are frequently triggered by enhanced hurricane activity in subtropical environments or by cyclonic events (i.e., torrential rainfall) [8,11], but seismic activity has been shown to trigger lahars as well [4,12]. Different approaches have been used in the past to understand the occurrence and triggering of lahars. Past work included rainfall–runout analyses [8,11,13,14,15], real-time monitoring of lahars with rainfall, seismic (geophones) and observational data [16,17], but also analyses of disturbances recorded in tree-ring series [18,19,20,21].
Lahar magnitude can be approximated by lahar discharge, i.e., the volume of water and sediment moving down a gorge per unit of time. It depends on the initial volume of water and sediment, the erosion and incorporation of secondary, exotic debris by lahars as they move downstream (bulking) [5], the incorporation of water from tributaries, and sediment deposition (debulking). Lahar discharges have been reported in the literature, and one of the largest contemporary lahars occurred in 2007 at Nevado del Huila (Colombia) [22]. Since they are widely applied to calibrate numerical models used in lahar hazard evaluation, accurate volume estimations are necessary to strengthen their results.
The magnitude of lahar events has been assessed frequently with models using different bidimensional hydraulic codes and input data; among the more commonly used modeling tools are LAHARZ [23], TITAN2D [24], FLO-2D [25] or RAMMS [26]. Thanks to these models, the magnitude of several lahars has been calculated, including, among others, the very large 2007 lahar at Nevado del Huila with an estimated maximum peak discharge of ~13,000 m3 s−1 [22]. Other studies investigated the process dynamics of the lahar caused by the 2010 Merapi eruption [27], but also looked at hypothetical lahars on the base scenario of historical lahar deposits from an event that occurred in 1877 on Cotopaxi volcano [28]. Additionally, Nocentini et al. [29] have used FLO-2D to perform debris-flow modelling in volcanic terrains of Italy.
On the most active volcanoes of central Mexico, several hydraulic models have been used in the past to study lahars, mostly with the aim of obtaining better insights into sedimentology and/or rheological parameters (discharge, velocity, lahar depth). The LAHARZ code has been used on Popocatépetl [30], Pico de Orizaba [31], Nevado de Toluca [32], San Martin at Tuxtlas [33], Tacaná [34] and Ceboruco [35] volcanoes. Subsequently, the FLO-2D code has been applied to analyze Popocatépetl’s 2001 lahar [36] and in the Nexpayantla Gorge located on the northwestern slope of Popocatépetl volcano [37] to model the 2010 lahar. At Colima volcano, lahar peak discharges have been estimated for recent events as well using the FLO-2D code [16,38].
In general, all of the above-mentioned studies have contributed considerably to delimit the reach and lateral extension of lahar events and to understand the hazards and risks induced by lahars. The value and accuracy of modelling approaches will depend substantially on the availability of (post-event) field data or observations for the calibration and validation of models; however, such data are normally absent [39,40,41]. In particular, paleo-deposits (lahar terraces or deposits) are only rarely present on Mexican volcanoes due to omnipresent erosion in the high-gradient torrents. Furthermore, historical records of volcanic or geomorphic events are not generally available, especially in areas with limited population densities. In this context, the reconstruction of past events with tree-ring series can contribute significantly to an improved knowledge of the frequency and/or magnitude of past volcanic or geomorphic processes [19,20,21,42]. Hence, scarred trees have proven very useful for the dating and frequency analysis of past geomorphic events [43] and for the determination of paleostage indicators (PSI; [39]) as the level of scars on trees is considered to indicate the minimum flood level during a given event [44]. Several studies have used scar heights to calibrate two-dimensional (2D) hydraulic models and to estimate the flow discharge (magnitude) of paleofloods [45,46,47]. This methodology, originally used for torrential and river floods, has been adapted on volcanic terrains to estimate the discharge of a lahar on Canary Island, Spain, in 1997 [48].
In this paper, we aim at estimating the magnitude of a lahar that occurred in 2012 on the slopes of Pico de Orizaba volcano (Mexico) in a sector of Jamapa Gorge by combining botanical evidence (i.e., scars on tree trunks) and hydraulic modelling performed on a highly-resolved topography acquired with an unmanned aerial vehicle (UAV). To this end, we used RAMMS, a dynamic numerical model that allows simulation of debris flows (including water depth, discharge and flow velocity) in mountain basins [49,50,51].

2. Study Site

2.1. Volcanic Setting and Recorded Lahar Activity

The Jamapa Gorge is located on the northern slopes of Pico de Orizaba volcano (5640 m above sea level (a.s.l.)), also known as Citlaltépetl (“Mountain of the Star”) in the Náhuatl language. Pico de Orizaba is an active, yet quiescent Quaternary stratovolcano of andesic–dacitic composition located in the eastern sector of the Trans-Mexican Volcanic Belt (Figure 1). The volcanic complex is characterized by a long history of eruptive episodes with repeat growth and collapse of domes and other volcanic structures. According to Carrasco-Núñez [52,53], the first volcanic paleo-structure of Pico de Orizaba can be dated to ~0.65 Ma BP (= Before Present) and is referred to as “Torrecillas”. This volcanic structure was destroyed between ~0.29 and ~0.21 Ma by a large collapse associated to debris avalanche deposits on the northeastern slope of the volcano. The second paleo-structure was dated to ~0.21 Ma BP and is known as “El Espolón de Oro”. The cone belonging to this episode was destroyed by a large collapse and debris avalanche associated with hydrothermal alteration of the volcanic edifice dated to ~20,000 years (or 20 kyr; the abbreviation will be used hereafter). The current cone (Pico de Orizaba), is ~20 kyr in age. Two Plinian eruptions have been dated to the late Pleistocene and the Holocene, between ~13 kyr and ~8.5 kyr ago. These events covered the flanks of the volcano with thick pyroclastic flow and tephra fall deposits known as “Citlaltépetl” ignimbrite [54,55,56]. Other volcanic events during the Holocene were recorded between 7.0–6.2 and 3.4 kyr BP [57]. Block and ash flows and lahar deposits were produced at the summit crater around 4.1–4.0 kyr BP [54] in relation to a large explosive event in the western sector of the volcano. On the southern slope of Pico de Orizaba, two lava flows were dated to between 3 and 1 kyr BP [58]. Furthermore, historical effusive and explosive volcanic events were reported in 1537, 1545, 1566 and 1613 AD [59].
Holocene and historical lahar deposits can be found in different gorges and rivers around the Pico de Orizaba volcano. For example, Carrasco-Núñez et al. [52] dated a large lahar (~16.5 kyr BP) associated with the collapse of the Espolón de Oro cone; the resulting lahar deposits were emplaced in the Tetelzingo River where they still have thicknesses of 12–20 m on average and a maximum of 100 m. Other lahar deposits were identified inside Huitzilapan Gorge and dated to ~5260 yr BP [12]. In the Huitzilapan river (north-northeastern slope of Pico de Orizaba), one can observe an important lahar deposit from an event that occurred in 1920 (“Huitzilapan lahar”). The 1920 lahar was a typical compounded event, as an earthquake (magnitude 6.5) triggered several landslides from slopes saturated with water after 10 days of torrential rainfall [12]. Iverson et al. [59] reported high water marks 40 to 60 m above the channel for the 1920 event, which allowed for estimation of its volume at 4.4 × 10⁷ m3 [31].
More recently, on 5 June 2003, a catastrophic debris flow occurred on the southern slope of Pico de Orizaba after a torrential rainfall, resulting in a peak discharge of 350 m3 s−1 [60]. On the north-northeastern slopes of Pico de Orizaba volcano (i.e., Jamapa and Seca Gorges), intra-eruptive lahars occurred in 2012, again triggered by heavy rainfalls that can be linked to the passage of Hurricane Ernesto over the Atlantic Ocean [61].

2.2. Geomorphic Features on Jamapa Gorge

The Jamapa Gorge drains the northern flank of Pico de Orizaba volcano; its headwaters are at ~5000 m a.s.l. near the terminus of Jamapa glacier (Figure 1). In that area, glacial landforms from the late Pleistocene and Holocene have been covered by Holocene pyroclastic deposits and lava flows. The glaciers of the Little Ice Age (LIA) covered the top of the Jamapa Gorge drainage basin and built terminal moraines ridges around 4700 m a.s.l. [62]. In addition, several paraglacial and postglacial geomorphic features can be found in the area, such as debris flows or rockfall deposits and sectors characterized by fluvial erosion [63].
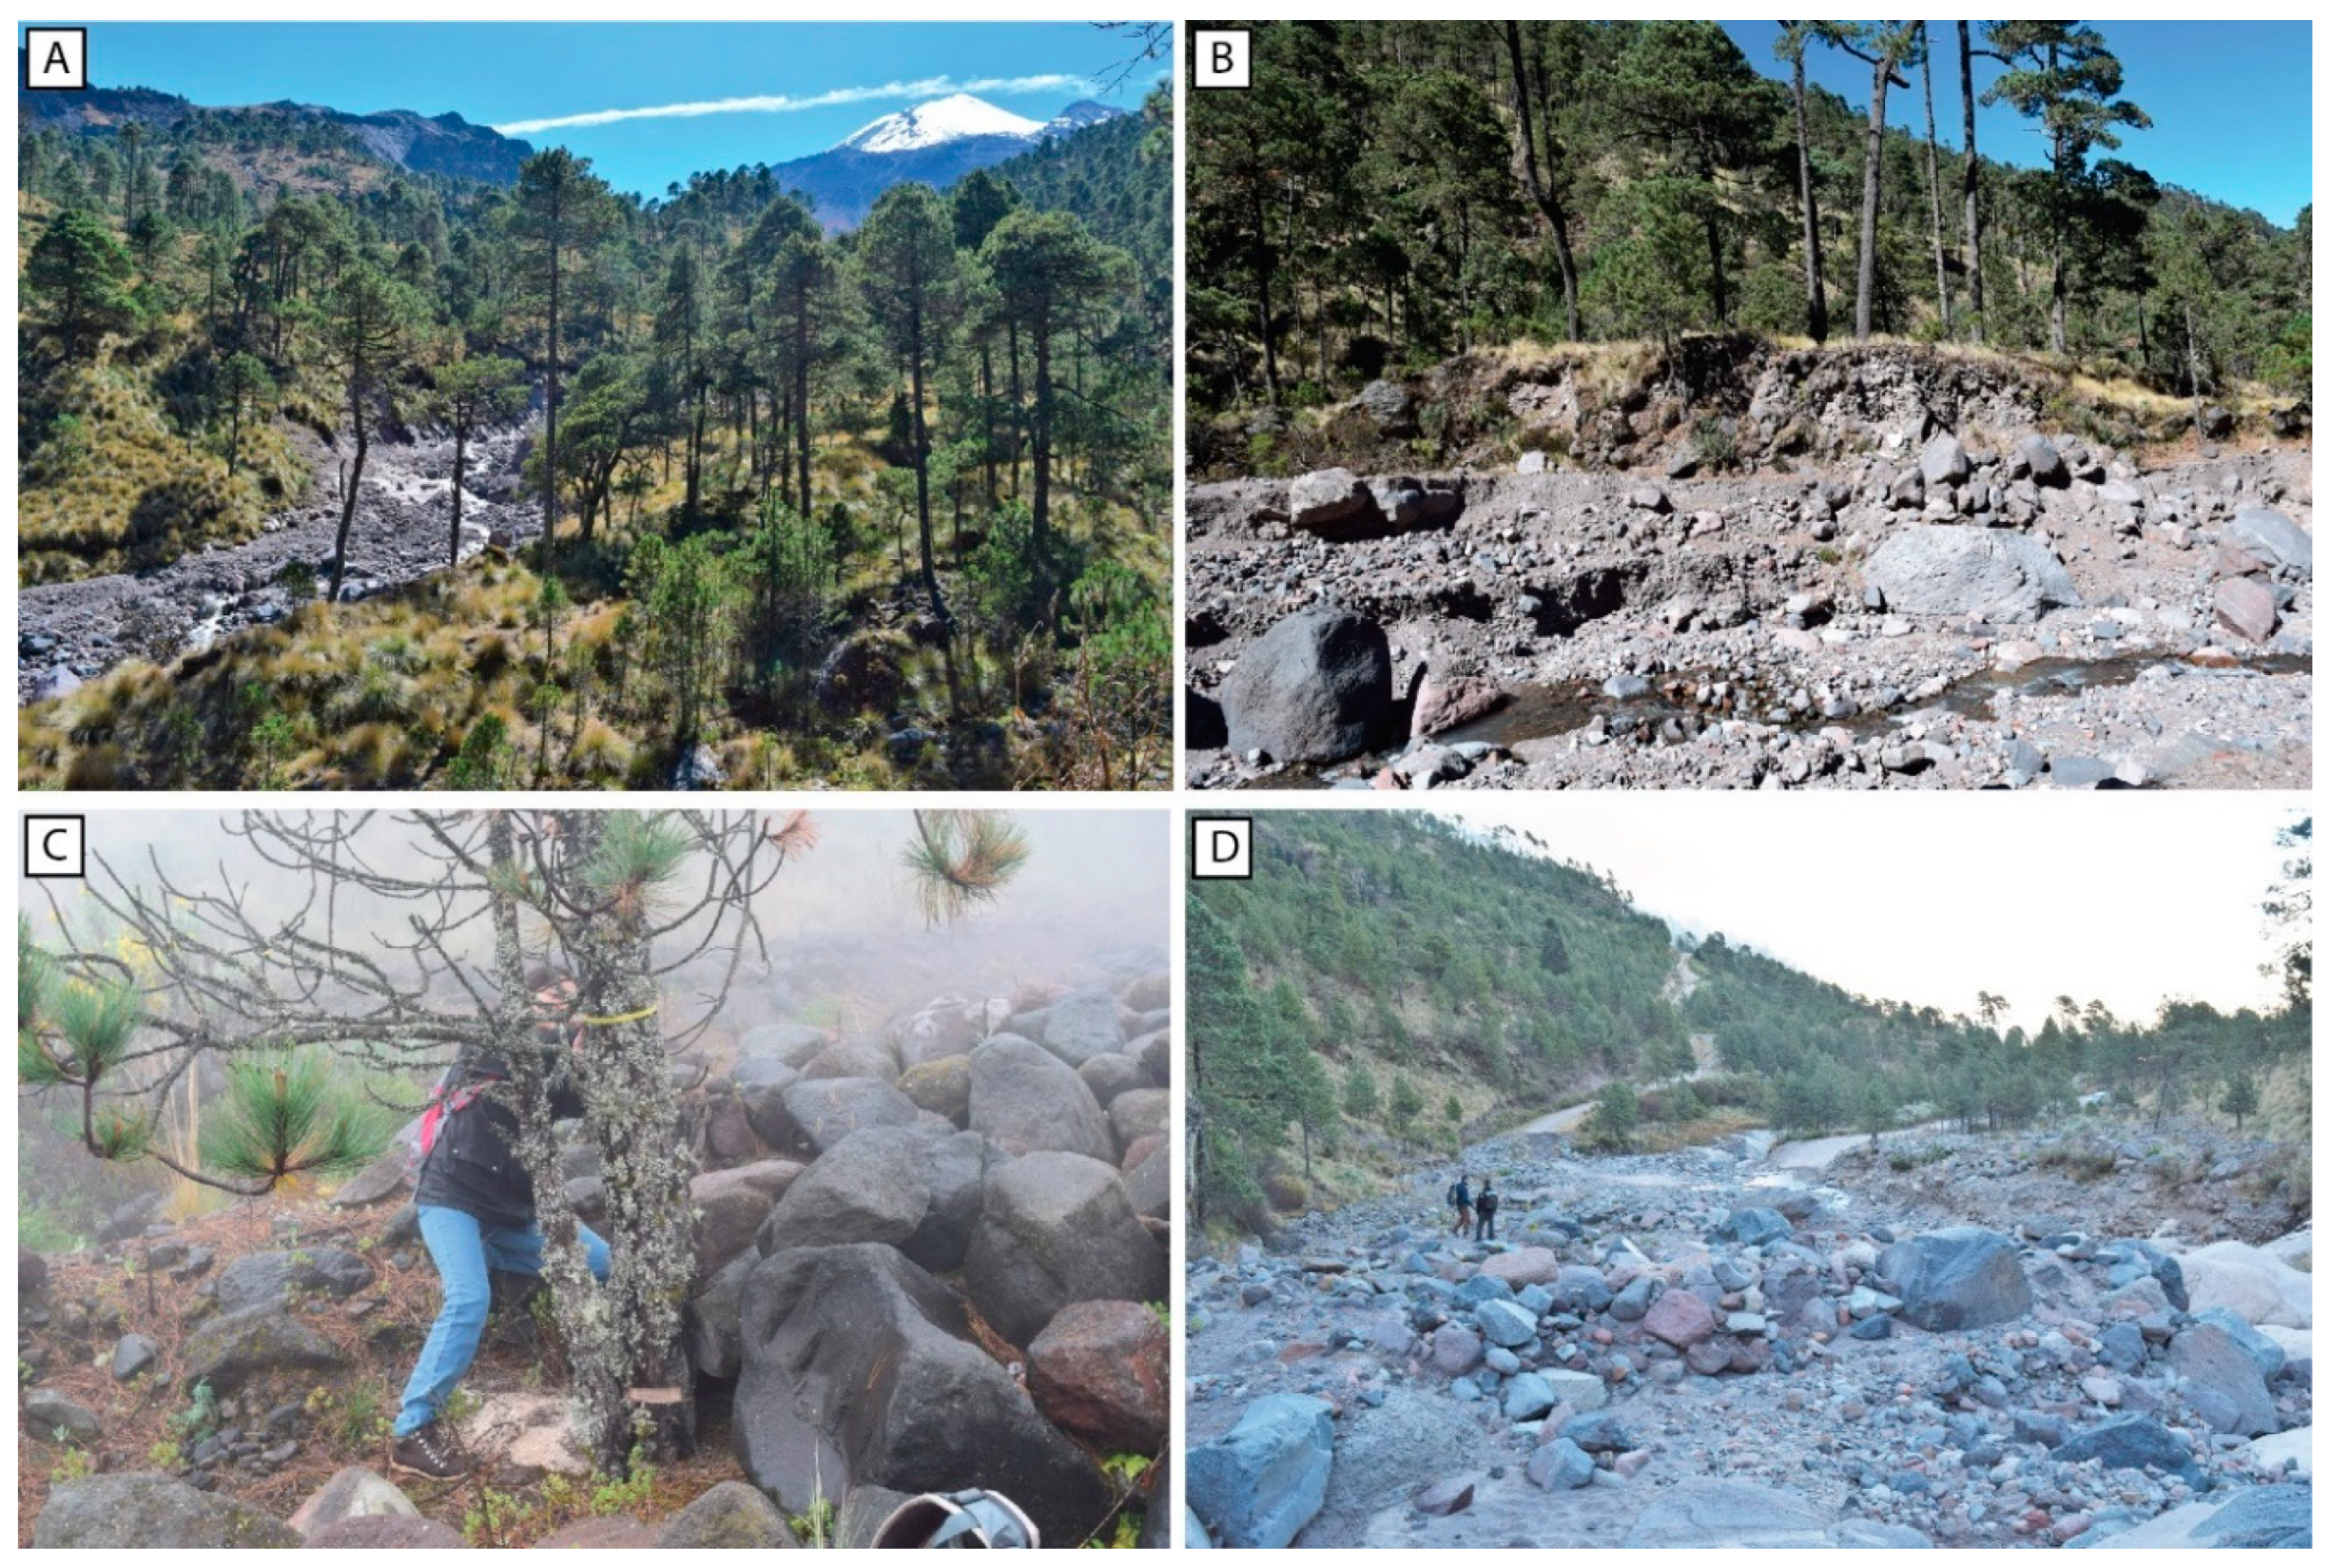
The study site investigated in this paper is located on the central sector of Jamapa Gorge, between 3535 and 3620 m a.s.l. (Figure 1 and Figure 2A). Several old laharic terraces can be recognized with thicknesses of 1–4 m (Figure 2B). Buried, tilted and scared trees are common in the laharic deposits of the low terraces (Figure 2C). Superficial debris-flow deposits with block sizes of ~3 m in diameter are embedded in a sandy matrix. Recent laharic deposits (from debris flows and/or hyperconcentrated flows) have filled the main channel with ~2 m of sediments in this sector of Jamapa. Some of these lahars have reached the road connecting the federal states of Puebla and Veracruz (Figure 2D).

2.3. The 2012 Hydrometeorological Event and Rainfall Triggering

On 6 August 2012, tropical storm “Ernesto” attained a hurricane strength at 1200 UTC (= Coordinated Universal Time) in the Caribbean, east of Chetumal, Mexico. The hurricane then turned westward and continued to strengthen as it approached the coast of the southern Yucatan Peninsula. The hurricane made landfall at Cayo Norte in the Banco Chinchorro Islands of Mexico around 0100 UTC on 8 August [64]. On 9 August, it caused torrential rainfalls in the range of 112 to 300 mm 24 h−1 in the states of Oaxaca, Veracruz, Hidalgo and Puebla. On 10 August, rainfall decreased from 126 to 180 mm 24 h−1 in Puebla, Guerrero, Chiapas, and Veracruz [65]. Based on records from the Huatusco meteorological station (located on the NE slopes of Pico de Orizaba, 1186 m a.s.l.) the maximum rainfall was recorded on 9 August 2012 with 133 mm, and reached 153 mm in two days (9–10 August 2012), 159 mm in three days (8–10 August 2012), and 212 mm in five days (9–13 August 2012) [66]. This hydrometeorological event triggered regional landslide and debris-flow events on the northern slopes of the volcano, i.e., in the Jamapa and Tliapa Gorges where they caused massive structural damage [61]. Field recognition showed several deposits left by the geomorphic events, namely in the form of terraces, debris and block deposits, scarps, and scars on several trees (Figure 2A–C).

3. Methods

3.1. Digital Terrain Model

A UAV was used to construct a digital superficial model (DSM) and a digital terrain model (DTM) based on the structure-from-motion (SfM) photogrammetry of the landforms with high-resolution topography [67]. For the modelling of the 2012 lahar discharge in the study reach within Jamapa Gorge, we constructed a DTM based on 306 digital images taken with a DJI Phantom 4 and a Mavic Pro Platinum (Figure 3A). Flight height was 70 m on average above the terrain surface with an image resolution of 4000 × 3000 dpi. Side overlap between images was 75% and front overlap was 40%. The processing and DTM extraction were performed using Pix4DMapper software (Pix4D SA, Switzerland) with a cell size of 3.6 cm (Figure 3B).

3.2. Dendrogeomorphic Analysis and PSI

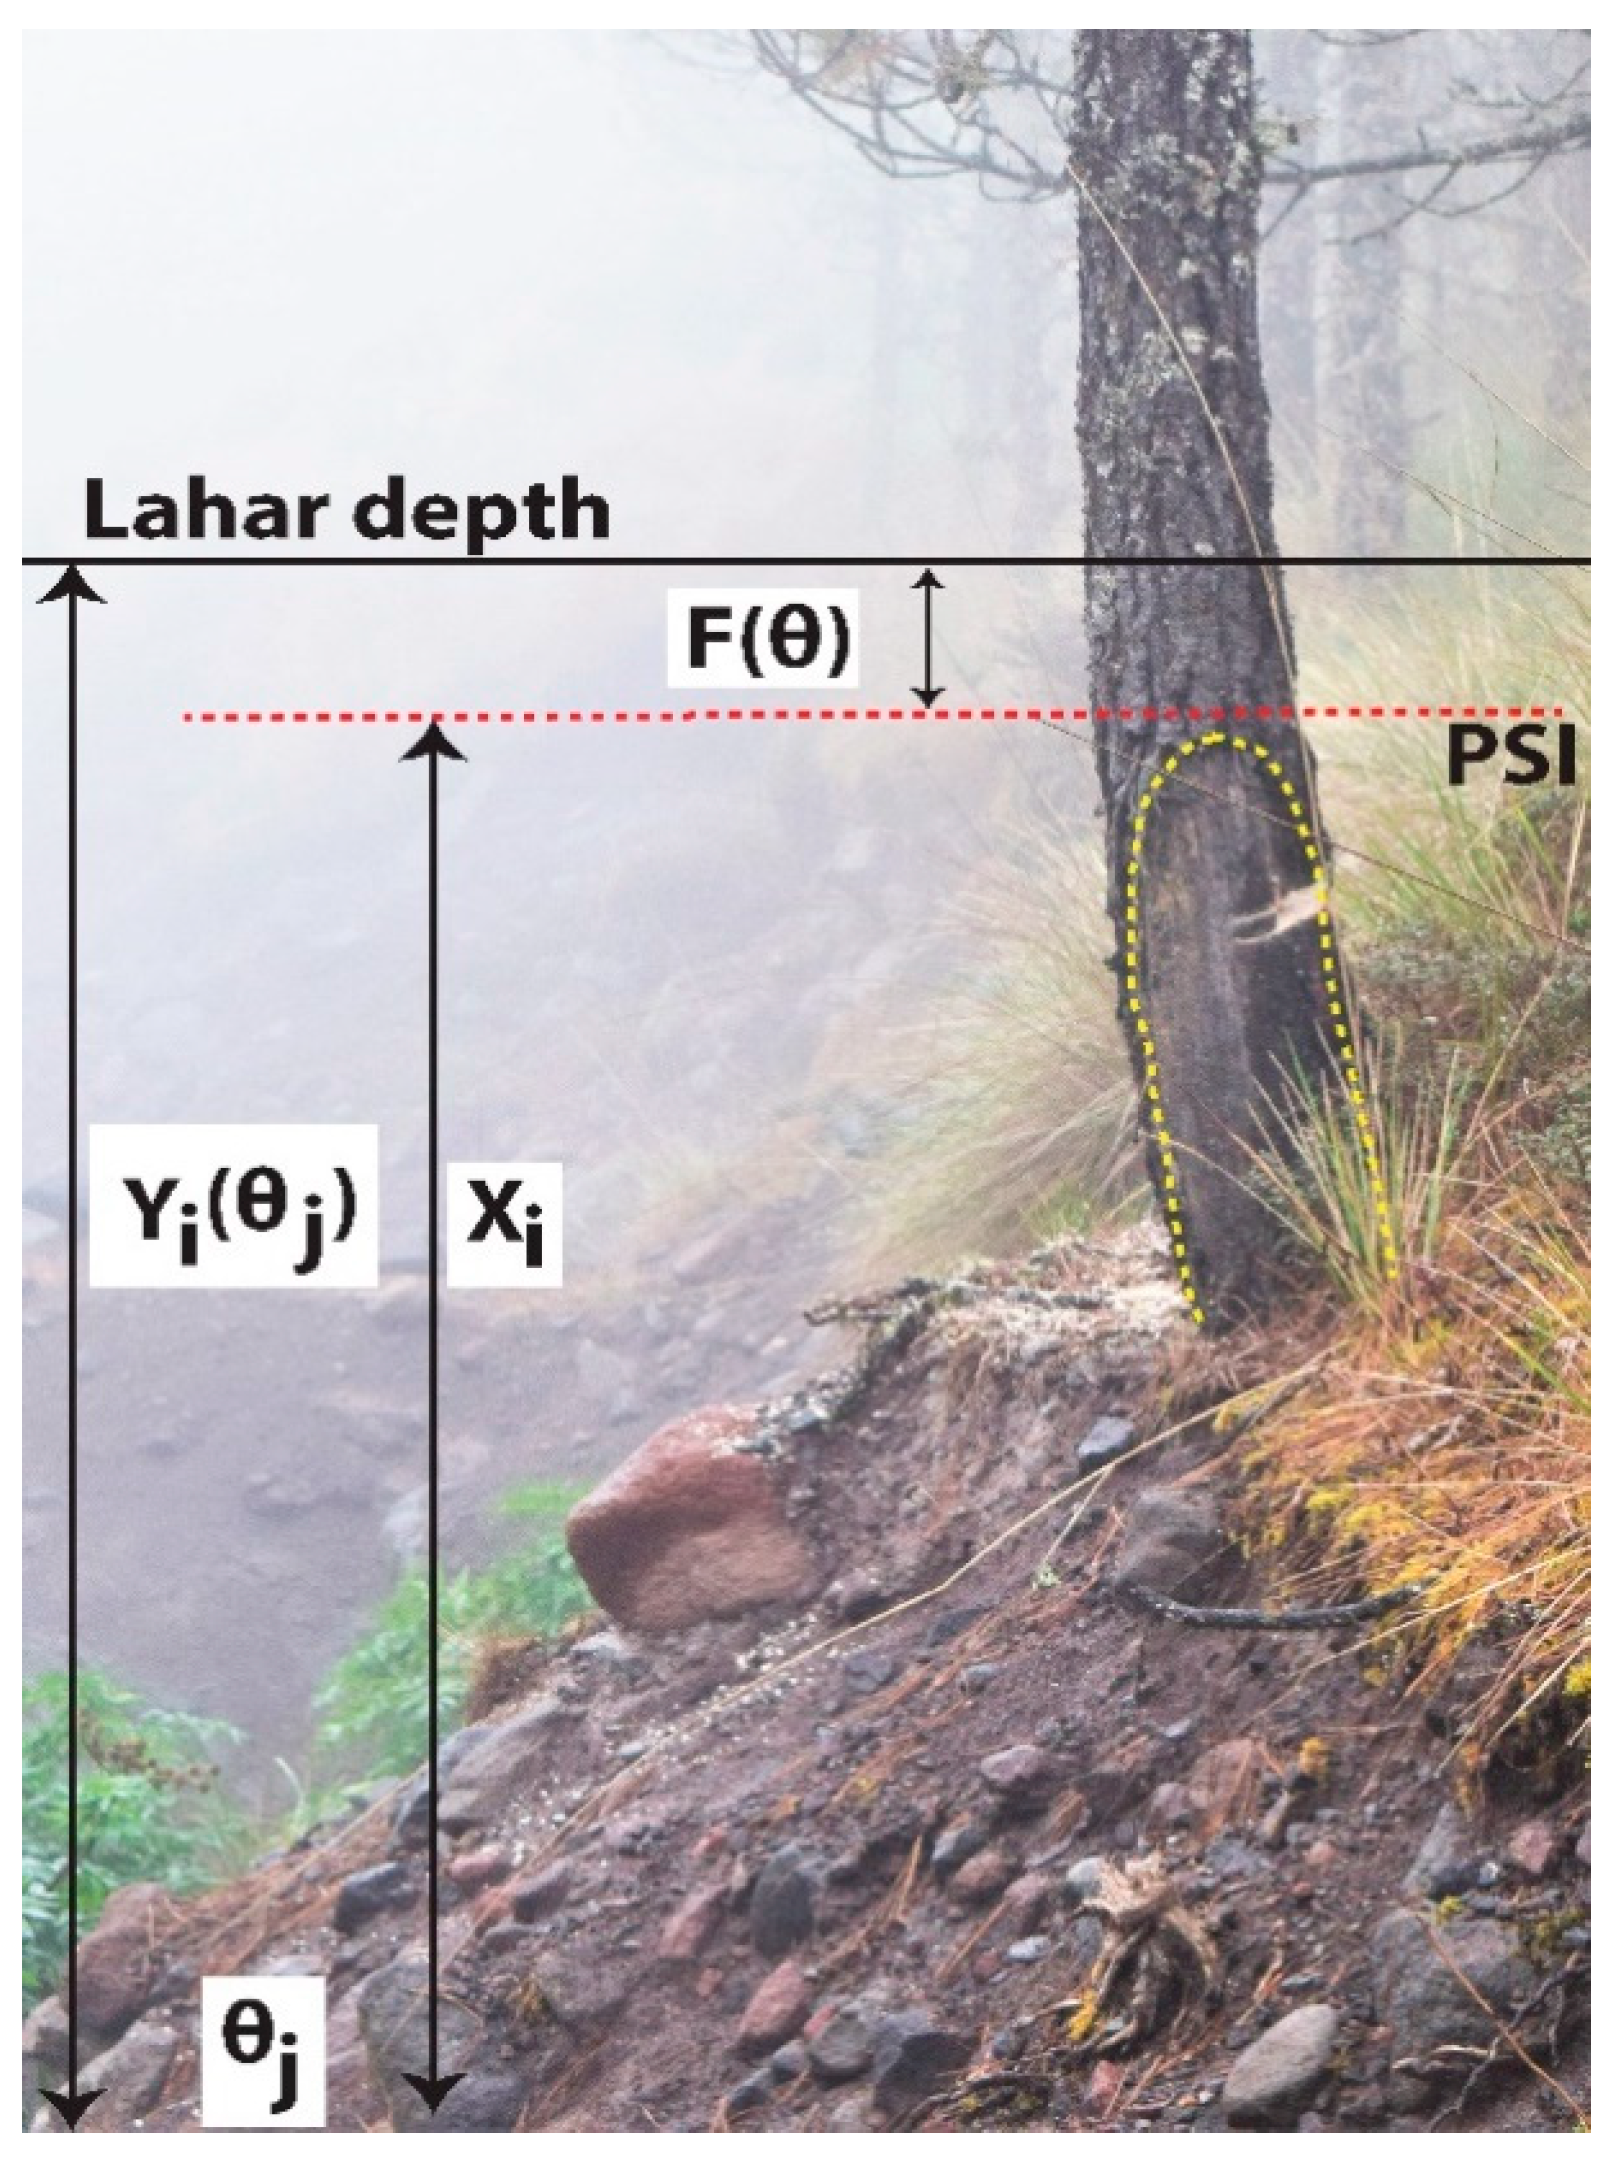
Within the study sector in Jamapa Gorge, we identified and sampled all trees with visible scars inflicted by the 2012 lahar between ~3535 to 3620 m a.s.l., at a point located ~7 km away from the Pico de Orizaba crater (Figure 1). To this end, we used increment borers and an electric chainsaw to obtain cores or wedges to properly date the injuries [43]. A total of 47 Pinus hartwegii trees were sampled, of which 38 were disturbed trees (with scars) and 9 were undisturbed trees for the construction of a reference chronology (Figure 3B). In addition to their dating, scars were used as paleostage indicators (PSI) by measuring the height of impacts with respect to the channel bed [40]. In the case that a tree had scars located at different heights, different samples were taken to distinguish between different lahar events. We considered the uppermost point of the highest scar as the peak of lahar discharge (Figure 4) [45,46]. In addition, for each tree, we also recorded the geomorphic and geographic position with a Global Positioning System (GPS) device. Additional measures were taken in the field to delineate the distance, direction and inclination of trees with respect to topographic features (such as big blocks, old terraces, or volcanic slopes) using a compass, tape measure and inclinometer.
After fieldwork, samples were prepared in the laboratory according to the standard procedures described in Bräker [68] and Stoffel and Bolslchweiler [69]. After the dating of samples, ring widths were measured by means of a microscope and a sliding Velmex [70] measurement plate connected to a computer using the time series analysis software TSAPWinTM (Time Series and Analysis Program for Windows) [71].
In addition to the dating of scars to the year [45,46], we also aimed to identify the seasonal timing of lahars based on the position of growth anomalies (i.e., injuries and callus tissue) within the tree ring according to Stoffel et al. [72]. The growing season was adapted to central Mexico conifers [20].

3.3. Numerical Simulations

RAMMS has been developed in the Swiss Federal Institute for Forest, Snow and Landscape research (WSL) [73] to simulate the runout of muddy and debris-laden flows in complex terrain. The model uses the Voellmy–Salm fluid flow continuum model [74] based on the Voellmy fluid flow law [75]. In the model, the frictional resistance is divided into two parts: a dry-Coulomb type friction, proportional to the normal stress at the flow bottom (coefficient μ) and a viscous resistance turbulent friction depending on the square of the velocity (coefficient ξ (m/s2)). The model yields maximum water depth, sediment deposition, flow velocity, and pressure. For further details about RAMMS and the equations used, see [76,77].
In our study, the input parameters of the model were set up as follows. The lahar density was initially fixed to 1400 g/m3. The μ coefficient was defined on the basis of field observations at a value of 0.15, representing the average slope of the deposition zones [75]. The ξ coefficient was set to 400 m/s2 according to the nature of the flux observed in similar contexts in Mexico [36]. The lahar peak discharge was obtained by applying an iterative step-backwater procedure [44]. For each of the simulation runs, we released a triangular hydrograph at the beginning of the river reach in which we defined the maximum peak discharge to occur after 60 s and the event to stop after 850 s [36]. Then, in order to estimate the peak discharge of the 2012 lahar, the maximum water depth modelled by RAMMS was compared with the maximum scar height observed in the 19 trees analyzed (Figure 3B and Figure 4). The magnitude of the lahar event was then defined as the peak discharge that minimized the deviation between the observed scar height and the modelled lahar stage. Once the peak discharge of the 2012 lahar was fixed, we performed a sensitivity model analysis by varying the density, μ and ξ coefficients by ±25% with respect to the initial values and evaluating the changes in the deviation between observed and modelled water heights.

4. Results

4.1. Tree Ring Evidence of the 2012 Lahar Event

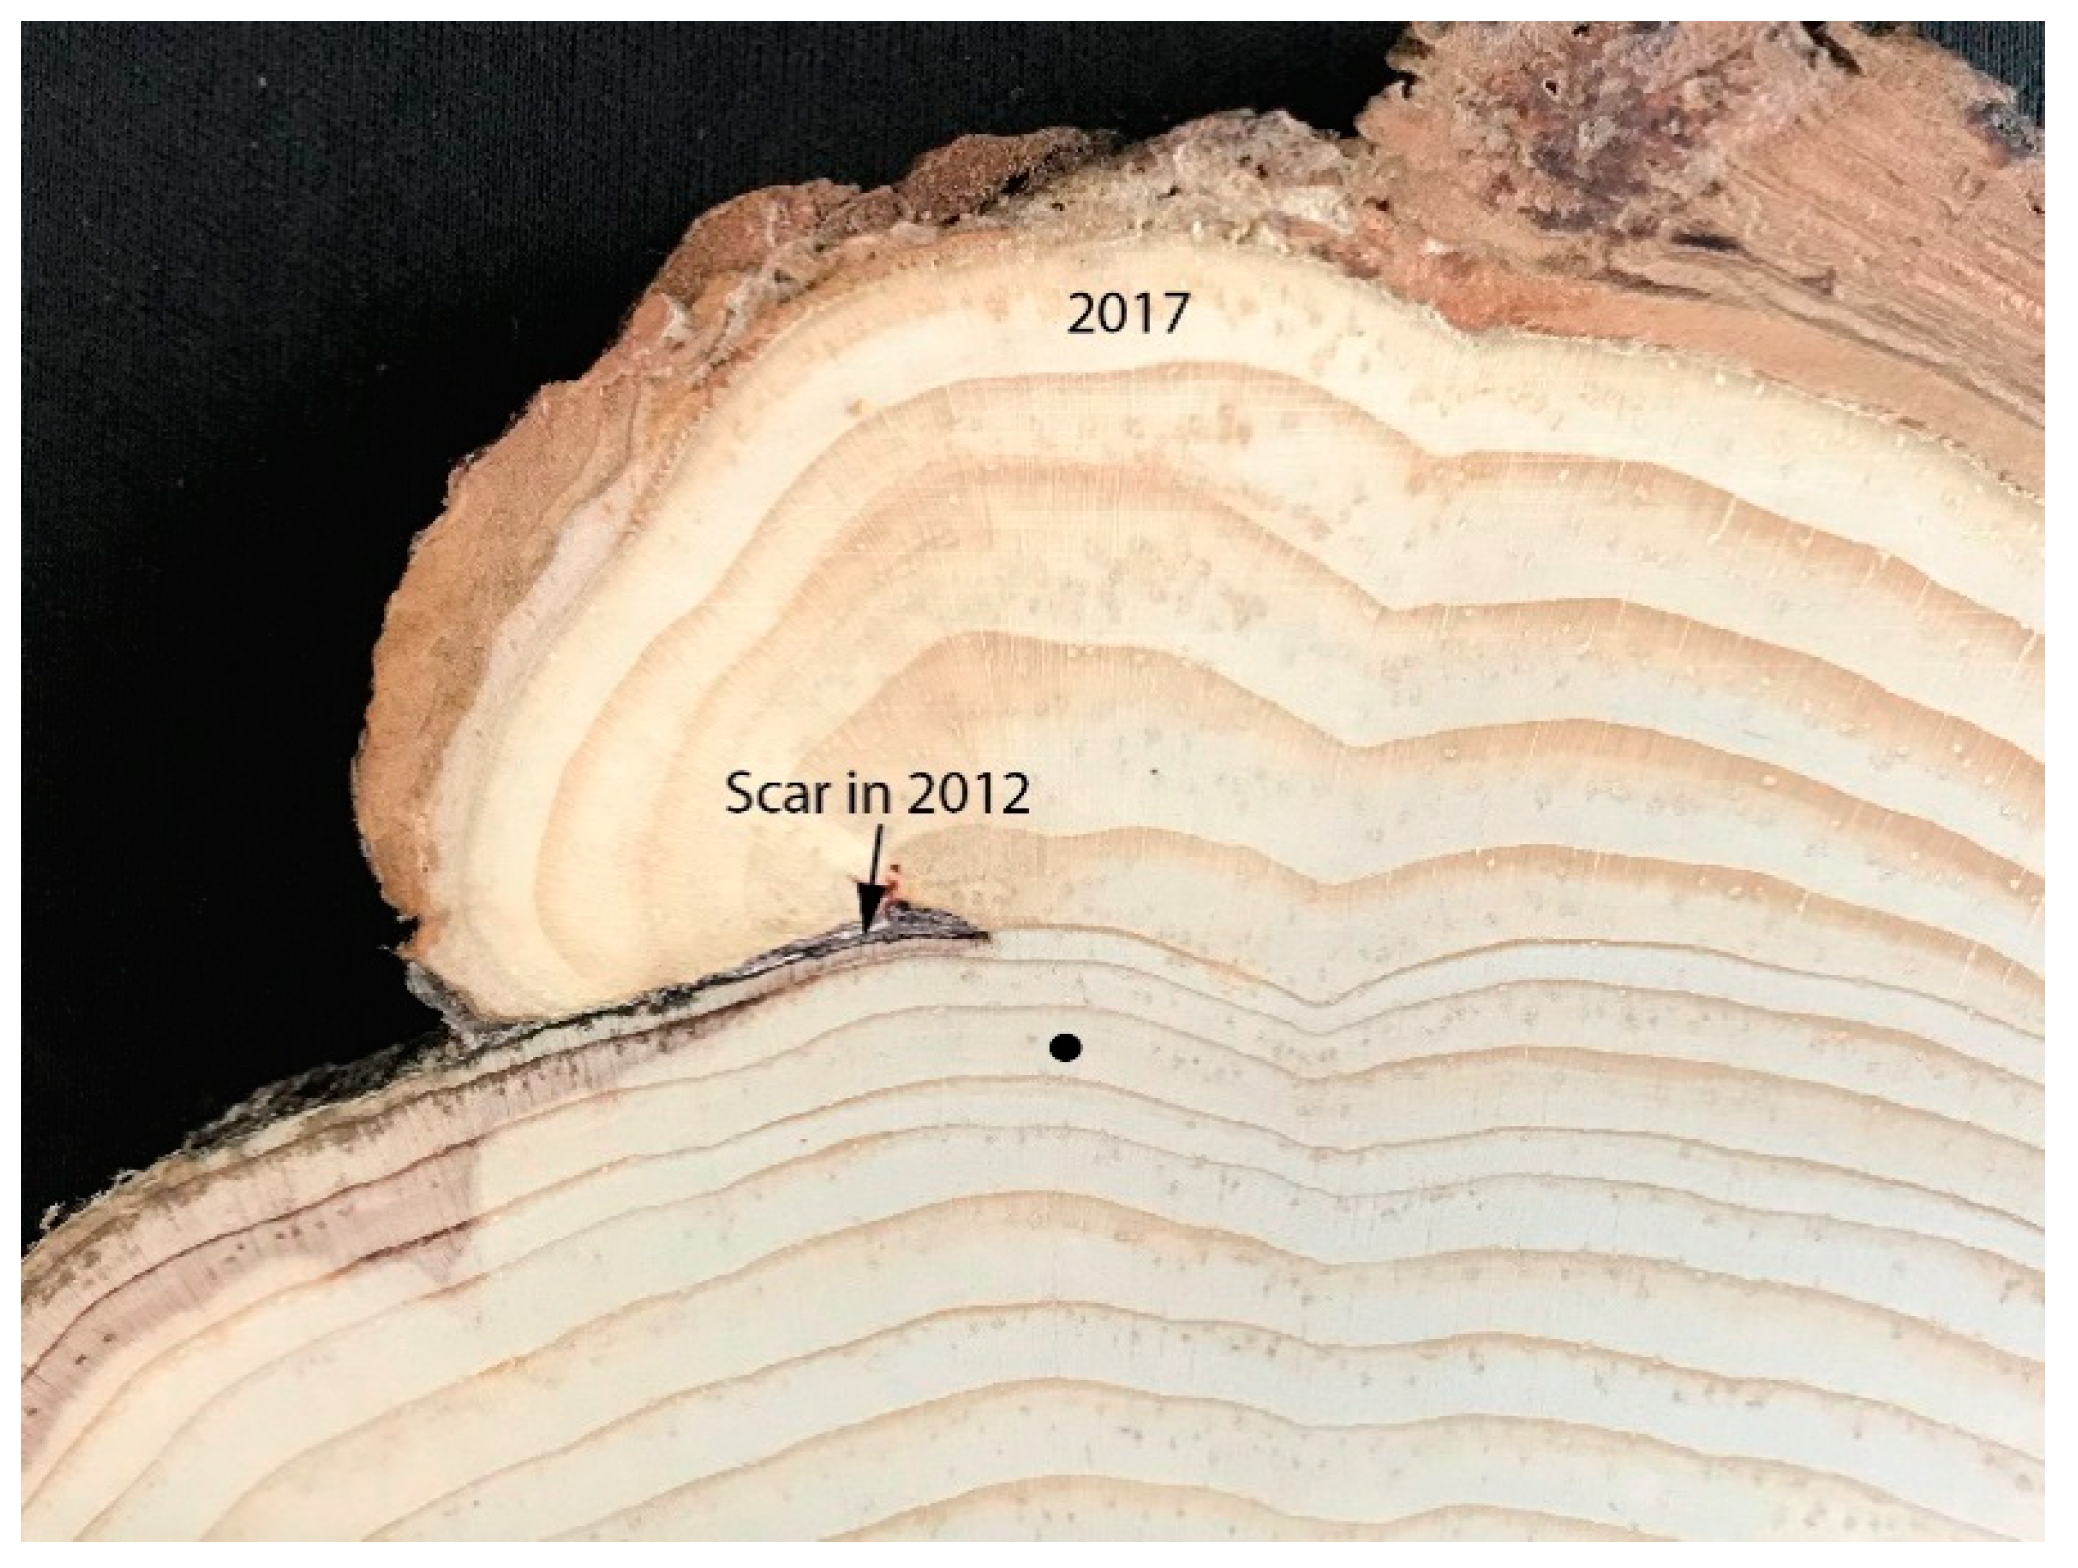
In this study, a total of 38 trees with ages of up to 150 years have been sampled, all showing disturbances related to the 2012 lahar event. Most disturbances were in the form of scars, stem tilting and decapitation. Among these disturbances, 19 Pinus hartwegii trees had scars that were suitable to be used as PSI. The passage of the lahar left by far the largest amount of severe damage in trees that were growing in the main channel as well as in those individuals standing on the lower terraces (13 scars at heights 22–120 cm), whereas in six cases, scarred trees were located in a secondary channel (with scar heights of 3–70 cm). Scars were recorded on the upslope side of trunks, facing the direction of the lahar flow (Figure 4). The analysis of scar seasonality showed that the injuries were located in the early latewood, corresponding to the late summer of 2012 (Figure 5) and likely of the passage of hurricane “Ernesto”.

4.2. Magnitude Reconstruction of the 2012 Lahar

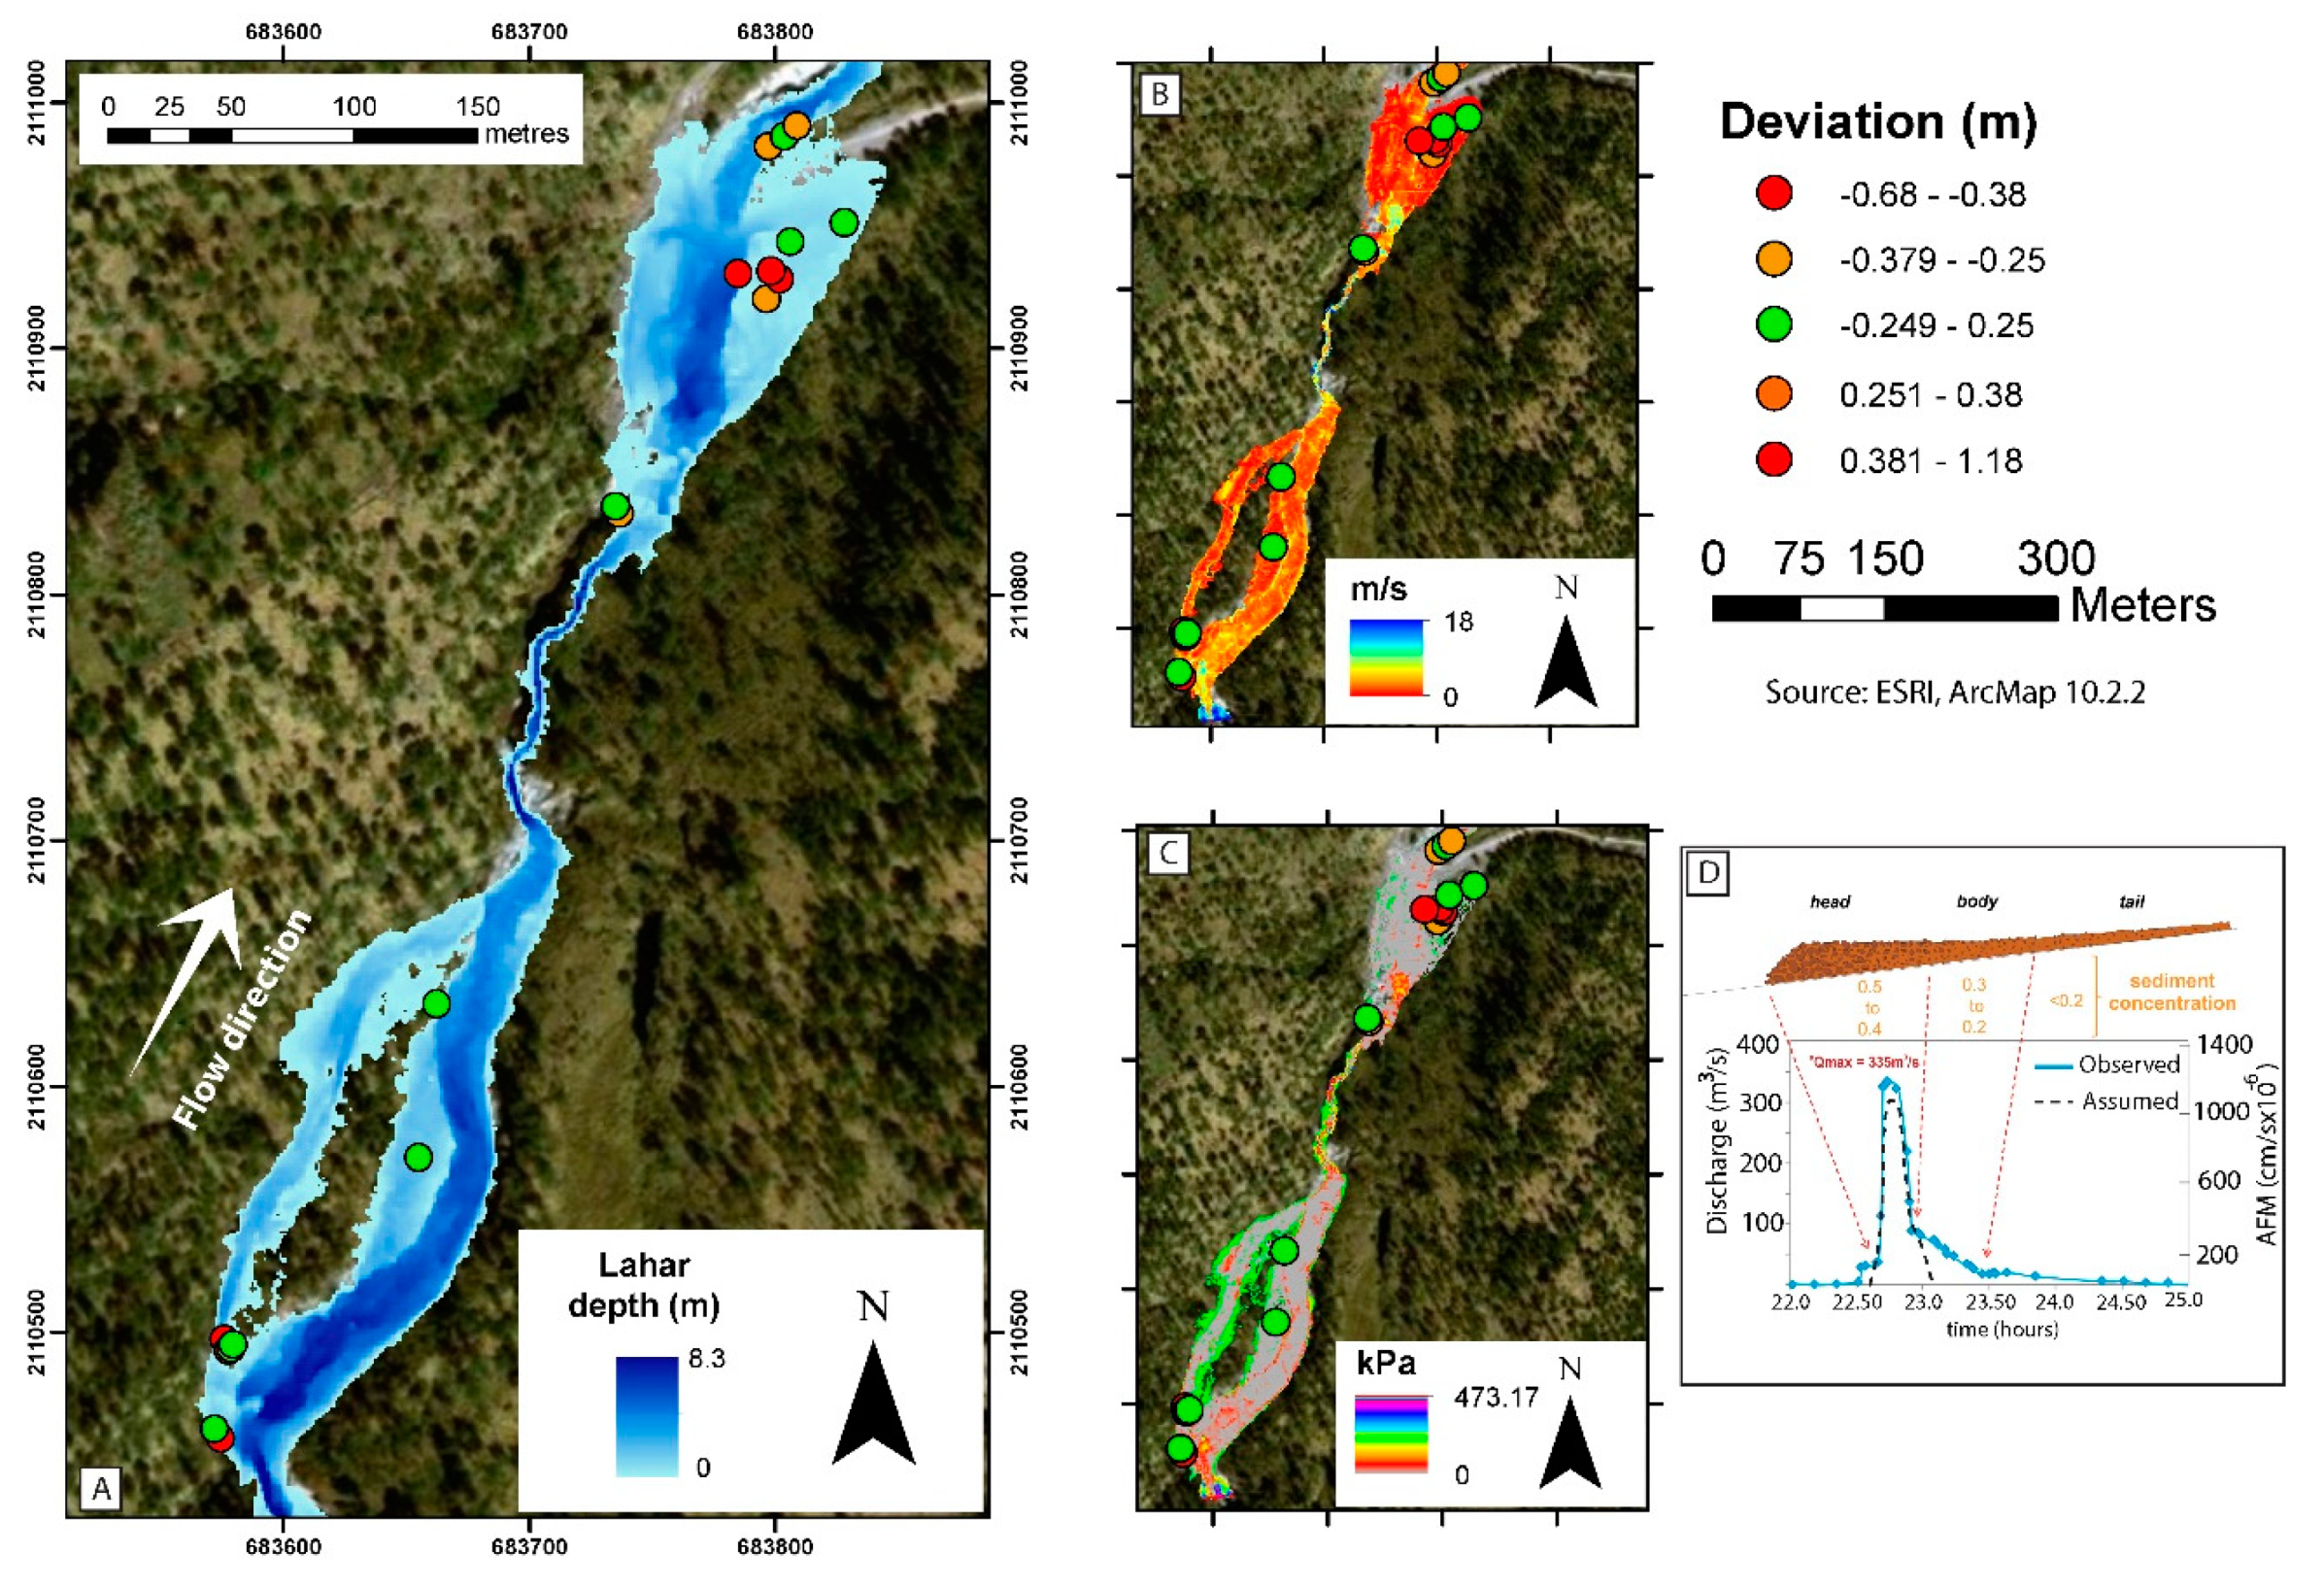
We simulated the 2012 lahar in a trial-and-error approach with maximum peak discharges ranging from 25 to 500 m3 s−1 to approximate and ultimately reduce the deviation between scar heights found in the analyzed trees and maximum lahar depths obtained in the model. Our results suggest a mean deviation ranging from −0.43 m for 25 m3 s−1 to 3.08 m for 500 m3 s−1. Refining the approach further, the minimum absolute mean deviation was reached for a peak discharge of 78 m3 s−1, translating into a lahar volume of 33,000 m3 based on the assumed shape of the hydrograph (see Figure 6D). Varying lahar density and the ξ coefficients by ±25% indicate that the mean deviation can change by up to ~±0.43 m and ~±0.47 m, respectively (Table 1).
Figure 6A shows the relationship between the maximum water depth and scar heights, as well as flow velocity and stream power for the estimated peak discharge. Deviations between the lahar model and scar heights were between −0.68 m and 1.18 m. Relatively small deviations (±0.25 m; 50th percentile) were observed in 52% of the cases. Moderate deviations (ranging between ±0.25 and ±0.35 m; 50th–75th percentile) could be found in 26% of the cases, whereas 22% of the scars found in trees showed deviations exceeding ±0.35 m (>75th percentile). Only one tree showed deviations exceeding 1 standard deviation (σ = 0.77 m; Table 2). Noteworthy, most of the trees for which deviations were more relevant were growing at sites where they tend to be quite exposed to the flow, i.e., especially in those parts of the reach with the steepest slopes and unruffled bedrock and where specific kinetic energy tends to be higher as well. The maximum lahar velocity simulated by RAMMS (Figure 6B) occurred in the central part of the main channel with ~18 m/s.

5. Discussion and Conclusions

In this paper, we provide insights into a tree-ring based lahar discharge reconstruction for an event that occurred in the Jamapa Gorge (northern slopes of Pico de Orizaba volcano, Mexico) during August 2012, likely as a result of the passage of hurricane “Ernesto”. To this end, we used scar heights found in 19 Pinus hartwegii trees to calibrate simulation runs realized with the two-dimensional RAMMS model. Even if the combined use of tree-ring evidence and model outputs has been used previously for peak discharge estimation of fluvial processes [40], this study likely is the first of its kind to reconstruct peak discharge of a lahar event with botanical evidence and models.
The intra-annual dating of 19 scars found in trees (Figure 3B) indicate that the lahar event must have taken place in early latewood which locally corresponds to late summer (Figure 5); this timing is consistent with the passage of hurricane “Ernesto” on 9 August 2012 at the study site. Evidence of lahars triggered by the 2012 hurricane can be found elsewhere in central Mexico, namely on Popocatépetl [20]; Iztaccíhuatl [78] and La Malinche [41] volcanoes. The timing of the 2012 lahar at our study site is further supported by evidence from local newspapers [79]. However, the 2012 lahars in Jamapa Gorge could also have been favored by water added to the system as a result of progressive ice-melting at Jamapa glacier in recent years [61].
In Mexico, dendrogeomorphic approaches have been used to date and reconstruct lahars [18,19,20] and debris flows [21,41] in the past. By contrast, studies focusing on the magnitude of hydrogeomorphic events are still critically lacking. The approach that we present here has allowed for retrospective estimation of the peak discharge of the 2012 lahar at 78 m3 s−1 at the level of the study reach with a ~3 km2 catchment area. For this modelled peak discharge, the difference between the maximum height of the scars and lahar stage modelled were minimized. The reconstructed peak discharge is somehow lower than the lahars of Nevado del Huila [22], which was estimated at 13,500 m3 s−1 (maximum peak discharge) with a ~26 km2 catchment area (Páez River). By contrast, the calculated peak discharge is higher than the 48 m3 s−1 estimated for “Patrio” lahar at Colima volcano [16] (Montegrande catchment area: ~6.2 km2). In addition, the shape of the channel [30], lahar rheologic characteristics [36] and resolution of the digital terrain model [48] can affect the lahar scenarios.
Documented differences between observed scar heights and modeled flow heights are comparable with results obtained in past work focusing on the fluvial domain. The largest deviations (exceeding ±0.35 m or the >75th percentile of deviations) were found in trees located on cut banks and/or in straight and exposed positions along the investigated river reach at the lower end of the channel. By contrast, moderate and smaller deviations were typically found in trees located in intermediate and low-energy landforms, such as alluvial terraces located in the central and lower end of the channel. These results are in agreement with previous studies carried out in the fluvial domain [40,80,81,82,83], suggesting that intermediate-energy landforms such as alluvial terraces could be considered appropriate geomorphic locations for tree-ring-based reconstructions of lahar magnitude. Here, instead of using a non-Newtonian flow-like model for high concentrated flows [48], we employed a single-phase model to simulate inertial flows of solid–fluid mixtures such as debris flows [84]. In this study, the calibration of RAMMS has been based exclusively on scar heights and the extension of fresh deposits observed during field recognition. Despite the fact that we performed a sensitivity analysis on the main parameters, i.e., ±25% on lahar density and ξ coefficients (µ was fixed according to field recognition), uncertainties remain regarding the total volume of the event.
The combination of tree-ring based lahar reconstruction and process modelling with RAMMS is the first of its kind and has helped considerably to estimate the magnitude of the 2012 lahar in a sector of Jamapa Gorge. As such, we conclude that the combination of 2D dimensional dynamic modeling and tree-ring analysis can be very useful to assess and calibrate the magnitude of lahars in other temperate forests growing on Mexican volcanoes, especially in areas with scarce or inexistent hydrologic data and/or for the dating and assessment of older lahars.

Author Contributions

All authors have contributed to the final version of the article. Conceptualization, O.F.-R. and J.A.B.-C.; Methodology, J.A.B.-C. and O.F.-R.; Software, J.A.B.-C.; Writing—Original Draft, O.F.-R. and J.A.B.-C; Writing—Review and Editing, O.F.-R., J.A.B.-C., J.E.F.-G., L.V.-S., M.S., and L.C. All authors have read and agreed to the published version of the manuscript.

Funding

This research was funded by DGAPA-PAPIIT, UNAM project number IA100619.

Acknowledgments

We acknowledge Andres Prado for his support during fieldwork and for the digital elevation model with an orthomosaic map based on drone images. We acknowledge Salvador Ponce and Mireya Vazquez for their help during fieldwork.

Conflicts of Interest

The authors declare no conflict of interest.

References

  1. Smith, G.A.; Fritz, W.J. Volcanic influences on terrestrial sedimentation. Geology 1989, 17, 375–376. [Google Scholar] [CrossRef]
  2. Vallance, J.W. Volcanic debris flow. In Debris-Flows Hazards and Related Phenomena; Jakob, M., Hungr, O., Eds.; Springer: Berlin/Heidelberg, Germany, 2005; pp. 247–274. [Google Scholar]
  3. Lavigne, F.; Thouret, J.C. Sediment transportation and deposition by rain-triggered lahars at Merapi Volcano, Central Java, Indonesia. Geomorphology 2002, 49, 45–69. [Google Scholar] [CrossRef]
  4. Scott, K.; Macías, J.L.; Naranjo, J.A.; Rodríguez, S.; McGeehin, J.P. Catastrophic debris flows transformed from landslide in volcanic terrains: Mobility, hazard assessment and mitigation strategies. In U. S. Geological Survey Professional Paper; U.S. Geological Survey: Reston, VA, USA, 2001; Volume 1630, p. 59. [Google Scholar]
  5. Vallance, J.W.; Iverson, R.M. Lahars and their deposits. In Encyclopedia of Volcanoes, 2nd ed.; Academic Press: London, UK, 2015; pp. 649–664. [Google Scholar] [CrossRef]
  6. Capra, L.; Macías, J.L. The cohesive Naranjo debris flow deposit (10 km3): A dam breakout flow derived from the pleistocene debris-avalanche deposit of Nevado de Colima volcano (Mexico). J. Volcanol. Geoth. Res. 2002, 117, 213–235. [Google Scholar] [CrossRef]
  7. Cortes, A.; Macías, J.L.; Capra, L.; Garduño-Monroy, V.H. Sector collapse of the SW flank of Volcán de Colima, México. The 3600 yr BP La Lumbre-Los Ganchos debris avalanche and associated debris flows. J. Volcanol. Geoth. Res. 2010, 197, 52–66. [Google Scholar] [CrossRef]
  8. Saucedo, R.; Macías, J.L.; Sarocchi, D.; Bursik, M.I.; Rupp, B. The rain-triggered Atenquique volcaniclastic debris flow of October 16, 1955 at Nevado de Colima Volcano, Mexico. J. Volcanol. Geoth. Res. 2008, 173, 69–83. [Google Scholar] [CrossRef]
  9. Bisson, M.; Pareschi, M.T.; Zanchetta, G.; Sulpizio, R.; Santacroce, R. Volcaniclastic debris flow occurrences in the Campania region (southern Italy) and their relation to Holocene—Late Pleistocene pyroclastic fall deposits: Implications for large-scale hazard mapping. Bull Volcanol. 2007, 70, 157–167. [Google Scholar] [CrossRef] [Green Version]
  10. Bisson, M.; Zanchettab, G.; Sulpizio, R.; Demib, F. A map for volcaniclastic debris flow hazards in Apennine areas surrounding the Vesuvius volcano (Italy). J. Maps 2013, 9, 230–238. [Google Scholar] [CrossRef]
  11. Vallance, J.W.; Schilling, S.P.; Devoli, G.; Reid, M.E.; Howell, M.M.; Brien, D.L. Lahar Hazards at Casita and San Cristóbal Volcanoes, Nicaragua; Open-File Report 01-468; U.S. Geological Survey: Reston, VA, USA, 2004; pp. 1–18.
  12. Carrasco-Núñez, G.; Díaz-Castellón, R.; Siebert, L.; Hubbard, B.; Sheridan, M.F.; Rodríguez, S.R. Multiple edifice-collapse events in the Eastern Mexican Volcanic Belt: The role of sloping substrate and implications for hazard assessment. J. Volcanol. Geoth. Res. 2006, 158, 151–176. [Google Scholar] [CrossRef]
  13. Newhall, C.; Stauffer, P.H.; Hendley, J.W. Lahars of Mount Pinatubo, Philippines; Fact Sheet 114; U.S. Geological Survey: Reston, VA, USA, 1997.
  14. Lavigne, F.; Thouret, J.C.; Voight, B.; Suwa, H.; Sumaryono, A. Lahars at Merapi volcano, Central Java: An overview. J. Volcanol. Geoth. Res. 2000, 100, 423–456. [Google Scholar] [CrossRef]
  15. Capra, L.; Borselli, L.; Varley, N.; Gavilanes-Ruiz, J.C.; Norini, G.; Sarocchi, D.; Caballero, L.; Cortes, A. Rainfall-triggered lahars at Volcán de Colima, Mexico: Surface hydro-repellency as initiation process. J. Volcanol. Geoth. Res. 2010, 189, 105–117. [Google Scholar] [CrossRef]
  16. Vázquez, R.; Capra, L.; Caballero, L.; Arámbula-Mendoza, R.; Reyes-Dávila, G. The anatomy of a lahar: Deciphering the 15th September 2012 lahar at Volcán de Colima, Mexico. J. Volcanol. Geoth. Res. 2014, 272, 126–136. [Google Scholar] [CrossRef]
  17. Procter, J.N.; Cronin, S.J.; Zernack, A.V. Landscape and sedimentary response to catastrophic debris avalanches, western Taranaki, New Zealand. Sediment. Geol. 2009, 220, 271–287. [Google Scholar] [CrossRef]
  18. Bollschweiler, M.; Stoffel, M.; Vázquez-Selem, L.; Palacios, D. Tree-ring reconstruction of past lahar activity at Popocatépetl volcano, México. Holocene 2010, 20, 265–274. [Google Scholar] [CrossRef] [Green Version]
  19. Franco-Ramos, O.; Stoffel, M.; Vázquez-Selem, L.; Capra, L. Spatio-temporal reconstruction of lahars on the southern slopes of Colima volcano, Mexico—A dendrogeomorphic approach. J. Volcanol. Geoth. Res. 2013, 267, 30–38. [Google Scholar] [CrossRef]
  20. Franco-Ramos, O.; Castillo, M.; Muñoz–Salinas, E. Using tree-ring analysis to evaluate the intra-eruptive lahar activity in the Nexpayantla Gorge, Popocatépetl Volcano (Central Mexico). Catena 2016, 147, 205–215. [Google Scholar] [CrossRef]
  21. Franco-Ramos, O.; Stoffel, M.; Vázquez Selem, L. Tree-ring based record of intra-eruptive lahar activity: Axaltzintle valley, Malinche volcano, Mexico. Geochronometria 2016, 43, 74–83. [Google Scholar] [CrossRef] [Green Version]
  22. Worni, R.; Huggel, C.; Stoffel, M.; Pulgarin, B. Challenges of modelling recent, very large lahars at Nevado del Huila Volcano, Colombia. Bull. Volcanol. 2012, 74, 309–324. [Google Scholar] [CrossRef]
  23. Schilling, S. LAHARZ: GIS Programs for Automated Mapping of Lahar-Inundation Hazard Zones; OFR 98-638; USGS: Vancouver, WA, USA, 1998.
  24. Williams, R.; Stinton, A.J.; Sheridan, M.F. Evaluation of the Titan2D two-phase flow model using an actual event: Case study of the 2005 Vazcún Valley Lahar. J. Volcanol. Geoth. Res. 2008, 177, 760–766. [Google Scholar] [CrossRef]
  25. O’Brien, J.; Julien, P.; Fullerton, W. Two-dimensional water flood and mudflow simulation. J. Hydraul. Eng. 1993, 119, 244–261. [Google Scholar] [CrossRef]
  26. Cesca, M.; D’Agostino, V. Comparison between FLO-2D and RAMMS in debris-flow modelling: A case study in the Dolomites. WIT Trans. Eng. Sci. 2008, 60, 197–206. [Google Scholar] [CrossRef] [Green Version]
  27. Lee, S.K.; Lee, C.W.; Lee, S. A comparison of the Landsat image and LAHARZ-simulated lahar inundation hazard zone by the 2010 Merapi eruption. Bull. Volcanol. 2015, 77, 46. [Google Scholar] [CrossRef]
  28. Pistolesi, M.; Cioni, R.; Rosi, M.; Aguilera, E. Lahar hazard assessment in the southern drainage system of Cotopaxi volcano, Ecuador: Results from multiscale lahar simulations. Geomorphology 2014, 207, 51–63. [Google Scholar] [CrossRef]
  29. Nocentini, M.; Tofani, V.; Gigli, G.; Fidolini, F.; Casagli, N. Modeling debris flows in volcanic terrains for hazard mapping: The case study of Ischia Island (Italy). Landslides 2014, 12, 831–846. [Google Scholar] [CrossRef]
  30. Muñoz-Salinas, E.; Castillo-Rodríguez, M.; Manea, V.; Manea, M.; Palacios, D. Lahar flow simulation using LAHARZ program: Application for Popocatépetl volcano, Mexico. J. Volcanol. Geoth. Res. 2009, 182, 13–22. [Google Scholar] [CrossRef]
  31. Hubbard, B.E. Volcanic Hazard Mapping Using Aircraft, Satellite, and Digital Topographic Data: Pico de Orizaba (Citlaltépetl), Mexico. Ph.D. Thesis, University at Buffalo, Buffalo, NY, USA, 2001; p. 354. [Google Scholar]
  32. Capra, L.; Norini, G.; Groppelli, G.; Macías, J.L.; Arce, J.L. Volcanic hazard zonation of the Nevado de Toluca volcano, México. J. Volcanol. Geoth. Res. 2008, 176, 469–484. [Google Scholar] [CrossRef]
  33. Sieron, K.; Capra, L.; Rodríguez-Elizararrás, S. Hazard assessment at San Martín volcano based on geological record, numerical modeling, and spatial analysis. Nat. Hazards 2014, 70, 275–297. [Google Scholar] [CrossRef]
  34. Vázquez, R.; Macías, J.L.; Cisneros, G. A first approach to the numerical modeling of lahars at Tacaná Volcanic Complex, Chiapas, México. In EGU General Assembly Conference Abstracts; EGU2018-905; Geophysical Research Abstracts: Vienna, Austria, 2018; Volume 20. [Google Scholar]
  35. Sieron, K.; Ferrés, D.; Siebe, C.; Constantinescu, R.; Capra, L.; Connor, C.; Connor, L.; Groppelli, G.; González Zuccolotto, K. Ceboruco hazard map: Part II—Modeling volcanic phenomena and construction of the general hazard map. Nat. Hazards. 2019. [Google Scholar] [CrossRef]
  36. Caballero, L.; Capra, L. The use of FLO2D numerical code in lahar hazard evaluation at Popocatépetl volcano: A 2001 lahar scenario. Nat. Hazards Earth Syst. Sci. 2014, 14, 3345–3355. [Google Scholar] [CrossRef] [Green Version]
  37. Zaragoza Campillo, A.G. Caracterización y Dinámica del Lahar Secundario Ocurrido en 2010, Volcán Popocatépetl: Mecanismos Disparadores, Características Texturales y Simulación Numérica. Bachelor‘s Thesis, Facultad de Ciencias, Universidad Nacional Autónoma de México, Coyoacán, Mexico, 2017; p. 92. (In Spanish). [Google Scholar]
  38. Capra, L.; Coviello, V.; Borselli, L.; Márquez-Ramírez, V.H.; Arámbula-Mendoza, R. Hydrological control of large hurricane-induced lahars: Evidence from rainfall-runoff modeling, seismic and video monitoring. Nat. Hazards Earth Syst. Sci. 2018, 18, 781–794. [Google Scholar] [CrossRef] [Green Version]
  39. Baker, V.R.; Webb, R.H.; House, P.K. The scientific and societal value of paleoflood hydrology. In Ancient Floods, Modern Hazards: Principles and Applications of Paleoflood Hydrology; Water Science and Application; House, P.K., Webb, R.H., Baker, V.R., Levish, D.R., Eds.; American Geophysical Union: Washington, DC, USA, 2002; Volume 5, pp. 1–19. [Google Scholar]
  40. Ballesteros-Cánovas, J.A.; Stoffel, M.; St George, S.; Hirschboeck, K. A review of flood records from tree rings. Prog. Phys. Geogr. 2015, 39, 794–816. [Google Scholar] [CrossRef]
  41. Franco-Ramos, O.; Stoffel, M.; Ballesteros-Cánovas, J.A. Reconstruction of debris-flow activity in a temperate mountain forest catchment of central Mexico. J. Mt. Sci. 2019, 16, 2096–2109. [Google Scholar] [CrossRef]
  42. Stoffel, M.; Corona, C. Dendroecological dating of geomorphic disturbance in trees. Tree-Ring Res. 2014, 70, 3–20. [Google Scholar] [CrossRef] [Green Version]
  43. Webb, R.H.; Jarrett, R.D. One-dimensional estimation techniques for discharges of paleofloods. In Ancient Floods, Modern Hazards: Principles and Applications of Paleoflood Hydrology: Water Science and Application; House, P.K., Webb, R.H., Baker, V.R., Levish, D.R., Eds.; American Geophysical Union: Washington, DC, USA, 2002; pp. 111–126. [Google Scholar]
  44. Ballesteros, J.A.; Bodoque, J.M.; Díez, A.; Sanchez-Silva, M.; Stoffel, M. Calibration of floodplain roughness and estimation of palaeoflood discharge based on tree-ring evidence and hydraulic modelling. J. Hydrol. 2011, 403, 103–115. [Google Scholar] [CrossRef]
  45. Ballesteros, J.A.; Eguibar, M.; Bodoque, J.M.; Díez, A.; Stoffel, M.; Gutiérrez, I. Estimating flash flood discharge in an ungauged mountain catchment with 2D hydraulic models and dendrogeomorphic paleostage indicators. Hydrol. Process. 2011, 25, 970–979. [Google Scholar] [CrossRef] [Green Version]
  46. Ballesteros-Cánovas, J.A.; Stoffel, M.; Spyt, B.; Janecka, K.; Kaczka, R.J.; Lempa, M. Paleoflood discharge reconstruction in Tatra Mountain streams. Geomorphology 2016, 272, 92–101. [Google Scholar] [CrossRef]
  47. Bodoque, J.M.; Díez-Herrero, A.; Eguibar, M.A.; Benito, G.; Ruiz-Villanueva, V.; Ballesteros-Cánovas, J.A. Challenges in paleoflood hydrology applied to risk analysis in mountainous watersheds—A review. J. Hydrol. 2015, 529, 449–467. [Google Scholar] [CrossRef] [Green Version]
  48. Garrote, J.; Díez-Herrero, A.; Génova, M.; Bodoque, J.M.; Perucha, M.A.; Mayer, P.L. Improving Flood Maps in Ungauged Fluvial Basins with Dendrogeomorphological Data. An Example from the Caldera de Taburiente National Park (Canary Islands, Spain). Geosciences 2018, 8, 300. [Google Scholar] [CrossRef] [Green Version]
  49. Hussin, H.Y.; Quan Luna, B.; Westen, C.J.; Christen, M.; Malet, J.-P.; Van Asch, T.W. Parameterization of a numerical 2-D debris flow model with entrainment: A case study of the Faucon catchment, Southern French Alps. Nat. Hazards Earth Syst. Sci. 2012, 12, 3075–3090. [Google Scholar] [CrossRef]
  50. Fan, L.; Lehmanna, P.; McArdell, B.; Or, D. Linking rainfall-induced landslides with debris flows runout patterns towards catchment scale hazard assessment. Geomorphology 2017, 280, 1–15. [Google Scholar] [CrossRef]
  51. Frank, F.; McArdell, B.W.; Oggier, N.; Baer, P.; Christen, M.; Vieli, A. Debris-flow modeling at Meretschibach and Bondasca catchments, Switzerland: Sensitivity testing of field-data-based entrainment model. Nat. Hazards Earth Syst. Sci. 2017, 17, 801–815. [Google Scholar] [CrossRef] [Green Version]
  52. Carrasco-Núñez, G.; Vallance, J.W.; Rose, W.I. A voluminous avalanche-induced lahar from Citlaltépetl volcano, Mexico: Implications for hazards assessment. J. Volcanol. Geoth. Res. 1993, 59, 35–46. [Google Scholar] [CrossRef]
  53. Carrasco-Núñez, G. Structure and proximal stratigraphy of Citlaltépetl volcano (Pico de Orizaba), Mexico. Geol. Soc. Am. 2000, 334, 247–262. [Google Scholar] [CrossRef]
  54. Carrasco-Núñez, G.; Rose, W.I. Eruption of a major Holocene pyroclastic flow at Citlaltépetl volcano (Pico de Orizaba), México, 8.5-9.0 ka. J. Volcanol. Geoth. Res. 1995, 69, 197–215. [Google Scholar] [CrossRef]
  55. Rossotti, A.; Carrasco-Núñez, G. Stratigraphy of the 8.5–9.0 ka B.P. Citlaltépetl pumice fallout sequence. Rev. Mex. Ciencias Geol. 2004, 21, 353–370. [Google Scholar]
  56. Hoskuldsson, A.; Robin, C. Late Pleistocene to Holocene eruptive activity of Pico de Orizaba, Eastern Mexico. Bull. Volcanol. 1993, 55, 571–587. [Google Scholar] [CrossRef]
  57. Siebe, C.; Abrams, M.; Sheridan, M.F. Major Holocene block-and-ash fan at the western slope of ice-capped Pico de Orizaba volcano, México: Implications for future hazards. J. Volcanol. Geoth. Res. 1993, 59, 1–33. [Google Scholar] [CrossRef]
  58. Alcalá-Reygosa, J.; Palacios, D.; Schimmelpfennig, I.; Vázquez-Selem, L.; García-Sancho, L.; Franco-Ramos, O.; Villanueva, J.; Zamorano, J.J.; ASTER Team. Dating late Holocene lava flows in Pico de Orizaba (Mexico) by means of in situ-produced cosmogenic 36Cl, lichenometry and dendrochronology. Quat. Geochron. 2018, 47, 93–106. [Google Scholar] [CrossRef]
  59. Iverson, R.M.; Schilling, S.P.; Vallance, J.W. Objective delineation of lahar hazard zones. Geol. Soc. Am. Bull. 1998, 110, 972–984. [Google Scholar] [CrossRef]
  60. Rodríguez, S.; Mora-González, I.; Murrieta-Hernández, J.-L. Flujos de baja concentración asociados con lluvias de intensidad extraordinaria en el flanco sur del volcán Pico de Orizaba (Citlaltépetl), México. Boletín Soc. Geológica Mex. 2006, 58, 223–236. [Google Scholar] [CrossRef]
  61. Martínez, M.A.M.; Rodríguez, C.M.W.; Monjardín, L.C.R.; Weissling, B.; Sieron, K.; Martínez, C.A.O. Afectaciones por posible asociación de eventos hidrometeorológicos y geológicos en los municipios de Calcahualco y Coscomatepec, Veracruz. Teoría y Praxis 2016, 12, 31–49. [Google Scholar] [CrossRef]
  62. Palacios, D.; Vazquez-Selem, L. Geomorphic effects of the retreat of Jamapa glacier, Pico de Orizaba volcano (Mexico). Geogr. Ann. 1996, 78, 19–34. [Google Scholar] [CrossRef]
  63. Palacios, D.; Parrilla, G.; Zamorano, J.J. Paraglacial and postglacial debris flows on a Little Ice Age terminal moraine: Jamapa Glacier, Pico de Orizaba (Mexico). Geomorphology 1999, 28, 95–118. [Google Scholar] [CrossRef]
  64. Brown, D.P. Tropical Cyclone Report. Hurricane Ernesto. National Hurricane Center. NOAA, 2013. Available online: https://www.nhc.noaa.gov/data/tcr/AL052012_Ernesto.pdf (accessed on 22 November 2019).
  65. SMN-CNA. Reseña Huracán Ernesto del Océano Atlántico. Temporada 2012 de Ciclones y Huracanes. Servicio Metrológico Nacional-Comisión Nacional de Agua, 2012. (In Spanish). Available online: http://smn1.conagua.gob.mx/ciclones/tempo2012/atlantico/Ernesto-a2012.pdf (accessed on 22 November 2019).
  66. Archivo de Datos Climatológicos del Servicio Meteorológico Nacional; CNA-SMN: Mexico, 2019. Available online: https://smn.conagua.gob.mx/tools/RESOURCES/Diarios/30342.txt (accessed on 22 November 2019).
  67. Westoby, M.J.; Brasington, J.; Glasser, N.F.; Hambrey, M.J.; Reynolds, J.M. ‘Structure-from-Motion’photogrammetry: A low-cost, effective tool for geoscience applications. Geomorphology 2012, 179, 300–314. [Google Scholar] [CrossRef] [Green Version]
  68. Bräker, O. Measuring and data processing in tree-ring research—A methodological introduction. Dendrochronologia 2002, 20, 203–216. [Google Scholar] [CrossRef]
  69. Stoffel, M.; Bollschweiler, M. Tree-ring analysis in natural hazards research—An overview. Nat. Hazards Earth Syst. Sci. 2008, 8, 187–202. [Google Scholar] [CrossRef] [Green Version]
  70. Robinson, W.J.; Evans, R. A microcomputer-based tree-ring measuring system. Tree-Ring Bull. 1980, 40, 59–64. [Google Scholar]
  71. Rinn, F. TSAP-Win. Time Series Analysis and Presentation for Dendrochronology and Related Applications. Version 4.64 for Microsoft Windows. User Reference. Rinntech: Heidelberg, Germany, 2003; p. 22. Available online: http://www.rinntech.de (accessed on 22 January 2020).
  72. Stoffel, M.; Lièvre, I.; Monbaron, M.; Perre, S. Seasonal timing of rockfall activity on forested slope at Täschgufer (Swiss Alps)—A dendrogeomorphological approach. Z. Geomorphol. 2005, 49, 89–106. [Google Scholar]
  73. Bartelt, P.; Buehler, Y.; Christen, M.; Deubelbeiss, Y.; Graf, C.; McArdell, B.W. RAMMS—A Modelling System for Debris Flows in Research and Practice—User Manuel v.1.01/Hillslope Debris Flow; WSL Institute for Snow and Avalanche Research SLF: Davos, Switzerland, 2011; p. 91. [Google Scholar]
  74. Salm, B. Flow, flow transition and runout distances of flowing avalanches. Ann. Glaciol. 1993, 18, 221–226. [Google Scholar] [CrossRef] [Green Version]
  75. Voellmy, A. Über die Zerstörungskraft von Lawinen. Schweiz. Bauztg. 1955, 73, 159–162. [Google Scholar]
  76. Christen, M.; Bartelt, P.; Kowalski, J. Back calculation of the in den Arelen avalanche with RAMMS: Interpretation. Ann. Glaciol. 2010, 51, 161–168. [Google Scholar] [CrossRef] [Green Version]
  77. Christen, M.; Kowalski, J.; Bartelt, P. RAMMS: Numerical simulation of dense snow avalanches in three-dimensional terrain. Cold Reg. Sci. Technol. 2010, 63, 1–14. [Google Scholar] [CrossRef] [Green Version]
  78. Prado-Lallande, A. Geomorfología, Dendrocronología y Análisis Sedimentológico en la Cuenca Alta del Valle Alcalican, SW del Volcán Iztaccíhuatl. Bachelor‘s Thesis, Colegio de Geografía, Facultad de Filosofía y Letras, Universidad Nacional Autónoma de México, Mexico City, Mexico, 2017; p. 106. (In Spanish). [Google Scholar]
  79. La Jornada. The Newspaper of Mexico. 2012. (In Spanish). Available online: https://www.jornada.com.mx/2012/08/09/estados/033n1est (accessed on 18 September 2019).
  80. Gottesfeld, A.S. British Columbia flood scars: Maximum flood-stage indicator. Geomorphology 1996, 14, 319–325. [Google Scholar] [CrossRef]
  81. Yanosky, T.M.; Jarrett, R.D. Dendrochronologic evidence for the frequency and magnitude of paleofloods. In Ancient Floods, Modern Hazards: Principles and Applications of Paleoflood Hydrology; Water Science and Application; House, P.K., Webb, R.H., Baker, V.R., Levish, D.R., Eds.; American Geophysical Union: Washington, DC, USA, 2002; Volume 5, pp. 77–89. [Google Scholar]
  82. Victoriano, A.; Díez-Herrero, A.; Génova, M.; Guinau, M.; Furdada, G.; Khazaradze, G.; Calvet, J. Four-topic correlation between flood dendrogeomorphological evidence and hydraulic parameters (the Portainé stream, Iberian Peninsula). Catena 2018, 162, 216–229. [Google Scholar] [CrossRef]
  83. Quesada-Román, A.; Ballesteros-Cánovas, J.A.; Granados, S.; Birkel, C.; Stoffel, M. Dendrogeomorphic reconstruction of floods in a dynamic tropical river. Geormophology. in press.
  84. Naef, D.; Rickenmann, D.; Rutschmann, P.; McArdell, B.W. Comparison of flow resistance relations for debris flows using a one-dimensional finite element simulation model. Nat. Hazards Earth Syst. Sci. 2006, 6, 155–165. [Google Scholar] [CrossRef] [Green Version]
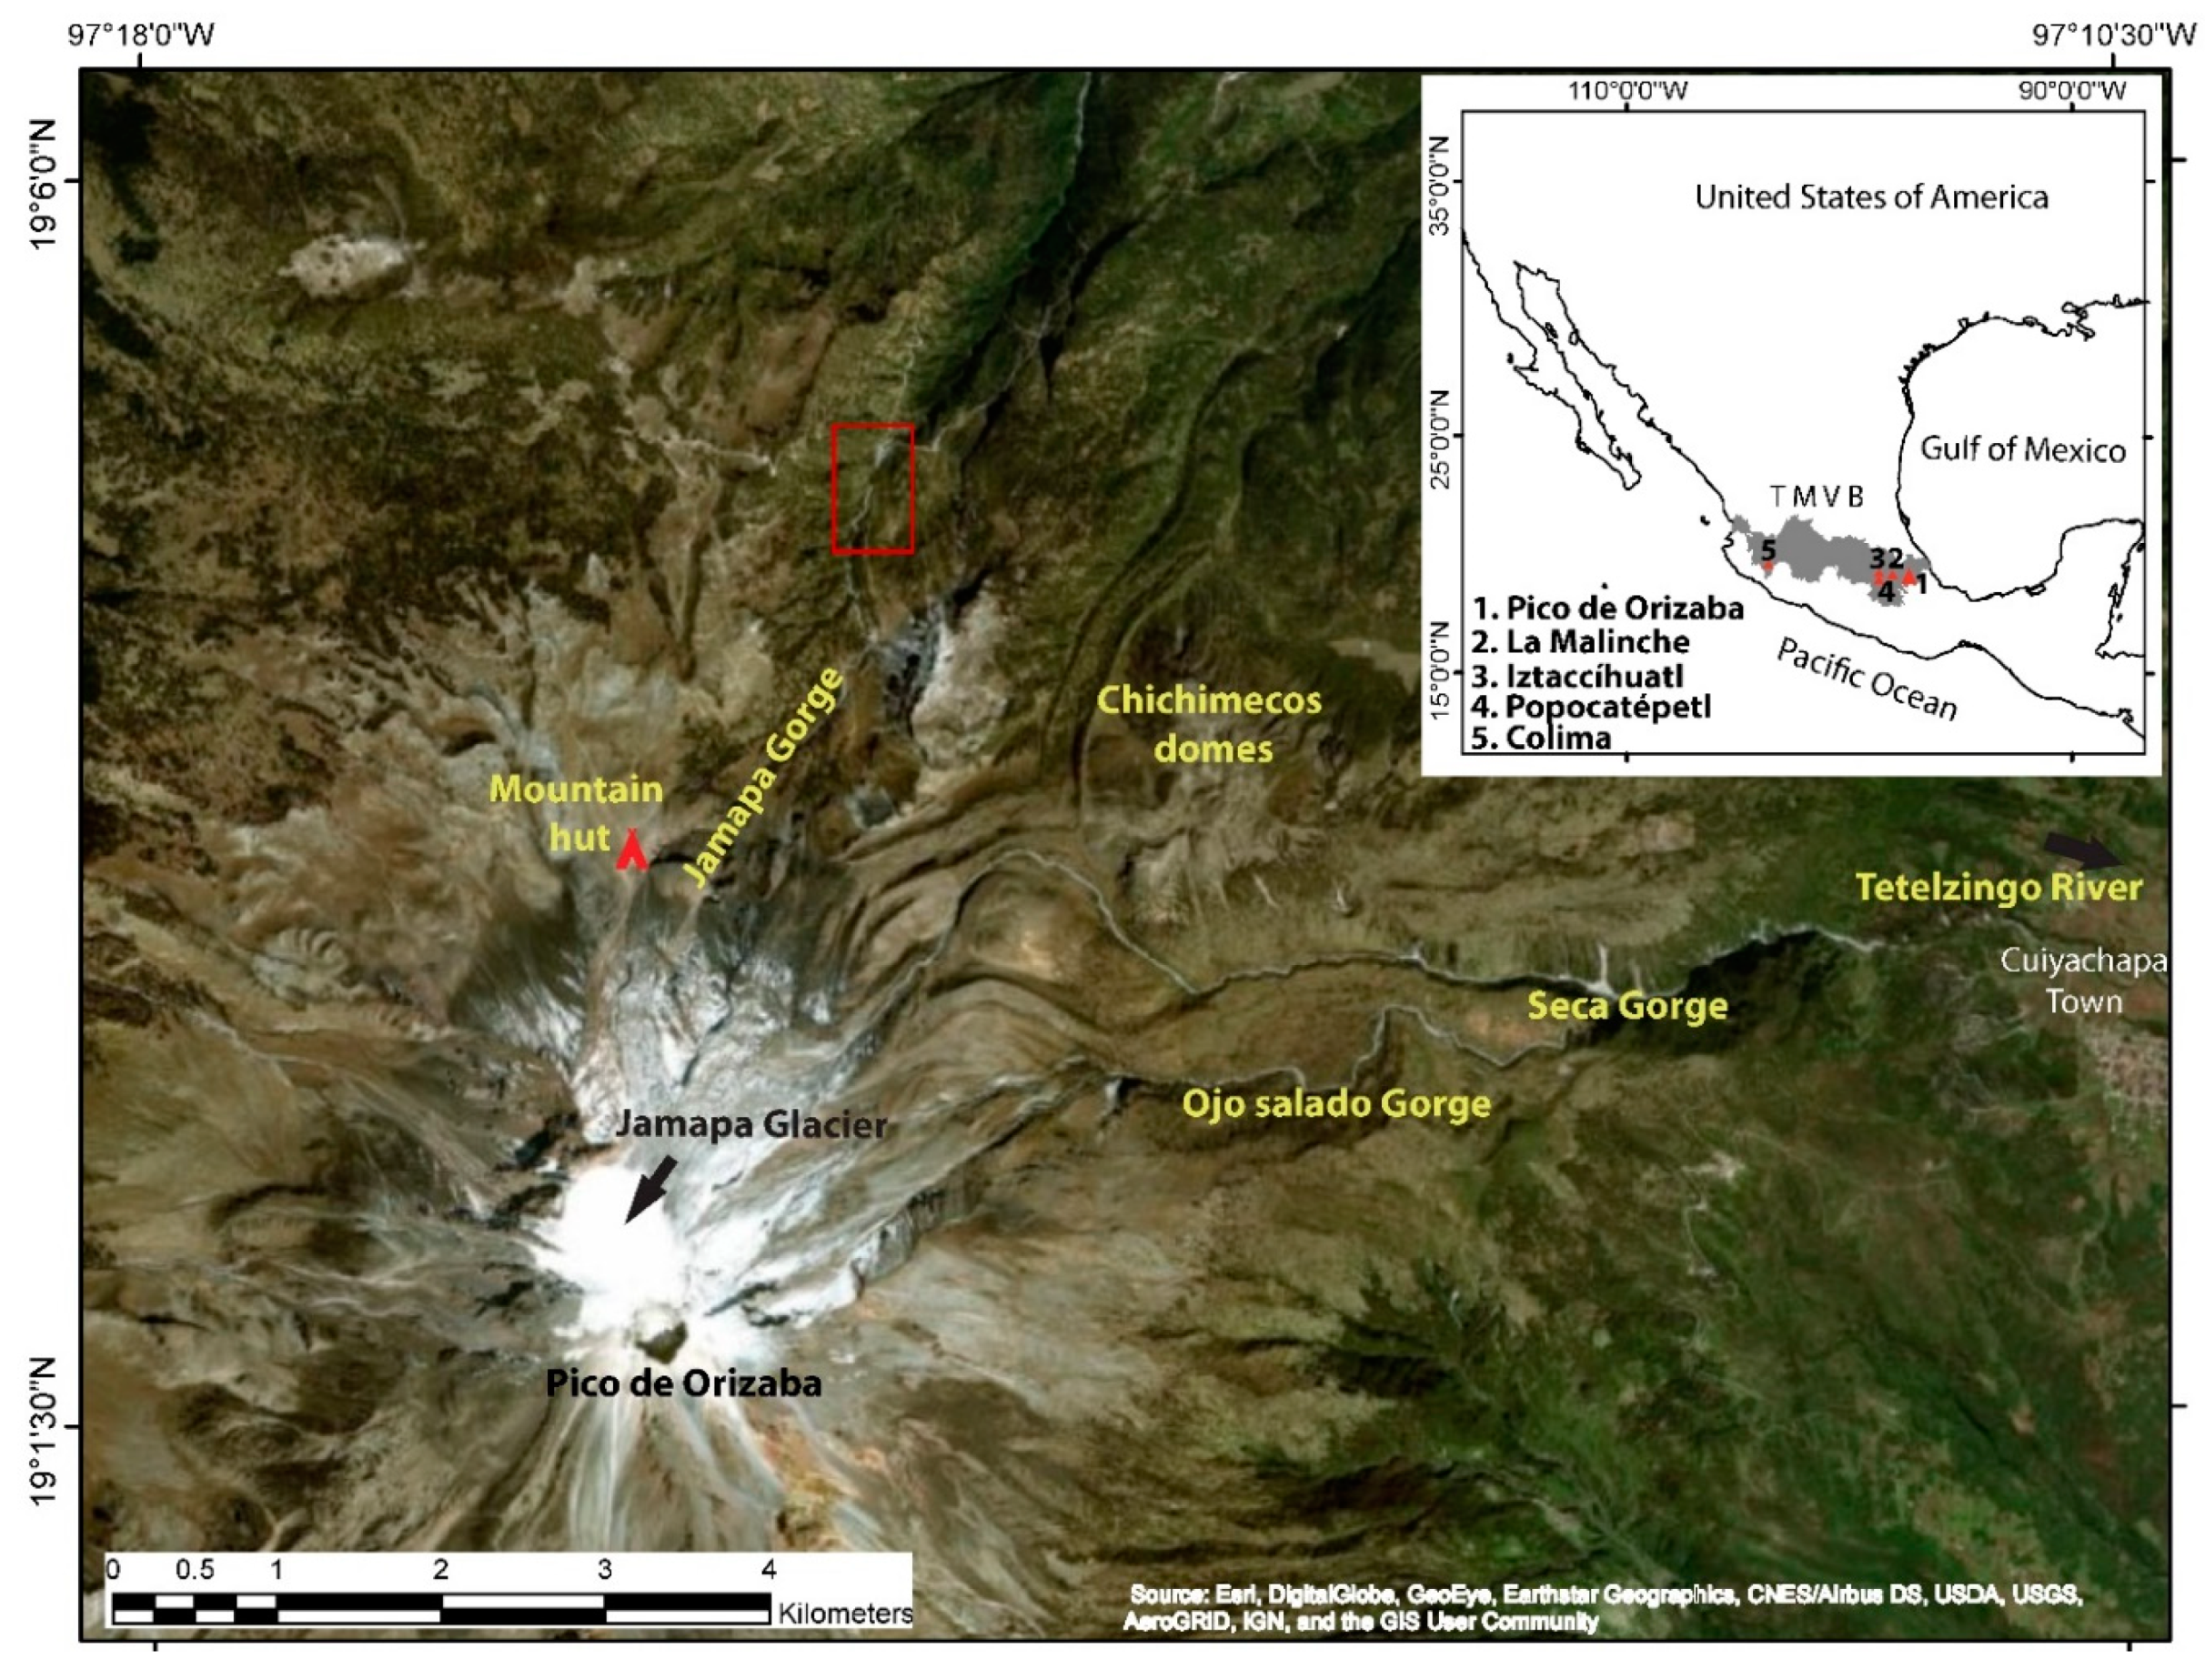
Figure 1. The Pico de Orizaba volcano is located in the eastern sector of the Trans-Mexican Volcanic Belt (TMVB). Satellite imagery illustrating the volcano as well as the gorges mentioned. The Jamapa Gorge, where this study was realized, is located on the northern slope of the volcano. The study site is indicated with a red box.
Water 12 00333 g001
Figure 2. Geomorphic characteristics of Jamapa Gorge. (A) Active channel with recent lahar deposits. (B) Lahar terraces formed by historical events. (C) Trees of Pinus hartwegii buried and impacted by blocks and sediment. (D) Recent lahar deposits burying the road at 3546 m a.s.l.
Water 12 00333 g002
Figure 3. (A) The digital terrain model shown was obtained from imagery taken with an unmanned aerial vehicle (UAV). (B) Digital terrain model (DTM) and location of trees sampled for dendrogeomorphic analysis.
Water 12 00333 g003
Figure 4. Assessment of deviations between observed paleostage indicators (PSI) and lahar depths modelled with rapid mass movement simulation (RAMMS) for the 2012 lahar: Xi represents observed values (i.e., impact scars on trees) at position i; and Yi(θj) gives the computed water depth for a given roughness θj. Deviation between both values is represented by F(θ).
Water 12 00333 g004
Figure 5. Cross section of a Pinus hartwegii stem wedge injured by the 2012 lahar event. The injury is located in late latewood, which allows dating of the event to August 2012.
Water 12 00333 g005
Figure 6. Absolute deviation (in m) of PSI as observed on the trunks of Pinus hartwegii trees in a sector of Jamapa Gorge and their relationship with (A) lahar depth, (B) flow velocity, and (C) pressures modeled for the 2012 lahar. (D) The hydrograph data correspond to the 2001 lahar in Popocatépetl volcano by Caballero and Capra [36]. The dashed black line represents the assumed shape of the hydrograph used in this study.
Water 12 00333 g006
Table 1. Sensitivity analysis of lahar modelling.
SimulationMean (m)Standard Deviation
density: 1400 kg/m3; chi: 40000.43
density: +25%0.430.72
density: −25%0.430.72
Chi: +25%0.390.72
Chi: −25%0.470.73
Table 2. Tree locations and absolute deviation (in m) between PSI as observed in trees and modelled flow heights. X-UTM and Y-UTM refer to the x and y values within the Universal Transverse Mercator coordinate system.
Tree CodeX-UTMY-UTMMaximum Scar Height (m)Deviation from Modelled Lahar Sediment (m)
0683,574.42,110,4570.10.39
1683,572.12,110,4610.1−0.04
2683,575.92,110,4970.0320.648
3683,577.42,110,4930.050.32
4683,736.72,110,8330.4−0.31
5683,578.52,110,4940.7−0.6
6683,579.32,110,4950.3−0.25
7683,797.12,110,9820.410.02
8683,803.72,110,9860.22−0.21
9683,808.92,110,9910.520.13
10683,796.32,110,9200.360.2
11683,801.82,110,9280.69−0.37
12683,798.22,110,9320.66−0.34
13683,784.72,110,9300.71.18
14683,806.22,110,9430.250.19
15683,8282,110,9510.3−0.08
16683,7352,110,8360.15−0.14
17683,655.12,110,5711.20.0
18683,662.42,110,6330.6−0.6