Article

Under-Sink Activated Carbon Water Filters Effectively Remove Lead from Private Well Water for over Six Months

by
Riley Mulhern
1,* and
Jacqueline MacDonald Gibson
2
1
Department of Environmental Science and Engineering, University of North Carolina at Chapel Hill, Chapel Hill, NC 27599, USA
2
Department of Environmental and Occupational Health, Indiana University Bloomington, Bloomington, IN 47405, USA
*
Author to whom correspondence should be addressed.
Water 2020, 12(12), 3584; https://doi.org/10.3390/w12123584
Submission received: 11 November 2020 / Revised: 10 December 2020 / Accepted: 18 December 2020 / Published: 21 December 2020
(This article belongs to the Special Issue Challenges in Supplying Safe Drinking Water in Rural Communities)

Abstract

:
Children who rely on private well water in the United States have been shown to be at greater risk of having elevated blood lead levels. Evidence-based solutions are needed to prevent drinking water lead exposure among private well users, but minimal data are available regarding the real-world effectiveness of available interventions like point-of-use water treatment for well water. In this study, under-sink activated carbon block water filters were tested for lead and other heavy metals removal in an eight-month longitudinal study in 17 homes relying on private wells. The device removed 98% of all influent lead for the entirety of the study, with all effluent lead levels less than 1 µg/L. Profile sampling in a subset of homes showed that the faucet fixture is a significant source of lead leaching where well water is corrosive. Flushing alone was not capable of reducing first-draw lead to levels below 1 µg/L, but the under-sink filter was found to increase the safety and effectiveness of faucet flushing. The results of this study can be used by individual well users and policymakers alike to improve decision-making around the use of under-sink point-of-use devices to prevent disproportionate lead exposures among private well users.

Graphical Abstract

1. Introduction

Private well users in the United States (U.S.) may be at elevated risk of exposure to lead (Pb) in drinking water than populations connected to community water systems [1]. Pb can leach from borehole and household plumbing components where groundwater is corrosive [2,3], and is known to interfere with neurological development in children, even at low levels of exposure [4,5,6]. However, due to the fact that private wells are not regulated by the Safe Drinking Water Act (SDWA), elevated Pb levels and other drinking water contaminants in private well water often go unnoticed [7,8].
In response, a body of research has called for wider implementation of protections for well users such as increased risk communication to promote well testing [8,9,10,11,12] and removing financial barriers to implement household and point-of-use (POU) water treatment for Pb [1,13]. However, even where increased well testing is achieved, knowledge gaps exist around the effectiveness of POU water treatment devices for well users since few U.S. studies have characterized the effectiveness of consumer water filter performance in household settings under real-world conditions over extended periods of time. In a systematic review of 3142 POU drinking water filtration papers, Brown et al. (2017) found only 15 studies addressing POU filter effectiveness for chemical contaminants in the U.S. or Canada, only one of which reported data on Pb in private well water [14]. This latter study, conducted by Lothrop et al. (2015), surveyed 31 households in rural Arizona obtaining their water from a variety of sources (community systems and private wells) about their use of water treatment [15]. Among the participating homes, 13 had a water treatment system of some type (water softener, reverse osmosis system, or activated carbon (AC) filter), eight of which were connected to private wells. Of the 13 homes using water treatment, nine were tested for Pb removal effectiveness, although the authors did not report which of these homes used private well water. Among these nine households, one-time sampling found that a water softener removed 71% of influent Pb; reverse osmosis systems (n = 4) removed 61–90% of influent Pb; and AC systems (n = 4) showed inconsistent performance. Pb removal in the four AC filters tested ranged from 31% to −16% (i.e., in one case, the Pb concentration was 16% higher after the filter than before in one home), but influent Pb levels for these homes were not reported. In a later study, not included in the review by Brown et al. (2017), Tomlinson et al. (2019) tested pour-through AC filters for Pb removal from well water in two households in North Carolina. In this study, 99% of first-draw Pb was removed at the time the filters were distributed, with influent Pb levels ranging 21–66 µg/L, but the filters were not tested again thereafter [16].
These studies have very limited use in understanding the in-situ performance of POU water filters for Pb removal in homes relying on private wells. First, the cross-sectional design of both studies does not allow for changes in filter performance over time to be evaluated. Lothrop et al. (2015) collected only one-time samples and had no way of evaluating the cumulative volume of water treated by each device at the time samples were taken, while Tomlinson et al. (2019) only tested the filter effectiveness at start-up. Second, these studies could not analyze the removal effectiveness with respect to other influent water quality parameters or usage patterns, which vary greatly among households, given their limited sample sizes (n = 9 and n = 2, respectively). Third, Lothrop et al. (2015) only considered the effectiveness of water treatment systems already in place and did not report whether the devices were certified for Pb removal according to standards for household water treatment products put in place by the National Sanitation Foundation (NSF) and the American National Standards Institute (ANSI). Finally, in the study by Lothrop et al. (2015), water samples were collected from household taps after a two-minute flush in contrast to the U.S. Environmental Protection Agency (USEPA) protocols for Pb sampling which require first-draw samples from taps after at least a six-hour stagnation period to represent worst-case exposure conditions [17].
As a result, these previous studies provide little actionable information for individual well users or state agency personnel charged with providing technical advice to well users. To date, the only longitudinal evaluations of POU filter effectiveness for metals in private well water in the U.S. have been tailored to arsenic removal [18,19,20]. What is more, despite rigorous certification standards put in place by NSF/ANSI, Pb reduction claims require systems to be tested using highly treated water adjusted to precise ranges for pH, alkalinity, and hardness which are not characteristic of many raw groundwaters [21]. Water treatment processes verified under precisely controlled conditions in laboratory settings or on municipally treated drinking water cannot be assumed to behave the same when applied in novel contexts, such as private wells.
Thus, there is a critical gap in current literature leaving millions of well users without evidence-based information for protecting against Pb in their water. To fill these gaps, this study provides the first longitudinal evaluation of POU water filters to remove Pb from private well water as a function of multiple in situ variables, including time in operation, volume of water treated, usage patterns, influent water quality, and Pb sources. Conducting solutions-focused research centered on improving decision-making around currently available technologies for private well users is both innovative and necessary toward improving environmental health in rural communities. The principal objective was to relate POU filter performance to household water usage, water quality characteristics, and Pb sources in a sample of real-world users to evaluate the range of performance that can be expected and inform individual well users, public health and well water professionals, and policymakers alike.

2. Materials and Methods

2.1. Recruitment of Study Participants and Baseline Pb Levels

Households served by private wells were recruited in three geographic clusters (A, B, and C) in Orange County and Robeson County, North Carolina (Figure S1). These areas were selected through the help of community partner organizations that had identified areas of suspected groundwater contamination. Participants were recruited by e-mail, flyers, word-of-mouth, and door-to-door invitations with a community partner.
An important goal of this study was to evaluate filter performance in a variety of contexts representing different influent water quality conditions, along with different water use patterns and contamination sources. Therefore, these clusters were selected to represent a diversity of water quality and demographic characteristics. Influent water quality variability is important to consider due to its influence on filter performance and longevity. Demographic differences are important because of their potential influence on water use patterns. For example, a recent study using data from the 2015 American Housing Survey found that households identifying as Black were significantly more likely to rely on bottled water for drinking, compared to other demographic groups, even if they perceived their tap water to be safe [22]. Table 1 summarizes key characteristics of each cluster.
Twenty households were initially recruited to participate. To provide households with information to help them decide whether to enroll, each was invited to collect a 250 mL first-draw sample (i.e., water collected from the faucet after a minimum six-hour stagnation time without prior flushing) as in previous studies on Pb in private well water [2,23]. For all subsequent sampling, the USEPA Lead and Copper Rule protocol requiring one liter first-draw samples in regulated community water systems was followed. Certified pre-cleaned, wide-mouth HDPE bottles were delivered to households the day before sampling, with instructions to collect the first-draw water from the kitchen tap in the morning. Samples were transported to the University of North Carolina at Chapel Hill (UNC) and transferred to 10 mL aliquots, acidified to 2% nitric acid, and stored at 4 °C before analysis. Analytical methods are discussed in Section 2.5.
The mean first-draw Pb concentration among the 20 households invited to participate was 9.3 µg/L (median = 8.2 µg/L) and ranged from 0.1 to 34.3 µg/L. Three households (15%) exceeded the USEPA’s action level of 15 µg/L and 16 households (80%) had 250 mL first-draw Pb concentrations above the American Academy of Pediatrics’ recommendation of 1 µg/L for water fountains in schools [24]. Previous testing at the kitchen tap using 250 mL first-draw samples in North Carolina (n = 14) and Virginia (n = 2144) has shown a similar prevalence of Pb occurrence, with 14–19% of wells having first-draw Pb levels above 15 µg/L and 82–93% of wells having first-draw Pb above 1 µg/L [2,23], suggesting that the first-draw Pb levels seen in this study are comparable to levels across the region.
After these baseline screening tests, 17 households opted to receive the water filter and participate in the evaluation of its effectiveness for Pb removal. Of these, two households relied on the same well. Six (35%) were built prior to 1986 (when the SDWA was amended to ban pure Pb plumbing and limit household components to <8% Pb by weight [25]), and 16 (94%) were built prior to 2014 (when the SDWA was amended to further limit plumbing components to <0.25% Pb in wetted surfaces [26]) (Table S2). Two households in cluster A had whole-house water softeners installed, but no other households had any other pre-existing household water treatment.
This study was approved by the UNC Institutional Review Board (study number 19-1015).

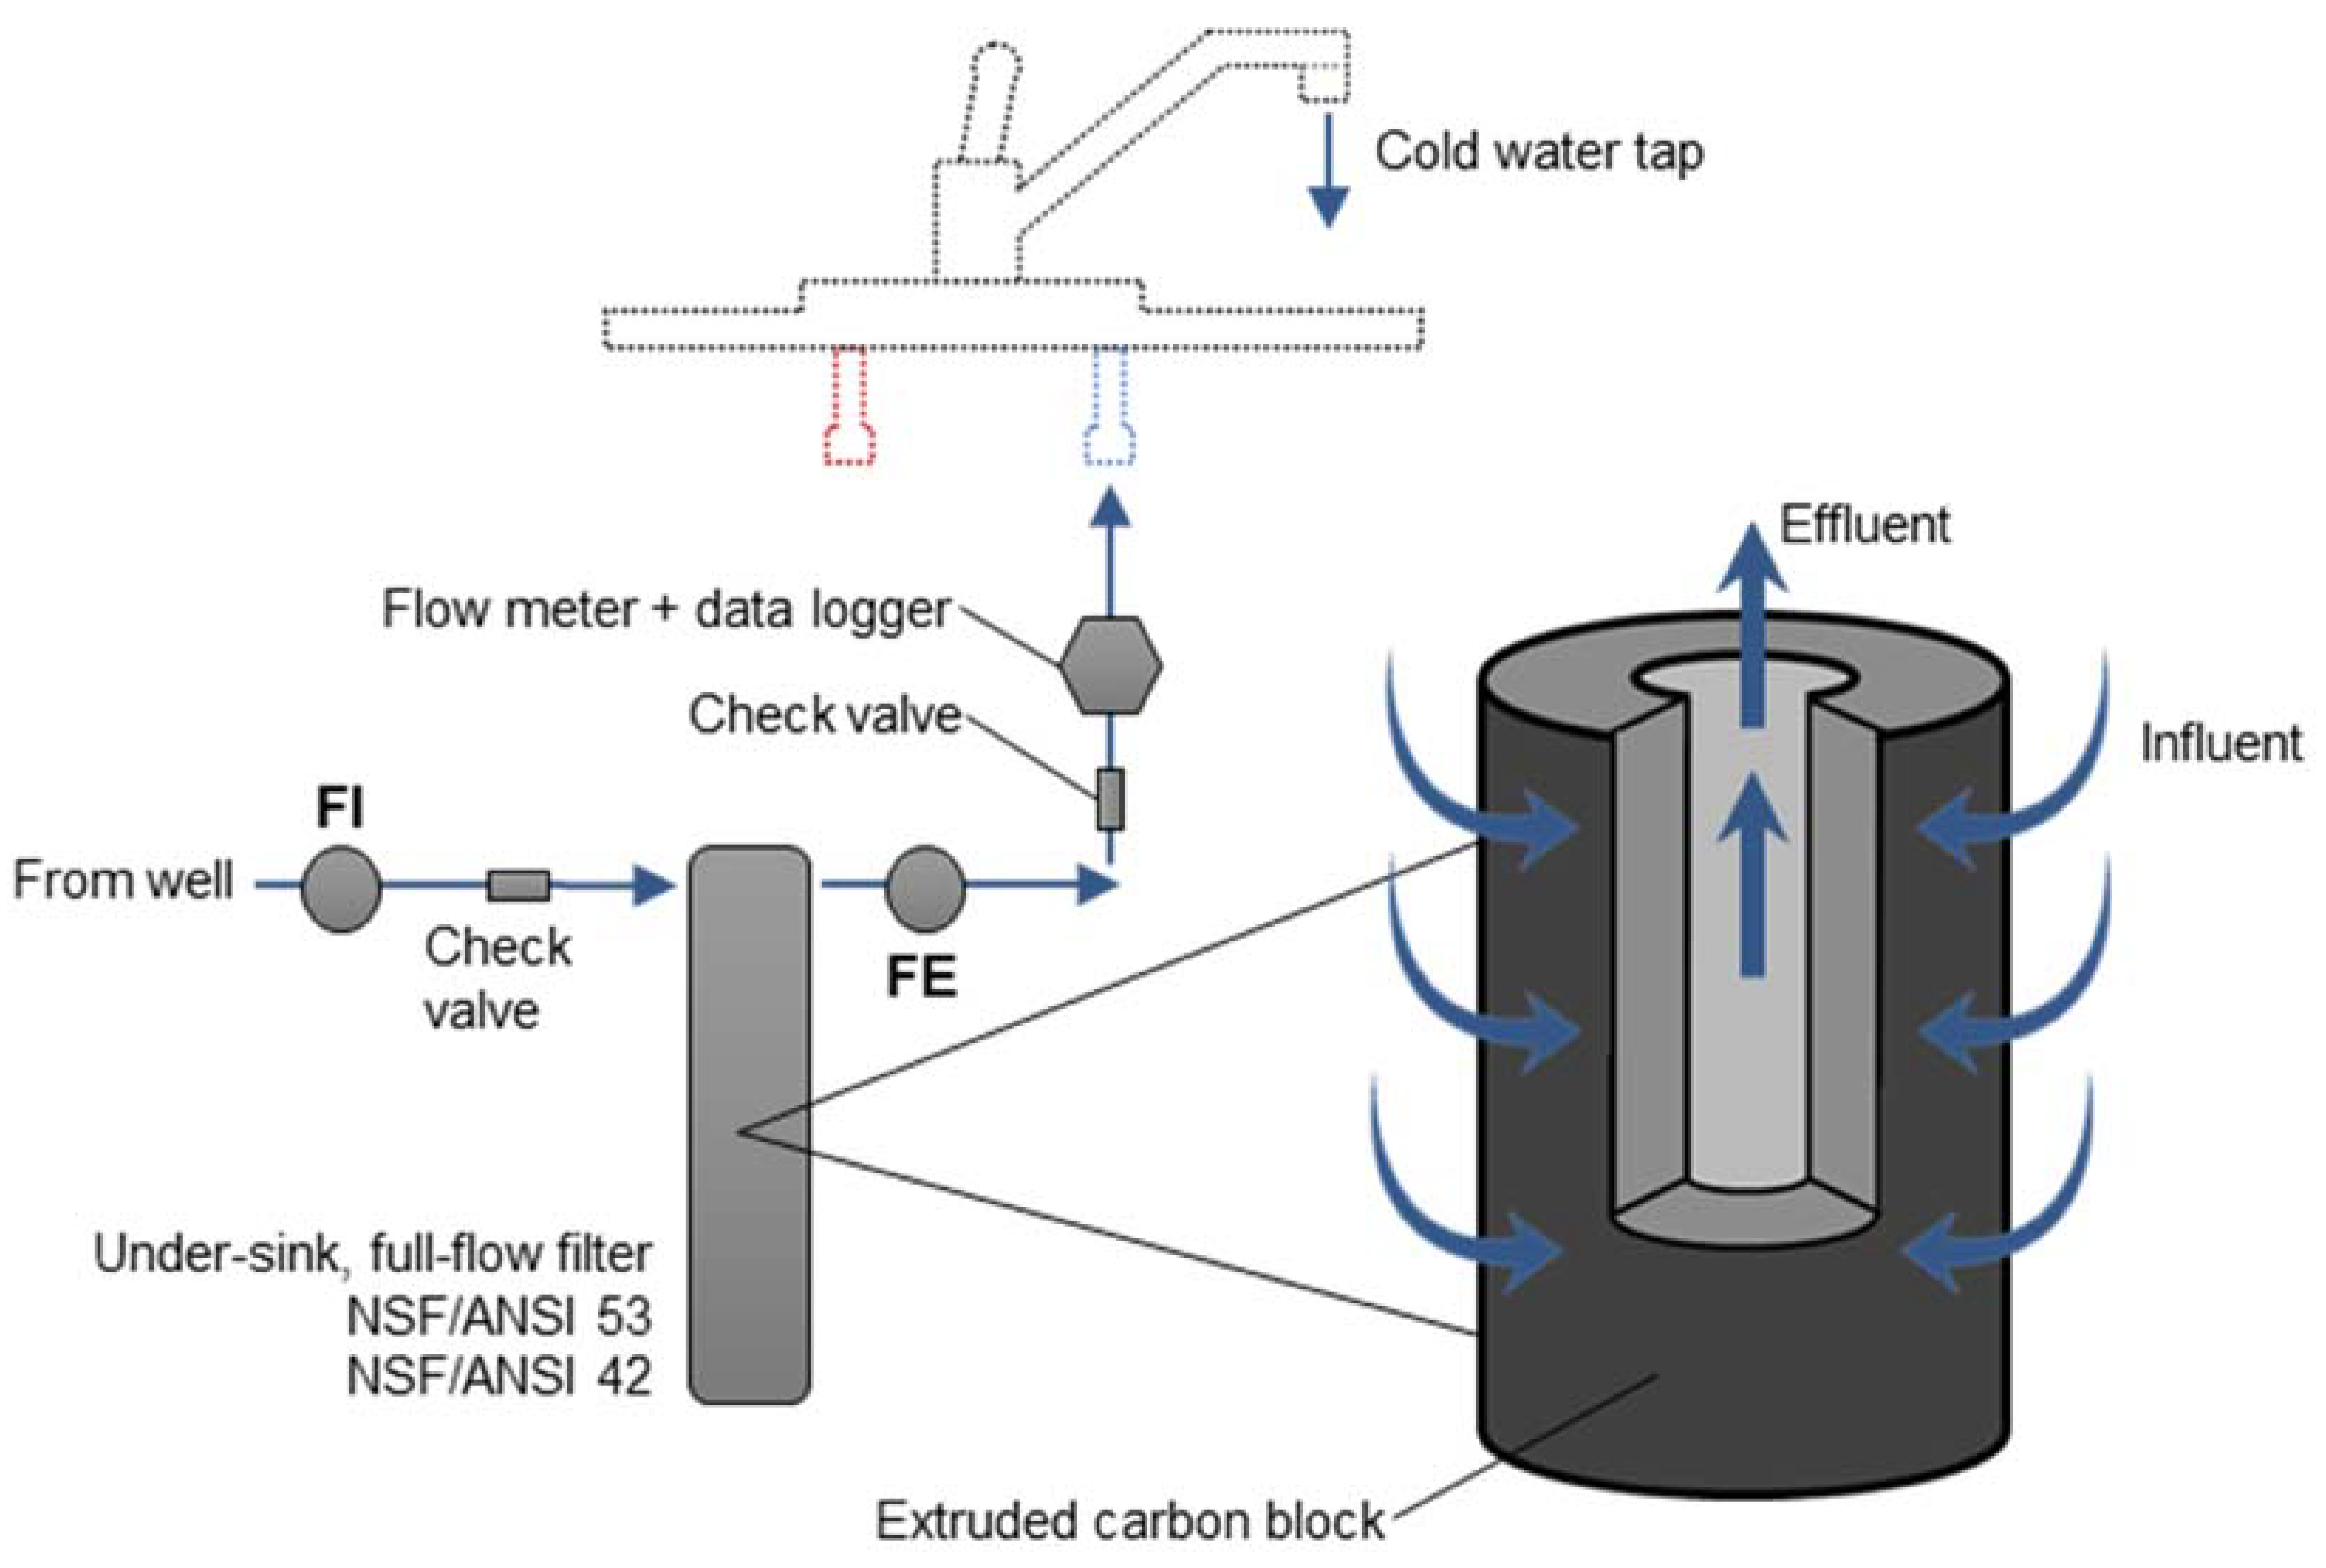
2.2. POU Intervention Design

The selection criteria for the POU device in this study included: a full-flow, under-sink design; activated carbon (AC)-based; widely available; and certified to NSF/ANSI 53 for Pb reduction, NSF/ANSI 42 for particulate reduction, and NSF P473 for per- and polyfluoroalkyl substance (PFAS) removal (methods and results for PFAS removal are forthcoming). An AC device was chosen over a reverse osmosis system since AC filters represent lower capital, operation, and maintenance costs [28], and generate significantly less waste and utilize less water compared to reverse osmosis [29]. Reverse osmosis membranes may also negatively affect the aesthetic quality of drinking water [30] and can degrade rapidly [31]. Thus, in the long-term, AC-based filters may be a more economical, user-friendly, and sustainable household treatment solution for well users addressing Pb. The selected device is distributed by national hardware stores and costs $100 initially and $70 for each replacement filter cartridge. The manufacturer-recommended lifetime of the cartridge is six months for a rated capacity of 2967 L, representing a maintenance cost of approximately $12 per month if the cartridge is replaced at the recommended interval.
Filters were installed beneath the primary kitchen sink at each participating household (Figure 1). The device treats the full flow of cold water at the main faucet with a rated flow rate of up to 5.67 L/min. The filter is comprised of a single-stage, extruded solid AC block. According to the manufacturer, the block is produced using a coconut-shell powdered AC mixed with a metals scavenger material—possibly silicon/titanium oxides, as documented elsewhere [32]—and a proprietary binding agent (2019, personal communication, 24 September). The filter does not include any prefilter fabric or membrane around the surface of the block. To evaluate the cumulative volume of water treated over time, a food-grade polypropylene flow sensor (Sea YF-S201 or Gredia GR-301) and a data logger (Onset Hobo State Logger) were installed in-line with each system. Loggers were set to record at 10 s intervals to capture detailed water usage patterns. Pb-free polypropylene sample ports were installed at the filter influent and effluent underneath the sink. All tubing used in the system was made of food-grade polyethylene.

2.3. Influent Groundwater Quality

Clusters B (n = 2 households) and C (n = 11 households) had aggressive water with average (±SD) pH levels of 5.4 (±1.1) and 4.4 (±0.3), respectively (Table 1). The average Langelier Saturation Index (LSI) and chloride-to-sulfate mass ratio (CSMR) indicated very high corrosion risk in both clusters (LSI < −0.5, CSMR > 1). These conditions are representative of many groundwaters across the southeastern U.S. [33]. Waters in cluster A (n = 4 households) had an average pH of 7.1 (±0.4) and exhibited lower corrosion risk due to greater hardness and carbonate alkalinity. Influent turbidity and dissolved organic carbon in all wells were generally low (<1 NTU and <1 mg/L, respectively). Overall, the average influent water quality in each cluster was outside the ranges required for certification of Pb removal under NSF/ANSI 53 with respect to pH, hardness, or alkalinity. Detailed influent groundwater quality for each participating household in comparison to NSF/ANSI 53 requirements can be found in Table S2.

2.4. Sampling Methods

2.4.1. Monthly Sampling
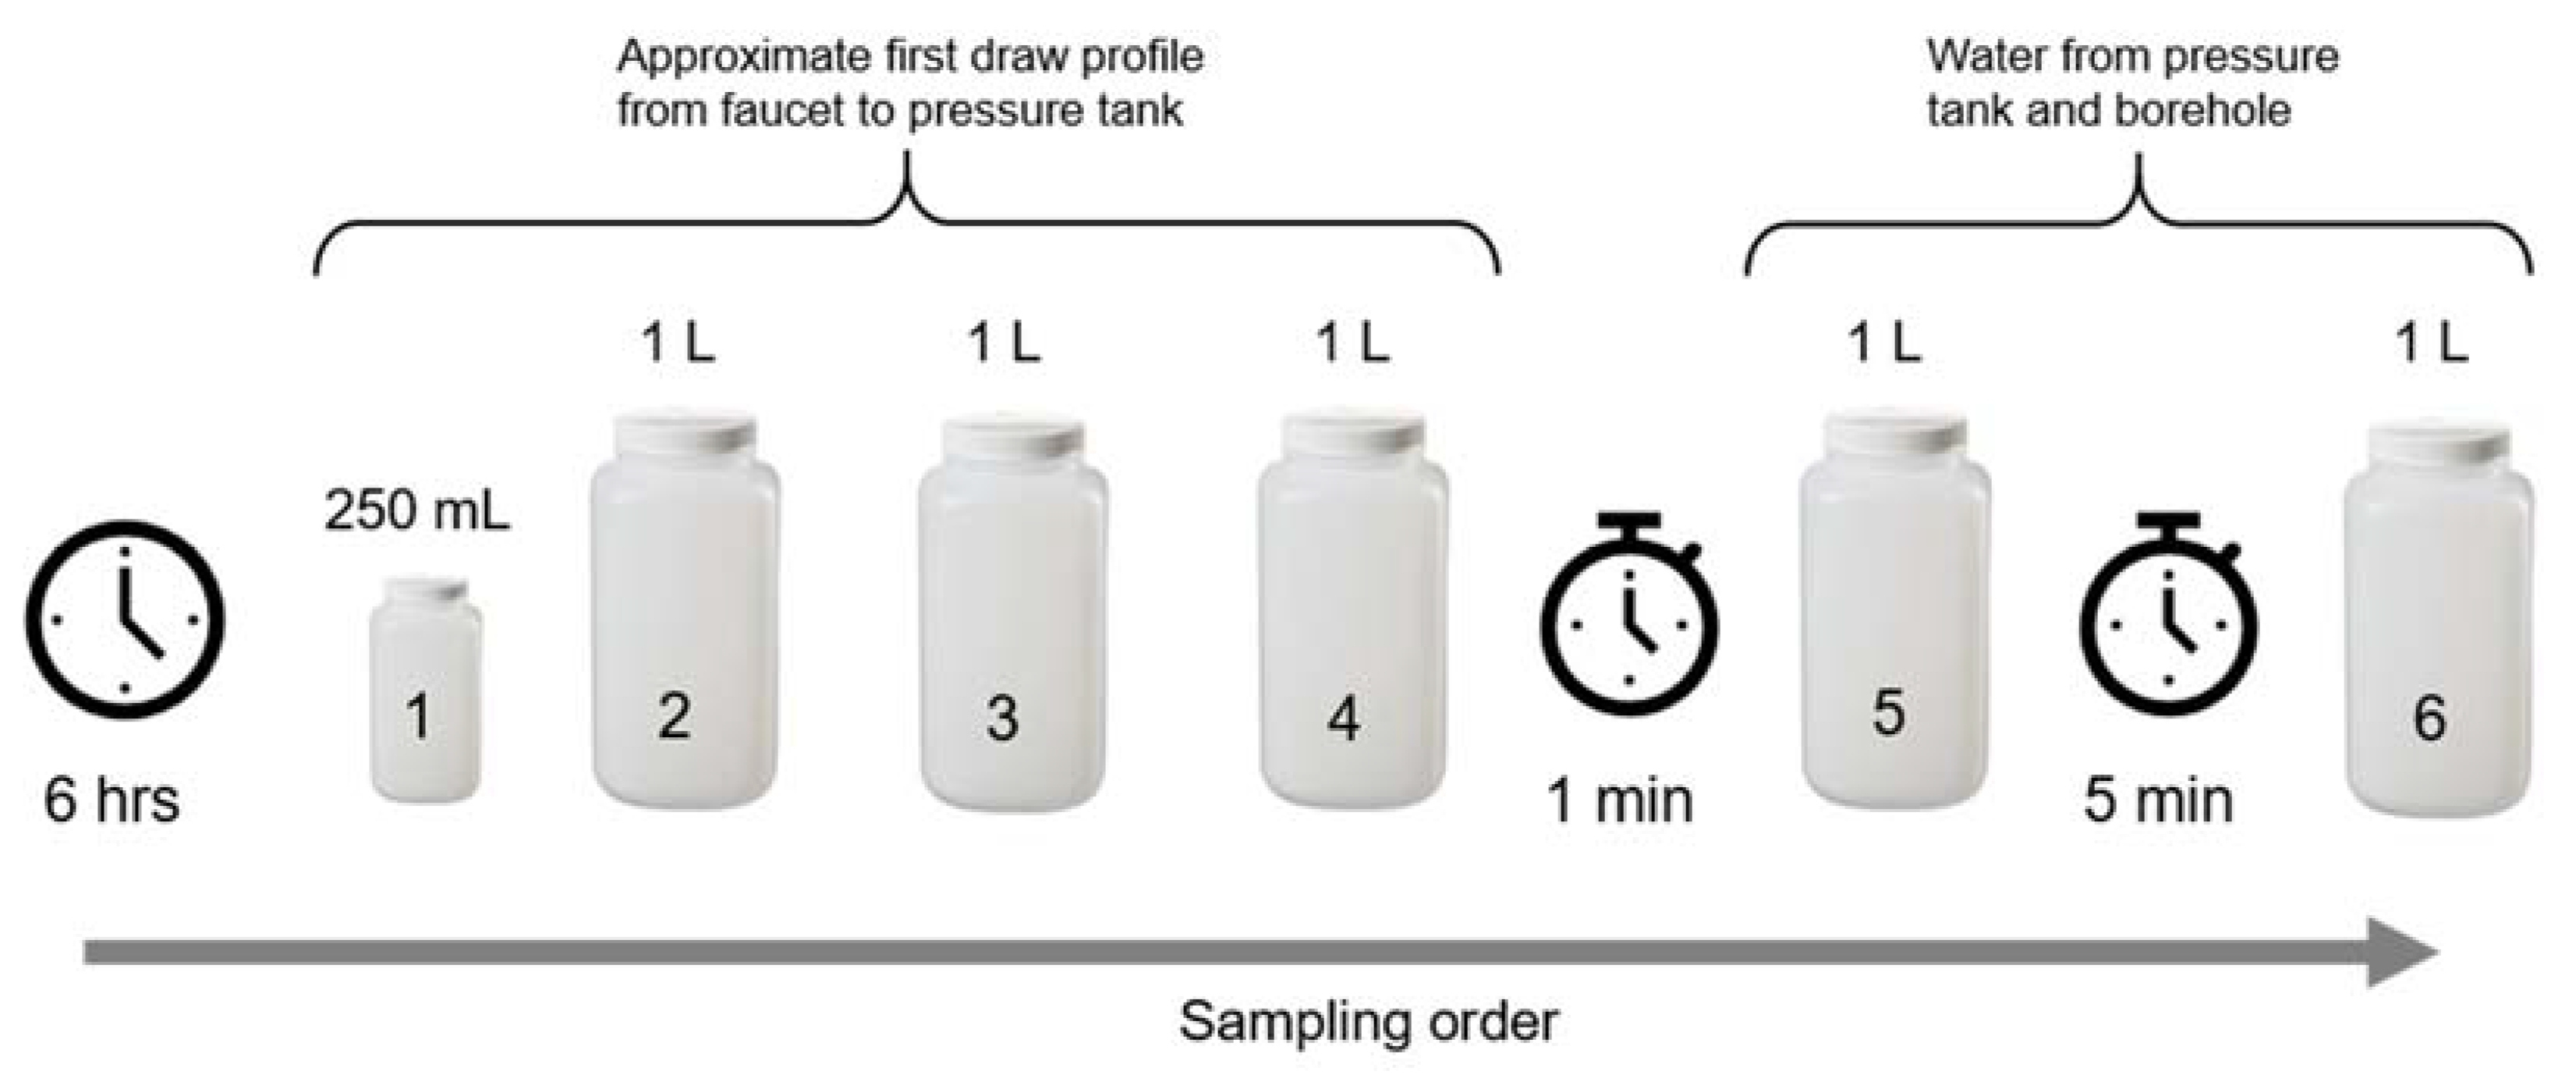
After filter installation, influent and effluent samples were collected monthly for approximately eight months from October 2019 to June 2020. Two sampling months in the middle of the study (April–May 2020) were lost due COVID-19 restrictions. Samples were collected in virgin, one-liter, acid-washed, wide-mouthed HDPE bottles. Bottles were soaked in 3 M nitric acid solution for a minimum of three days then rinsed with deionized water five times prior to sample collection.
Previous POU filter assessments for Pb have collected influent and effluent samples sequentially on the same day but have recognized the limitations of this approach for calculating removal given the non-constant nature of Pb in premise plumbing [32,34]. To account for this, study participants were trained to collect first-draw samples at labeled influent and effluent sample ports beneath their kitchen sink on two consecutive days. This protocol ensured that calculations of the filter’s removal effectiveness were based on first-draw conditions at both the influent and effluent. If study participants neglected to fill their sample bottles, random daytime samples were taken from each sample port at the time of the researcher’s visit which have been shown to adequately estimate first-draw Pb levels [35]. In these instances, the influent was sampled before the effluent. Sample bottles were collected from participating households each month and transported on ice to UNC where they were transferred into 10 mL aliquots and acidified to 2% nitric acid (Plasma Pure®, SPC Science, Montreal, QC, Canada). Acidified samples were stored at 4 °C before analysis.
Additional samples were also collected from the influent and the effluent at the time of each visit to evaluate changes in microbial water quality across the filters as AC filters have been shown to increase heterotrophic bacterial counts in the filter effluent [36,37]. Complete microbial methods and results will be reported in a forthcoming manuscript.

2.4.2. Pb Profiling

Five households were selected for sequential sampling from the main faucet before and after the filter was installed to profile the occurrence of Pb within the household plumbing. A standardized sampling protocol was adapted from Pieper et al. (2015) that could be easily implemented by study participants [23]. The protocol (Figure 2) entailed a 250 mL first-draw sample, immediately followed by three consecutive one-liter samples without any flushing in between. The faucet was then flushed for one minute and five minutes at full flow with the fifth and sixth one-liter samples filled after each flushing interval. Pieper et al. (2015) have shown that, in households connected to private wells, the volume between the kitchen faucet and pressure tank is typically≤ 3 L [23]. Thus, samples 1–4 in the sequence approximate the profile of water between the faucet and the pressure tank, while samples 5 and 6 represent water from the pressure tank and borehole components. This simplified protocol was used as a rapid screening tool that allowed for (a) detection of general sources of Pb (e.g., from the faucet and sink fittings alone or from elsewhere in the system), and (b) evaluation of the effectiveness of faucet flushing with and without the filter in place. All sample bottles were either certified pre-cleaned or acid washed, as above. Additional 10 mL aliquots were drawn from a subset of samples and passed through a 0.45 µm nylon syringe filter (GE Whatman GD/XP) on the same day. Both the filtered and unfiltered 10 mL aliquots were then acidified as above and stored at 4 °C before analysis. The filtered samples characterized dissolved Pb, while the difference between filtered and unfiltered samples was calculated to estimate particulate Pb [23].

2.5. Analytical Methods

Samples were analyzed by inductively coupled plasma mass spectrometry (ICP-MS) adapted from USEPA Method 6020B [38] on an Agilent 7500cx instrument. Acidified samples were centrifuged at 5000 RPM for 8–10 min before analysis to separate any suspended solids in solution. In addition to Pb, samples were analyzed for other metals and corrosion byproducts including aluminum (Al), manganese (Mn), iron (Fe), copper (Cu), nickel (Ni), zinc (Zn), arsenic (As), cadmium (Cd), tin (Sn), and uranium (U). A combined 10-point calibration curve was prepared for all elements before each sample run. The full ICP-MS instrument configuration and operation conditions used have been described previously [16]. Per USEPA guidelines, the limit of quantitation (LOQ) was determined as 10 times the standard deviation of the replicate blanks, or 0.015 µg/L for Pb, and non-detect results were assigned a value of one-half the LOQ [39].
Quality control measures for metals quantification included laboratory blanks; field blanks; replicate analyses performed every 10 samples; and verification of instrument performance using a National Institute of Standards and Technology certified reference material (CRM) for trace metals in drinking water (High Purity Standards, Charleston, SC, USA). Sn is not included in the CRM and was spiked in at known concentrations. The mean recovery for all metals in the CRM, including Sn, was 102%. The relative standard deviation of all repeat measurements was ≤10% and the average difference of all sample replicates was 7.6%.
Field measurements of temperature, pH, and electrical conductivity were taken using a handheld probe (HI98129, Hanna Instruments, Smithfield, RI, USA) calibrated with a two-point calibration in the field each day before use.

2.6. Data Analysis

Paired influent and effluent samples were evaluated for statistically significant reductions of each metal at each sample month using non-parametric Wilcoxon signed rank tests for non-normally distributed samples. The appropriateness of the Wilcoxon method was evaluated by the Shapiro–Wilk test. Reported p-values for filter performance represent the results of two-sided paired Wilcoxon tests unless otherwise noted.
Additionally, the American Academy of Pediatrics’ recommendation of 1 µg/L of Pb in drinking water was used to evaluate the filters’ protectiveness as a conservative health-based goal [24]. Although the USEPA Lead and Copper Rule action level of 15 µg/L is an established regulatory threshold, the action level is designed to be used as a utility-scale indicator of the effectiveness of corrosion control in drinking water distribution systems rather than as a measure of individual health risk [40]. Indeed, the action level has been shown to be an unsafe level in drinking water for the most vulnerable population groups and the USEPA has set a maximum contaminant level goal of no Pb in drinking water [41]. Furthermore, households connected to private wells are not included under the Lead and Copper Rule or SDWA stipulations. Thus, we considered the American Academy of Pediatrics’ recommendation to be a more appropriate threshold for evaluating health risk of Pb in drinking water, especially for children.

3. Results and Discussion

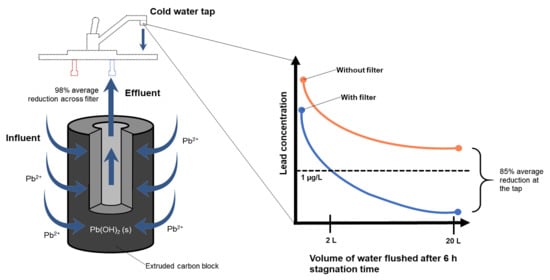
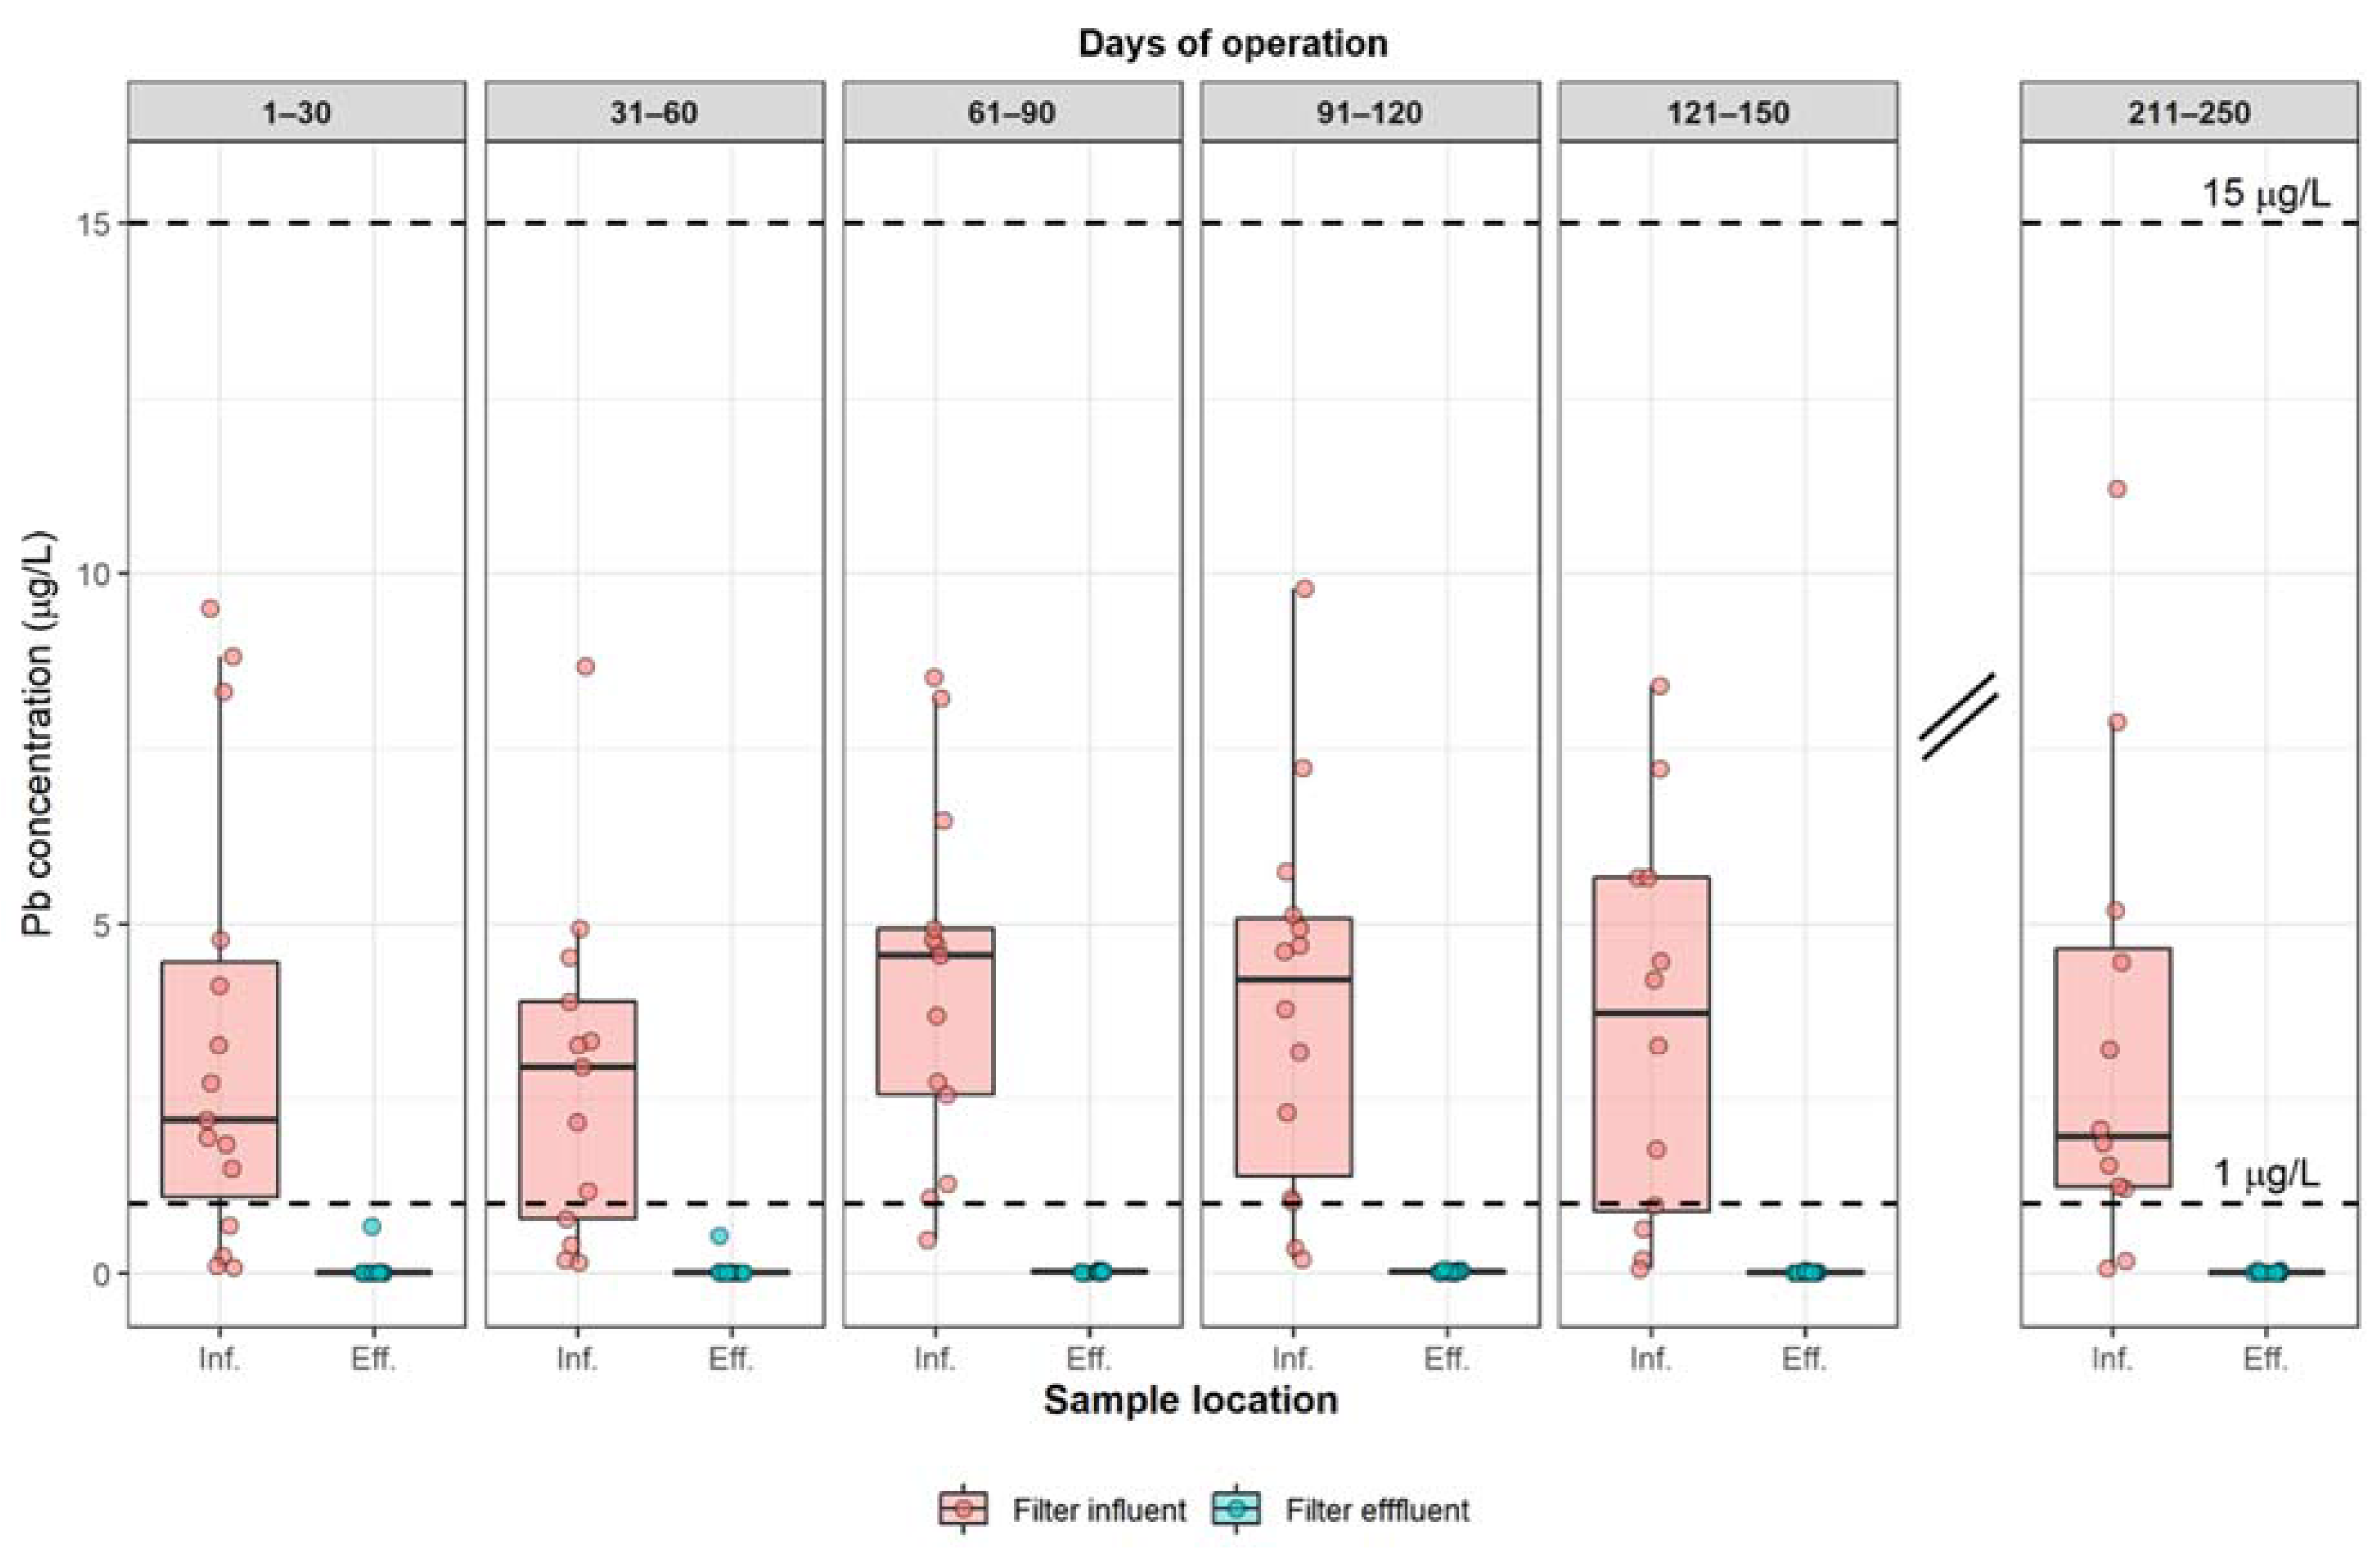
3.1. Long-Term Filter Effectiveness for Pb Removal

Filters decreased the influent Pb to below the American Academy of Pediatrics’ recommendation of 1 µg/L in all 17 households for the entire duration of use (Figure 3). In three households (18%), filters had to be removed within 2–3 months due to clogging (see Section 3.2), but the filters remained operational in the remaining 14 houses for the full eight-month study duration. Paired influent–effluent samples exhibited a highly statistically significant reduction in Pb across all sample points (p < 0.0001; Figure 4). Excluding 10% of paired samples where participant sampling error was suspected, the mean removal among all samples and all households was 98%. Importantly, Pb removal was consistent across all households and geographic clusters, indicating that the filter’s Pb removal effectiveness was independent of both the influent groundwater quality and the variations in water usage patterns observed in this study.
This study is unique in that no other longitudinal assessment of POU filters for Pb removal from private well water is currently available. As discussed above, other studies have evaluated POU effectiveness for Pb removal from private well water through limited cross-sectional sampling. In two households in North Carolina, Tomlinson et al. (2019) showed that pour-through AC filters removed 99% of first-draw Pb at the time the filters were distributed, with influent Pb levels ranging 21–66 µg/L [16]. Pour-through devices are low-cost and easily implementable, but Deshommes et al. (2010) have observed that these devices exhibit worse performance over time than under-sink and faucet-mounted devices likely due to short-circuiting through loose granular media and poor removal of particulate Pb, putting into question the long-term protectiveness of pour-through devices for well users [42]. In a survey of four homes using various faucet-mounted or under-sink AC devices relying on both community water systems and private wells in rural Arizona, Lothrop et al. (2015) found that Pb removal ranged from −16% to 37%, although the authors did not report clearly which samples were from private wells [15]. The difference between the results of Lothrop et al. (2015) and those shown here may be related to the certification of each device and/or the length of time it had been in use and indicate that deteriorating performance and possible desorption of previously retained Pb may occur in certain AC devices over time.
Although not from private well water, several studies of POU devices installed in situ with municipal tap water provide useful comparisons. Most recently, 97% of effluent samples from 345 faucet-mounted filters installed in Flint, Michigan during the water crisis were below 0.5 µg/L [34], compared to 95% of effluent samples below 0.5 µg/L in this study. Additionally, Deshommes et al. (2012) tested the effectiveness of five under-sink NSF/ANSI 53-certified AC devices for Pb removal in a large building connected to a municipal water supply and found effective removal over one year, with median influent Pb levels of 111 µg/L reduced to a maximum of 2.2 µg/L [32]. Similarly, Boyd et al. (2005) demonstrated that 17 under-sink filters installed at drinking water fountains in schools also reduced influent Pb levels ranging 1–93 µg/L to <1 µg/L during accelerated testing over the course of one month, although 3 of the 17 filters clogged prematurely [43]. In general, these studies support the results shown here and indicate that under-sink AC filters deployed for private well water can achieve comparable Pb removal as municipal tap water, although pre-treatment may be necessary to prevent clogging in both scenarios.

3.2. Filter Failure Due to Clogging

The rate of premature failure due to clogging observed by Boyd et al. (2005) was the same as what was observed in this study (approximately 18%) [43]. In both studies, Pb was still effectively removed even at terminal flow conditions. Boyd et al. identified the main cause of clogging as high Fe concentrations (up to 28 mg/L) in the influent from corrosion of galvanized steel pipes in some schools. Clogging occurred after treating only 30–40% of the filters’ rated capacity. High Fe was also the most likely cause of clogging in one household in this study (#21) where influent concentrations exceeded 4.5 mg/L. Influent Fe concentrations in the other two clogged filters were low (<0.1 mg/L). In one of these households (#16), clogging appeared to be due to extremely low use during the first month after installation, possibly allowing rapid biofouling of the carbon (results on microbial growth with the filters are forthcoming), while the cause in the third household (#17) was not apparent. Given that all filters operated normally at start-up, clogging was presumed not to be the result of a faulty device. Clogging occurred after 2–3 months of use, representing 150–1335 L of water treated (5–45% of the rated capacity). All other filters remained usable for the duration of the study although the maximum daily flow rate was generally low (2.2 L/min on average, SD = 0.83; Figure S2). A sediment pre-filter to remove high influent Fe and/or intermittent turbidity from private well water may be necessary to reduce clogging and extend the filter’s life.

3.3. Removal of Other Metals

The filters also achieved highly statistically significant reductions (p < 0.0001) in the median effluent concentrations of Al, As, Cd, Cu, Fe, Sn, U, and Zn over the study duration (Figure 4, Table S3). Significant reduction of Ni (p < 0.01) was also observed, but median Ni effluent concentrations began to approach and even exceed the influent concentrations after four months of use, indicating that more highly adsorbing metals may displace previously adsorbed Ni (Figure S3). This phenomenon has previously been observed for Ni [42] as well as Cd and Zn in lab-tested AC systems [44]. Mn was significantly reduced in the first month of testing (p < 0.001), but quickly achieved breakthrough in subsequent months and was the only metal without a significant reduction in the median concentration when data were aggregated across all months.

3.4. Contribution of the Faucet to First-Draw Pb

The Pb levels in the filter influent (i.e., collected from sample ports beneath the kitchen sink; Figure 1) were significantly lower than the baseline first-draw Pb concentrations in samples collected from the faucet fixture itself during participant recruitment (p < 0.005; Figure 5, Table S4). Without the filter, the Pb concentration in the baseline 250 mL first-draw sample averaged 9.0 µg/L (SD = 10.1, maximum = 34.3 µg/L). In comparison, samples from the filter influent (indicating water quality before interaction with the tap) averaged 3.3 µg/L (SD = 2.4, maximum = 8.4 µg/L). This difference implicates the faucet fixtures as an important Pb source, as documented elsewhere [3,23]. The faucets in all but one home (#13) were installed prior to more stringent Pb-composition standards were put in place in 2014 [26], but even the faucet installed after 2014 had 77% more Pb in the sample taken from the faucet than the average filter influent. Indeed, the NSF/ANSI standard that evaluates Pb-leaching from plumbing components does not require testing under highly corrosive conditions and, thus, “Pb-free” components may still leach significant Pb under conditions commonly seen in private wells [45,46]. Cd, Cu, and Zn were also found in higher concentrations in the first 250 mL of the profiles compared to the flushed water, indicating clear corrosion of the faucet components consistent with prior studies (Figure S4) [47]. In one household (#2), the 250 mL first-draw Cd concentration at the faucet without the filter was consistently three to four times the USEPA Maximum Contaminant Level Goal of 5 µg/L (16.4 µg/L during profile sampling and 22.1 µg/L during baseline sampling). All other first-draw Cd concentrations were below 1 µg/L. In addition, Spearman’s correlation coefficients showed that Pb was strongly correlated with Al (β = 0.59, p < 0.05), Cd (β = 0.74, p < 0.001), and Zn (β = 0.64, p < 0.01), but not with Cu (β = 0.24, p = 0.22) in the baseline first-draw samples, suggesting that impurities in die-cast zinc–aluminum alloy (a material known as Zamak typically used in low-cost and internationally manufactured faucets) rather than brass faucet components may be a contributor of Pb and Cd in some homes [48,49,50].

3.5. Pb Profiling Results

Profile sampling was conducted in five of the highest-risk homes in clusters B and C before the filter was installed and again after three months of use (Figure 6). In one home (#17 in Figure 6), the filter clogged after just three months of use before the second round of profiling could be completed.

3.5.1. Flushing Effectiveness without Filter

Without the filter installed, the Pb concentration decreased with flushing but remained above the American Academy of Pediatrics’ recommendation of 1 µg/L even after approximately eight minutes and 15–20 L of flushing (Figure 6, pink profiles). In two homes (#19 and #17), Pb initially decreased with flushing, then increased again. Over 98% of the Pb in these spikes was in dissolved form, indicating leaching from solder, brass, or galvanized steel pipe [2,51] rather than scouring of particulate Pb-bearing scale as the source. Thus, these households represent a different type of Pb release than previously characterized by private well water profile sampling, where semi-random increases in Pb concentrations in the profile were predominantly in the particulate form [23]. Otherwise, this finding confirms what has been shown elsewhere that flushing can reduce Pb levels at the tap, but not ensure that the water is consistently safe for consumption [52,53].

3.5.2. Improved Flushing Effectiveness with Under-Sink Filters

With the filter installed, the Pb profiles showed rapid and consistent decreases in the Pb concentration. In three households, the Pb concentration decreased to less than 1 µg/L within two liters of flushing (generally one minute or less). In household #14, the rate of decrease was lower, possibly indicating greater leaching from the faucet components. In general, the post-filter profiles demonstrate that the filter effectively decreased Pb levels at the tap, but that water can still be contaminated by the fixture after treatment. This vulnerability of under-sink filters has also been observed in buildings connected to municipal waters [32,54,55].
Even so, the filter also decreased the amount of Pb in the first-draw water. On average, the concentration of Pb in the 250 mL first-draw sample was 64% lower with the filter installed, presumably as a result of dilution with filtered water and increased pH in the filter effluent (see Section 3.6.2). Furthermore, the filter improved the effectiveness of flushing itself. On average, flushing 2.25 L (approximately one minute) reduced Pb levels at the tap by 93% with the filter compared to a reduction of only 76% without the filter, indicating a 22% increase in the effectiveness of flushing. The Pb concentration in the approximate one-minute flush water was also reduced by 85% on average when the filter was installed (mean Pb without a filter = 5.5 µg/L; mean Pb with the filter = 0.6 µg/L). On a mass basis, the total Pb mass in profiles without the filter was approximately 49.1–155 µg compared to 2.1–23.9 µg with the filters, representing a mass reduction of 66–98% (85% on average) in the first 17–23 L of flushed water after a 6-h stagnation time. Thus, even with additional risks due to the faucet, the use of an under-sink filter reduces the total amount of Pb at the tap by (a) mitigating Pb release from distant plumbing sources, ensuring that users are not inadvertently exposed to higher concentrations of Pb in the flushed water [53], and (b) improving the effectiveness of flushing by requiring less flushing time to reach Pb levels below 1 µg/L. Installing a filter in conjunction with flushing the faucet for one minute after long periods of non-use will thus ensure the greatest Pb exposure reduction.

3.6. Factors Influencing Filter Performance

3.6.1. Water Usage Patterns and Surface Loading

The observed long-term effectiveness of the filters for Pb removal may be attributable in part to relatively low water usage and Pb loading at the kitchen tap. Usage patterns collected from the data loggers revealed that, on average, each filter was in use for only 1–20 min per day, indicating that water was not flowing for over 23 h per day. Rather than increased stagnation time leading to Pb breakthrough as previously hypothesized [42], long periods of non-use may increase the time allowed for intraparticle diffusion of the sorbate and thus improve removal as dissolved Pb ions penetrate further into the micropores of the carbon structure [56]. Indeed, a follow-up to a lab-based assessment of under-sink AC filters for Pb [42] found that, when deployed under real-world conditions, the effectiveness of the same device improved slightly to what was observed during non-stop flow testing under laboratory conditions [32]. Although NSF/ANSI 53 does require off periods, filters are operated on a continuous cycle for 16 h per day followed by an eight-hour rest so are unlikely to capture the effect of extended stagnation time during certification testing.
Consistent with the low water use time observed, the cumulative volume of water treated by each filter in the first six months of the study (excluding the three filters that clogged after 2–3 months, see Section 3.2) ranged from 151–3481 L (representing approximately 160–3700 bed volumes, or 5–117% of the filter’s rated capacity), with an average water usage of 1063 (±799) liters (Figure S5). Only one household exceeded the filter’s capacity of 2967 L after six months. The reasons for this wide variation in usage patterns are not known but could include factors such as family size, presence of pets, household water pressure, and myriad behavioral factors related to cooking, cleaning, drinking water, and perceptions of water quality [22]. For example, several households had a prior aversion to their well water and continued to supplement their water supply with bottled water throughout the study. In addition, some participants reported adapting to intentionally use their hot water supply for cleaning and washing more often to prolong the filter’s life.
The observed Pb surface loading, i.e., the mass of Pb adsorbed per mass of carbon, was also low compared to the certification requirements. NSF/ANSI 53 certification requires filters to be challenged with a constant influent of 150 µg/L [21]. Considering the rated capacity of 2967 L, the total loading during certification thus exceeds 445 mg of Pb. Manufacturers can claim only 50% of the successfully tested capacity of a filter if a performance indication device is not included (as is the case with the filter tested here), so the actual capacity is potentially even greater. The mass of carbon can be estimated using the volume of the block (950 cm3) and the bulk density of coconut shell AC (~0.5 g/cm3 [57]), yielding a mass of approximately 475 g of carbon. Thus, during certification, the Pb loading on the filter was approximately 0.93 mg Pb/g carbon.
By comparison, the overall surface loading in practice was estimated by multiplying the average influent Pb concentration by the total volume of water treated for each household. First, the average influent Pb among the participating households was 0.13–8.37 µg/L (Table S4). Thus, at the influent concentrations and rates of water usage observed, the estimated Pb loading of the filters was 0.76–9.51 mg during the first six months of use, or approximately 0.002–0.02 mg Pb/g carbon, representing only 0.2–2.1% of the filter’s certified Pb load. This finding demonstrates that the manufacturer’s stated capacity of 2967 L is likely to be protective for most homes based on the influent concentrations and the rate of water usage observed in practice. Barring extreme scenarios of Pb release, such as after disruptions to the system or in the presence of pure Pb components [42], under-sink filters, which treat water that does not interact with the faucet, may only be consistently challenged by relatively low Pb levels in homes served by private wells, even in high-risk households like those in clusters B and C. Further research is required to understand how Pb loading may vary among other private well users as well as municipal water users.

3.6.2. Influent Groundwater pH

Bench-scale column testing has shown that pH levels below 6 dramatically reduce the effectiveness of AC for Pb adsorption because, at low pH, carbon adsorption sites are more likely to be positively charged, thus repelling positively charged Pb ions in solution [44,56]. As a result, research suggests that POU AC devices should only be used for Pb control within a pH range of 5.5–10 [56]. However, in cluster C, where pH levels were consistently below 5, with a minimum recorded pH of 3.9 (Table S2), 98.5% of influent Pb was still removed throughout the study. This may be due, in part, to the low surface loading of the filters discussed above, suggesting that even under suboptimal groundwater conditions the carbon use rate is such that significant breakthrough is not observed during the recommended cartridge lifetime.
Additionally, in the previous experiments [44], the AC studied was acid-washed before testing to remove hydroxyl groups on the carbon surface and thereby minimize Pb precipitation. However, Pb precipitation—either on the carbon surface or in the carbon pore liquid—is one of the dominant removal mechanisms in AC systems [58,59]. Rinsing the carbon with a base solution after acid washing also significantly improves Pb removal, highlighting the importance of hydroxyl functional groups on the carbon’s surface toward Pb precipitation [60,61]. Although the specific activation process and pre-treatment of the AC in the filter tested in this study is not known, the pH increased significantly in the effluent samples, with a greater increase at early time points (median influent pH at start-up of 5.23 compared to a median effluent pH at start-up of 9.13, p < 0.0005) and a gradual equilibration between the influent and the effluent by the end of the study (median influent pH at study end of 4.67 compared to a median effluent pH at study end of 4.73, p = 0.86; Figure S6), suggesting that hydroxyl groups on the carbon surface are gradually exhausted [62]. Furthermore, Pb is highly soluble in acidic, low-alkalinity waters [63] like those in cluster C. Characterization of particulate and dissolved Pb levels during profile sampling in a subset of homes in cluster C confirmed that 98% of influent Pb was in the dissolved form. Thus, the dominant removal mechanism in low pH waters appears to be through precipitation of influent dissolved Pb ions on the alkaline carbon surface or in the pore liquid. While low pH may reduce the removal capacity due to adsorption-specific processes, it does not appear to negatively impact removal by AC filters where Pb precipitation can occur.
Further research is needed to know whether acidic influent waters pose a risk for precipitated Pb to re-dissolve and be released in the filter effluent as the Pb solubility within the filter changes. Reed and Arunachalam (1994) showed that decreasing column pH corresponded with increasing Pb in the effluent of granular activated columns for wastewater treatment [60]. This behavior was not observed in the present study after two months of testing beyond the manufacturer recommended filter life, but it could occur if the filter cartridge is not replaced at recommended intervals. Six months was protective for the sample of well users in this study. In the absence of precise flow data, monitoring of the effluent pH to detect when it reaches influent levels may provide a simple method of determining when the carbon block needs to be replaced, with opportunities for improvements in POU monitoring through the use of smart technologies and remote water quality monitoring [64,65].

4. Conclusions

This study is the first to provide longitudinal data regarding the performance of POU filters for Pb removal from private well water. The key finding is that an under-sink AC block filter certified under NSF/ANSI 53 removed influent Pb to very low levels (below the American Academy of Pediatrics’ 1 µg/L threshold) during the entire manufacturer stated lifetime (six months) and improved the safety and effectiveness of faucet flushing. Pre-treatment may also be necessary to reach the filter’s rated capacity for some wells. The effectiveness of these devices over time has important implications for preventing disproportionate Pb exposure among communities dependent on private well water. Indeed, children relying on private wells have been shown to have a 25% increased odds of elevated blood Pb levels compared to children who receive their drinking water from regulated community water systems [1]. These areas are often low-income, rural communities and/or minority communities that depend on private wells as a result of historical and ongoing processes of exclusion from municipal services and infrastructure as documented throughout the U.S. [66,67,68,69,70,71,72,73,74]. Although POU water treatment cannot be considered a turnkey solution to systemic injustices that prevent equitable water access [75], this study provides data that can be used to both improve the decision-making of individual well users and to inform evidence-based policies and investments around under-sink POU devices—such as periodic testing events and treatment system subsidies [76]—to prevent Pb exposures among private well users.
Future research should extend this work to test similar filter designs under wider influent groundwater conditions. Waters with higher hardness, alkalinity, and dissolved organic carbon content may interfere with Pb removal to a greater extent than the waters tested here. Faucet-mounted devices should also be evaluated for private well users. These devices may provide protection from the faucet fixture as a Pb source, but the results of this study with respect to cumulative water usage and Pb loading may not apply to faucet-mounted filters, which have a lower capacity, are challenged by higher first-draw Pb concentrations originating from the faucet, and require additional behavior change to manually bypass the filter when using the hot water. These subtle differences could increase the surface loading and impact the long-term performance of these devices for well users. Finally, AC devices are not appropriate in all scenarios. Other common groundwater contaminants such as nitrate and arsenic are not well removed by AC [29]. Thus, studies of a similar longitudinal nature need to be undertaken for other technologies and contaminants to develop a toolkit of validated solutions for private wells.

Supplementary Materials

The following are available online at https://www.mdpi.com/2073-4441/12/12/3584/s1, Figure S1. Map of study participant recruitment areas across three geographic clusters (A, B, and C) in Orange County and Robeson County, North Carolina; Figure S2. Histogram of the daily mean and maximum flow rates among all participating households over the course of the study; Figure S3. Influent and effluent nickel concentrations over time showing median effluent concentrations approaching and surpassing median influent concentrations after approximately four months of use; Figure S4. Distribution of Cd, Cu, Pb, and Zn concentrations during first-draw sequential profile sampling in five homes before the filter was installed; Figure S5. Histogram of cumulative water usage after six months of use; Figure S6. Distribution of pH levels in the filter influent and effluent samples at each sampling month; Table S1. Household-specific information of study participants within each geographic cluster; Table S2. Influent groundwater quality of each participating household compared to the required water quality conditions for POU Pb removal certification according to NSF/ANSI 53; Table S3. Range of removal performance observed for various metals for all households over the entire study period; Table S4. Pb results in baseline samples collected from each house (250 mL first draw without filter) compared to the average filter influent at each household during the study.

Author Contributions

Conceptualization, R.M. and J.M.G.; Methodology, R.M. and J.M.G.; Formal analysis, R.M.; Investigation, R.M.; Resources, J.M.G.; Data curation, R.M.; Writing—original draft preparation, R.M.; Writing—review and editing, J.M.G.; Visualization, R.M.; Supervision, J.M.G.; Project administration, R.M. and J.M.G.; Funding acquisition, J.M.G. All authors have read and agreed to the published version of the manuscript.

Funding

This research was funded by the North Carolina Policy Collaboratory at the University of North Carolina at Chapel Hill.

Acknowledgments

Thanks to Bill Smith, Melissa Packer, Michele Fanning, and Cedric Locklear at the Robeson County Health Department and Rev. Robert Campbell at the Rogers Eubanks Neighborhood Association for support during participant recruitment. Hania Zanib, Tejas Pruthi, Jared Peck, April Desclos, Megan Stallard, and Emanuele Sozzi at UNC Chapel Hill provided assistance during field work and sample preparation. Brad Gibson and Glenn Walters advised on the design and installation of the treatment system. Pete Cable at the UNC Biomarker Mass Spectrometry Facility provided invaluable laboratory analysis support.

Conflicts of Interest

The authors declare no conflict of interest. The funders had no role in the design of the study; in the collection, analyses, or interpretation of data; in the writing of the manuscript, or in the decision to publish the results.

References

  1. Gibson, J.M.; Fisher, M.; Clonch, A.; Macdonald, J.M.; Cook, P.J. Children drinking private well water have higher blood lead than those with city water. Proc. Natl. Acad. Sci. USA 2020, 117, 16898–16907. [Google Scholar] [CrossRef] [PubMed]
  2. Pieper, K.J.; Krometis, L.A.H.; Gallagher, D.L.; Benham, B.L.; Edwards, M. Incidence of waterborne lead in private drinking water systems in Virginia. J. Water Health 2015, 13, 897–908. [Google Scholar] [CrossRef] [PubMed] [Green Version]
  3. Pieper, K.J.; Nystrom, V.E.; Parks, J.; Jennings, K.; Faircloth, H.; Morgan, J.B.; Bruckner, J.; Edwards, M.A. Elevated lead in water of private wells poses health risks: Case study in Macon county, North Carolina. Environ. Sci. Technol. 2018, 52, 4350–4357. [Google Scholar] [CrossRef] [PubMed]
  4. ATSDR. Toxicological Profile for Lead; Agency for Toxic Substances and Disease Registry (ATSDR), U.S. Department of Health and Human Services: Atlanta, GA, USA, 2007.
  5. Lanphear, B.P.; Hornung, R.; Khoury, J.; Yolton, K.; Baghurst, P.; Bellinger, D.C.; Canfield, R.L.; Dietrich, K.N.; Bornschein, R.; Greene, T.; et al. Low-level environmental lead exposure and children’s intellectual function: An international pooled analysis. Environ. Health Perspect. 2005, 113, 894–899. [Google Scholar] [CrossRef] [PubMed]
  6. Canfield, R.L.; Henderson, C.R.J.; Cory-Slechta, D.A.; Cox, C.; Jusko, T.A.; Lanphear, B.P. Intellectual impairment in children with blood lead concentrations below 10 µg per deciliter. N. Engl. J. Med. 2003, 348, 1517–1526. [Google Scholar] [CrossRef] [PubMed] [Green Version]
  7. Fizer, C.; de Bruin, W.B.; Stillo, F.; Gibson, J.M. Barriers to managing private well and septic systems in underserved communities: Mental models of homeowner decision-making. J. Environ. Health 2018, 81, 43. [Google Scholar]
  8. Stillo, F.; de Bruin, W.B.; Zimmer, C.; Gibson, J.M.D. Well water testing in African-American communities without municipal infrastructure: Beliefs driving decisions. Sci. Total Environ. 2019, 686, 1220–1228. [Google Scholar] [CrossRef]
  9. Wood, E. Promoting Private Well Testing in Underserved Minority Communities Using the Mental Models Approach to Risk Communication. Master’s Thesis, University of North Carolina at Chapel Hill, Chapel Hill, NC, USA, 2019. [Google Scholar]
  10. Flanagan, S.V.; Gleason, J.A.; Spayd, S.E.; Procopio, N.A.; Rockafellow-Baldoni, M.; Braman, S.; Chillrud, S.N.; Zheng, Y. Health protective behavior following required arsenic testing under the New Jersey private well testing act. Int. J. Hyg. Environ. Health 2018, 221, 929–940. [Google Scholar] [CrossRef]
  11. Morris, L.; Wilson, S.; Kelly, W. Methods of conducting effective outreach to private well owners—A literature review and model approach. J. Water Health 2016, 14, 167–182. [Google Scholar] [CrossRef]
  12. Colley, S.K.; Kane, P.K.M.; Gibson, J.M. Risk communication and factors influencing private well testing behavior: A systematic scoping review. Int. J. Environ. Res. Public Health 2019, 16, 4333. [Google Scholar] [CrossRef] [Green Version]
  13. Nigra, A.E. Environmental racism and the need for private well protections. Proc. Natl. Acad. Sci. USA 2020, 117, 17476–17478. [Google Scholar] [CrossRef] [PubMed]
  14. Brown, K.W.; Gessesse, B.; Butler, L.J.; MacIntosh, D.L. Potential effectiveness of point-of-use filtration to address risks to drinking water in the United States. Environ. Health Insights 2017, 11, 117863021774699. [Google Scholar] [CrossRef] [PubMed] [Green Version]
  15. Lothrop, N.; Wilkinson, S.T.; Verhougstrate, M.; Sugeng, A.; Loh, M.M.; Klimecki, W.; Beamer, P.I.; Beamer, P.I. Home water treatment habits and effectiveness in a rural Arizona community. Water 2015, 7, 1217–1231. [Google Scholar] [CrossRef] [PubMed]
  16. Tomlinson, M.S.; Bommarito, P.; George, A.; Yelton, S.; Cable, P.; Coyte, R.; Karr, J.; Vengosh, A.; Gray, K.M.; Fry, R.C. Assessment of inorganic contamination of private wells and demonstration of effective filter-based reduction: A pilot-study in Stokes County, North Carolina. Environ. Res. 2019, 177, 108618. [Google Scholar] [CrossRef]
  17. USEPA. Lead and Copper Monitoring and Reporting Guidance for Public Water Systems—EPA-816-R-02-009; U.S. Environmental Protection Agency—Office of Water: Washington, DC, USA, 2002.
  18. Powers, M.; Yracheta, J.; Harvey, D.; Leary, M.O.; Best, L.G.; Black, A.; Macdonald, L.; Susan, J.; Hasan, K.; Thomas, E.; et al. Arsenic in groundwater in private wells in rural North Dakota and South Dakota: Water quality assessment for an intervention trial. Environ. Res. 2019, 168, 41–47. [Google Scholar] [CrossRef]
  19. Spayd, S.E.; Robson, M.G.; Buckley, B.T. Whole-house arsenic water treatment provided more effective arsenic exposure reduction than point-of-use water treatment at New Jersey homes with arsenic in well water. Sci. Total Environ. 2015, 505, 1361–1369. [Google Scholar] [CrossRef] [Green Version]
  20. Möller, T.; Sylvester, P.; Shepard, D.; Morassi, E. Arsenic in groundwater in New England—Point-of-entry and point-of-use treatment of private wells. Desalination 2009, 243, 293–304. [Google Scholar] [CrossRef]
  21. NSF Joint Committee on Drinking Water Treatment Units. NSF/ANSI 53: Drinking Water Treatment Units—Health Effects; NSF International: Ann Arbor, MI, USA, 2018. [Google Scholar]
  22. Javidi, A.; Pierce, G.U.S. Households’ perception of drinking water as unsafe and its consequences: Examining alternative choices to the tap. Water Resour. Res. 2018, 54, 6100–6113. [Google Scholar] [CrossRef]
  23. Pieper, K.J.; Krometis, L.A.; Gallagher, D.; Benham, B.; Edwards, M. Profiling private water systems to identify patterns of waterborne lead exposure. Environ. Sci. Technol. 2015, 49, 12697–12704. [Google Scholar] [CrossRef]
  24. American Academy of Pediatrics Council on Environmental Health. Prevention of childhood lead toxicity. Pediatrics 2016, 138, e20161493. [Google Scholar] [CrossRef] [Green Version]
  25. 99th Congress. Safe Drinking Water Act Amendments of 1986; 42 USC 300g-6; 99th Congress of the United States of America: Washington, DC, USA, 1986.
  26. 111th Congress. Reduction of Lead in Drinking Water Act; 124 Stat. 4131; 111th Congress of the United States of America: Washington, DC, USA, 2011.
  27. U.S. Census Bureau American Community Survey 5-year estimates. Available online: http://censusreporter.org (accessed on 10 October 2020).
  28. USEPA. Cost Evaluation of Point-of-Use and Point-of-Entry Treatment Units for Small Systems: Cost Estimating Tool and Users Guide—EPA 815-B-07-001 April; U.S. Environmental Protection Agency—Office of Water: Washington, DC, USA, 2007.
  29. USEPA. Point-of-Use or Point-of-Entry Treatment Options for Small Drinking Water Systems: EPA 815-R-06-010; U.S. Environmental Protection Agency: Arlington, VA, USA, 2006.
  30. Thomas, E.D.; Gittelsohn, J.; Yracheta, J.; Powers, M.; O’Leary, M.; Harvey, D.E.; Cloud, R.R.; Best, L.G.; Bear, A.B.; Navas-Acien, A.; et al. The strong heart water study: Informing and designing a multi-level intervention to reduce arsenic exposure among private well users in Great Plains Indian Nations. Sci. Total Environ. 2019, 650, 3120–3133. [Google Scholar] [CrossRef] [PubMed]
  31. Pratson, E.; Vengosh, A.; Dwyer, G.; Pratson, L.; Klein, E. The effectiveness of arsenic remediation from groundwater in a private home. Ground Water Monit. Remediat. 2009, 30, 85–91. [Google Scholar] [CrossRef]
  32. Deshommes, E.; Nour, S.; Richer, B.; Cartier, C.; Prévost, M. POU devices in large buildings: Lead removal and water quality. J. Am. Water Works Assoc. 2012, 104, 75–76. [Google Scholar] [CrossRef]
  33. Belitz, K.; Jurgens, B.C.; Johnson, T.D. Potential Corrosivity of Untreated Groundwater in the United States, Scientific Investigations Report 2016-5092; U.S. Geological Survey: Reston, VA, USA, 2016.
  34. Bosscher, V.; Lytle, D.A.; Schock, M.R.; Porter, A.; Del Toral, M. POU water filters effectively reduce lead in drinking water: A demonstration field study in flint, Michigan. J. Environ. Sci. Heal. Part A Toxic/Hazard. Subst. Environ. Eng. 2019, 54, 484–493. [Google Scholar] [CrossRef] [Green Version]
  35. Riblet, C.; Deshommes, E.; Laroche, L.; Prévost, M. True exposure to lead at the tap: Insights from proportional sampling, regulated sampling and water use monitoring. Water Res. 2019, 156, 327–336. [Google Scholar] [CrossRef]
  36. Su, F.; Luo, M.; Zhang, F.; Li, P.; Lou, K.; Xing, X. Performance of microbiological control by a point-of-use filter system for drinking water purification. J. Environ. Sci. 2009, 21, 1237–1246. [Google Scholar] [CrossRef]
  37. Geldreich, E.E.; Taylor, R.H.; Blannon, J.C.; Reasoner, D.J. Bacterial colonization of point-of-use water treatment devices. J. Am. Water Works Assoc. 1985, 77, 72–80. [Google Scholar] [CrossRef]
  38. USEPA. Method 6020B (SW-846): Inductively Coupled Plasma Mass—Spectrometry, Revision 2; U.S. Environmental Protection Agency: Washington, DC, USA, 2014.
  39. USEPA. Regional Guidance on Handling Chemical Concentration Data Near the Detection Limit in Risk Assessments; U.S. Environmental Protection Agency—Region 3: Philadelphia, PA, USA, 1991.
  40. Triantafyllidou, S.; Edwards, M. Lead (Pb) in tap water and in blood: Implications for lead exposure in the United States. Crit. Rev. Environ. Sci. Technol. 2012, 42, 1297–1352. [Google Scholar] [CrossRef]
  41. Redmon, J.H.; Gibson, J.M.D.; Woodward, K.P.; Aceituno, A.M.; Levine, K.E. Safeguarding children’s health: Time to enact a health-based standard and comprehensive testing, mitigation, and communication protocol for lead in drinking water. N. C. Med. J. 2018, 79, 313–317. [Google Scholar] [CrossRef] [PubMed]
  42. Deshommes, E.; Zhang, Y.; Gendron, K.; Sauvé, S.; Edwards, M.; Nour, S.; Prévost, M. Lead removal from tap water using POU devices. J. Am. Water Work. Assoc. 2010, 102, 91–105. [Google Scholar] [CrossRef]
  43. Boyd, G.R.; Kirmeyer, G.J.; Pierson, G.L.; Hendrickson, S.L.; Kreider, D.; English, R. Testing of point-of-use filters at Seattle schools drinking fountains. In Water Quality Technology Conference Proceedings, Proceedings of the 2005 Water Quality Technology Conference and Exposition, Quebec City, QC, Canada, 6–10 November 2005; American Water Works Association: Denver, CO, USA, 2005. [Google Scholar]
  44. Taylor, R.M.; Kuennen, R.W. Removing lead in drinking water with activated carbon. Environ. Prog. 1994, 13, 65–71. [Google Scholar] [CrossRef]
  45. Pieper, K.J.; Krometis, L.A.; Edwards, M. Quantifying lead-leaching potential from plumbing exposed to aggressive waters. J. Am. Water Works Assoc. 2016, 108, E458–E466. [Google Scholar] [CrossRef]
  46. Lei, I.L.; Ng, D.Q.; Sable, S.S.; Lin, Y.P. Evaluation of lead release potential of new premise plumbing materials. Environ. Sci. Pollut. Res. 2018, 25, 27971–27981. [Google Scholar] [CrossRef] [PubMed]
  47. Samuels, E.R.; Méranger, J.C. Preliminary studies on the leaching of some trace metals from kitchen faucets. Water R 1984, 18, 75–80. [Google Scholar] [CrossRef]
  48. StarCraft. Custom Builders Faucet Basics: Part 1—What are Faucets Made of? Available online: http://starcraftcustombuilders.com/sources.faucets.htm (accessed on 10 October 2020).
  49. Sheppard, L.M. Faucet. Available online: http://www.madehow.com/Volume-6/Faucet.html (accessed on 10 October 2020).
  50. Otunniyi, I.O.; Oluokun, O.O. A Probe into failure of selected plumbing parts: Alloy composition, microstructural condition and aqueous exposure. J. Metall. Eng. 2014, 3, 69. [Google Scholar] [CrossRef]
  51. Clark, B.N.; Masters, S.V.; Edwards, M.A. Lead release to drinking water from galvanized steel pipe coatings. Environ. Eng. Sci. 2015, 32, 713–721. [Google Scholar] [CrossRef]
  52. Pieper, K.J.; Kriss, R.; Tang, M.; Edwards, M.A.; Katner, A. Understanding lead in water and avoidance strategies: A United States perspective for informed decision-making. J. Water Health 2019, 17, 540–555. [Google Scholar] [CrossRef] [Green Version]
  53. Katner, A.; Pieper, K.; Brown, K.; Lin, H.Y.; Parks, J.; Wang, X.; Hu, C.Y.; Masters, S.; Mielke, H.; Edwards, M. Effectiveness of prevailing flush guidelines to prevent exposure to lead in tap water. Int. J. Environ. Res. Public Health 2018, 15, 1537. [Google Scholar] [CrossRef] [Green Version]
  54. Boyd, G.R.; Pierson, G.L.; Kirmeyer, G.J.; Brition, M.D.; English, R.J. Lead release from new and end-use plumbing components in Seattle Public Schools. J. Am. Water Works Assoc. 2008, 100, 105–114. [Google Scholar] [CrossRef]
  55. Boyd, G.R.; Pierson, G.L.; Kirmeyer, G.J.; English, R.J. Lead variability testing in Seattle Public Schools. J. Am. Water Works Assoc. 2008, 100, 53–64. [Google Scholar] [CrossRef]
  56. Kuennen, R.W.; Taylor, R.M.; Van Dyke, K.; Groenevelt, K. Removing lead from drinking water with a point-of-use GAC fixed-bed adsorber. J. Am. Water Works Assoc. 1992, 84, 91–101. [Google Scholar] [CrossRef]
  57. Mulhern, R.E.; Summers, R.S.; Dickenson, E.R.V. Evaluating and modeling the activated carbon adsorption of wastewater-derived N-nitrosodimethylamine precursors. Environ. Sci. Water Res. Technol. 2017, 3, 844–856. [Google Scholar] [CrossRef]
  58. Goel, J.; Kadirvelu, K.; Rajagopal, C.; Garg, V.K. Removal of lead (II) by adsorption using treated granular activated carbon: Batch and column studies. J. Hazard. Mater. 2005, 125, 211–220. [Google Scholar] [CrossRef] [PubMed]
  59. Largitte, L.; Gervelas, S.; Tant, T.; Dumesnil, P.C.; Hightower, A.; Yasami, R.; Bercion, Y.; Lodewyckx, P. Removal of lead from aqueous solutions by adsorption with surface precipitation. Adsorption 2014, 20, 689–700. [Google Scholar] [CrossRef]
  60. Reed, B.E.; Arunachalam, S. Use of granular activated carbon columns for lead removal. J. Environ. Eng. 1994, 120, 416–436. [Google Scholar] [CrossRef]
  61. Reed, B.E. Identification of removal mechanisms for lead in Granular Activated Carbon (GAC) columns. Sep. Sci. Technol. 1995, 30, 101–116. [Google Scholar] [CrossRef]
  62. Sontheimer, H.; Crittenden, J.C.; Summers, R.S. The production and physical-chemical evaluation of activated carbon. In Activated Carbon for Water Treatment; DVGW-Forschungsstelle: Karlsruhe, Germany, 1988; pp. 51–105. ISBN 3-922671-20-9. [Google Scholar]
  63. Jurgens, B.C.; Parkhurst, D.L.; Belitz, K. Assessing the lead solubility potential of untreated groundwater of the United States. Environ. Sci. Technol. 2019, 53, 3095–3103. [Google Scholar] [CrossRef] [Green Version]
  64. Geetha, S.; Gouthami, S. Internet of things enabled real time water quality monitoring system. Smart Water 2016, 2, 1. [Google Scholar] [CrossRef]
  65. Hoffman, T.; Hynds, P.; Schuster-Wallace, C.; Dickson-Anderson, S.; Majury, A. Harnessing smart technology for private well risk assessment and communication. Water Secur. 2019, 6, 100026. [Google Scholar] [CrossRef]
  66. Gibson, J.M.; De Felice, N.; Sebastian, D.; Leker, H. Racial disparities in access to community water supply service in Wake County, North Carolina. Front. Public Health Serv. Syst. Res. 2014, 3, 3–7. [Google Scholar] [CrossRef] [Green Version]
  67. Naman, J.M.; Gibson, J.M. Disparities in water and sewer services in North Carolina: An analysis of the decision-making process. Am. J. Public Health 2015, 105, e20–e26. [Google Scholar] [CrossRef] [PubMed]
  68. Aiken, C.S. Race as a factor in municipal underbounding race as a factor in municipal underbounding. Ann. Assoc. Am. Geogr. 1987, 77, 564–579. [Google Scholar] [CrossRef]
  69. Lichter, D.T.; Parisi, D.; Grice, S.M.; Taquino, M. Municipal underbounding: Annexation and racial exclusion in small southern towns. Rural Sociol. Soc. 2007, 72, 47–68. [Google Scholar] [CrossRef] [Green Version]
  70. Heaney, C.D.; Wing, S.; Wilson, S.; Campbell, R.L.; Caldwell, D.; Hopkins, B.; O’Shea, S.; Yeatts, K. Public infrastructure disparities and the microbiological and chemical safety of drinking and surface water supplies in a community bordering a landfill. J. Environ. Health 2015, 75, 24–36. [Google Scholar]
  71. Balazs, C.L.; Ray, I. The drinking water disparities framework: On the origins and persistence of inequities in exposure. Am. J. Public Health 2014, 104, 603–611. [Google Scholar] [CrossRef]
  72. Seaton, P.; Garibay, V. American Recovery and Reinvestment Act of 2009 Analysis of Drinking Water and Waste Water Investment in Fresno and Stanislaus Counties; California Rural Legal Assistance, Inc.: Oakland, CA, USA, 2009. [Google Scholar]
  73. Van Derslice, J. Drinking water infrastructure and environmental disparities: Evidence and methodological considerations. Am. J. Public Health 2011, 101, 109–114. [Google Scholar] [CrossRef] [PubMed]
  74. Colfax, R. Denied water service because of race, African Americans win $10.85 million jury verdict. Clear. Rev. J. Poverty Law Policy 2009, 43, 398–401. [Google Scholar]
  75. Vandewalle, E.; Jepson, W. Mediating water governance: Point-of-use water filtration devices for low-income communities along the US–Mexico border. Geo Geogr. Environ. 2015, 2, 107–121. [Google Scholar] [CrossRef]
  76. Zheng, Y.; Flanagan, S.V. The case for universal screening of private well water quality in the U.S. and testing requirements to achieve it: Evidence from arsenic. Environ. Health Perspect. 2017, 125, 085002. [Google Scholar] [CrossRef] [Green Version]
Figure 1. Schematic of filter installation. FI = Filter influent sample port; FE = Filter effluent sample port.
Water 12 03584 g001
Figure 2. Volumes and flushing times for sequential sampling before and after filters were installed in five households with elevated first draw Pb concentrations.
Water 12 03584 g002
Figure 3. Distribution of influent and effluent Pb concentrations among all study households at each sampling time. Vertical panes show the number of days of filter operation for each collection of samples. Filter influent samples (Inf.) shown in pink. Filter effluent samples (Eff.) shown in teal.
Water 12 03584 g003
Figure 4. Paired influent and effluent samples aggregated from all households and sample months for each metal analyzed. The color of each point indicates the geographic cluster of the household: A (red), B (green), and C (blue). Stars indicate significance of the reduction from influent to effluent concentrations in one-sided Wilcoxon tests. ns: p > 0.05; ** p < 0.01; *** p < 0.001; **** p < 0.0001.
Water 12 03584 g004
Figure 5. Comparison between baseline first-draw Pb levels in samples collected directly at the kitchen faucet (left) and average filter influent Pb levels in samples collected beneath the kitchen sink from a sample port without interaction with the faucet (right). Colors show geographic cluster of the household and lines show paired household samples. White diamonds show the group mean.
Water 12 03584 g005
Figure 6. Results of Pb profile sampling in five households before and after filter installation.
Water 12 03584 g006
Table 1. Key sociodemographic and water quality characteristics of each geographic cluster where study participants were recruited. Sociodemographic data represent the Census Block Group surrounding each cluster of study participants from the American Community Survey [27]. Water quality data represent measurements collected for this study from each participating household.
Cluster A (n = 4)Cluster B (n = 2)Cluster C (n = 11)
Demographic Characteristics
NC CountyOrangeRobesonRobeson
Median household income$157,422$27,917$31,971
Persons per household2.93.23.1
Median home value$442,300$72,500$66,300
Housing typeSingle unit98%48%24%
Multi-unit1%6%0%
Mobile home1%46%74%
EducationHigh school or higher97.9%68.8%71.8%
Bachelor’s or higher78.2%4.9%6.6%
Race and ethnicityWhite63%11%31%
Black9%17%28%
Native0%47%12%
Asian18%0%0%
Two+5%2%3%
Hispanic4%22%26%
Groundwater Quality Characteristics—mean (± SD)
pH7.1 ± 0.45.4 ± 1.14.4 ± 0.3
Electrical conductivity (µS/cm)350 ± 110220 ± 140110 ± 35
Hardness (mg/L as CaCO3)110 ± 5030 ± 1020 ± 10
Carbonate alkalinity (mg/L as CaCO3)110 ± 507.3 ± 7.2 0.1 ± 0.1
Langelier Saturation Index−1.0 ± 0.5−5.2 ± 2.1−7.6 ± 0.6
250 mL first draw Pb (µg/L) *1.21 ± 1.1917.4 ± 2410.9 ± 7.3
* Results from initial screening/baseline samples collected during study recruitment.
Publisher’s Note: MDPI stays neutral with regard to jurisdictional claims in published maps and institutional affiliations.

