Length Parameter for Scaling Abutment Scour Depth


Abstract
:1. Introduction
2. Dimensional Analysis
3. Possible Length Scales
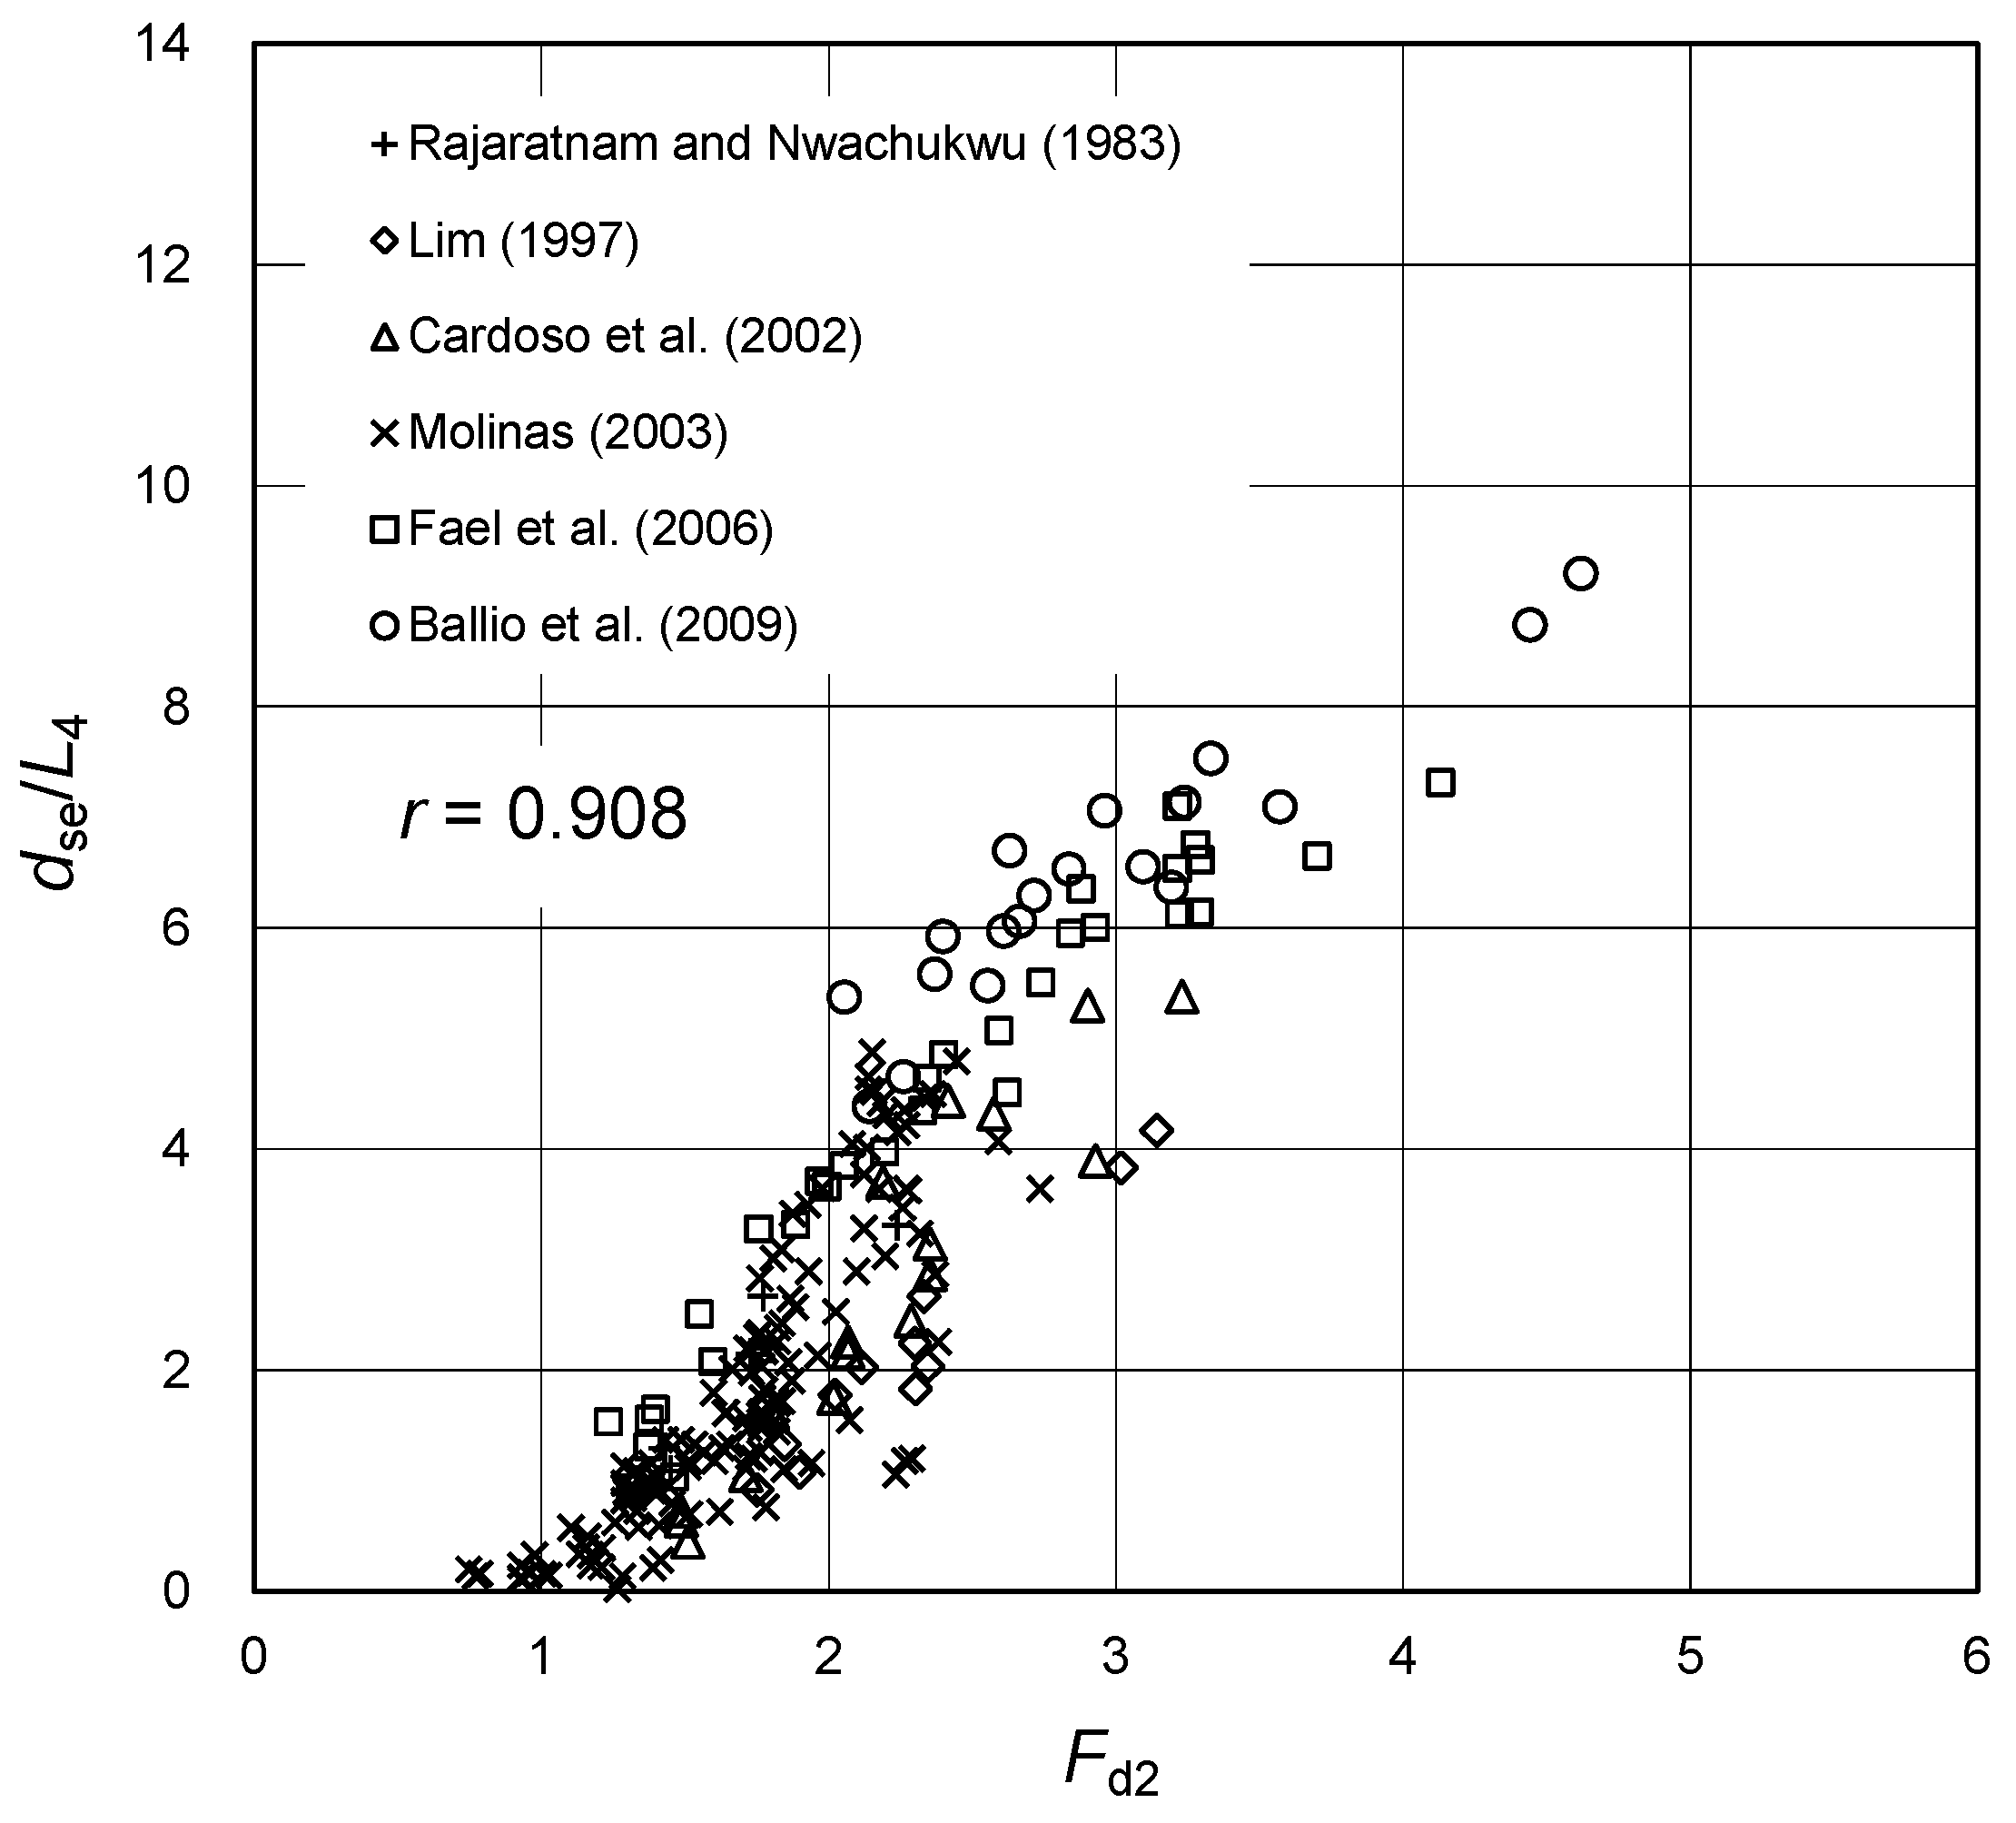
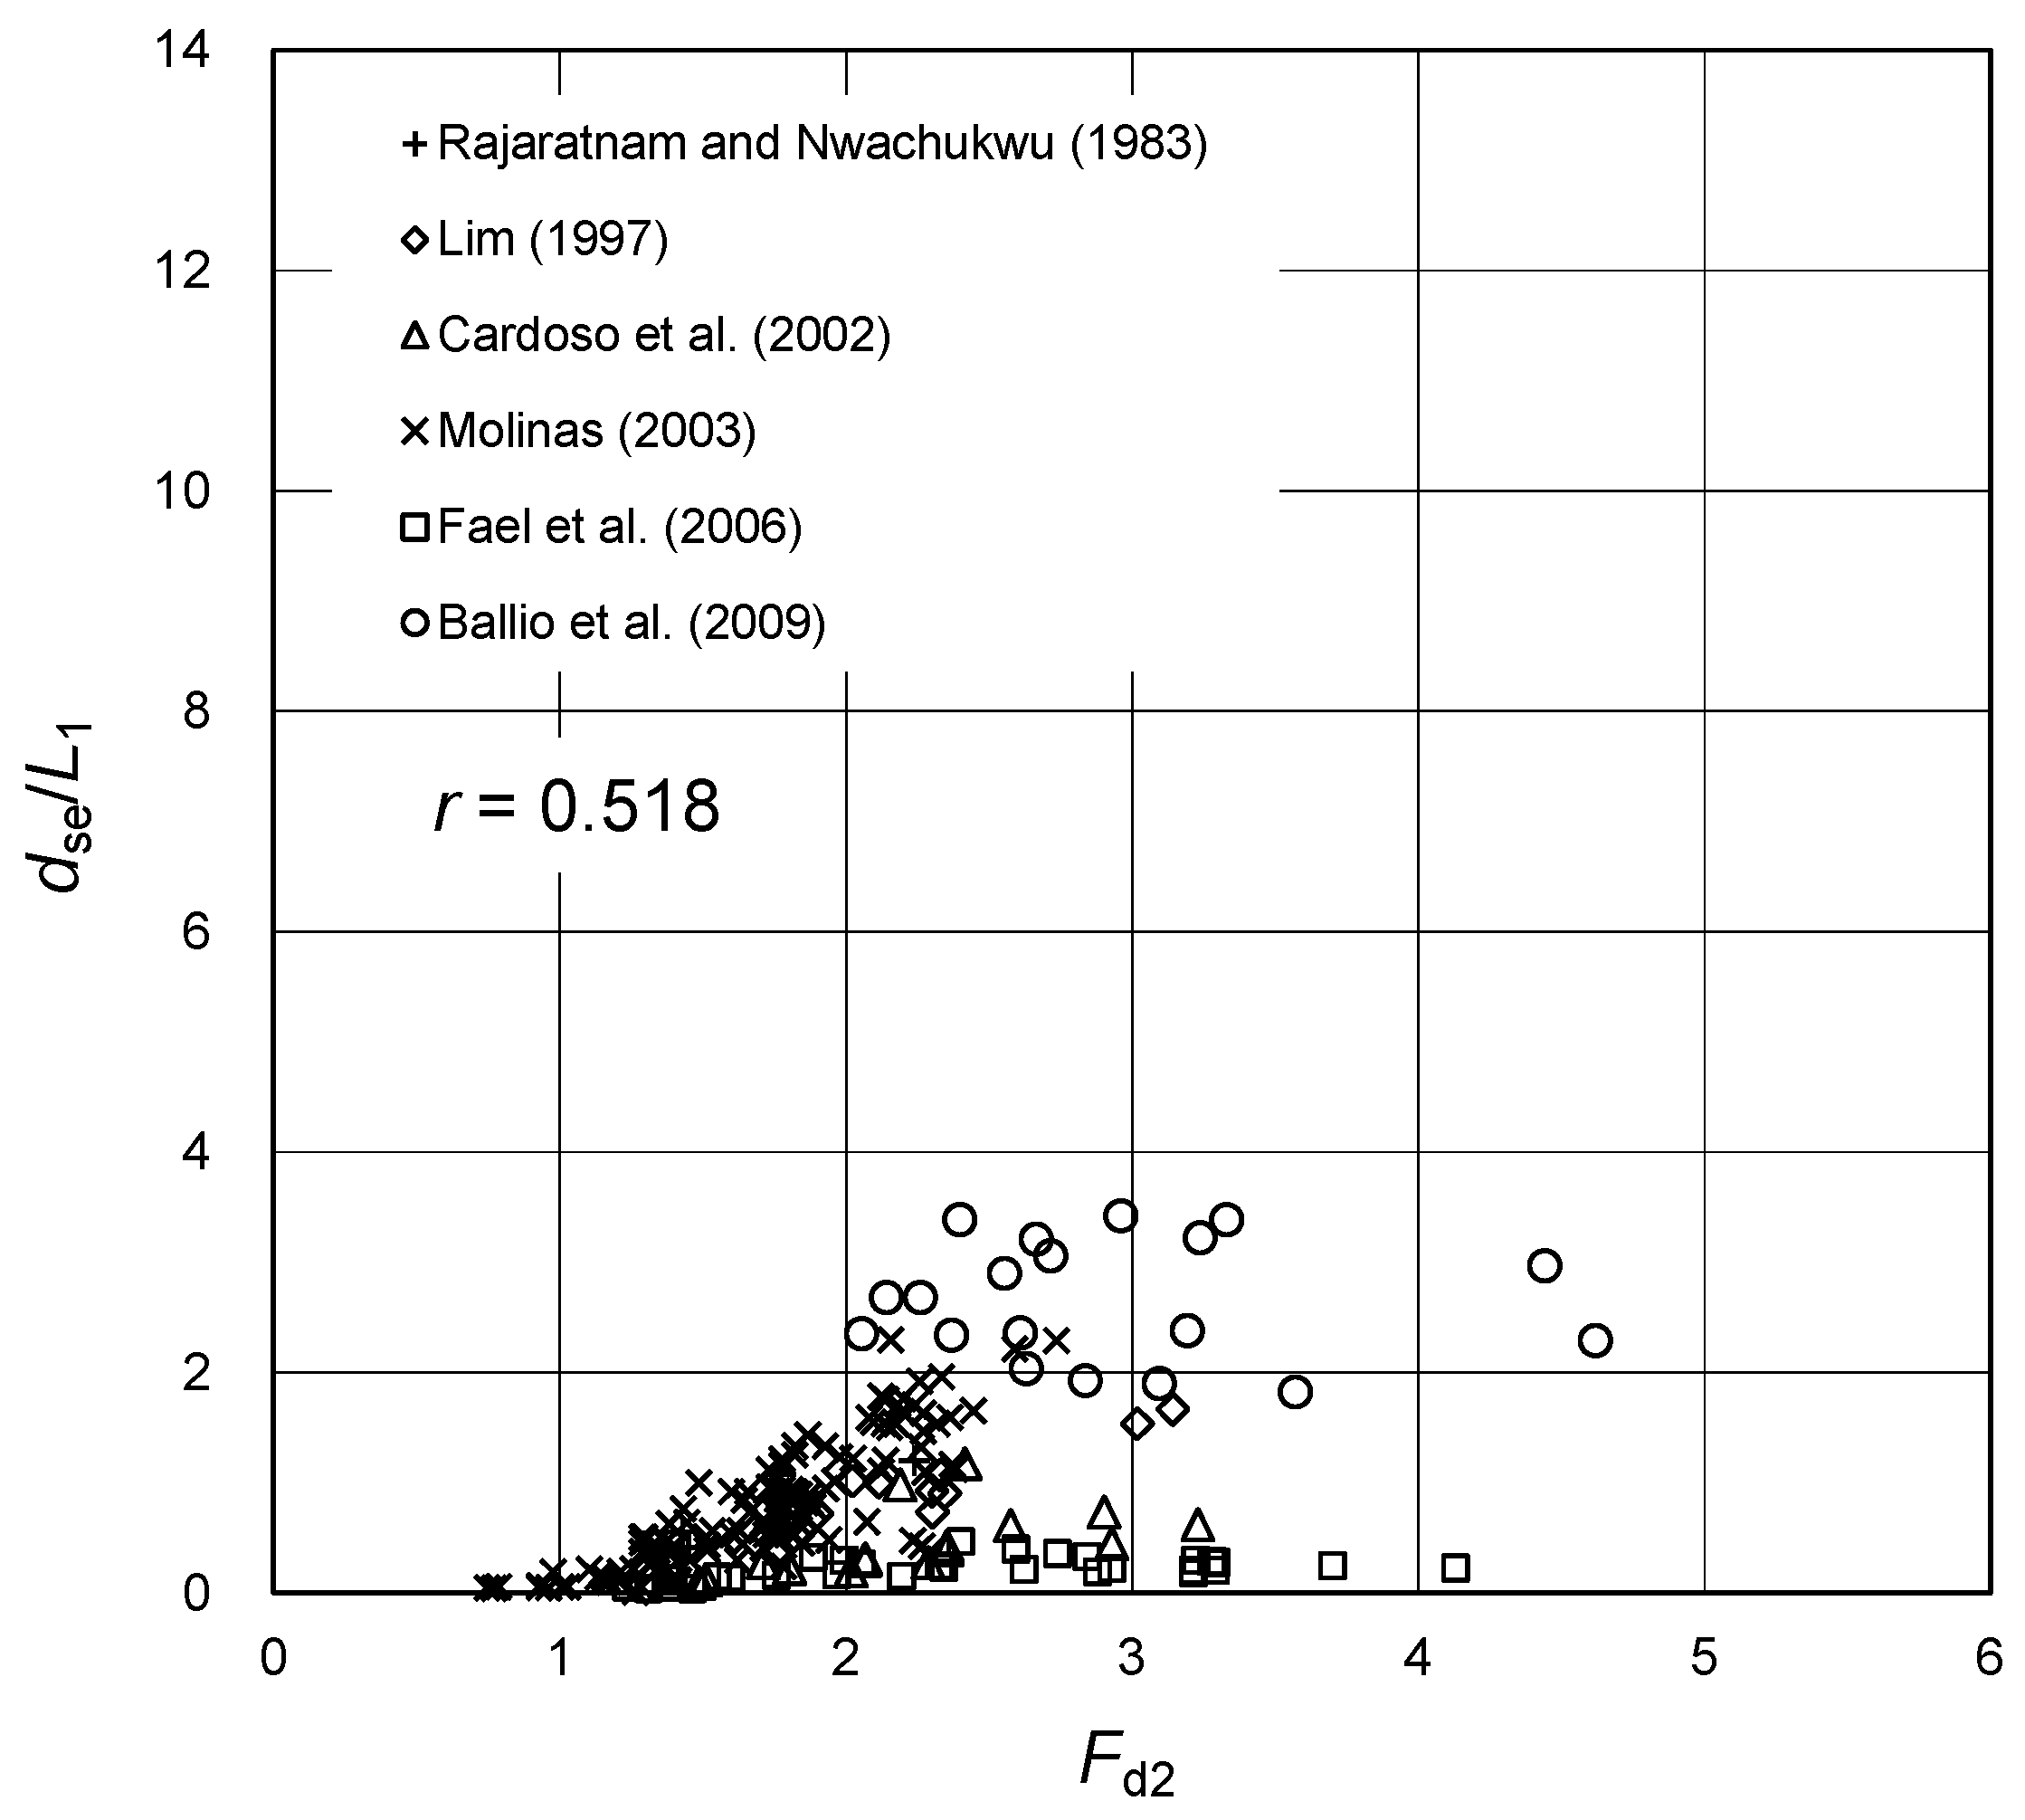
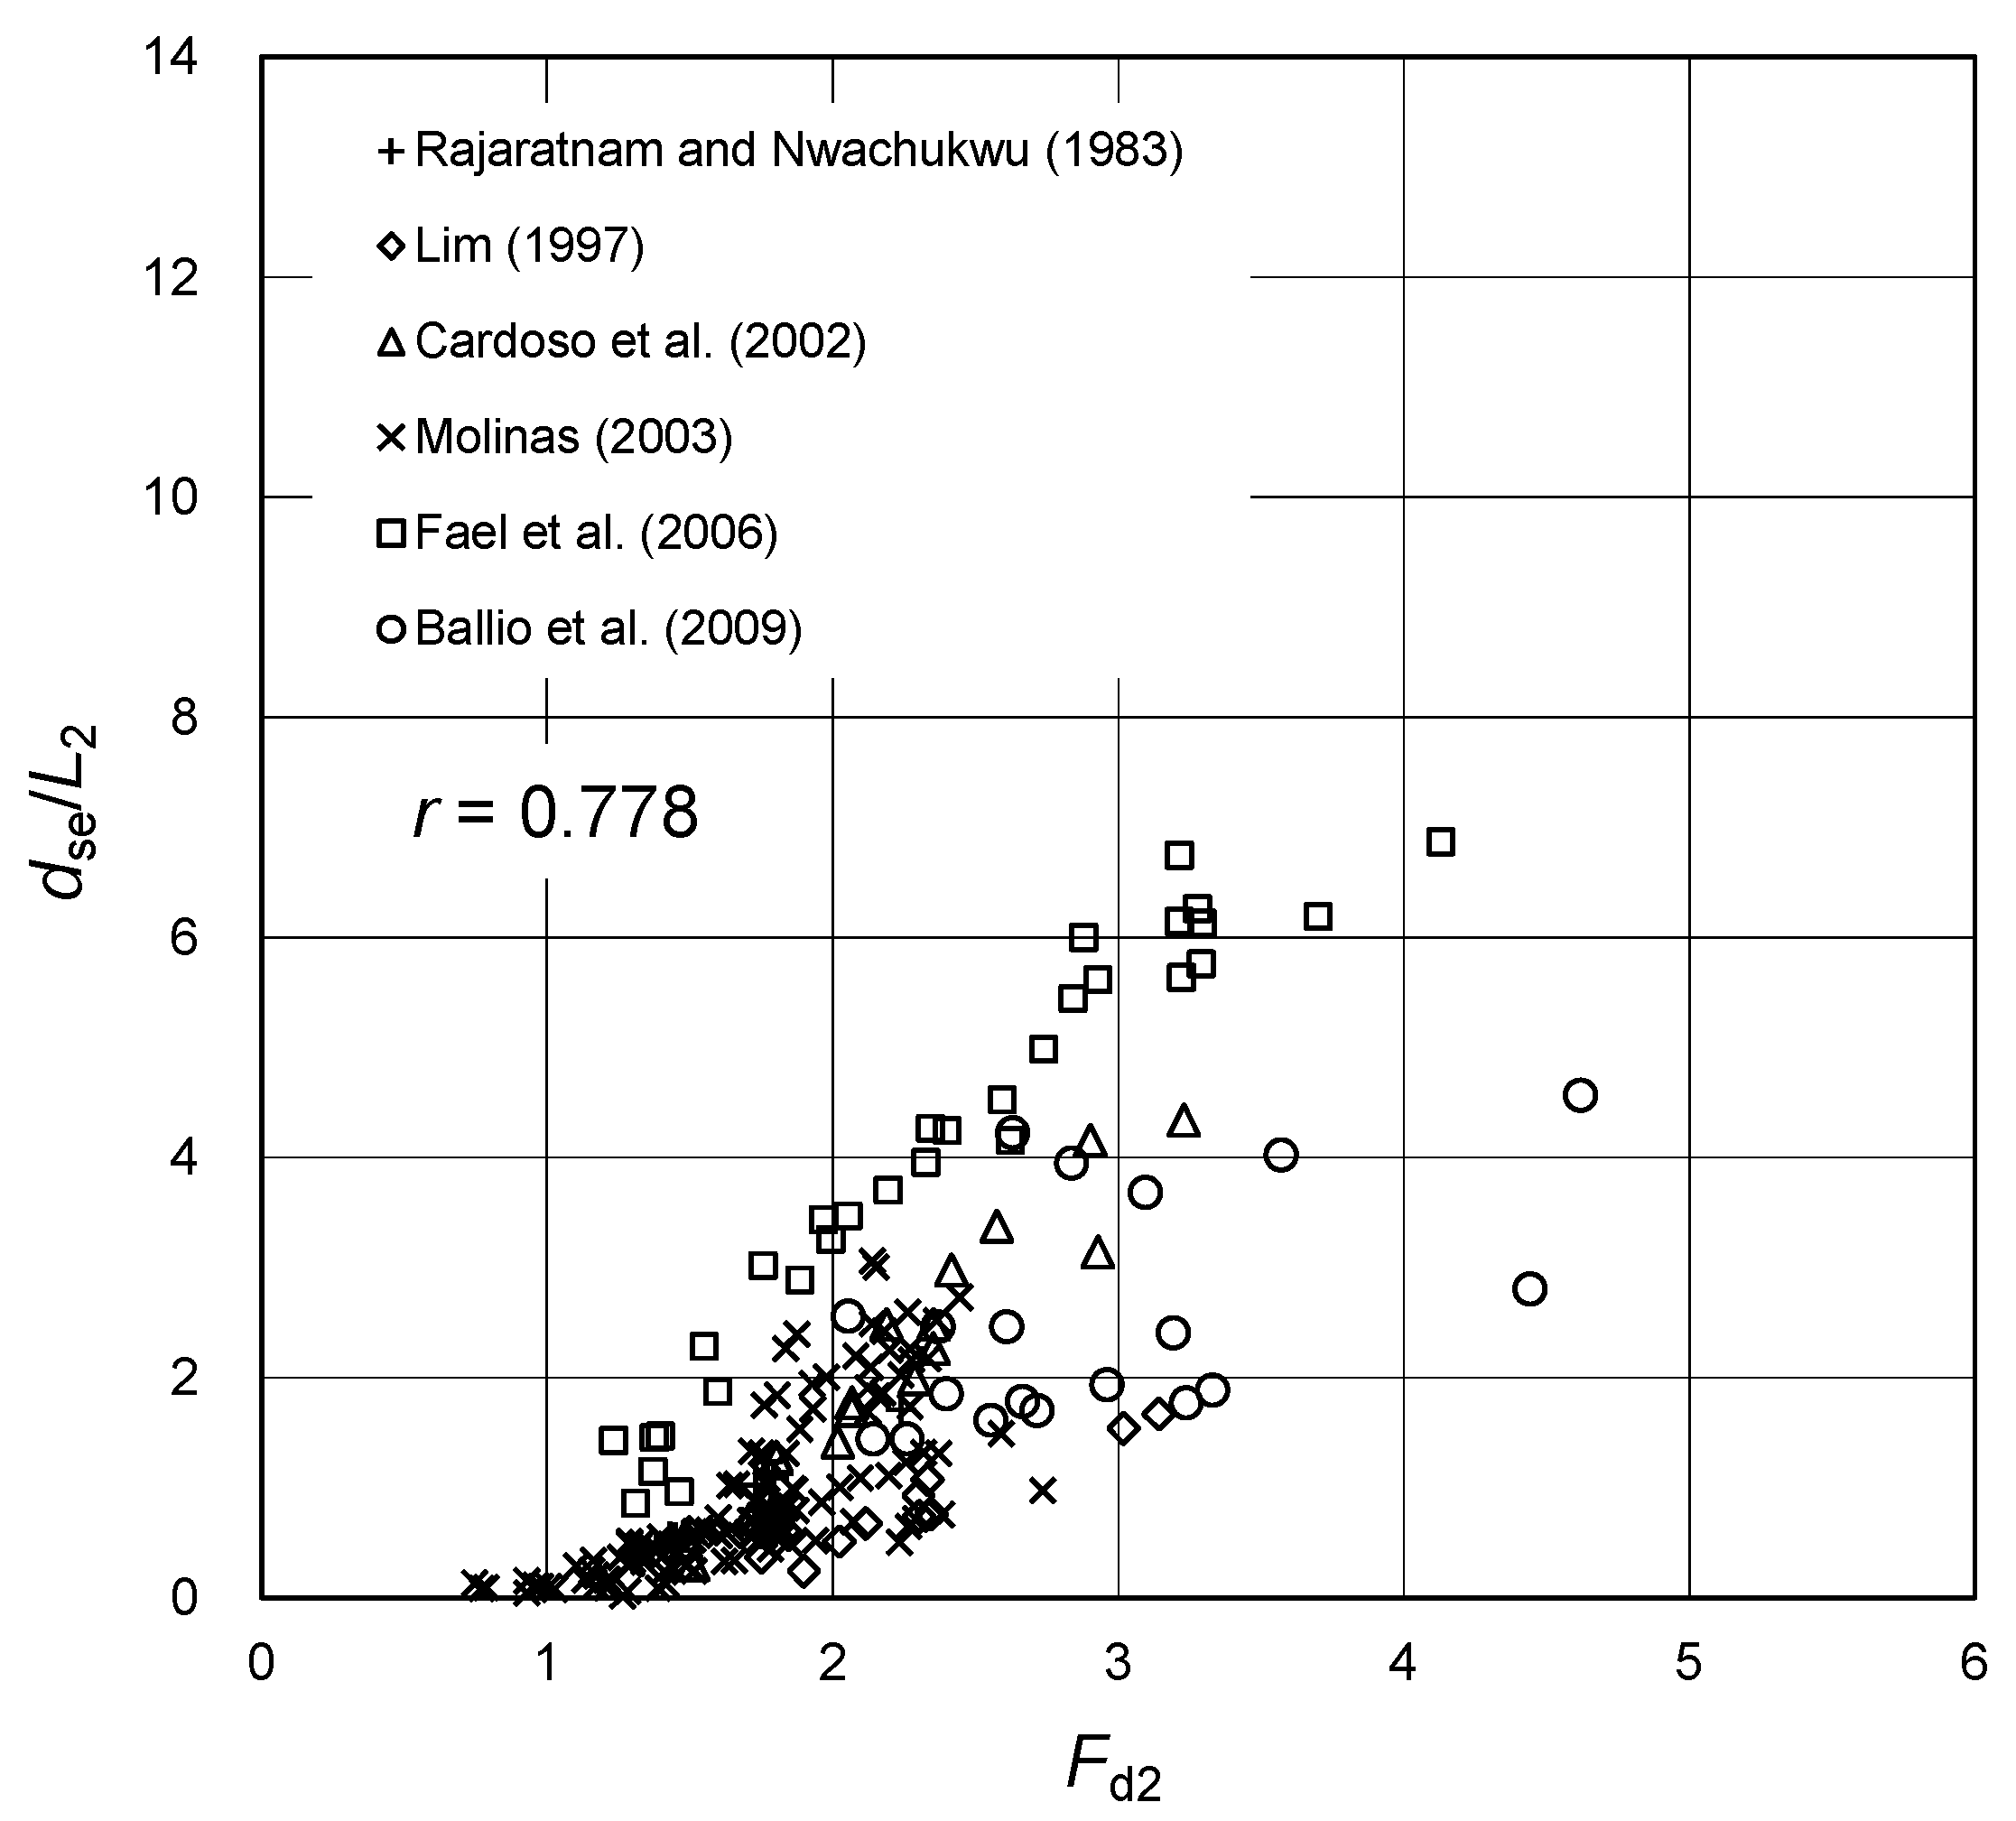
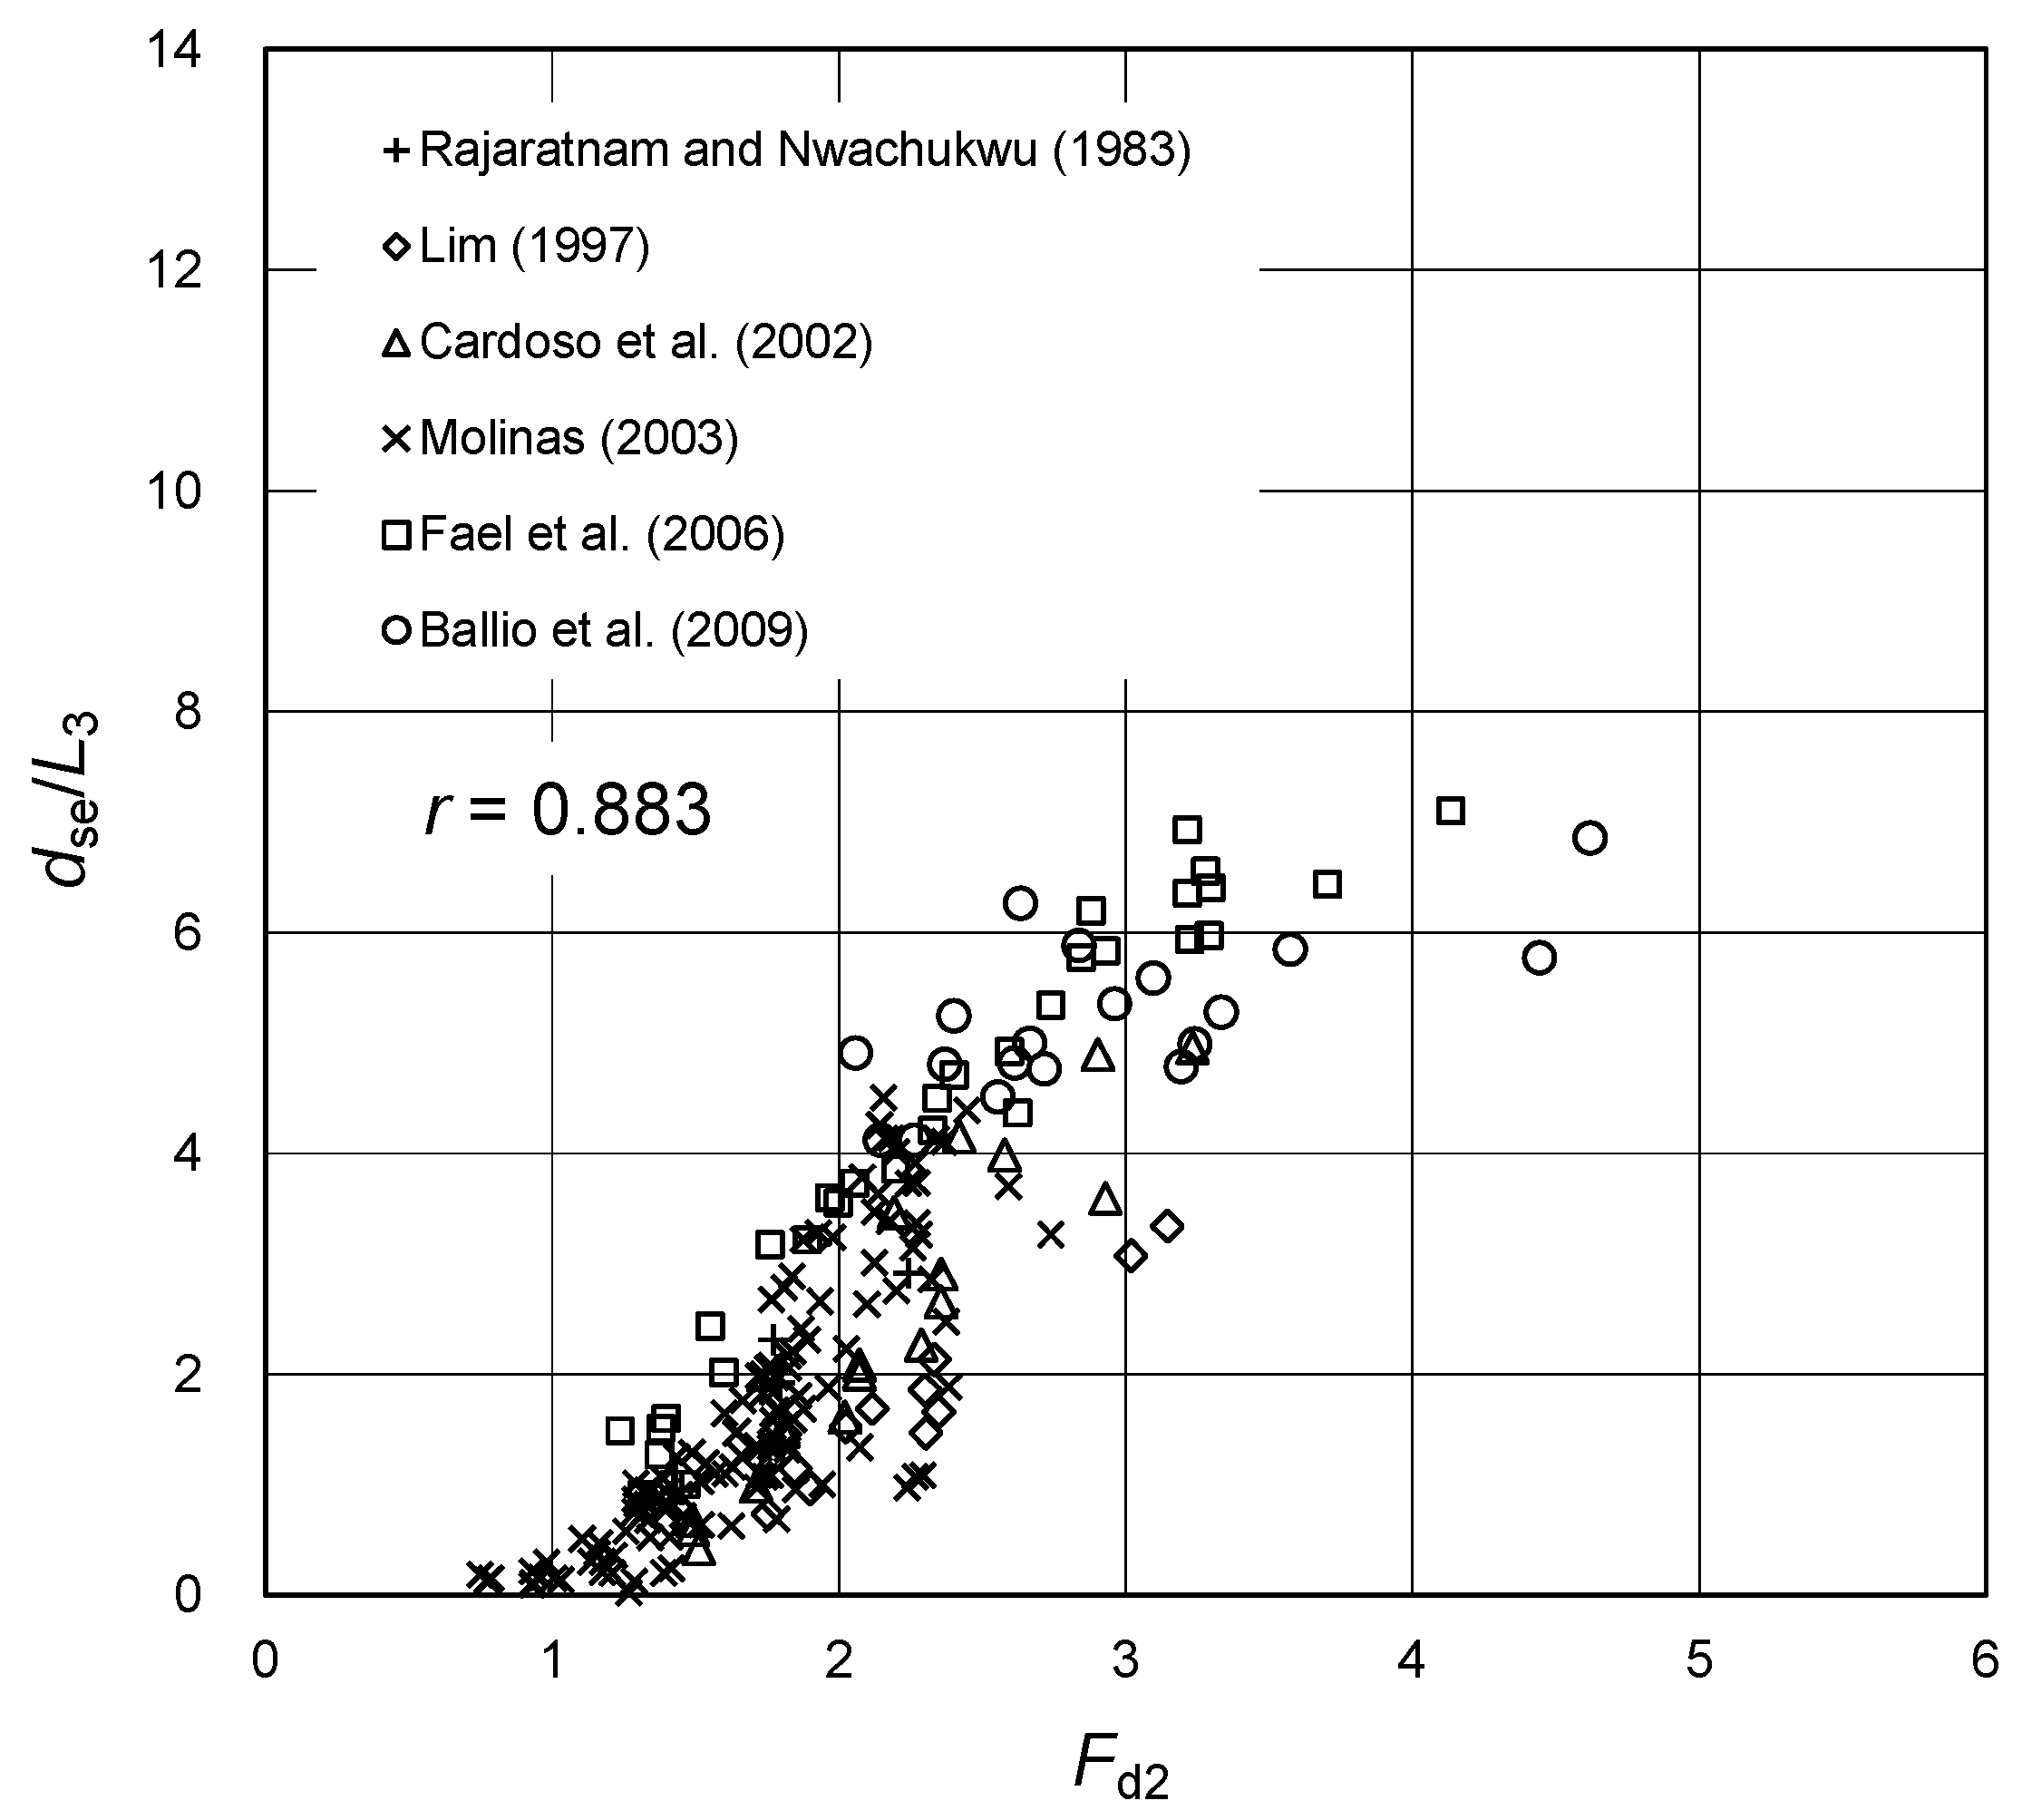
4. Comparisons
5. Discussion
6. Conclusions
Author Contributions
Funding
Acknowledgments
Conflicts of Interest
Notation
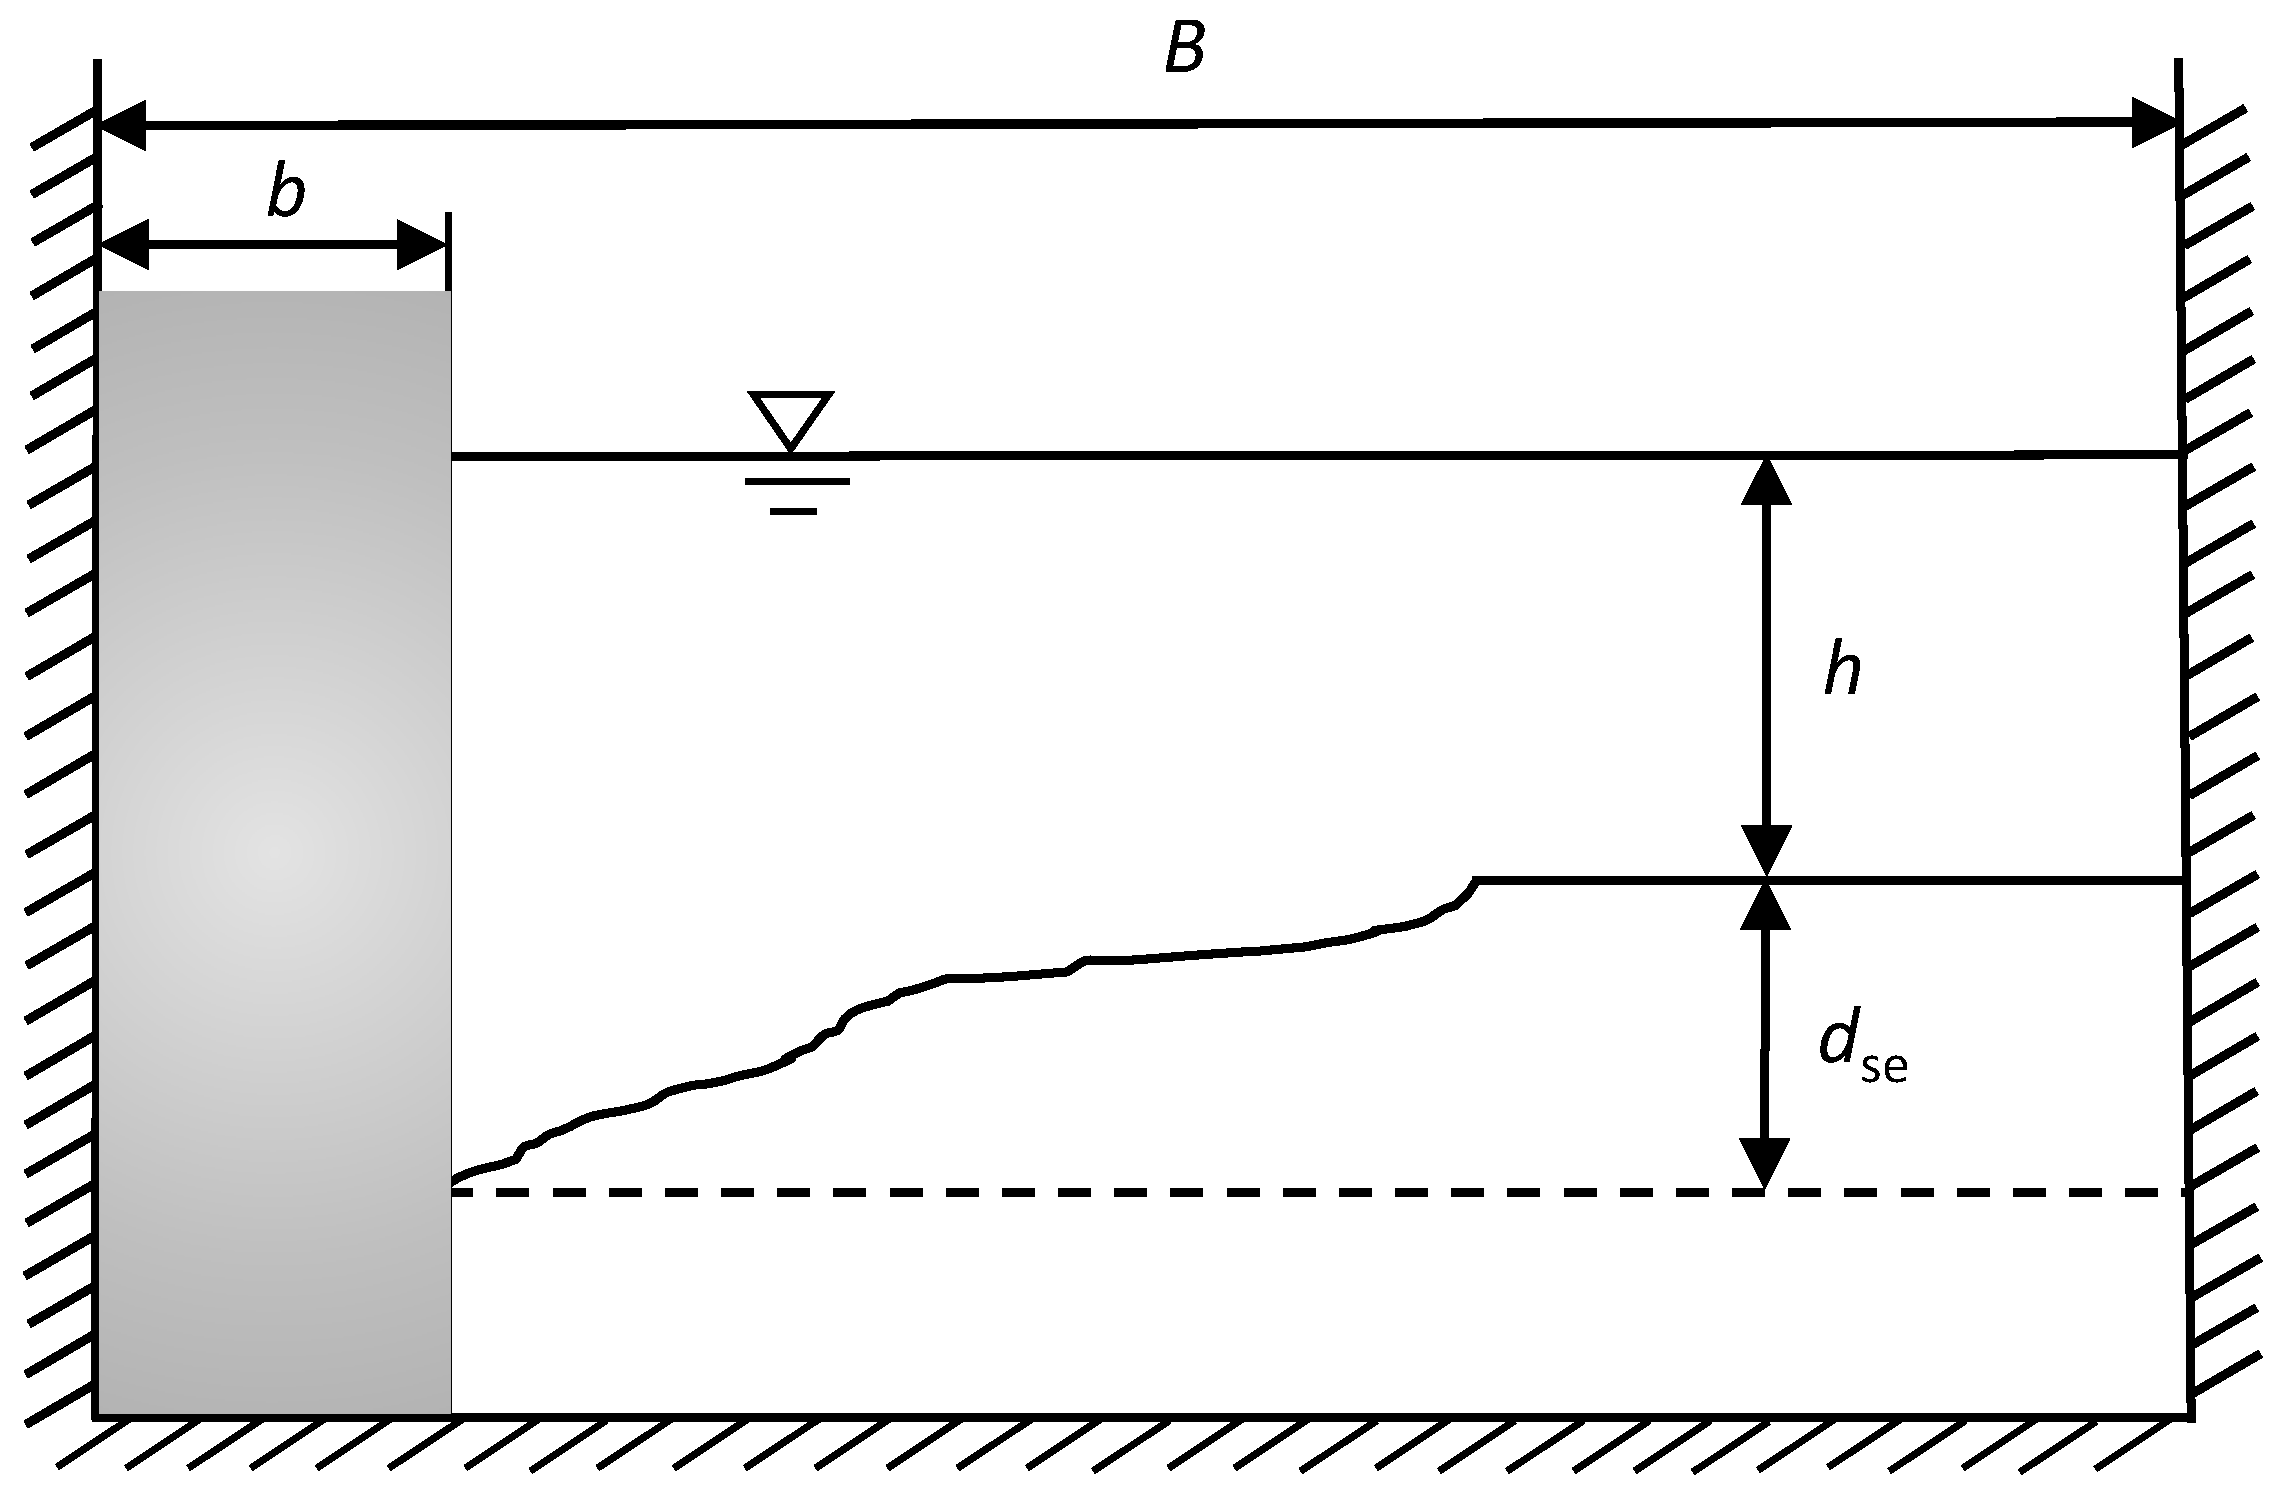
| B | channel width |
| b | transverse abutment length |
| maximum scour depth in scour hole | |
| median diameter of sediment grains | |
| d | pier width |
| g | gravitational acceleration |
| h | flow depth |
| L1~L5 | characteristic length parameters |
| r | correlation coefficient |
| hydraulic radius | |
| U | bulk velocity of approach flow |
| geometric standard deviation of grain diameters | |
| fluid density | |
| grain density |
References
- Richardson, E.V.; Lagasse, P.F.; Schall, J.D.; Ruff, J.F.; Brisbane, T.E.; Frick, D.M. Hydraulic, Erosion and Channel Stability Analysis of the Schoharie Creek Bridge failure, New York; Resources Consultants, Inc.: Fort Collins, CO, USA; Colorado State University: Fort Collins, CO, USA, 1987. [Google Scholar]
- Ettema, R.; Nakato, T.; Muste, M. Estimation of Scour Depth at Bridge Abutments; Transportation Research Board: Washington, DC, USA, 2010. [Google Scholar]
- Lim, S.-Y. Equilibrium clear-water scour around an abutment. J. Hydraul. Eng. 1997, 123, 237–243. [Google Scholar] [CrossRef]
- Kandasamy, J.K.; Melville, B.W. Maximum local scour depth at bridge piers and abutments. J. Hydraul. Res. 1998, 36, 183–198. [Google Scholar] [CrossRef]
- Melville, B.W. Local scour at bridge abutments. J. Hydraul. Eng. 1992, 118, 615–631. [Google Scholar] [CrossRef]
- Melville, B.W. Pier and abutment scour: Integrated approach. J. Hydraul. Eng. 1997, 123, 125–136. [Google Scholar] [CrossRef]
- Kothyari, U.; Raju, K. Scour around spur dikes and bridge abutments. J. Hydraul. Res. 2001, 39, 367–374. [Google Scholar] [CrossRef]
- Oliveto, G.; Hager, W.H. Temporal evolution of clear-water pier and abutment scour. J. Hydraul. Eng. 2002, 128, 811–820. [Google Scholar] [CrossRef]
- Coleman, S.E.; Lauchlan, C.S.; Melville, B.W. Clear-water scour development at bridge abutments. J. Hydraul. Res. 2003, 41, 521–531. [Google Scholar] [CrossRef]
- Garde, R.J.; Subramanya, K.S.; Nambudripad, K.D. Study of scour around spur-dikes. J. Hydraul. Div. 1961, 87, 23–37. [Google Scholar]
- Gill, M.A. Erosion of sand beds around spur dikes. J. Hydraul. Div. 1972, 98, 1587–1602. [Google Scholar]
- Sturm, T.W.; Ettema, R.; Melville, B. Evaluation of bridge-scour research abutment and contraction scour processes and prediction. Washington, D.C. In National Cooperative Highway Research Program; Transportation Research Board of the National Academies: Washington, DC, USA, 2011. [Google Scholar]
- Hong, S.H.; Sturm, T.W.; Stoesser, T. Clear water abutment scour in a compound channel for extreme hydrologic events. J. Hydraul. Eng. 2015, 141, 1–12. [Google Scholar] [CrossRef]
- Cheng, N.-S.; Wei, M. Scaling of scour depth at bridge pier based on characteristic dimension of large-scale vortex. Water 2019, 11, 2458. [Google Scholar] [CrossRef] [Green Version]
- Rajaratnam, N.; Nwachukwu, B.A. Erosion near groin-like structures. J. Hydraul. Res. 1983, 21, 277–287. [Google Scholar] [CrossRef]
- Cardoso, A.H.; Santos, J.S.; Roca, M. Effects of flow intensity, obstacle alignmnet and cross-section geometry on scour at bridge abutments. Int. J. Sediment Res. 2002, 17, 339–340. [Google Scholar]
- Molinas, A. Bridge Scour in Nonuniform Sediment Mixtures and in Cohesive Materials: Synthesis Report; No. FHWA-RD-03-083; Federal Highway Administration: McLean, VA, USA, 2003.
- Fael, C.M.S.; Simarro-Grande, G.; Martín-Vide, J.-P.; Cardoso, A.H. Local scour at vertical-wall abutments under clear-water flow conditions. Water Resour. Res. 2006, 42. [Google Scholar] [CrossRef] [Green Version]
- Ballio, F.; Teruzzi, A.; Radice, A. Constriction effects in clear-water scour at abutments. J. Hydraul. Eng. 2009, 135, 140. [Google Scholar] [CrossRef]
- Tan, S.M.; Lim, S.Y.; Wei, M.X.; Cheng, N.S. Application of particle densimetric froude number for evaluating the maximum culvert scour depth. J. Irrig. Drain. Eng. 2020, 146, 04020020. [Google Scholar] [CrossRef]
- Breusers, H.N.C.; Nicollet, G.; Shen, H.W. Local scour around cylindrical piers. J. Hydraul. Res. 1977, 15, 211–252. [Google Scholar] [CrossRef]
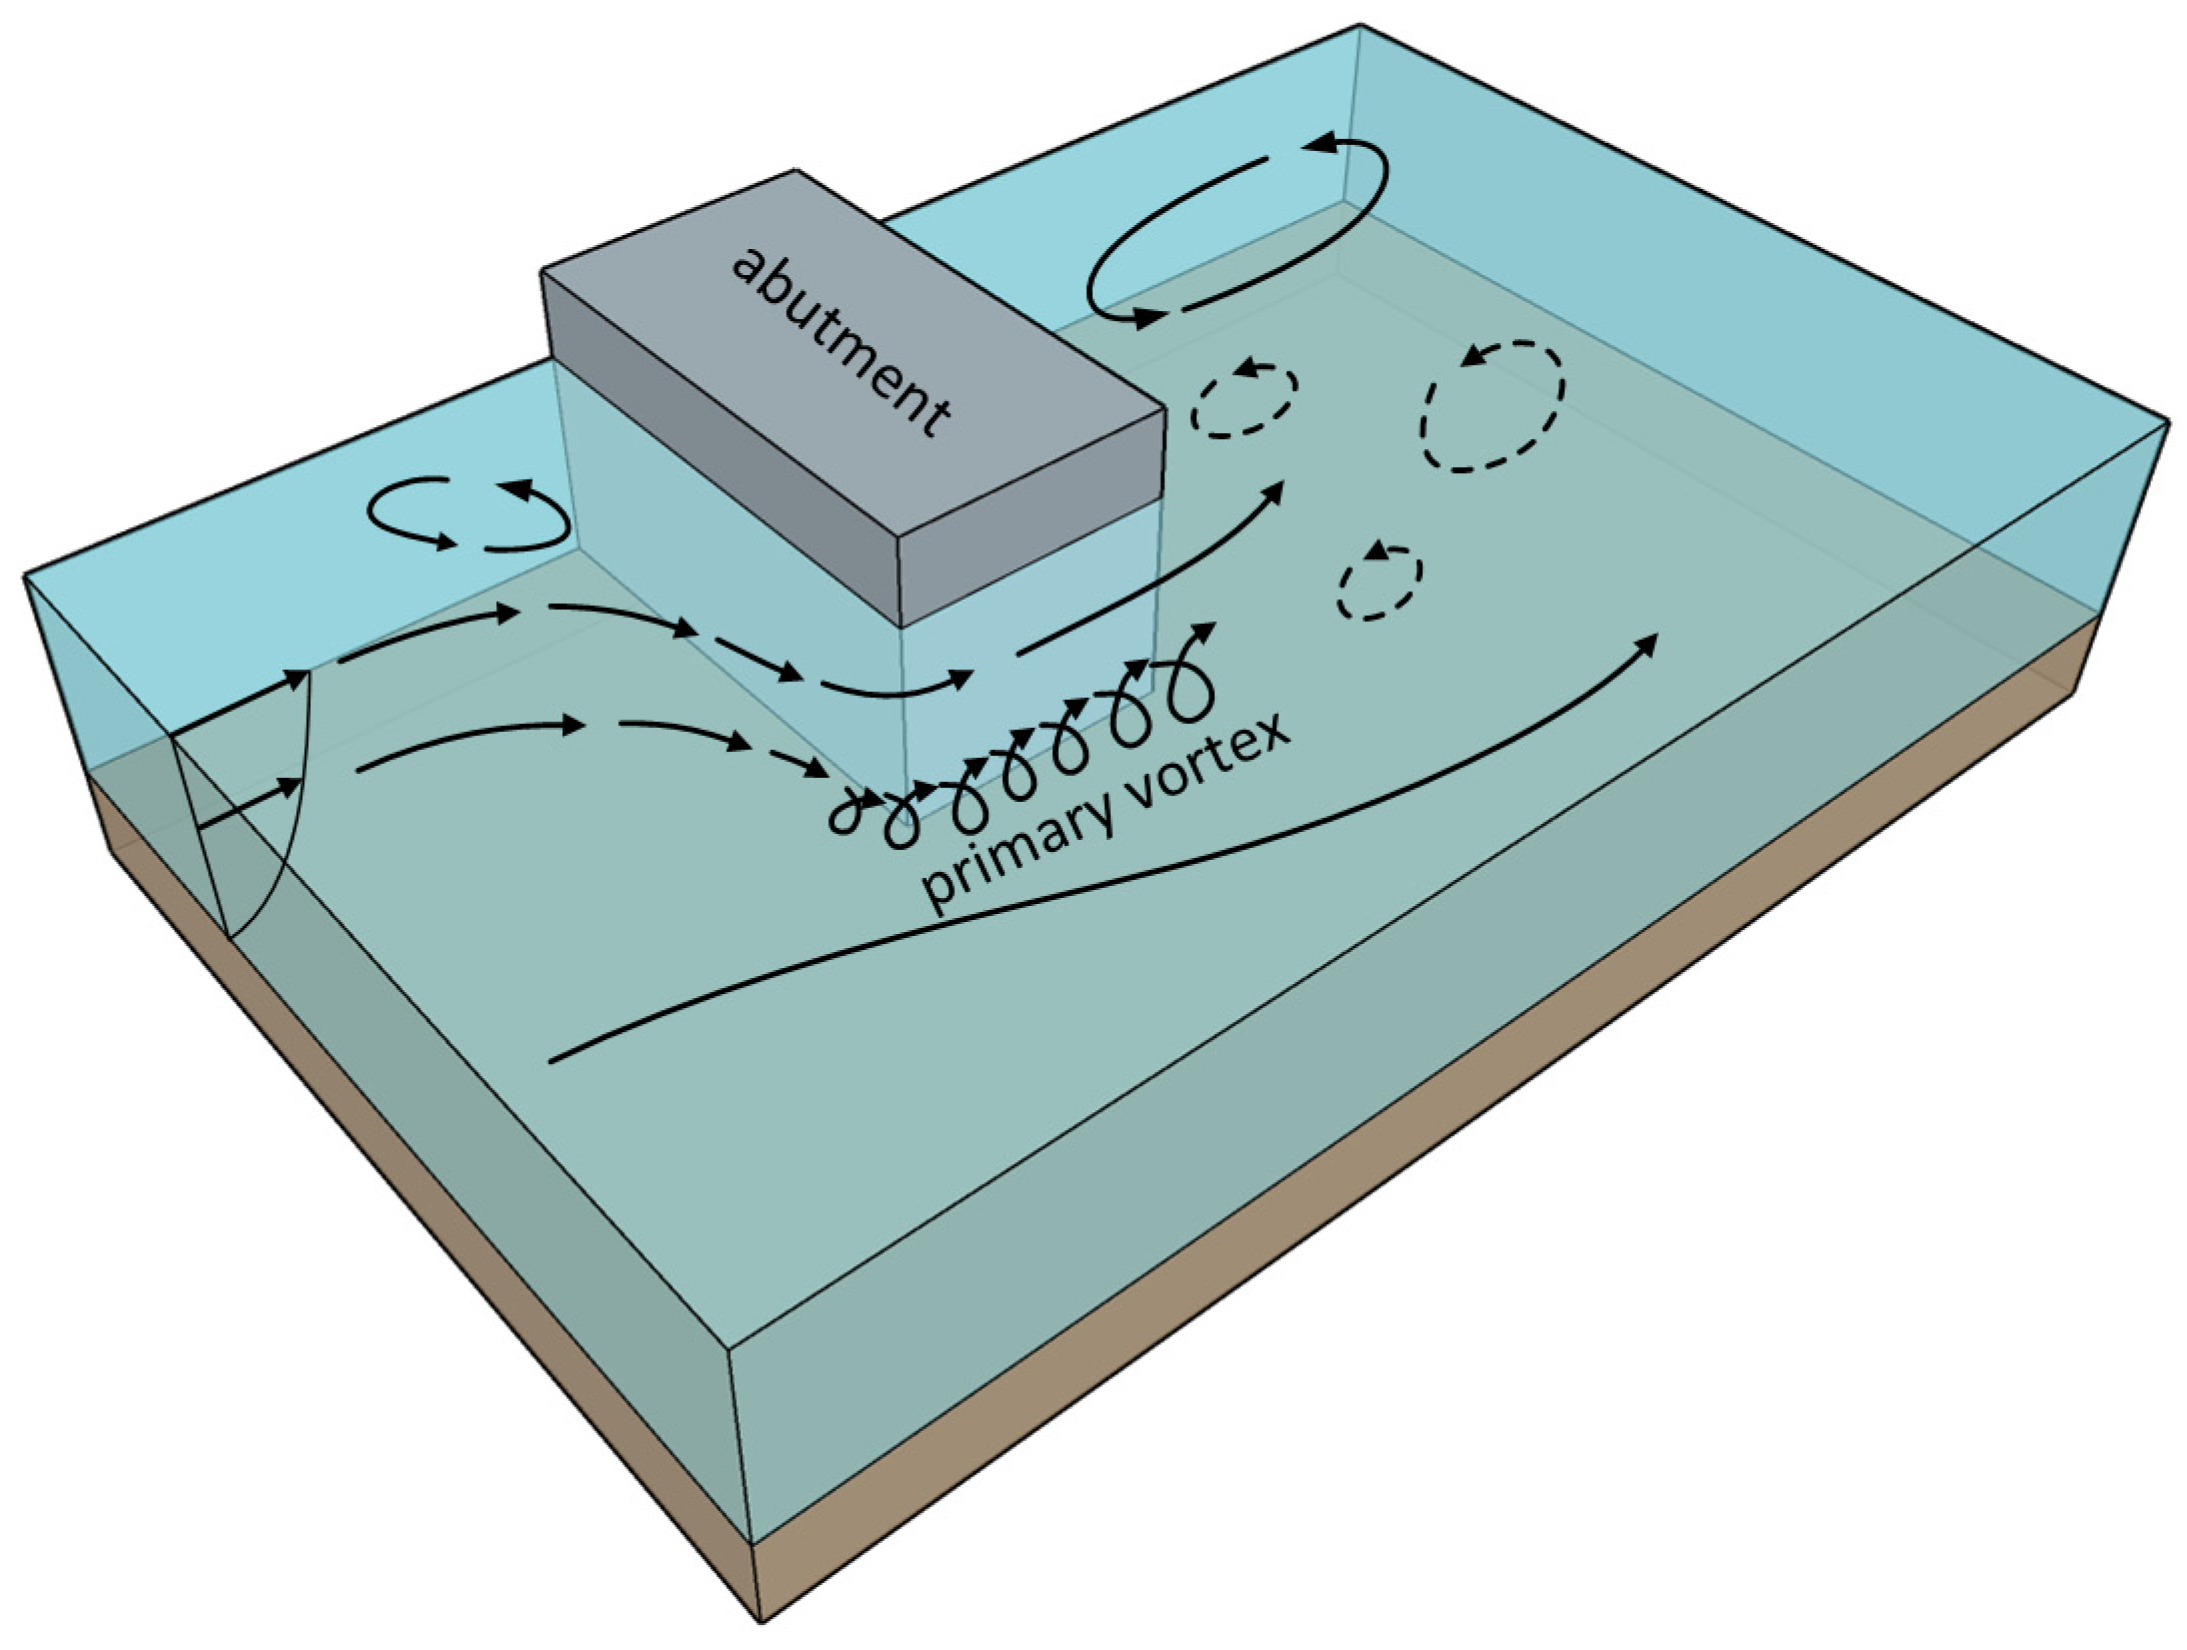
- Simpson, R.L. Junction flows. Annu. Rev. Fluid Mech. 2001, 33, 415–443. [Google Scholar] [CrossRef]
- Unger, J.; Hager, W.H. Down-flow and horseshoe vortex characteristics of sediment embedded bridge piers. Exp. Fluids 2007, 42, 1–19. [Google Scholar] [CrossRef] [Green Version]
- Zhao, M.; Cheng, L.; Zang, Z. Experimental and numerical investigation of local scour around a submerged vertical circular cylinder in steady currents. Coast. Eng. 2010, 57, 709–721. [Google Scholar] [CrossRef]
- Lee, S.O.; Sturm, T.W. Effect of Sediment Size Scaling on Physical Modeling of Bridge Pier Scour. J. Hydraul. Eng. 2009, 135, 793–802. [Google Scholar] [CrossRef]


| Case | Constraint Condition | Length Scale |
|---|---|---|
| 1 | b << h; b << B | |
| 2 | h << b; h << B | |
| 3 | b~h; b << B; h << B | |
| 4 | b~h~B | |
| 5 | b~h~B − b |
| Author | Run | Flow Depth, h (cm) | Transverse Abutment Length, b (cm) | Channel Width, B (cm) | (cm) | Geometric Standard Deviation, | Average Flow Velocity, U (m/s) | Equilibrium Scour Depth, (cm) | b/B | b/h | |
|---|---|---|---|---|---|---|---|---|---|---|---|
| Rajaratnam and Nwachukwu [15] | 1–6 | 10.7–15.4 | 15.2 | 91 | 0.14 | 1.3 * | 0.204–0.320 | 6.3–18.3 | 0.17 | 0.99–1.42 | 109 |
| Lim [3] | S1–S11 | 10–15 | 5–15 | 60 | 0.094 | 1.25 | 0.181–0.325 | 3.6–25.0 | 0.08–0.25 | 0.33–1.00 | 53–160 |
| Cardoso, Santos and Roca [16] | U1–U18 | 6.9–7.1 | 18–50 | 145 | 0.063 | 1.68 | 0.141–0.277 | 2.1–30.8 | 0.12–0.34 | 2.54–7.25 | 286–794 |
| Molinas [17] | Set A | 2.8–15.2 | 2.5–10.2 | 61 | 0.18 | 2.07 | 0.19–0.42 | 0.5–8.3 | 0.04–0.17 | 0.24–2.62 | 14–57 |
| Set B | 2.6–15.2 | 5.1–10.2 | 61 | 0.18 | 1.17 | 0.206–0.463 | 2–14.94 | 0.08–0.17 | 0.43–3.64 | 28–57 | |
| Set C | 3.3–9.3 | 5.1–10.2 | 61 | 0.18 | 3.91 | 0.21–0.443 | 0.3–4.5 | 0.08–0.17 | 0.61–2.68 | 28–57 | |
| Set G | 7.3–9.8 | 5.1–10.2 | 61 | 0.18 | 1.3 | 0.135–0.304 | 0.1–11.9 | 0.08–0.17 | 0.61–1.12 | 65–131 | |
| Fael, Simarro-Grande, Martín-Vide and Cardoso [18] | S.1–S.31 | 5.1–7.2 | 64–186 | 400 | 0.128 | 1.46 | 0.123–0.385 | 6.7–42.6 | 0.16–0.47 | 8.89–36.47 | 617–1453 |
| Ballio, Teruzzi and Radice [19] | A10–D51 | 9.0–18.3 | 5.0–20.5 | 15–193 | 0.19–0.5 | 1.3 | 0.45–0.72 | 13.4–47 | 0.1–0.51 | 0.54–2.07 | 10–108 |
| Author | ||||||
|---|---|---|---|---|---|---|
| Rajaratnam and Nwachukwu [15] | 0.41–1.20 | 0.54–1.71 | 0.95–2.91 | 1.09–3.31 | 1.12–3.39 | 1.43–2.24 |
| Lim [3] | 0.57–1.67 | 0.24–1.67 | 0.73–3.33 | 0.92–4.17 | 0.98–4.44 | 1.75–3.14 |
| Cardoso, Santos and Roca [16] | 0.09–1.17 | 0.30–4.34 | 0.42–4.95 | 0.45–5.38 | 0.45–5.60 | 1.49–3.23 |
| Molinas [17] | 0.01–2.30 | 0.01–3.06 | 0.21–4.50 | 0.02–4.87 | 0.03–4.93 | 0.75–2.74 |
| Fael, Simarro-Grande, Martín-Vide and Cardoso [18] | 0.04–0.46 | 0.86–6.87 | 0.90–7.10 | 0.93–7.31 | 0.95–7.50 | 1.23–4.13 |
| Ballio, Teruzzi and Radice [19] | 1.82–3.42 | 1.44–4.56 | 4.12–6.86 | 4.39–9.21 | 4.40–11.68 | 2.06–4.62 |
Publisher’s Note: MDPI stays neutral with regard to jurisdictional claims in published maps and institutional affiliations. |
© 2020 by the authors. Licensee MDPI, Basel, Switzerland. This article is an open access article distributed under the terms and conditions of the Creative Commons Attribution (CC BY) license (http://creativecommons.org/licenses/by/4.0/).
Share and Cite
Xu, P.; Cheng, N.; Wei, M. Length Parameter for Scaling Abutment Scour Depth. Water 2020, 12, 3508. https://doi.org/10.3390/w12123508
Xu P, Cheng N, Wei M. Length Parameter for Scaling Abutment Scour Depth. Water. 2020; 12(12):3508. https://doi.org/10.3390/w12123508
Chicago/Turabian StyleXu, Puer, Niansheng Cheng, and Maoxing Wei. 2020. "Length Parameter for Scaling Abutment Scour Depth" Water 12, no. 12: 3508. https://doi.org/10.3390/w12123508
APA StyleXu, P., Cheng, N., & Wei, M. (2020). Length Parameter for Scaling Abutment Scour Depth. Water, 12(12), 3508. https://doi.org/10.3390/w12123508