Article

Downscaling Regional Hydrological Forecast for Operational Use in Local Early Warning: HYPE Models in the Sirba River

1
DIST (Interuniversity Department of Regional and Urban Studies and Planning), Politecnico di Torino & Università di Torino, 10129 Torino, Italy
2
Istituto per la BioEconomia—Consiglio Nazionale delle Ricerche (IBE-CNR), Via Madonna del Piano 10, 50019 Sesto Fiorentino, Italy
3
Swedish Meteorological and Hydrological Institute (SMHI), Folkborgsvagen 17, 601 76 Norrkoping, Sweden
4
AGRHYMET Regional Centre for Agronomy, Hydrology and Meteorology, Niamey P.O. 1011, Niger
5
Direction de l’Hydrologie (DH), Ministère de l’Hydraulique et de l’Assainissement du Niger, Niamey B.P. 257, Niger
6
DIATI (Department of Environment, Land and Infrastructure Engineering), Politecnico di Torino, 10129 Torino, Italy
*
Author to whom correspondence should be addressed.
Water 2020, 12(12), 3504; https://doi.org/10.3390/w12123504
Submission received: 13 November 2020 / Revised: 11 December 2020 / Accepted: 12 December 2020 / Published: 13 December 2020

Abstract

:
In the last decades since the dramatic increase in flood frequency and magnitude, floods have become a crucial problem in West Africa. National and international authorities concentrate efforts on developing early warning systems (EWS) to deliver flood alerts and prevent loss of lives and damages. Usually, regional EWS are based on hydrological modeling, while local EWS adopt field observations. This study aims to integrate outputs from two regional hydrological models—Niger HYPE (NH) and World-Wide HYPE (WWH)—in a local EWS developed for the Sirba River. Sirba is the major tributary of Middle Niger River Basin and is supported by a local EWS since June 2019. Model evaluation indices were computed with 5-day forecasts demonstrating a better performance of NH (Nash–Sutcliffe efficiency NSE = 0.58) than WWH (NSE = 0.10) and the need of output optimization. The optimization conducted with a linear regression post-processing technique improves performance significantly to “very good” for NH (Heidke skill score HSS = 0.53) and “good” for WWH (HSS = 0.28). HYPE outputs allow to extend local EWS warning lead-time up to 10 days. Since the transfer informatic environment is not yet a mature operational system 10–20% of forecasts were unfortunately not produced in 2019, impacting operational availability.

1. Introduction

Recent changes in hydrological processes resulted in a dramatic increase of flood events in West Africa [1,2]. Several authors documented such changes and particularly the Sahelian paradox observed in South-West Niger [3,4]. Hydrological studies over the last 20 years in the region show a runoff decrease in the Sudano–Guinean catchments and an increase in the Sahelian ones [5,6,7]. The causes of hydrological changes in the Sahelian area are highly debated among scientists and probably rather than from a single factor they can derive from the interaction of several drivers [8]. Among them, the most acknowledged are the recent recovery of rainfall in the Sahel, even if below the pre-1970 levels, the increased occurrence of extreme rainfall events, and the strong soil and vegetation degradation [9,10,11,12]. The reduced water-holding capacity of the soil leads to greater and faster runoff increasing both erosion and river flows [3].
In the last decade, the increase, both in terms of frequency and intensity [13], of extreme flood events together with the demographic growth have produced significant and unprecedented damage to populations [14]. These catastrophic events prompted governments to seek support from the international community to develop early warning systems (EWS) aiming to increase preparedness of local communities.
Some experiences of EWSs developed with a community-based approach have been documented in developing countries, where communities are active participants in the design, monitoring and management of the EWS [15] [16,17,18,19]. EWSs, as defined by the United Nations International Strategy for Disasters Reduction, are based on four pillars: (1) risk knowledge, (2) risk monitoring and warning, (3) risk information dissemination and communication, and (4) response capacity. Among these pillars, risk monitoring and warning has been addressed in recent years at global [20,21,22] continental [23,24] or river basin [25] levels developing hydrological models that allow lead times much longer than those obtainable with local observations [15]. Despite these improvements, in situ measured hydrological data are often considered more reliable then hydrological model outputs for operational applications, particularly if coupled with hydraulic propagation models [26]. Nevertheless, EWSs based only on in-situ measures are limited in forecasting time (propagation time limited to a few days), timeliness (lack of availability of real time observations) and coverage (low density of gauging stations) being able to save lives but not assets or livelihoods [27].
The integration of hydrological modeling with in-situ measures and hydraulic modeling has recently been successfully tested in Niger on the Sirba River [28]. In such a context of poorly gauged basins, where hydrological models cannot be adequately calibrated, hydrological forecasts are nevertheless useful to timely activate the pre-warning tasks while operational warnings were delivered in the case of threshold overpassing in the upstream field observations linked to flood scenarios developed with ad-hoc hydraulic models [29]. Nevertheless, the longer lead times ensured by the hydrological forecasts application underline the importance of downscaling and optimizing models’ outputs to improve the performances and ensure a higher reliability of the local early warning systems [30].
The objective of this study is to downscale, optimize and evaluate hydrological forecasts from the FANFAR system [31], specifically provided by the models Niger HYPE 2.23 (NH) and World-Wide HYPE 1.3.6 (WWH), for the application in local EWS of the Sirba River.
This work is structured as follows: Section 2 focuses on the study area, hydrology, EWS and hydrological model features. Section 3 defines the methodology adopted. Section 4 and Section 5 describe the results and discuss the importance of the research. Section 6 contains the conclusions and introduces some possible future perspectives of this study.

2. Materials

2.1. Study Area

Sirba River is the main tributary of the Middle Niger River Basin covering an area of 39,000 km2 shared between Burkina Faso and Niger. The morphology of the basin is characterized by very slight height variation (from 444 m a.s.l. to 181 m a.s.l.) laying on a granitic substrate. Climate is Sahelian with a unimodal distribution of rainfall from June to September averaging from 400 mm/year in the northern part to 700 mm/year in the southern one [32]. Rainfall distribution along the rainy season is inhomogeneous with persistent dry spells and extreme rainfall events [33] strongly affecting the hydrology of the Sirba River [13].
Within the Sirba basin, the study area covers the Nigerien reach of 108 km from the Burkina-Niger border to the confluence with the Niger River (Figure 1).
In the last 20 years, the riverine communities (97 settlements with 61,703 people, belonging to 7732 households) have been repeatedly affected by Sirba floods [26,34,35]. The flood events caused tremendous damage to livelihoods (mainly related to family subsistence agriculture), infrastructures and private buildings (mainly clay houses).
The Sirba River is gauged with some hydrometers in Burkina Faso including three major stations (Bassieri, Liptougou and Sebba) on the three tributaries (Koulouko, Faga and Yali rivers) and two stations in Niger in the main watercourse (Garbey Kourou and Bossey Bangou). Garbey Kourou (GK) is located 8 km upstream the confluence Sirba-Niger and was installed in 1956 for the Sirba flow characterization while Bossey Bangou (BB) was installed in 2018 few kilometers downstream Niger-Burkina border by ANADIA2.0 Project to ensure EWS tasks. Both Nigerien stations are managed by General Directorate for Water Resources and are equipped with staff gauges and pressure devices (SEBA PS Ligth-2®) sending data with hourly time step with GSM paradigms.

2.2. Sirba Hydrology and Observed Flow Series

Sirba is a classical Sahelian river, dry for 7–8 months and rapidly activated by the first rains in June. Flood peaks generated by rainfall events occur generally between August and September.
The hydrological behavior of the Sirba River has been recently analyzed using the discharge time series of the Garbey Kourou gauging station from the installation in 1956 until 2019. The analysis of the annual maximum discharge results in a clear non-stationary distribution with clear positive trend [13,25]. According to the changes in rainfall time series [33], two changepoints have been detected on annual maximum trend: 1968 (the end of the wet period) and 1989 (the end of the dry period. A third breakpoint was detected in 2008, starting a new period of extreme floods [13]. This change is in line with the increase of extreme daily rainfall occurrence [3,9].
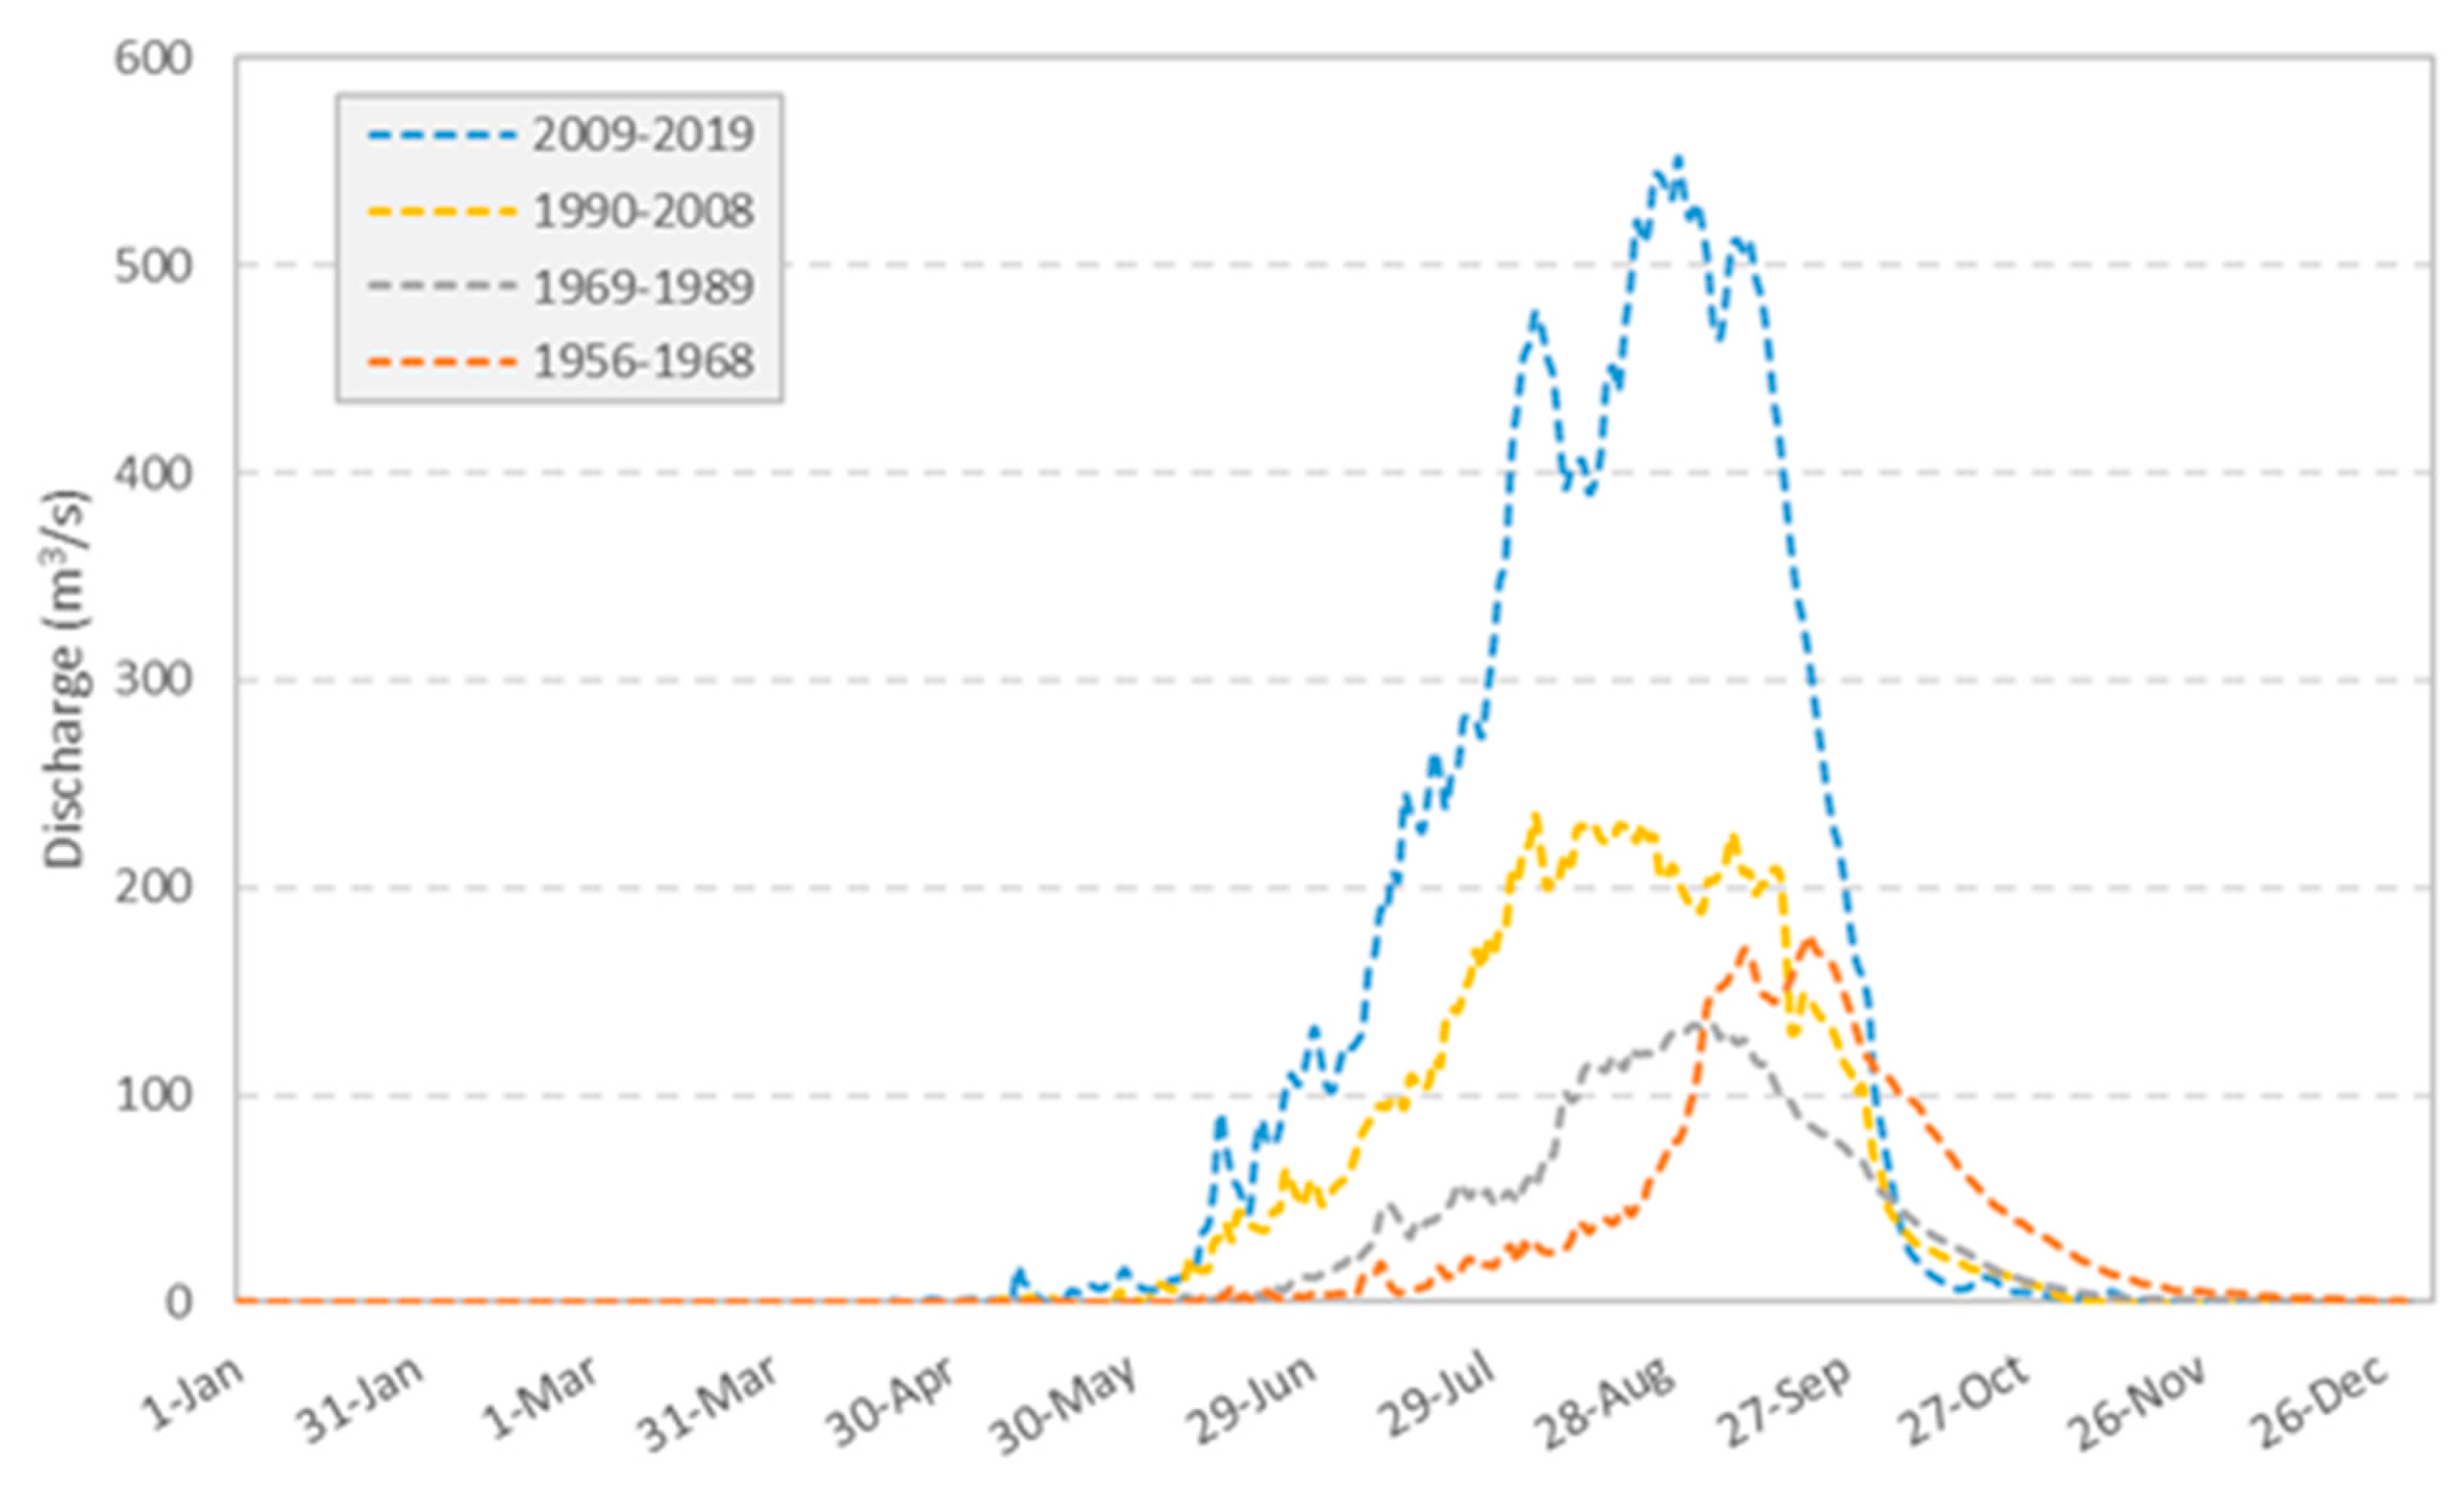
The mean hydrographs (Figure 2) clearly show the deep changes of the Sirba hydrology in the four hydrologic periods. The first period (1956–1968) usually considered the reference period shows a flow season with maximum flow in the month of September of about 180 m3/s and a mean flow of 26 m3/s. The second period (1969–1989) clearly shows the effects of minor rainfalls in a lowering in the mean annual flow (23 m3/s) and in the earliest flow season that reach the flow peaks (130 m3/s) in the month of August. The third period (1990–2008) reveals the effects of “Sahelian Paradox” [4] in the Sirba Basin with peaks (220 m3/s) and mean flow (47 m3/s) higher than the first period. The fourth period (2009–2019) highlights a completely different hydrologic behavior of the Sirba River with a mean flow that doubled (100 m3/s) and an unprecedent annual maximum flow (550 m3/s).

2.3. SLAPIS: the Sirba EWS

SLAPIS is an integrated flood EWS aiming to promote decision-making and behavioral shift from reactive to proactive action at several levels, from the community to the administration. It addresses all four EWS components [36], while also being community and impact-based [28]. Risk knowledge is addressed through participatory risk assessment and identification of flood hazard scenarios and potential impacts [29] connecting the available technical capabilities with the local level through a participatory approach. The monitoring and warning component integrates existing hydrological models, real time measurements and qualitative observations into hydrological warnings based on four color-coded classes [26] bridging the gap between top-down and bottom-up approaches. Moreover, the integration of hydrological forecasts and observations with the community monitoring and preparedness system provides a lead time suitable for operational decision-making at national and local levels. The dissemination component was accomplished with the national alert code, involving stakeholders from national to local level and building on multiple communication channels [28]. Response capability builds on the existing local volunteer system, local participatory adaptation, and contingency planning [29]. This allows the beneficiaries to define the rules of the whole system, strengthening their ability to understand the information and react.
Particularly concerning the monitoring and warning components, two hydrological models have been considered for the EWS development: GloFAS and HYPE. GloFAS is a probabilistic global hydrological model developed by the European Commission Joint Research Center. GloFAS version 2.1 has been optimized on the Sirba River applying correction factors to model outputs because of the poor reliability of the original forecasts on local application. The optimization ensured a substantial improvement in forecast accuracy (particularly the shape of the forecasted hydrograph rather than its intensity) [30] allowing optimized GloFAS 2.1 to be used in the EWS platform for the Sirba River as pre-warning, while warnings will only be sent using the in-situ measurements.
SLAPIS is empowered by an information system that has been designed to collect observed data as well as forecast data, supplying optimization models and disseminating results to be used in local EWS. SLAPIS is operational from June 2019 at www.slapis-niger.org [37].

2.4. The FANFAR System, HYPE Models and Forecasted Streamflow

FANFAR is a regional flood forecasting and alert system at West African scale [31]. It is motivated by the increase in flood challenges not only in the Sirba River, but throughout West Africa in recent years. FANFAR stems from ten years of cooperation between West African and European scientists and practitioners. The system is built and continuously refined through a participatory co-design, co-development, and co-operation process involving more than 30 national and regional organizations from 17 countries (Benin, Burkina Faso, Cape Verde, Chad, Gambia, Ghana, Guinea, Guinea Bissau, Ivory Coast, Liberia, Mali, Mauritania, Niger, Nigeria, Senegal, Sierra Leone, and Togo) [38].
FANFAR is a pilot operational system providing openly accessible hydrological forecasts with a 10-day outlook on catchment resolution at https://fanfar.eu/ [39]. The system employs a daily forecasting chain centered on the two hydrological models Niger HYPE (NH) [40] and World-Wide HYPE (WWH) [22], as well as tailored versions of these models [41]. Both models are based on the HYPE open-source code (https://hypeweb.smhi.se/model-water/) but differ substantially in their setup and characteristics. The NH model was set up and calibrated to simulate daily hydrological dynamics of the Niger River basin and incorporates tailored components for specific hydrological features important in the region (the Inner Niger Delta and soil flow paths adapted to represent Sahelian conditions). The WWH, on the other hand, was developed aiming to represent global water dynamics on monthly resolution, without specific tailoring to any region. The NH and WWH models are driven by the HydroGFD meteorological data set, which is a combination of global operational forecast models, reanalysis models and gridded observations [42,43]. The simulated streamflow representing Garbey Kourou and Bossey Bangou in each model have been used. Bossey Bangou was however not available in NH, and therefore its streamflow was approximated with the inflows of upstream sub-basins. More details on the models and data used are provided in Table 1.

2.5. Hazard Thresholds

The Sirba River was characterized by hazard thresholds from the SLAPIS EWS and the two hydrological models (NH and WWH) acting on the basin. Thresholds have in common the three scale (frequent, severe, and catastrophic floods) and the color of the scenarios (yellow, orange, and red) but differs in return period and flow rate.
For the hydrological models (Niger HYPE and World-Wide HYPE) the flood hazard and severity levels are determined through a threshold exceedance approach. The thresholds are currently based on exceeding the 2, 5, and 30 years return period magnitudes determined individually for each sub-basin using extreme value analysis on a long historical simulation with each model version [25]. The SLAPIS hazard thresholds were defined according to both the observed flows and field effects on the main riverine communities [26]. From the hydrologic point of view these thresholds were related to: (1) the mean flow hydrology (flow duration curves), (2) the return period analysis based on annual maximum and (3) the non-stationary return period analysis according the hydrologic changes [44]. The specific thresholds used in SLAPIS and FANFAR at Garbey Kourou are presented in Table 2.

3. Methods

The methodology applied in this study consists of three steps: (1) an evaluation of the original forecast performances, (2) an optimization of model outputs to improve forecast reliability and (3) an evaluation of optimized forecasts to quantify the improvements reached in the post processing procedures [30].
Other methodologies adopted in this research are related to hydraulics and informatic domain. Hydraulic modeling has been fundamental for the translation of flood wave computation to define the forecast in Bossey Bangou from the upstream sub-basins according to the results of Massazza et al. 2019 [26]. Since NH does not have a sub-basin in BB this forecast was built with the sum of the outputs in the three upstream tributaries that covers 97% of the upstream basin. According to the channel length and the flood wave velocity of 0.93 m/s [26] forecasts were shifted by one day (flood wave translation time in the three tributaries equal to 19.4, 23.6 and 23.8 h). Informatic procedures have been used to daily download the HYPE forecasts and the visualization in the SLAPIS platform after post-processing according to the optimization results. SLAPIS architecture has been developed based on several open-source technologies and software components that have been implemented following service oriented architecture paradigms [45] and international standards for geographical information management.

3.1. Model Evaluation

The model evaluation is based on continuous and categorical indices and operational availability of the forecast.
Continuous indices are used to evaluate the fitting between observed and forecasted flows (Table 3). The discharge was analyzed like a continuous variable with three different indices: (1) the root mean square error (RMSE) to identify the mean gap, in absolute value, between forecasts and observations, (2) the RMSE observations standard deviation ratio (RSR) consist in the normalization of RMSE with the standard deviation of observations and 3) the Nash–Sutcliffe efficiency (NSE) index is a normalized statistic that identifies the ratio between the residual variance and the measured data variance [46,47,48].
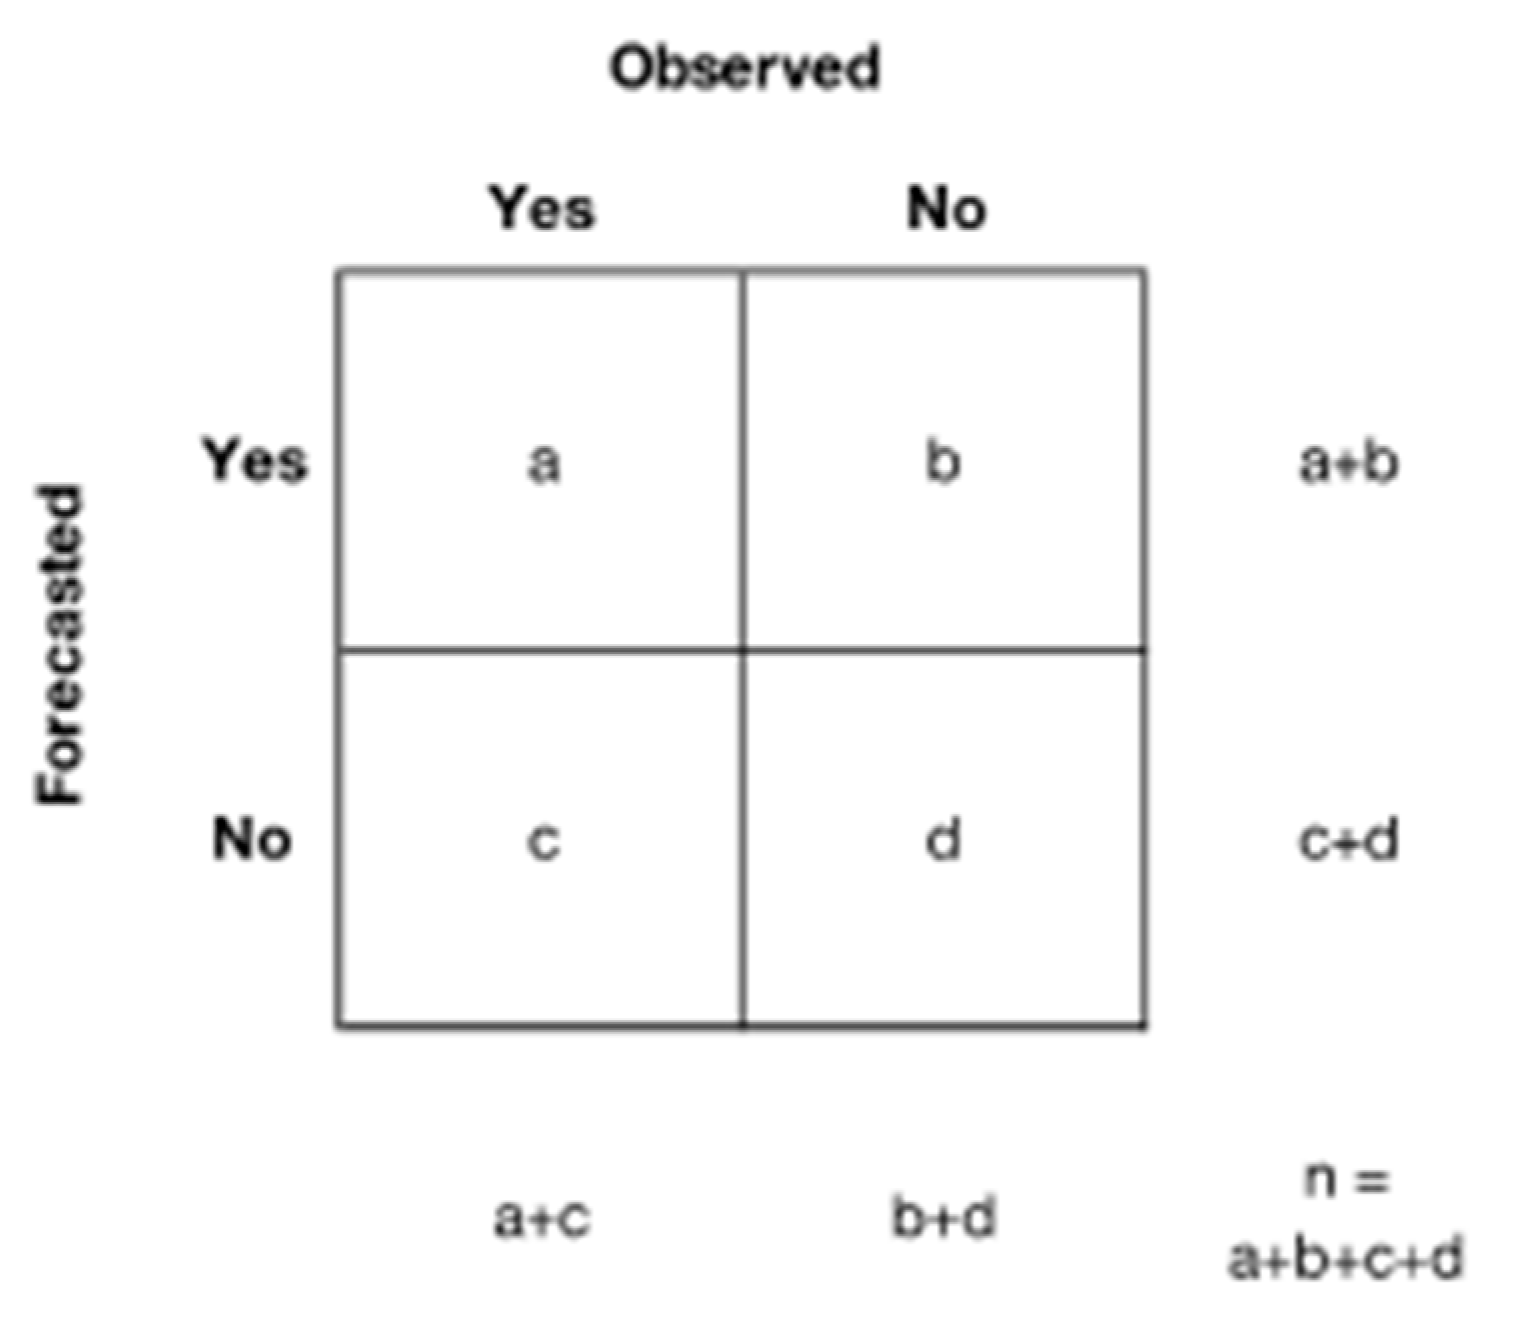
Categorical indices are used to evaluate the reliability of the forecast in terms of predicting flood events. The discharge was compared to a specific threshold and became a dichotomous variable of type “yes” or “no” referring to the specific “threshold exceeding” event. Contingency table of Figure 3 identifies the number of “a = hits”, “b = false alarms”, “c = misses”, and “d = correct negatives” [20,46,49].
Usually, the thresholds are defined according to the hazard thresholds used for EWS (Table 2). However, since the yellow threshold for SLAPIS (600 m3/s) was never exceeded in the 2019 hydrological year, the decision to consider the flow of 450 m3/s for categorical indices computation was taken in order to analyze a sufficient number of events. This discharge has been overpassed 18 days at Bossey Bangou and 16 days at Garbey Kourou hydrometers in the hydrological year 2019 compared with the 15 days defined for the yellow threshold in the mean hydrologic year [26].
The indices used (Table 4) are bias (BIAS), probability of detection (POD), false alarm rate (FAR), percent correct (PC), threat score (TS), and Heidke skill score (HSS).
Operational availability is an index used to quantify how many forecasts were produced and made available until 23:59 UTC for each issue date. Since the SLAPIS EWS is required to publish the new forecast every day and the hydrological forecasts come from another system, it is very important that forecasts are constantly delivered in the same format and timing to be correctly used. This index is simply a measure of the forecast integrity that could be limited by problems at the production level, informatic supply chain or user level [46]. The score is computed with the ratio of available forecasts on the whole number of forecasts expressed as a percentage.

3.2. Model Optimization

Optimization procedures reveal a fundamental importance to adapt the results at the boundary conditions in many different domains [50,51]. In the hydrologic field usually, an optimization was conducted varying the sensitive model parameters in feasible domain to reduce the gap between forecasted and observed flows [52,53,54]. In this case of study, because of the need for local optimization of hydrological outputs, authors chose to adapt the outputs as a post-processing procedure in order to improve outputs at local level without affecting the forecast reliability outside the study area. Therefore, the optimization was developed from the user and not from the developer point of view. Moreover, the optimization process was hydrologically oriented on homogeneous periods of the wet season that were separately analyzed [28].
The hydrological year was divided in twelve periods according to river hydrology [13]. The dry season (November to May) was considered into a unique interval. The low-flow months (June and October) were considered with a monthly time frame, whereas the months with medium-high flows (July, August, and September) were optimized with a ten days’ time frame. The probability occurrence evaluation was conducted on the last hydrological period (2009–2019). The flood days were identified in the days when the mean discharges exceeded the yellow threshold (600 m3/s). This analysis shows that all the flood events occurred between 21 July and 30 September and the 92.4% of threshold exceeding are between 1 August and 20 September (Table 5).
The optimization process was conducted as a volumetric scaling with a linear regression technique based on six different equations (1st, 2nd, 3rd, 4th, 5th polynomial functions and logarithmic). The coefficients of the linear regression models were estimated on each period with the ordinary least squares (OLS) method based on 5-day forecasts [55]. The objective function is the maximization of R2 between the observed flow and the forecast optimized with the linear regression model [28]. The coefficients respect the statistical tests of Newey–West heteroskedasticity and autocorrelation and are significantly different from zero at the 0.05 level [48,56]. R2 reach values between 0.29 and 0.84 (mean = 0.48) for WWH and between 0.26 and 0.68 (mean = 0.37) for NH model. The R2 values are affected by the scattered forecasted values originated from the regional models and the rejection of the statistical tests.
The optimization was conducted on the reference 5-day forecast. This forecast horizon was chosen because it is the middle of the forecast time and was a time sufficiently longer to activate the pre-waring tasks on the field [29]. In the optimization, the dataset was divided in two parts, the first part for the training and the second part for the validation. To increase the training period, all years except the last have been used for training (2016–2018 for NH and 2017–2018 for WWH) and the forecast validation, made with the same indices of Section 3.1, was conducted on the hydrological year 2019.
In the following section the acronyms NH, WWH, NHOTT and WWHOTT will be used to indicate the original and optimized versions of the forecast.

4. Results

4.1. Forecast Performances

The results consider the observed flow and the four forecasted series (NH, WWH, NHOTT and WWHOTT) at a 5-day forecast horizon.
The results of Table 6 and Figure 4, Figure 5, Figure 6 and Figure 7 show the performance for the GK station. The results for BB are not shown since: (1) the short flow time series of BB does not allow a sufficient background and (2) these results are quite closer for BB and GK. The results of Table 7 instead show the mean performances in the two gauging stations to evaluate the overall performances of hydrological forecasts on the Sirba EWS that present some differences in the two stations. Tables and figures with the overall results are presented for completeness in Appendix A.
The preliminary analysis based on the basic statistical parameters demonstrates that while NH correctly identifies the magnitude of minimum, mean and maximum flows WWH values are quite underestimated (Table 6). After the optimization process the indices demonstrate that both NHOTT and WWHOTT are overestimated. The behavior is quite different for the two models, while NHOTT overestimates maximum more than the mean, WWHOTT does the contrary.
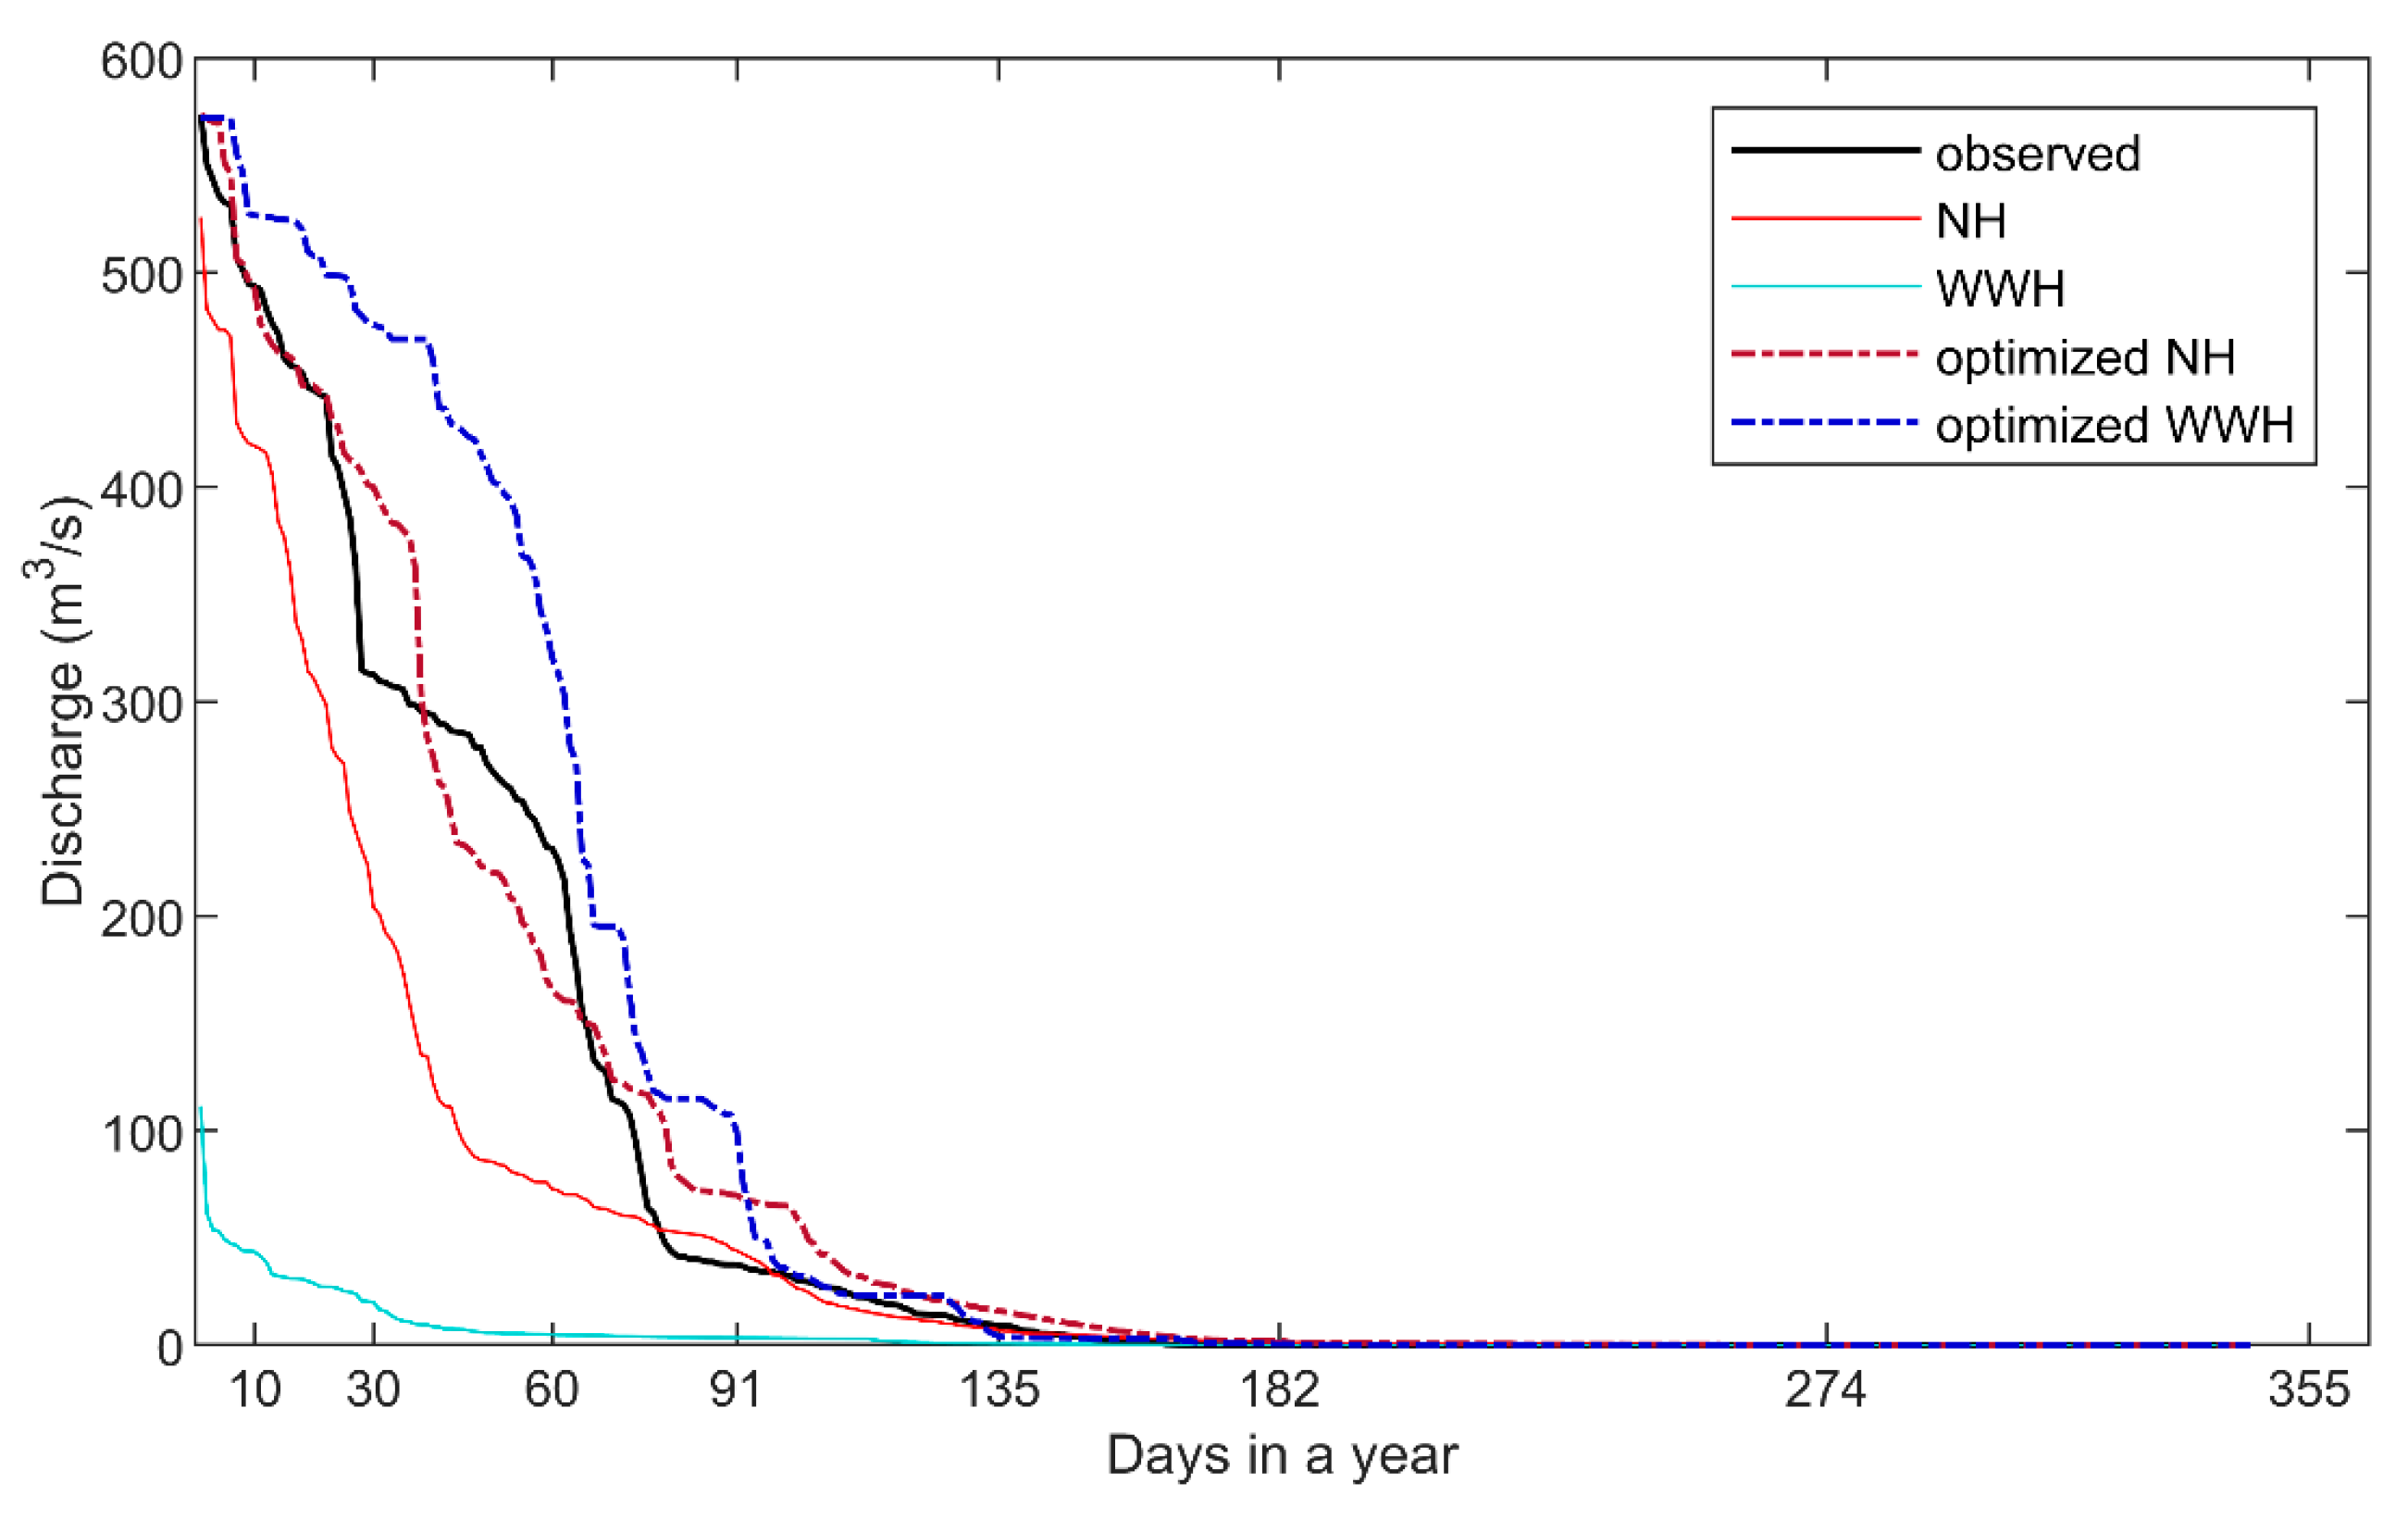
Flow duration curves (Figure 4) confirms the preliminary results emphasizing some interesting points: (1) all the forecasts simulate quite well the dry period of the river even if WWH zeros start from day 100 and NH is not able to produce zero values, (2) WWH forecasts do not demonstrate a clear relation with the observed river flow, (3) NH, even if has the same mean than the observed flow, overestimates in the very high (Q1–Q10) and low flows (Q80–Q150) and underestimates in the medium flows (Q10–Q80), (4) NHOTT is quite closer to the observed flow until day 75 and overestimates the low flows and (5) WWHOTT strongly overestimates all the observed flows.
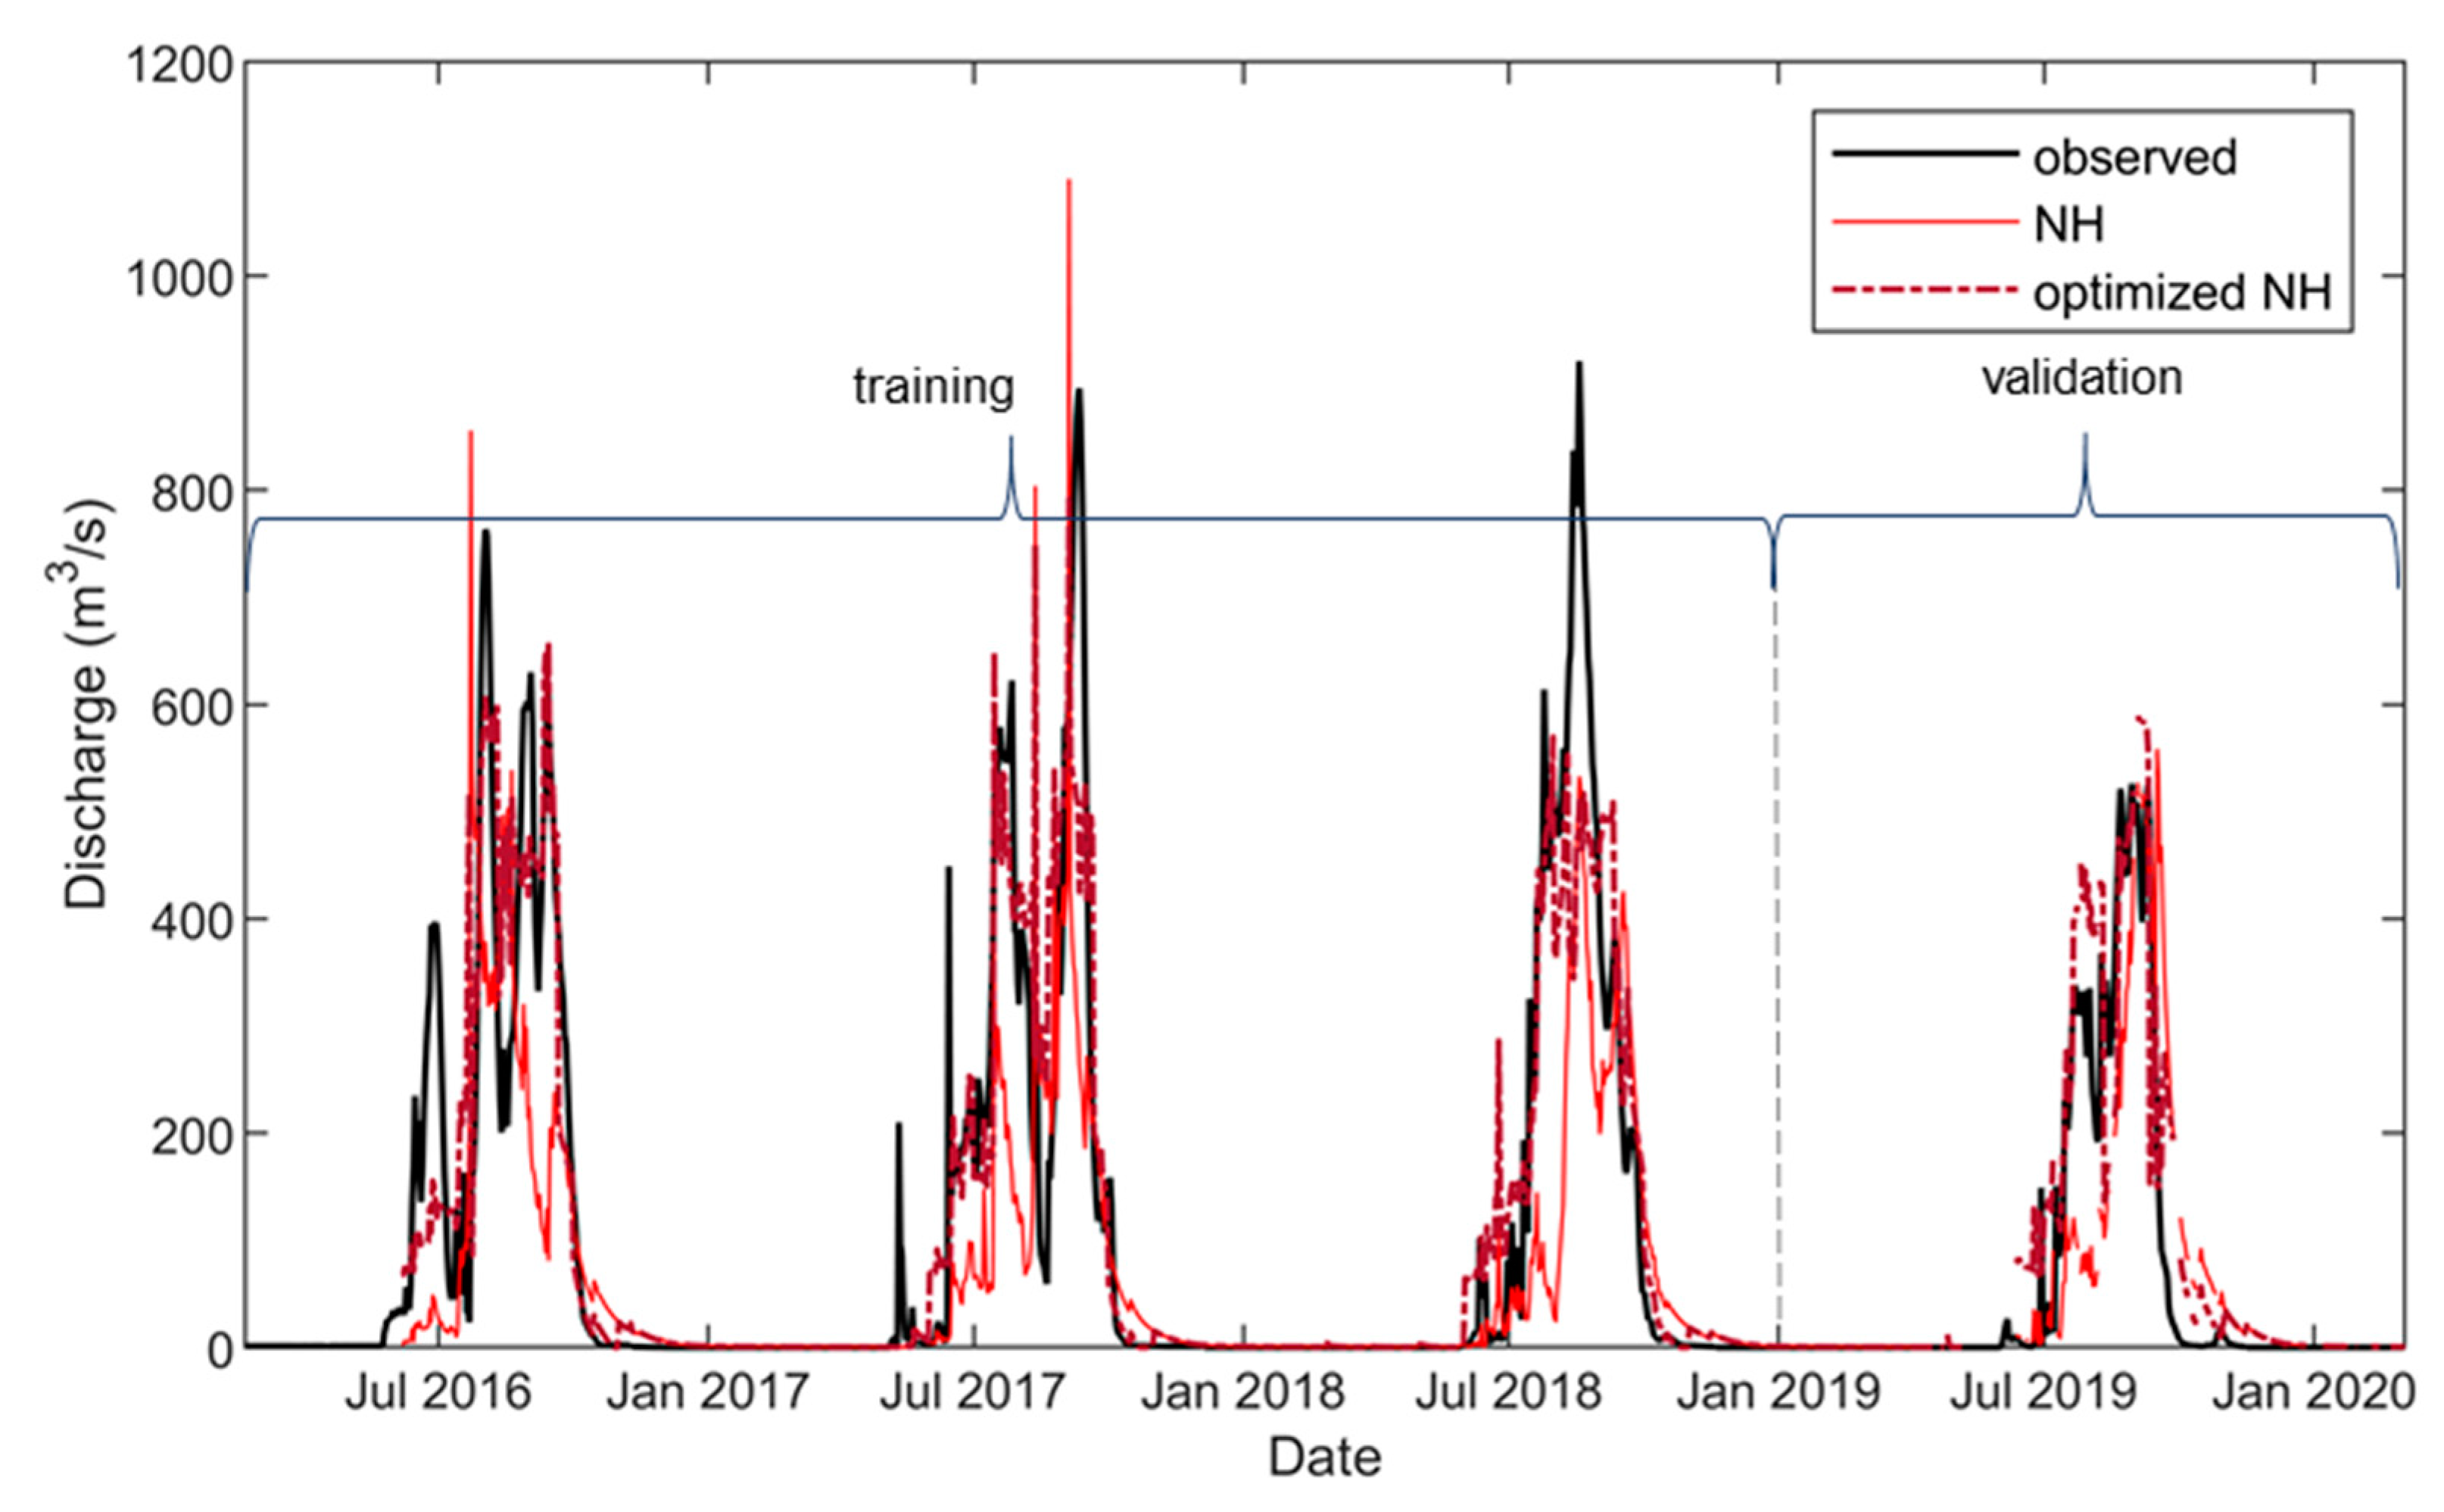
The hydrographs with the NH forecast demonstrate that the magnitude of forecasted flow is quite close to the observed ones (Figure 5). The forecasts do not present strong outliers and well identify the flow peaks in the hydrologic year. Generally, forecasts demonstrate a good skill before optimization and improved skill after optimization. In NH, the influence of calibration at the Garbey Kourou station [25] is very clear. The forecast performance at Bossey Bangou has lower quality (Appendix Figure A2).
The hydrographs with WWH forecasts clearly show that original forecasts are able to represent the annual flow cycle, especially for the dry season, but not the flow magnitude (Figure 6). The WWHOTT demonstrates a strongly improved correlation with the observed hydrograph and both timing and magnitude of flood peaks are correctly identified. The gap between WWH and observed flows is related to the setup and goal of WWH (calibrated with a global focus and a monthly resolution for water balance analysis), without the more tailored calibration applied in NH.
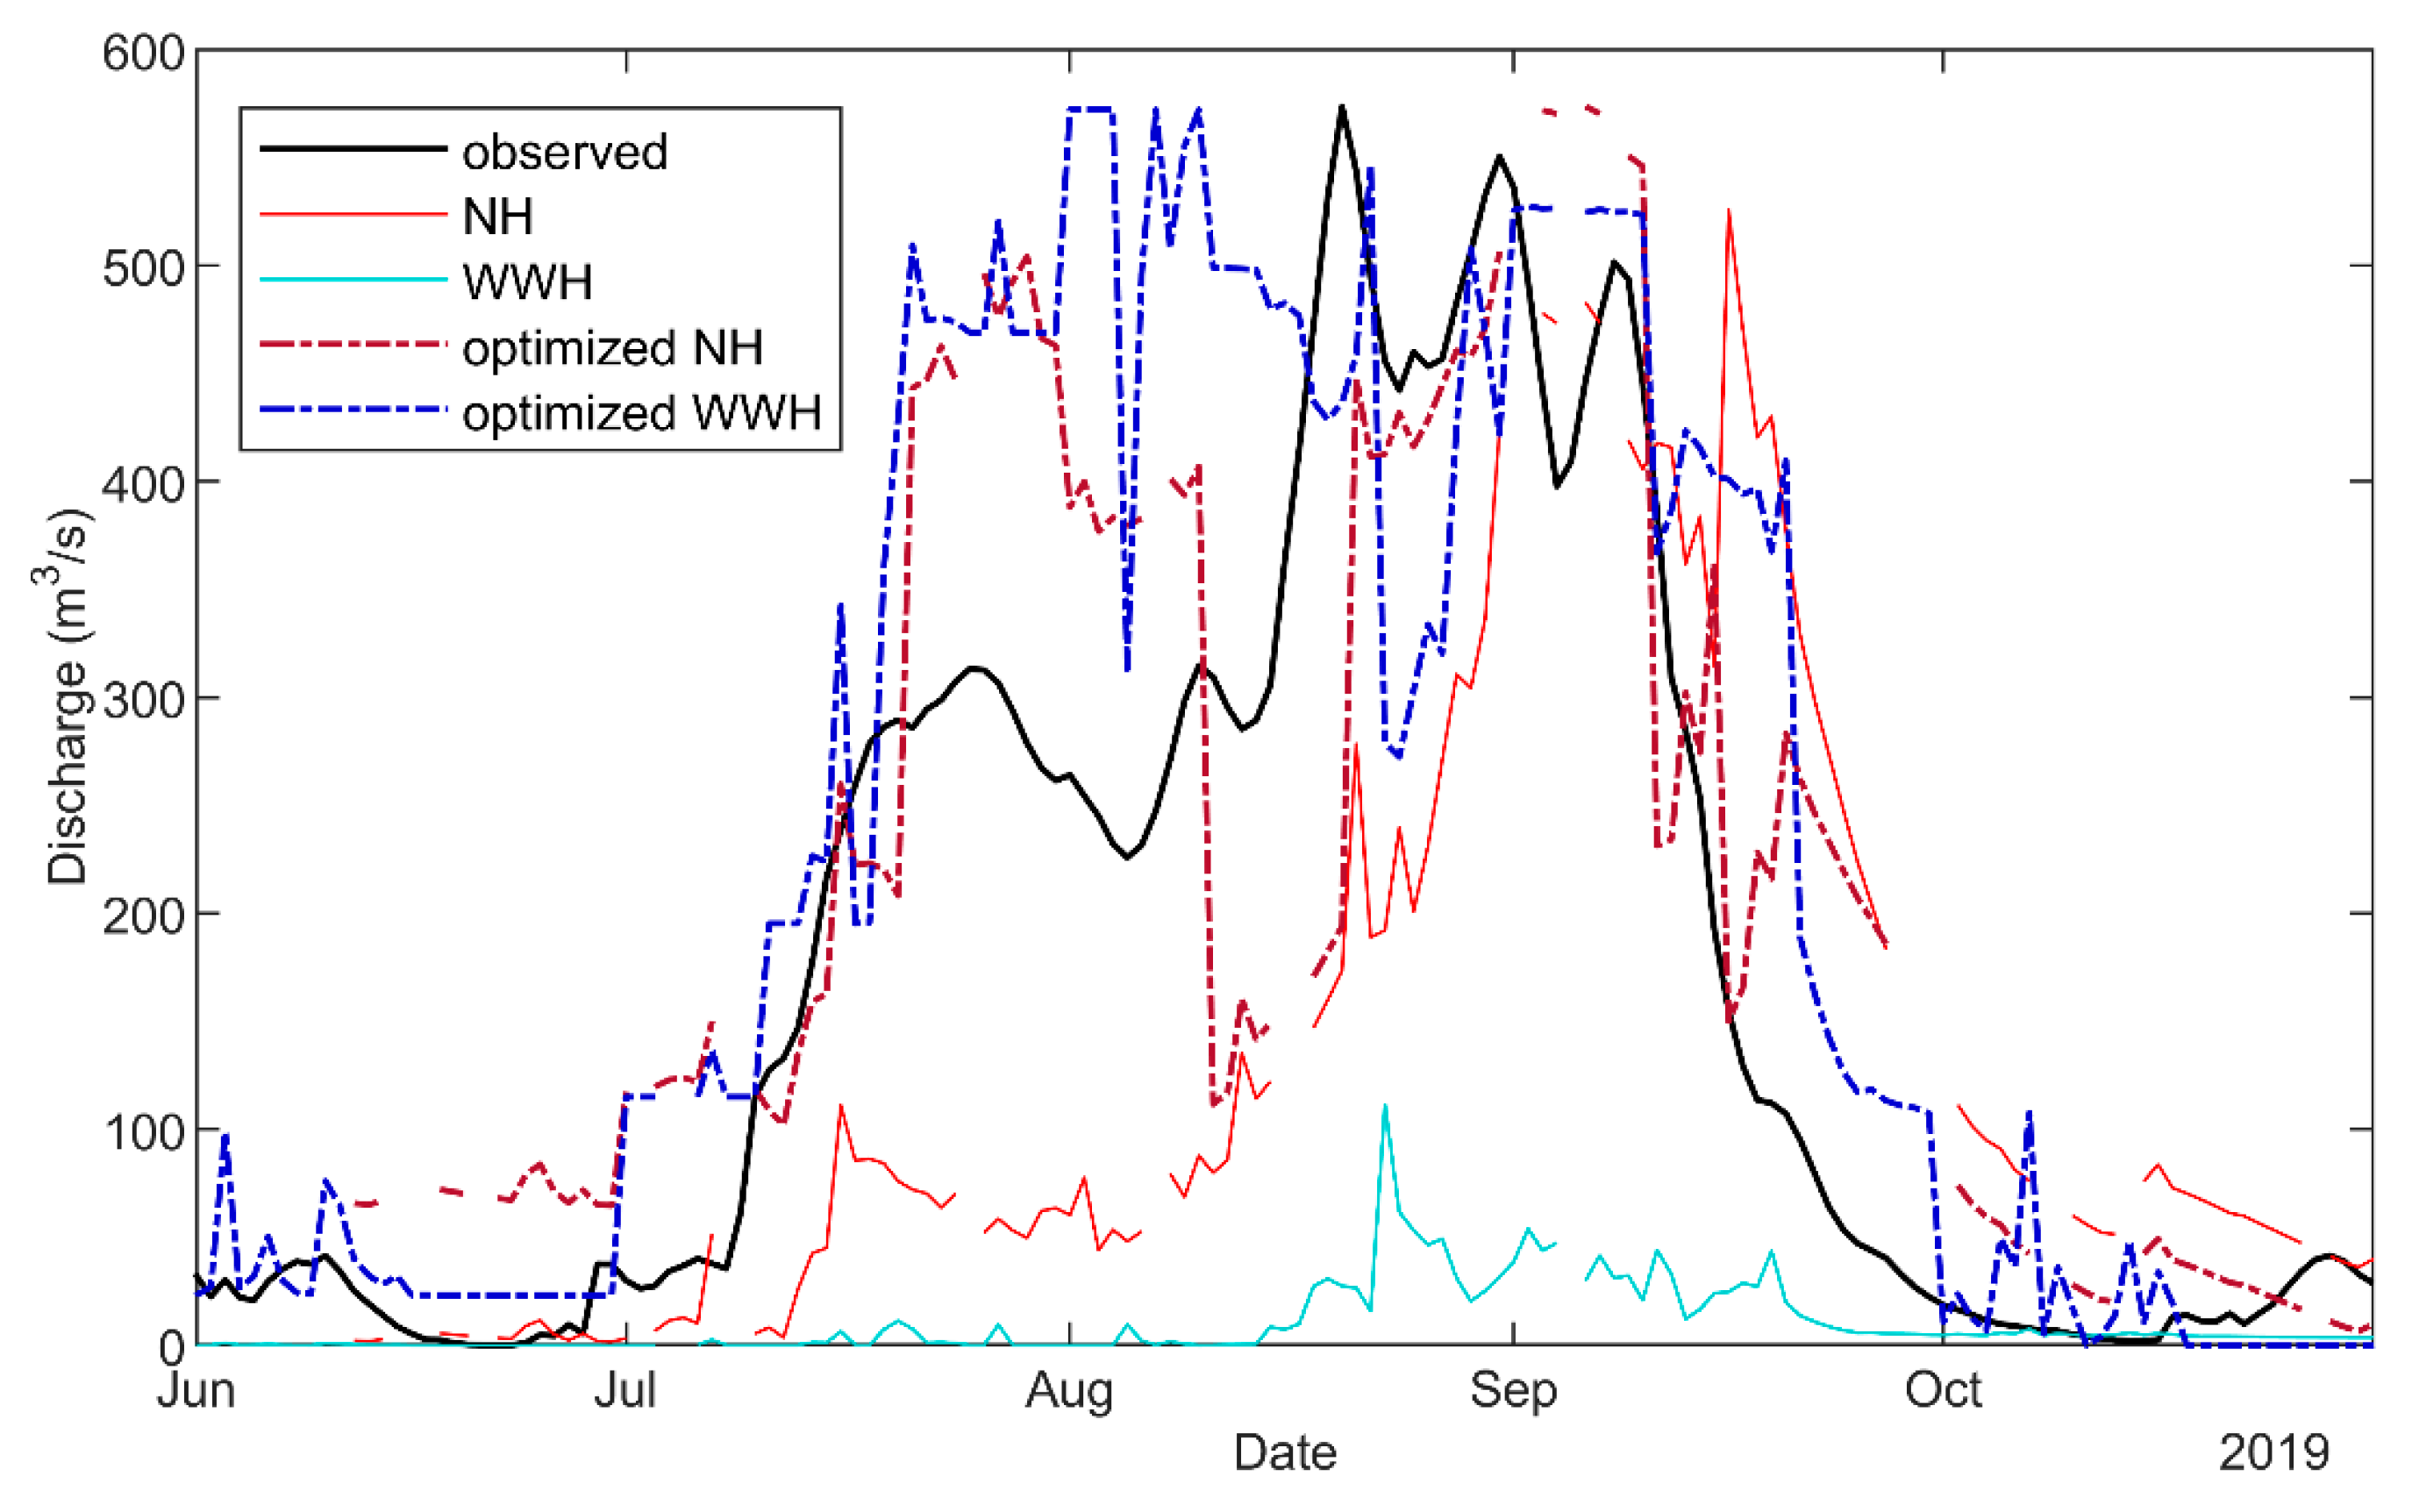
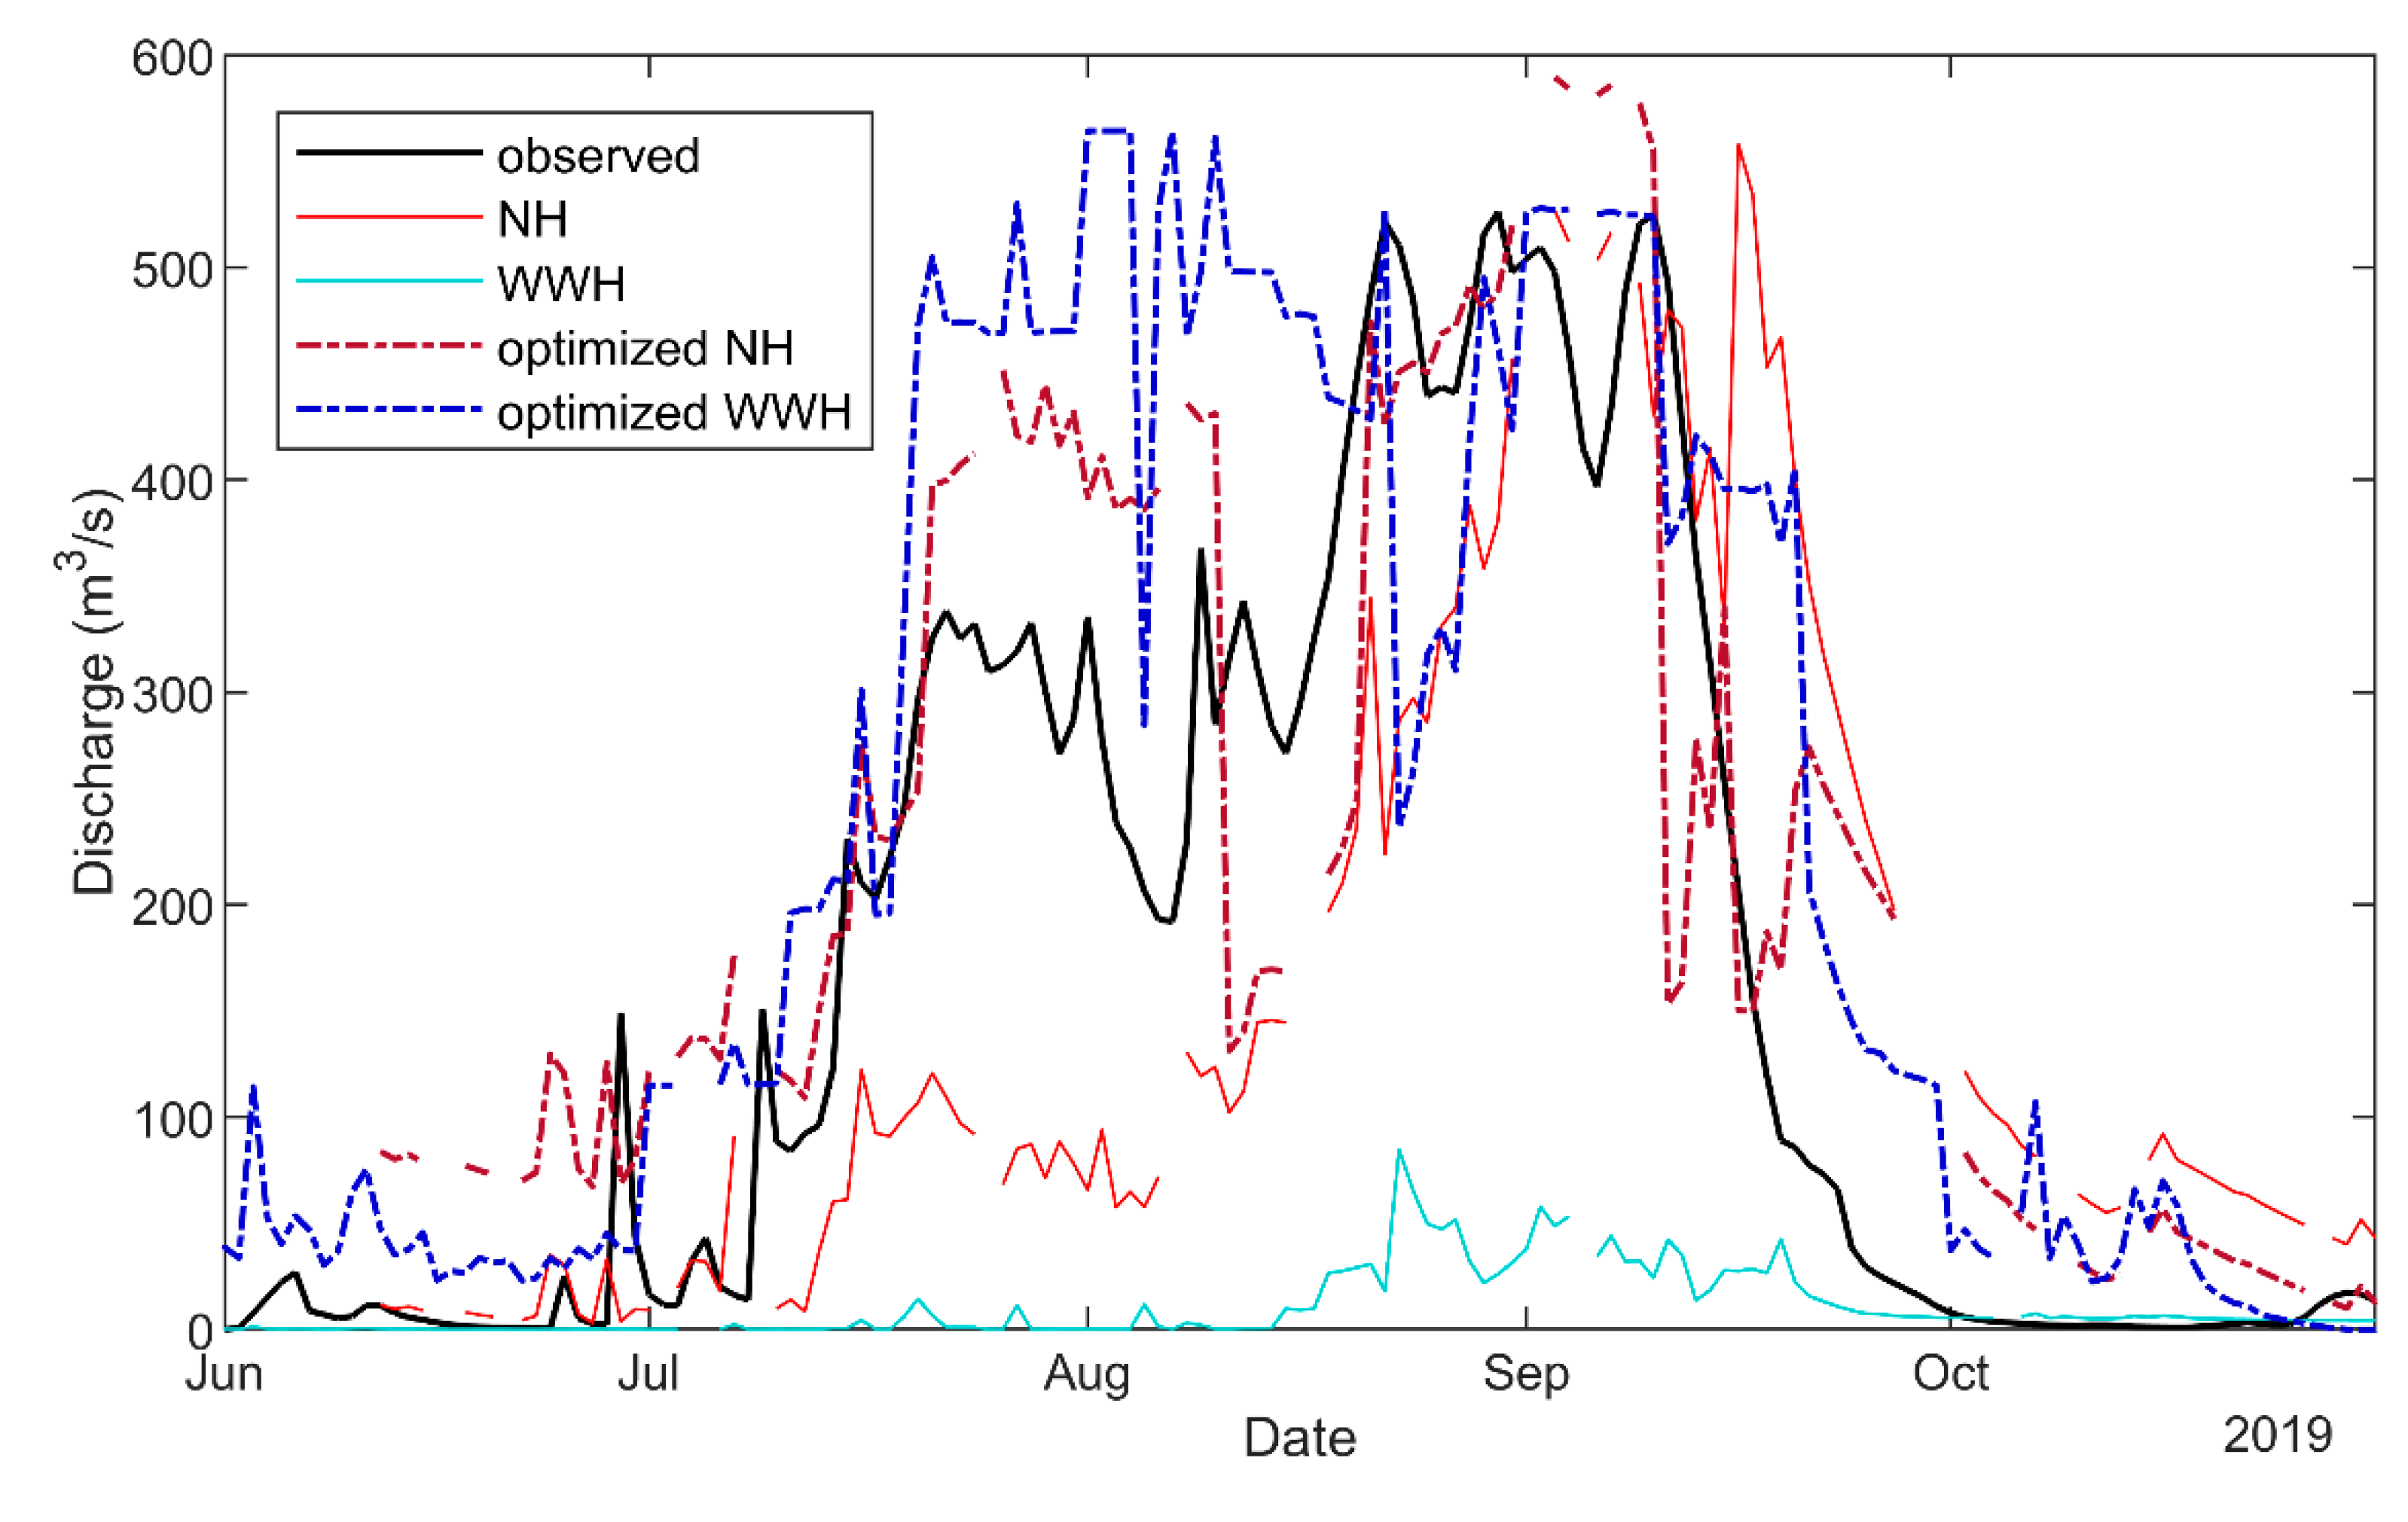
The hydrograph of the 2019 validation wet season well highlights strengths and weaknesses of the four compared forecasts (Figure 7): (1) WWH forecasts for July and the first part of August are mainly zeros and the optimized ones are quite overestimated, (2) NH wet season sufficiently well reproduce the GK flows but is shifted about two weeks forward, (3) the optimized forecasted flows correctly identify the annual maximums between the middle of August and the middle of September even if the WWHOTT in the last period of August is quite underestimated and, (4) even if the NHOTT performs well, it’s affected by high levels of missing data (i.e., low operational capacity). This is a major limitation of the present FANFAR system, a result of the fact that it is still a pilot system and not yet a production-grade system.
Continuous indices highlight the hydrological model capability to correctly forecast the flow in the whole hydrologic year. RMSE identifies the mean gap (in absolute value) between observed and forecasted flow that demonstrates the better performance of NH and the importance of optimization process (Table 7). RSR and NSE are normalized indices that, starting from RMSE, are useful to evaluate the performances in comparison with reference values. According to Moriasi et al. 2007 [49] classification that identifies five levels (bad, unsatisfactory, satisfactory, good and very good): (1) NH performance is satisfactory before and very good after the optimization and (2) WWH performance is bad (RSR) or unsatisfactory (NSE) for the original version and good after the optimization process.
Categorical indices are fundamental to highlight the ability to correctly identify the flow values above the threshold used to distinguish flood to normal values. BIAS show that WWH is not able to forecast flood values, NH forecasts underestimate (BIAS < 1) and optimized forecasts overestimate (BIAS > 1) streamflow. POD and FAR are the fundamental values to identify the forecasting capability. HYPE forecasts demonstrate a quite good POD but a too high FAR resulting in forecasts that are good but not completely reliable. Optimization raises POD (similar performance of NHOTT and WWHOTT) and reduces FAR for both models. For this point it is important to highlight that the values in Table 7 derive from the mean between Garbey Kourou and Bossey Bangou performances (complete values are reported in Appendix A). This difference is clearly noticeable for NHOTT POD and FAR that derive from excellent values in GK (POD = 0.85 and FAR = 0.35) and bad values in BB (POD = 0.4 and FAR = 0.65). PC values are quite constant for NH before and after the optimization and reduces in WWH since the high number of over forecasting. TS and HSS jointly consider the POD and FAR emphasizing the best performances of NH compared to WWH. In wider terms, from both continuous and categorical points of view, optimization process allows to significantly reduce the gap between forecasts and observations confirming previous results reached in the literature [30,57].
Finally, operational availability quantifies the number of missing forecasts (i.e., not produced within the forecast issue date). The results show that NH has significantly worse availability than WWH for the considered time frame (Table 7), and that none of them ensures full time availability. This problem was typically caused by various information communications technology (ICT) production failures on the Hydrology-TEP cloud platform (https://hydrology-tep.eu) on which the FANFAR pilot system is currently deployed to run every day. Most problems were related to necessary files being inaccessible or incorrectly stored on the Hydrology-TEP Catalogue and Store, while a minority were also related to the forecasting production service. To be robust, local EWS requires new forecasts every day without delay [28], therefore there is a need to upgrade the FANFAR pilot system to a fully supported operational production-grade system.

4.2. SLAPIS Operational Application

According to the evaluation of the HYPE models’ reliability conducted with continuous, categorical, and operational availability indices on NH and WWH, the latter has been integrated in SLAPIS to be used operationally during the last hydrological season by Niger Hydrological Directorate with restriction to registered users of the SLAPIS platform. The reasons for the choice of WWH are three: (1) the direct output in the BB sub-basin; (2) the more similar results in the two stations and the better forecast performance in BB more useful for the EWS and; (3) the considerably higher value for the operational availability in comparison to NH.
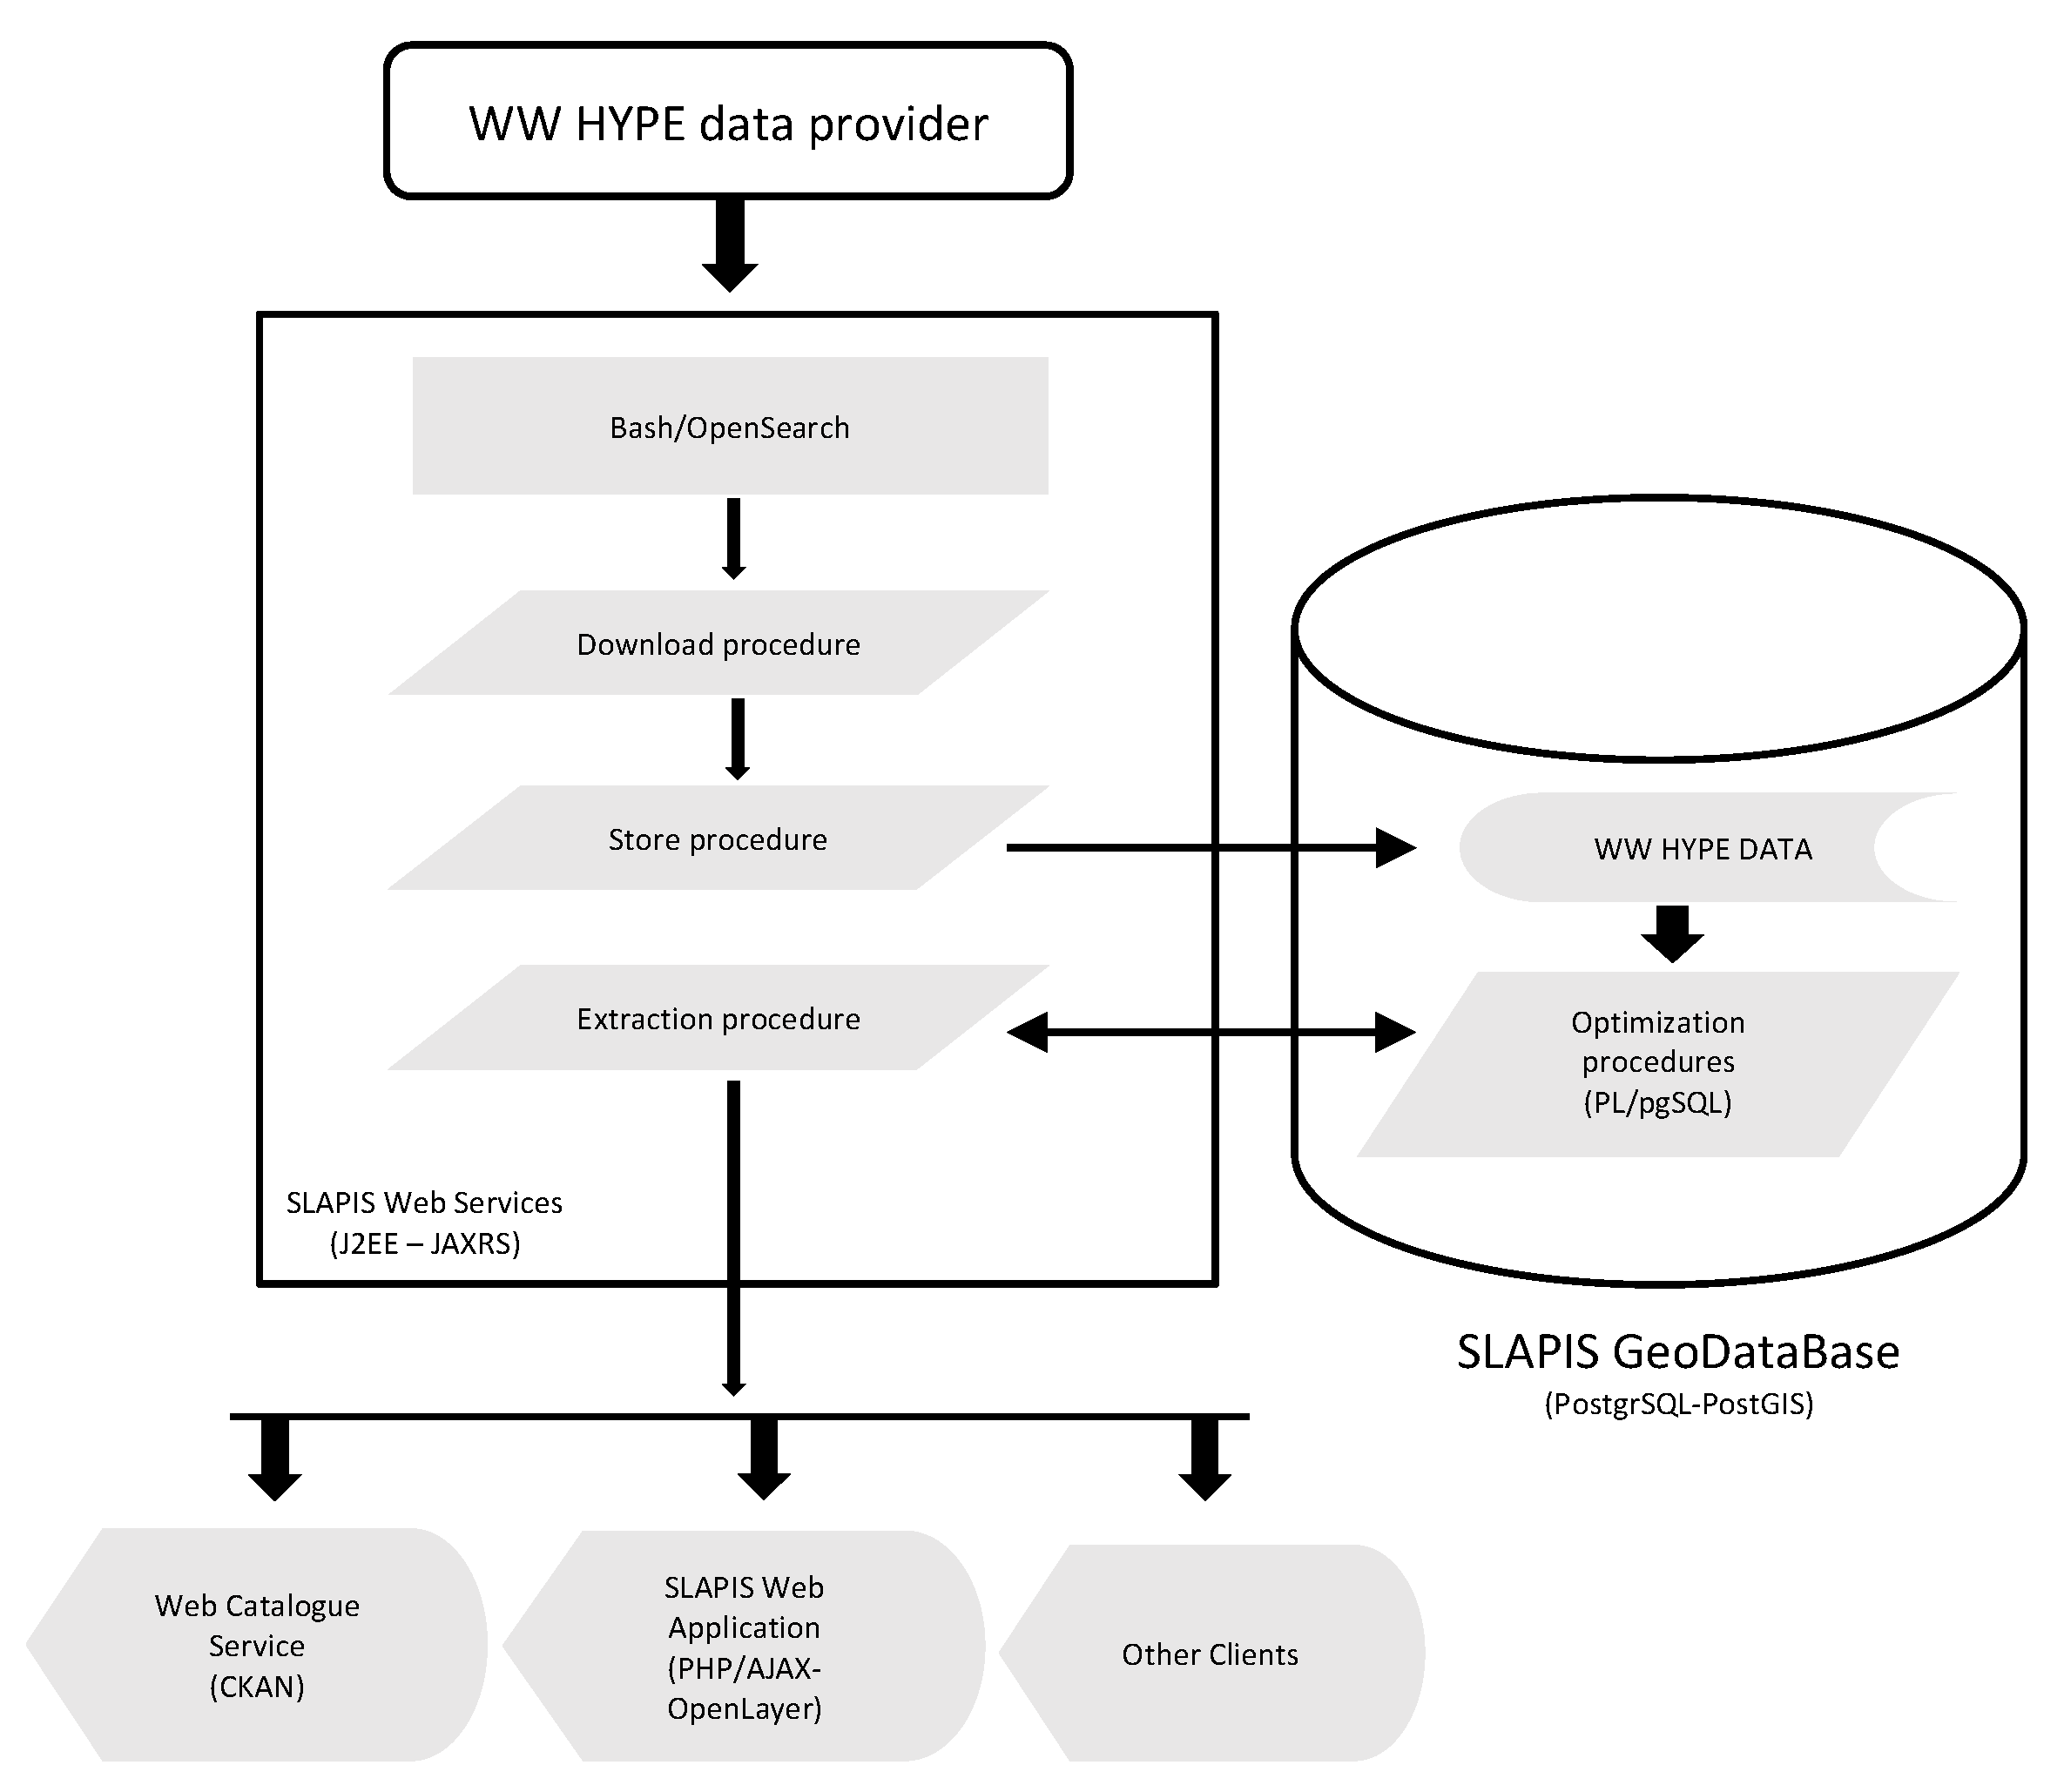
Thanks to the adoption of service oriented architecture paradigms, it was possible to easily integrate WWH into SLAPIS using open-source technologies and developing software components. The data model of SLAPIS has been enriched with new tables to store WWH outcomes for seven specific sub-basins, two of them connected with the gauging stations of Bossey Bangou and Garbey Kourou. Following the WWH outcome specifications, an automatic procedure has been developed using J2EE technology and integrating OpenSearch engine to download and store WWH forecasts into the Geo Data Base every day (Figure 8). The WWH forecast availability in the SLAPIS database starts from June 2017 and is quite constant for each sub-basin.
The WWH optimization procedure has been developed inside the SLAPIS database, based on PostgreSQL and PostGIS engines, using PL/pgSQL language. This procedure is exposed through a REST web service developed with JAX-RS and J2EE technologies to supply calibrated WWH outcomes. The REST web service is used by SLAPIS web application (www.slapis-niger.org) in order to show and plot WWH optimized forecasts through the graphical user interface (Figure 9).
WWH forecasts are available only for profiled users (e.g., operational hydrologists, ANADIA2 partners or scientists). All data are also accessible by Web Catalogue Service of the SLAPIS web platform or using application programing interfaces (APIs) for users with more advanced informatic skills.

5. Discussion

The results show a general overestimation in the optimized forecast compared to the 2019 observed flow used for model verification. This behavior is motivated by the fact that 2019 hydrological year was characterized by a low flow compared to the previous years: mean flow in 2019 was 72.8 m3/s while in the previous year it was higher (2018 = 99.2, 2017 = 106.6 and 2016 = 104.7). Therefore, the flows used for optimization force a higher discharge than the observed in 2019 [13,30].
With a longer training period, a larger number of previous forecasts could be used to force new data in the optimized version, likely resulting in a higher reliability. Of course, the short data sets used for the training period (3 years for NH and 2 years for WWH) are a limit of this study, and with longer reforecasting sequence performances could increase [30].
The choice of hazard thresholds significantly affects categorical performance. Of course, the use of hydrologic and damage-based thresholds is the best choice to evaluate the EWS capability against a flow that can produce field damages. Unfortunately, the low flows registered in 2019 forced the authors to introduce a threshold lower than the one used operationally in the field.
The results also hint at the most appropriate users of hydrological forecasts, namely operational hydrologists, and emergency management experts rather than local authorities or the regular users. The POD and FAR results show that only 60% of observed streamflow above the analysis threshold were correctly forecasted, and that there were a high number of false alarms (50% for NH and 75% for WWH). This accuracy is too poor to allow the use of hydrological forecasts for activating the warning protocols on the field since it could compromise the user’s confidence in SLAPIS and therefore the overall reliability of the system [28]. Large-scale hydrological information may potentially be misleading when interpreted at the local scale and can change the key message of the local impacts [58]. So, the outputs of hydrological models need context at decision scale to be useful to users. For these reasons hydrological forecasts will be used to activate the pre-warning protocols for the hydrological experts and not the field warning. A similar conclusion about appropriate users and stakeholders for FANFAR forecasts have been obtained on West Africa scale [38].
Continuous and categorical performances of the models demonstrate the importance of hydrological model calibration with flow data at daily timestep. Strong difference was detected in NH between GK (calibrated) and BB (not calibrated) behavior and also between NH and WWH that were calibrated respectively at a local scale and a daily resolution and a global focus and a monthly resolution. Another critical factor for accurate hydrological forecasts is the availability of meteorological observations and forecasts with low latency and high accuracy. The long latency of such data have been demonstrated to cause bias and drifts in other areas [42]—which may explain the two-week forecast delay observed at GK—and efforts to improve both accuracy and latency of meteorological input data are being investigated [41]. Broadly speaking, the FANFAR system is designed to incorporate a range of approaches aimed at improving accuracy. For example the system enables multiple forecast chain configurations (e.g., multiple hydrological models), integration of various observations (e.g., water levels from local gauges and satellite altimetry), and a range of methods to assess flood hazard (e.g., with locally defined flood hazard thresholds). The system is continuously being developed, with new features added regularly. Most recently (since August 2020), the forecasted streamflow is adjusted with recent in-situ gauge observations (currently from up to 61 hydrometric gauges including Sirba stations) using a simple auto-regressive approach [41].
The operational availability of forecasts from the FANFAR pilot system is currently a major limitation for application of HYPE forecasts in local EW. Since FANFAR is a pilot system, the main emphasis is currently put on system development rather than operational availability. Some operational procedures are in place (e.g., production monitoring), but not yet to the extent normally deployed in mature production-grade systems. In mature systems, there is typically a response process deployed to solve production failures through a cascade of actions including e.g., (1) automatic repetition of failed processing steps, (2) semi-automated intervention by a dedicated response team, and (3) manual intervention by the system developers; where each level is activated only if the previous failed. The speed by which problems are solved is typically regulated through service level agreements (SLAs), that define, e.g., maximum response times and if the response team shall be active 24 h/7 day or only during normal working hours. Production-grade systems typically also have a more thorough procedure for quality control of new code, testing periods before operational launch, as well as heartbeat functionalities through which users are informed of any planned or unplanned production disruptions. Therefore, the operational availability of HYPE forecasts is fully obtainable if deployed in a production-grade ICT environment (e.g., a similar HYPE model deployed on SMHI’s production environment had 100% operational availability over a full year of production). If FANFAR is to move from pilot to production-grade system, attention to the ICT environment and the associated procedures and SLAs for minimizing or eliminating production failures is required. Critical foundations for this are also that the ICT environment is accessible, that mandated staff have the necessary capacity to operate the system, and that the system is sufficiently financed [31].
Even though this uncertain situation of operational availability of HYPE forecasts is seen to limit their effectiveness over time, the conceptual approach embraced in SLAPIS EWS is to foster the re-use of hydrological forecasts produced at large scale to be tailored for local users’ needs. The critical issue for an operational local EWS, built on distributed data resources and hydrological services providers, is to face continuous technical evolutions of e-infrastructures and incoming forecasted products. System key characteristics for adapting efficiently to such changes are flexibility, transparency, timely documentation, and effective communication with hydrological information producers. The latter is particularly important and should engage in a two-way producers and users both having a common understanding of data and metadata model to effectively exchange them across systems [59]. Indeed, data and metadata modeling add transparency in data exchange and facilitates the development of APIs to interact with distributed data providers. This approach results in a mutual benefit in the perspective of distributed hydrological climate services adding value to data through customized services, maps, and visualizations. That recalls also for system architectures adopting the paradigm of open data and standard web services to increase the interoperability of distributed hydrometeorological services. Interoperability preserves key elements of diversity while ensuring that systems work together in ways that matter most [60]. Following these principles, SLAPIS adopts interoperable services compliant with the most international standards.

6. Conclusions

The flood local early warning system on the Sirba River (SLAPIS) was developed in the last years as a pilot system to build a community response to the dramatic flood increase in the area. The system was founded both on a top-down hydraulic forecast and on bottom-up field observations. These two sources have a forecast horizon of maximum 48 h.
The downscaling of hydrological forecasts from the HYPE models has been planned to extend the warning time of SLAPIS to 10 days. The application was made through an optimization on the 5-day model outputs with a linear regression technique.
The forecast verification shows that NH forecasts are better than WWH ones both in original and optimized versions, for continuous and categorical indices. However, NH forecasts demonstrate a considerably low operational availability. The WWH model was chosen for the operational integration in the user-interface of the SLAPIS EWS as it resulted in the best operational availability quality performances, a high uniformity, and a direct sub-basin on the upstream gauging station.
However, due to the low performance, and to not impact upon the system reliability, WWH forecasts are used as a pre-warning for hydrologists and not for operational warning for the involved villages.
Methodologically, this study stresses the role of interoperability in distributed hydrometeorological services incrementing collaborative action to facilitate further data and webservice usage and making progress toward the sustainable development goals.
Future perspectives of this work will evaluate the optimization process on a higher number of training and validation years, and to use operational hazard thresholds. Moreover, the reinforcement of the ICT environment and procedures for HYPE models will allow a higher operational availability.

Author Contributions

G.M., methodology, analysis and elaboration of data, writing—original draft; V.T., methodology, writing—original draft, resources, supervision; J.C.M.A., methodology, writing—original draft, resources, supervision; A.A., writing—review and editing, supervision; M.H.I., writing—review and editing, supervision; A.P., methodology, writing—review and editing, supervision; T.D.F., methodology, writing—original draft; L.R., methodology, writing—original draft; B.M., writing review and editing, supervision; D.G., data curation, writing—review and editing; M.R., methodology, writing—review and editing, supervision. All authors have read and agreed to the published version of the manuscript.

Funding

This research was co-funded by the Italian Agency for Development Cooperation, by the Institute of Bioeconomy (IBE)-National Research Council of Italy (CNR), by the National Directorate for Meteorology of Niger (DMN), and by DIST Politecnico and the University of Turin within the project ANADIA2.0 (Aid10848). In addition, the research is based on the FANFAR project, funded by the European Union’s Horizon 2020 research and innovation program under grant agreement # 780118.

Acknowledgments

We would like to thank (1) Gaptia Lawan Katiellou (Director of DMN) for continuously supporting the project, (2) Bruno Guerzoni for SLAPIS’s patient IT development work, (3) Giulio Passerotti for previous steps of the MatLAB coding development, (4) the FANFAR team and the developers of the NH and WWH models, in particular Emmanuel Mathot and Tobias Lagander for their dedicated work to produce HYPE forecasts on Hydrology-TEP.

Conflicts of Interest

The authors declare no conflict of interest. The funders had no role in the design of the study; in the collection, analyses, or interpretation of data; in the writing of the manuscript, or in the decision to publish the results.

Appendix A

Results in Bossey Bangou hydrometer: basic statistical parameters (Table A1), Flow duration curve (Figure A1) and hydrograph (Figure A2).
Table A1. Basic statistical parameters (minimum, mean, and maximum) at Bossey Bangou in the validation year 2019. Observed flow, NH and WWH (5 day) forecasts before and after the optimization.
IndexObservedNHWWHOptimized NHOptimized WWH
Minimum (m3/s)0.00.40.00.40.0
Mean (m3/s)75.166.65.3107.0114.0
Maximum (m3/s)573.5525.8111.4573.7572.0
Figure A1. Flow duration curve of the Sirba River at Bossey Bangou in the validation year 2019. Observed flow, NH and WWH (5 day) forecasts before and after the optimization.
Water 12 03504 g0a1
Figure A2. Hydrograph of original and optimized 5-day forecasts from NH and WWH in Bossey Bangou for the wet season of the validation year (1 June 19–31 Octomber 19).
Water 12 03504 g0a2
Continuous and categorical indices and operational availability in Garbey Kourou (Table A2) and Bossey Bangou (Table A3) hydrometers.
Table A2. Continuous and categorical indices and operational availability for original and optimized forecasts at Garbey Kourou. Best performance is shown in bold.
ModelRMSERSRNSEBIASPODFARPCTSHSSOperational Availability
NH102.60.610.620.920.380.5894.20.250.3781%
WWH161.31.04−0.090.000.00/94.70.000.0092%
NHOTT74.10.440.801.310.850.3596.90.580.7281%
WWHOTT87.10.560.682.500.630.7588.10.220.3092%
Table A3. Continuous and categorical indices and operational availability for original and optimized forecasts at Bossey Bangou. Best performance is shown in bold.
ModelRMSERSRNSEBIASPODFARPCTSHSSOperational Availability
NH112.70.670.550.400.070.830.930.050.0681%
WWH161.81.05−0.110.000.00/0.940.000.0092%
NHOTT78.30.470.781.130.400.650.920.230.3381%
WWHOTT86.800.570.682.220.500.780.870.180.2592%

References

  1. Aich, V.; Koné, B.; Hattermann, F.F.; Paton, E.N. Time series analysis of floods across the Niger River Basin. Water 2016, 8, 165. [Google Scholar] [CrossRef] [Green Version]
  2. Descroix, L.; Genthon, P.; Amogu, O.; Rajot, J.L.; Sighomnou, D.; Vauclin, M. Change in Sahelian Rivers hydrograph: The case of recent red floods of the Niger River in the Niamey region. Glob. Planet. Chang. 2012, 98, 18–30. [Google Scholar] [CrossRef]
  3. Descroix, L.; Guichard, F.; Grippa, M.; Lambert, L.A.; Panthou, G.; Mahé, G.; Gal, L.; Dardel, C.; Quantin, G.; Kergoat, L.; et al. Evolution of Surface Hydrology in the Sahelo-Sudanian Strip: An Updated Review. Water 2018, 10, 748. [Google Scholar] [CrossRef] [Green Version]
  4. Descroix, L.; Bouzou, I.; Genthon, P.; Sighomnou, D.; Mahe, G.; Mamadou, I.; Vandervaere, J.P.; Gautier, E.; Faran, O.; Rajot, J.L.; et al. Impact of Drought and Land—Use Changes on Surface—Water Quality and Quantity: The Sahelian Paradox. In Current Perspectives in Contaminant Hydrology and Water Resources Sustainability; Bradley, P., Ed.; InTech: London, UK, 2013; ISBN 978-953-51-1046-0. [Google Scholar]
  5. Descroix, L. Processus et Enjeux D’eau en Afrique de L’ouest Soudano-Sahélienne; Editions des archives contemporaines: Paris, France, 2018; ISBN 978-2-8130-0314-0. [Google Scholar]
  6. Descroix, L.; Mahé, G.; Lebel, T.; Favreau, G.; Galle, S.; Gautier, E.; Olivry, J.C.; Albergel, J.; Amogu, O.; Cappelaere, B.; et al. Spatio-temporal variability of hydrological regimes around the boundaries between Sahelian and Sudanian areas of West Africa: A synthesis. J. Hydrol. 2009, 375, 90–102. [Google Scholar] [CrossRef]
  7. Mahe, G.; Lienou, G.; Descroix, L.; Bamba, F.; Paturel, J.E.; Laraque, A.; Meddi, M.; Habaieb, H.; Adeaga, O.; Dieulin, C.; et al. The rivers of Africa: Witness of climate change and human impact on the environment: How climate and human changes impacted river regimes in Africa. Hydrol. Processes 2013, 27, 2105–2114. [Google Scholar] [CrossRef]
  8. Aich, V.; Liersch, S.; Vetter, T.; Andersson, J.C.M.; Müller, E.N.; Hattermann, F.F. Climate or land use? Attribution of changes in river flooding in the Sahel zone. Water 2015, 7, 2796–2820. [Google Scholar] [CrossRef]
  9. Panthou, G.; Vischel, T.; Lebel, T. Recent trends in the regime of extreme rainfall in the Central Sahel. Int. J. Climatol. 2014, 34, 3998–4006. [Google Scholar] [CrossRef]
  10. Mahe, G.; Paturel, J.E.; Servat, E.; Conway, D.; Dezetter, A. The impact of land use change on soil water holding capacity and river flow modelling in the Nakambe River, Burkina-Faso. J. Hydrol. 2005, 300, 33–43. [Google Scholar] [CrossRef]
  11. Fiorillo, E.; Maselli, F.; Tarchiani, V.; Vignaroli, P. Analysis of land degradation processes on a tiger bush plateau in South West Niger using MODIS and LANDSAT TM/ETM+ data. Int. J. Appl. Earth Obs. Geoinf. 2017, 62, 56–68. [Google Scholar] [CrossRef]
  12. Amogu, O.; Esteves, M.; Vandervaere, J.P.; Malam Abdou, M.; Panthou, G.; Rajot, J.L.; Souley Yéro, K.; Boubkraoui, S.; Lapetite, J.M.; Dessay, N.; et al. Runoff evolution due to land-use change in a small Sahelian catchment. Hydrol. Sci. J. 2015, 60, 78–95. [Google Scholar] [CrossRef]
  13. Tamagnone, P.; Massazza, G.; Pezzoli, A.; Rosso, M. Hydrology of the Sirba River: Updating and Analysis of Discharge Time Series. Water 2019, 11, 156. [Google Scholar] [CrossRef] [Green Version]
  14. Fiorillo, E.; Crisci, A.; Issa, H.; Maracchi, G.; Morabito, M.; Tarchiani, V. Recent Changes of Floods and Related Impacts in Niger Based on the ANADIA Niger Flood Database. Climate 2018, 6, 59. [Google Scholar] [CrossRef] [Green Version]
  15. Krzhizhanovskaya, V.V.; Shirshov, G.S.; Melnikova, N.B.; Belleman, R.G.; Rusadi, F.I.; Broekhuijsen, B.J.; Gouldby, B.P.; Lhomme, J.; Balis, B.; Bubak, M.; et al. Flood early warning system: Design, implementation and computational modules. Procedia Comput. Sci. 2011, 4, 106–115. [Google Scholar] [CrossRef] [Green Version]
  16. Gautam, D.K.; Phaiju, A.G. Community Based Approach to Flood Early Warning in West Rapti River Basin of Nepal. J. Integr. Disaster Risk Manag. 2013, 15. [Google Scholar] [CrossRef]
  17. Practical Action and Mercy Corps. Community Based Early Warning Systems in South and South East Asia; Practical Action and Mercy Corps: Rugby, UK, 2012; Available online: http://flagship4.nrrc.org.np/sites/default/files/documents/best-practice-learning-in-community-based-EWS.pdf (accessed on 18 September 2020).
  18. Shukla, Y.; Mall, B. Enhancing Frontline Resilience: Transborder Community-Based Flood Early Warning System in India and Nepal. In Technologies for Development, Proceedings of the UNESCO Chair Conference on Technologies for Development, Lausanne, Switzerland, 4–6 May 2016; Springer: Berlin/Heidelberg, Germany, 2018; pp. 201–212. ISBN 978-3-319-91067-3. [Google Scholar]
  19. Community Early Warning Systems: Guiding Principles; International Federation of Red Cross and Red Crescent Societies: Geneva, Switzerland, 2012.
  20. Alfieri, L.; Burek, P.; Dutra, E.; Krzeminski, B.; Muraro, D.; Thielen, J.; Pappenberger, F. GloFAS—Global ensemble streamflow forecasting and flood early warning. Hydrol. Earth Syst. Sci. 2013, 9, 12293–12332. [Google Scholar] [CrossRef]
  21. Harrigan, S.; Zsoter, E.; Alfieri, L.; Prudhomme, C.; Salamon, P.; Wetterhall, F.; Barnard, C.; Cloke, H.; Pappenberger, F. GloFAS-ERA5 Operational Global River Discharge Reanalysis 1979-Present. Hydrol. Soil Sci. Hydrol. 2020, 12, 2043–2060. [Google Scholar] [CrossRef] [Green Version]
  22. Arheimer, B.; Pimentel, R.; Isberg, K.; Crochemore, L.; Andersson, J.C.M.; Hasan, A.; Pineda, L. Global catchment modelling using World-Wide HYPE (WWH), open data, and stepwise parameter estimation. Hydrol. Earth Syst. Sci. 2020, 24, 535–559. [Google Scholar] [CrossRef] [Green Version]
  23. Bartholmes, J.C.; Thielen, J.; Ramos, M.H.; Gentilini, S. The european flood alert system EFAS—Part 2: Statistical skill assessment of probabilistic and deterministic operational forecasts. Hydrol. Earth Syst. Sci. 2009, 13, 141–153. [Google Scholar] [CrossRef] [Green Version]
  24. Pechlivanidis, I.G.; Crochemore, L.; Rosberg, J.; Bosshard, T. What are the key drivers controlling the quality of seasonal streamflow forecasts? Water Resour. Res. 2020, 56, e2019WR026987. [Google Scholar] [CrossRef]
  25. Andersson, J.C.M.; Ali, A.; Arheimer, B.; Gustafsson, D.; Minoungou, B. Providing peak river flow statistics and forecasting in the Niger River basin. Phys. Chem. Earth Parts ABC 2017, 100, 3–12. [Google Scholar] [CrossRef]
  26. Massazza, G.; Tamagnone, P.; Wilcox, C.; Belcore, E.; Pezzoli, A.; Vischel, T.; Panthou, G.; Housseini Ibrahim, M.; Tiepolo, M.; Tarchiani, V.; et al. Flood Hazard Scenarios of the Sirba River (Niger): Evaluation of the Hazard Thresholds and Flooding Areas. Water 2019, 11, 1018. [Google Scholar] [CrossRef] [Green Version]
  27. Karen, M.; Kanmani, V.; Kanchan, M.D.; Shobha, Y.; Sumit, D.; Rajani, M. Urgent Case for Recovery: What We Can Learn from the August 2014 Karnali River Floods in Nepal; Zurich Insurance Group Ltd: Zürich, Switzerland, 2015. [Google Scholar]
  28. Tarchiani, V.; Massazza, G.; Rosso, M.; Tiepolo, M.; Pezzoli, A.; Ibrahim, M.H.; Katiellou, G.L.; Tamagnone, P.; Filippis, T.D.; Rocchi, L.; et al. Community and Impact Based Early Warning System for Flood Risk Preparedness: The Experience of the Sirba River in Niger. Sustainability 2020, 24, 1802. [Google Scholar] [CrossRef] [Green Version]
  29. Tiepolo, M.; Rosso, M.; Massazza, G.; Belcore, E.; Issa, S.; Braccio, S. Flood Assessment for Risk-Informed Planning along the Sirba River, Niger. Sustainability 2019, 11, 4003. [Google Scholar] [CrossRef] [Green Version]
  30. Passerotti, G.; Massazza, G.; Pezzoli, A.; Bigi, V.; Zsótér, E.; Rosso, M. Hydrological Model Application in the Sirba River: Early Warning System and GloFAS Improvements. Water 2020, 12, 620. [Google Scholar] [CrossRef] [Green Version]
  31. Andersson, J.; Ali, A.; Arheimer, B.; Crochemore, L.; Gbobaniyi, B.; Gustafsson, D.; Hamatan, M.; Kuller, M.; Lienert, J.; Machefer, M.; et al. Flood forecasting and alerts in West Africa—Experiences from co-developing a pre-operational system at regional scale. In Proceedings of the EGU General Assembly 2020, Online, 4–8 May 2020. [Google Scholar] [CrossRef]
  32. Tiepolo, M.; Tarchiani, V. Risque et Adaptation Climatique Dans la Région Tillabéri, Niger; l’Harmattan Paris: Paris, France, 2016; ISBN 978-2-343-08493-0. [Google Scholar]
  33. Bigi, V.; Pezzoli, A.; Rosso, M. Past and Future Precipitation Trend Analysis for the City of Niamey (Niger): An Overview. Climate 2018, 6, 73. [Google Scholar] [CrossRef] [Green Version]
  34. Tarhule, A. Damaging rainfall and flooding: The other Sahel hazards. Clim. Chang. 2005, 72, 355–377. [Google Scholar] [CrossRef]
  35. Climateservices.it. Available online: https://climateservices.it/anadia_blog/ (accessed on 21 September 2020).
  36. UNISDR. Developing Early Warning Systems: A Checklist; UNISDR: Bonn, Germany, 2006. [Google Scholar]
  37. Système Locale d’Alerte Précoce pour les Inondations de la Sirba. Available online: www.slapis.niger.org (accessed on 13 October 2020).
  38. Lienert, J.; Andersson, J.; Hofmann, D.; Silva Pinto, F.; Kuller, M. Report on the Co-Design Workshops in FANFAR to Create a Flood Forecast and Alert System for West Africa; Eawag and FANFAR Consortium: Dübendorf, Switzerland, 2020; Available online: https://fanfar.eu/resources D2.2 Report on co-design process (accessed on 20 October 2020).
  39. FANFAR: Reinforced Cooperation to Provide Operational Flood Forecasting and Alerts in West Africa. Available online: https://fanfar.eu/ (accessed on 13 October 2020).
  40. Andersson, J.C.M.; Arheimer, B.; Traoré, F.; Gustafsson, D.; Ali, A. Process refinements improve a hydrological model concept applied to the Niger River basin. Hydrol. Processes 2017, 31, 4540–4554. [Google Scholar] [CrossRef] [Green Version]
  41. Andersson, J.; Santos, L.; Isberg, K.; Gustafsson, D.; Musuuza, J.; Minoungou, B.; Crochemore, L. FANFAR Deliverable D3.2—Report Documenting and Explaining the Hydrological Models; FANFAR Consortium: Norrköping, Sweden, 2020; p. 41. Available online: https://fanfar.eu/wp-content/uploads/sites/4/2020/05/FANFAR-D3.2-Hydrological-Models.pdf (accessed on 20 October 2020).
  42. Berg, P.; Donnelly, C.; Gustafsson, D. Near-real-time adjusted reanalysis forcing data for hydrology. Hydrol. Earth Syst. Sci. 2018, 22, 989–1000. [Google Scholar] [CrossRef] [Green Version]
  43. Berg, P.; Almén, F.; Bozhinova, D. HydroGFD3.0: A 25 km global near real-time updated precipitation and temperature data set. Earth Syst. Sci. Data 2020. Under Review. [Google Scholar] [CrossRef]
  44. Wilcox, C.; Vischel, T.; Panthou, G.; Bodian, A.; Blanchet, J.; Descroix, L.; Quantin, G.; Cassé, C.; Tanimoun, B.; Kone, S. Trends in hydrological extremes in the Senegal and Niger Rivers. J. Hydrol. 2018, 566, 531–545. [Google Scholar] [CrossRef]
  45. Seth, A.; Singla, A.R.; Aggarwal, H. Service Oriented Architecture Adoption Trends: A Critical Survey. In Contemporary Computing. IC3 2012. Communications in Computer and Information Science; Parashar, M., Kaushik, D., Rana, O.F., Samtaney, R., Yang, Y., Zomaya, A., Eds.; Springer: Berlin/Heidelberg, Germany, 2012; Volume 306. [Google Scholar] [CrossRef]
  46. Wilks, D.S. Statistical methods in the atmospheric sciences. In International Geophysics Series, 2nd ed.; Academic Press: Cambridge, MA, USA, 2006; ISBN 978-0-12-751966-1. [Google Scholar]
  47. Hsu, K.; Gupta, H.V.; Sorooshian, S. Artificial neural network modeling of the rainfall-runoff process. Water Resour. Res. 1995, 31, 2517–2530. [Google Scholar] [CrossRef]
  48. Andrews, D.W.K. Heteroskedasticity and autocorrelation consistent covariance matrix estimation. Econometrica 1991, 59, 817. [Google Scholar] [CrossRef]
  49. Moriasi, D.N.; Arnold, J.G.; Van Liew, M.W.; Bingner, R.L.; Harmel, R.D.; Veith, T.L. Model Evaluation Guidelines for Systematic Quantification of Accuracy in Watershed Simulations. Trans. ASABE 2007, 50, 885–900. [Google Scholar] [CrossRef]
  50. Pace, F.; Santilano, A.; Godio, A. Particle swarm optimization of electromagnetic data with parallel computing in the 2D case. In Proceedings of the 23rd European Meeting of Environmental and Engineering Geophysics, Malmo, Sweden, 3–7 September 2017. [Google Scholar] [CrossRef]
  51. Pace, F.; Godio, A.; Santilano, A.; Comina, C. Joint optimization of geophysical data using multi-objective swarm intelligence. Geophys. J. Int. 2019, 218, 1502–1521. [Google Scholar] [CrossRef]
  52. Huo, J.; Liu, L.; Zhang, Y. An improved multi-cores parallel artificial Bee colony optimization algorithm for parameters calibration of hydrological model. Future Gener. Comput. Syst. 2018, 81, 492–504. [Google Scholar] [CrossRef]
  53. Jiang, Y.; Li, X.; Huang, C. Automatic calibration a hydrological model using a master–slave swarms shuffling evolution algorithm based on self-adaptive particle swarm optimization. Expert Syst. Appl. 2013, 40, 752–757. [Google Scholar] [CrossRef]
  54. Wang, Y.; Brubaker, K. Multi-objective model auto-calibration and reduced parameterization: Exploiting gradient-based optimization tool for a hydrologic model. Environ. Model. Softw. 2015, 70, 1–15. [Google Scholar] [CrossRef]
  55. Kutner, M.H. Applied Linear Statistical Models; McGraw-Hill International Edition; McGraw-Hill Irwin: New York, NY, USA, 2005; ISBN 978-0-07-112221-4. [Google Scholar]
  56. Hill, R.C.; Griffiths, W.E.; Lim, G.C. Principles of Econometrics, 4th ed.; Wiley: Hoboken, NJ, USA, 2011; ISBN 978-0-470-62673-3. [Google Scholar]
  57. Bischiniotis, K.; van den Hurk, B.; Zsoter, E.; Coughlan de Perez, E.; Grillakis, M.; Aerts, J.C.J.H. Evaluation of a global ensemble flood prediction system in Peru. Hydrol. Sci. J. 2019, 64, 1171–1189. [Google Scholar] [CrossRef] [Green Version]
  58. Donnelly, C.; Ernst, K.; Arheimera, B. A comparison of hydrological climate services at different scales by users and scientists. Clim. Serv. 2018, 11, 24–35. [Google Scholar] [CrossRef]
  59. Morales, L.G.G.; Orrell, T. Data Interoperability: A Practitioner’s Guide to Joining up Data in the Development Sector; United Nations World Data Forum (UNWDF): Dubai, United Arab Emirates, 2018. [Google Scholar]
  60. Palfrey, J.; Gasser, U. Interop: The Promise and Perils of Highly Interconnected Systems; Basic Books: New York, NY, USA, 2012. [Google Scholar]
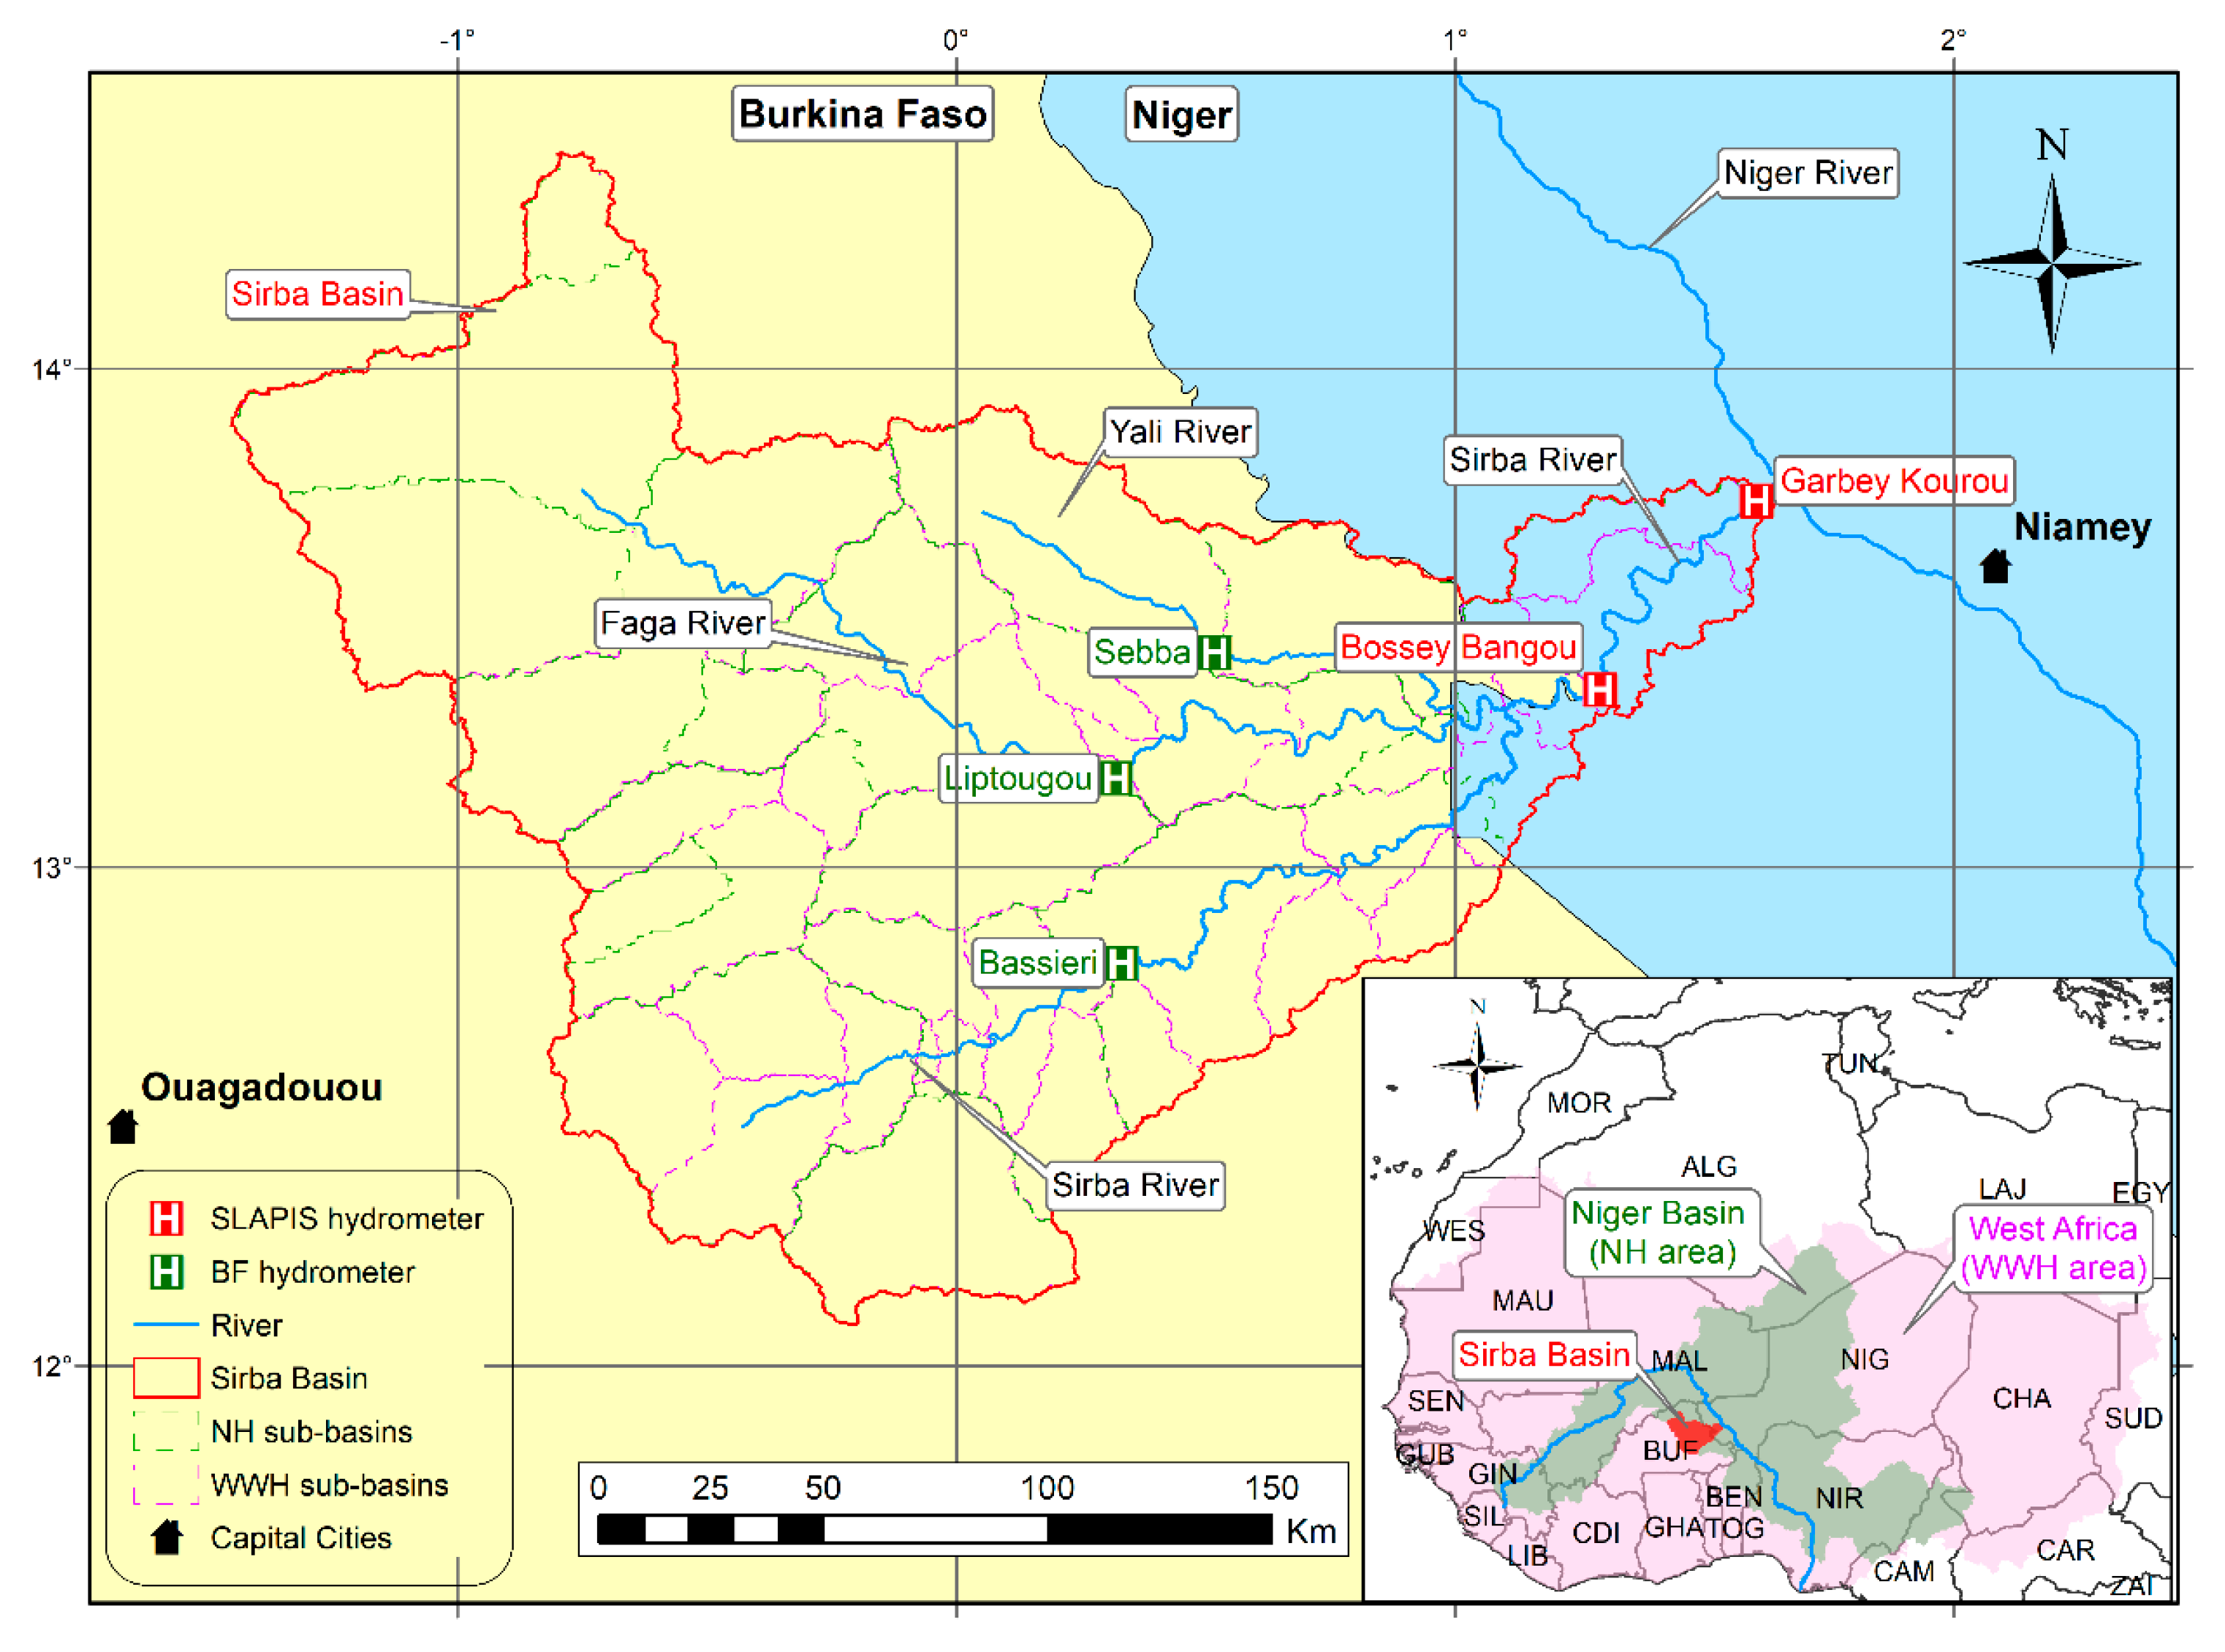
Figure 1. Geographical framework of the study area: the Sirba River Basin with the hydrometers, the main hydrographic network, the administrative boundaries, and the sub-basins of NH (Niger HYPE) and WWH (World-Wide HYPE) models. Bottom right: West Africa overview with NH and WWH covered surface.
Water 12 03504 g001
Figure 2. Comparison of Sirba River average hydrographs, over the four hydrological periods, at Garbey Kourou hydrometer.
Water 12 03504 g002
Figure 3. Contingency table used to calculate the categorical indices [30].
Water 12 03504 g003
Figure 4. Flow duration curve of the Sirba River at Garbey Kourou in the validation year 2019. Observed flow, NH and WWH 5-day forecasts before and after the optimization.
Water 12 03504 g004
Figure 5. Hydrograph of original and optimized 5-day Niger HYPE forecasts (5-day lead time series) at Garbey Kourou for training years (2016–2018) and validation year (2019).
Water 12 03504 g005
Figure 6. Hydrograph of original and optimized 5-day World-Wide HYPE forecasts in Garbey Kourou for training years (2017–2018) and validation year (2019).
Water 12 03504 g006
Figure 7. Hydrograph of original and optimized 5-day NH and WWH in Garbey Kourou for the wet season of the validation year (1 June 19–31 October 19).
Water 12 03504 g007
Figure 8. WWH forecasts data flow in SLAPIS spatial data infrastructure.
Water 12 03504 g008
Figure 9. User interface of SLAPIS platform with hydrograph of observed and forecasted discharge in Garbey Kourou the 25 August 2020. The black line is the observed flow, the grey line is the hydraulic forecast, and the red line the WWH optimized forecast.
Water 12 03504 g009
Table 1. Main features of Niger HYPE and World-Wide HYPE models.
ModelNiger HYPEWorld-Wide HYPE
Version2.231.3.6
Geographic DomainNiger River BasinWest Africa
Area (million km2)2.18.9
Sub-Basins (#)8034581
Average Sub-Basin Size (km2)26651870
Sub-basins in Sirba Watershed (#)17 (3 in Niger)29 (6 in Niger)
ID of the Sub-Basins Used5004 (Garbey Kourou)
3529 + 3472 + 4786 (upstream Bossey Bangou)
208596 (Garbey Kourou) 219145 (Bossey Bangou)
Forcing DataHydroGFD v. 1HydroGFD v. 2
Forecast Frequencydailydaily
Time of Forecast Productionafternoon (16 h–17 h)morning (11:30 h–12 h)
Analysis Period1 June 2016–3 March 20208 June 2017–3 March 2020
Table 2. Hazard thresholds for the Sirba River at Garbey Kourou hydrometer in SLAPIS and for Niger HYPE and World-Wide HYPE. “RP” is the return period magnitudes in years.
ScenarioSLAPISNiger-HYPEWorld-Wide HYPE
RP (year)Q (m3/s)RP (year)Q (m3/s)RP (year)Q (m3/s)
Yellow56002480296
Orange1080057005163
Red30150030108030274
Table 3. Formula, best and worst values and unit of measure (UM) for continuous indices. Where T is the number of observed/forecasted days, F is forecasted flow, O is observed flow and N the total number of the data.
IndexFormulaBest ValueWorst ValueUM
RMSE R M S E =   t = 1 T ( O t F t ) 2 N 0+ ∞(m3/s)
RSR R S R = R M S E S T d e v O B S = [   t = 1 T ( O t F t ) 2   t = 1 T ( O t 0 ¯ ) 2 ] 0+ ∞ (usually within 1)(-)
NSE N S E = 1 [   t = 1 T ( F t O t ) 2   t = 1 T ( O t 0 ¯ ) 2 ] 1− ∞ (usually within 0)(-)
Table 4. Formula, best and worst values and unit of measure (UM) for categorical indices.
IndexFormulaBest ValueWorst ValueUM
BIAS B I A S = a + b a + c 1Major distance from 1(-)
POD P O D = a a + c 10(-)
FAR F A R = b a + b 01(-)
PC P C = a + d a + b + c + d 10(-)
TS T S = a a + b + c 01(-)
HSS H S S = 2 ( a d b c ) ( a + c ) ( c + d ) + ( a + b ) ( b + d ) 01(-)
Table 5. Probability occurrence evaluation of the 12 homogeneous periods of the wet season in the last hydrological period (2009–2019).
MonthJuneJulyAugustSeptemberOct.Nov. May
Days-1–1011–2021–311–1011–2021–311–1011–2021–30--
Period123456789101112
QMIN (m3/s)0877120591571461485110
QMEAN (m3/s)64125214288480450566540468262311
QMAX (m3/s)449416579701121610441403120296569659466
Flood (#days)000426363740311000
Flood (%)0.00.00.02.214.119.620.121.716.85.40.00.0
Table 6. Basic statistical parameters (minimum, mean, and maximum) at Garbey Kourou in the validation year 2019. Observed flow, NH and WWH (5-day) forecasts before and after the optimization.
IndexObservedNHWWHOptimized NHOptimized WWH
Minimum (m3/s)0.00.40.00.40.0
Mean (m3/s)72.876.55.6108.4116.2
Maximum (m3/s)526.1557.784.6589.5564.3
Table 7. Continuous and categorical indices and operational availability for original and optimized forecasts (mean values of Garbey Kourou and Bossey Bangou). Best performance is shown in bold.
ModelRMSERSRNSEBIASPODFARPCTSHSSOperational Availability
NH107.70.640.580.660.230.710.9340.150.2281%
WWH161.51.050.100.000.00/0.9440.000.0092%
NHOTT76.20.460.791.220.620.500.9450.400.5381%
WWHOTT87.00.560.682.360.560.760.8750.200.2892%
Publisher’s Note: MDPI stays neutral with regard to jurisdictional claims in published maps and institutional affiliations.