Estimation of the Dependence of Ice Phenomena Trends on Air and Water Temperature in River


Abstract
1. Introduction
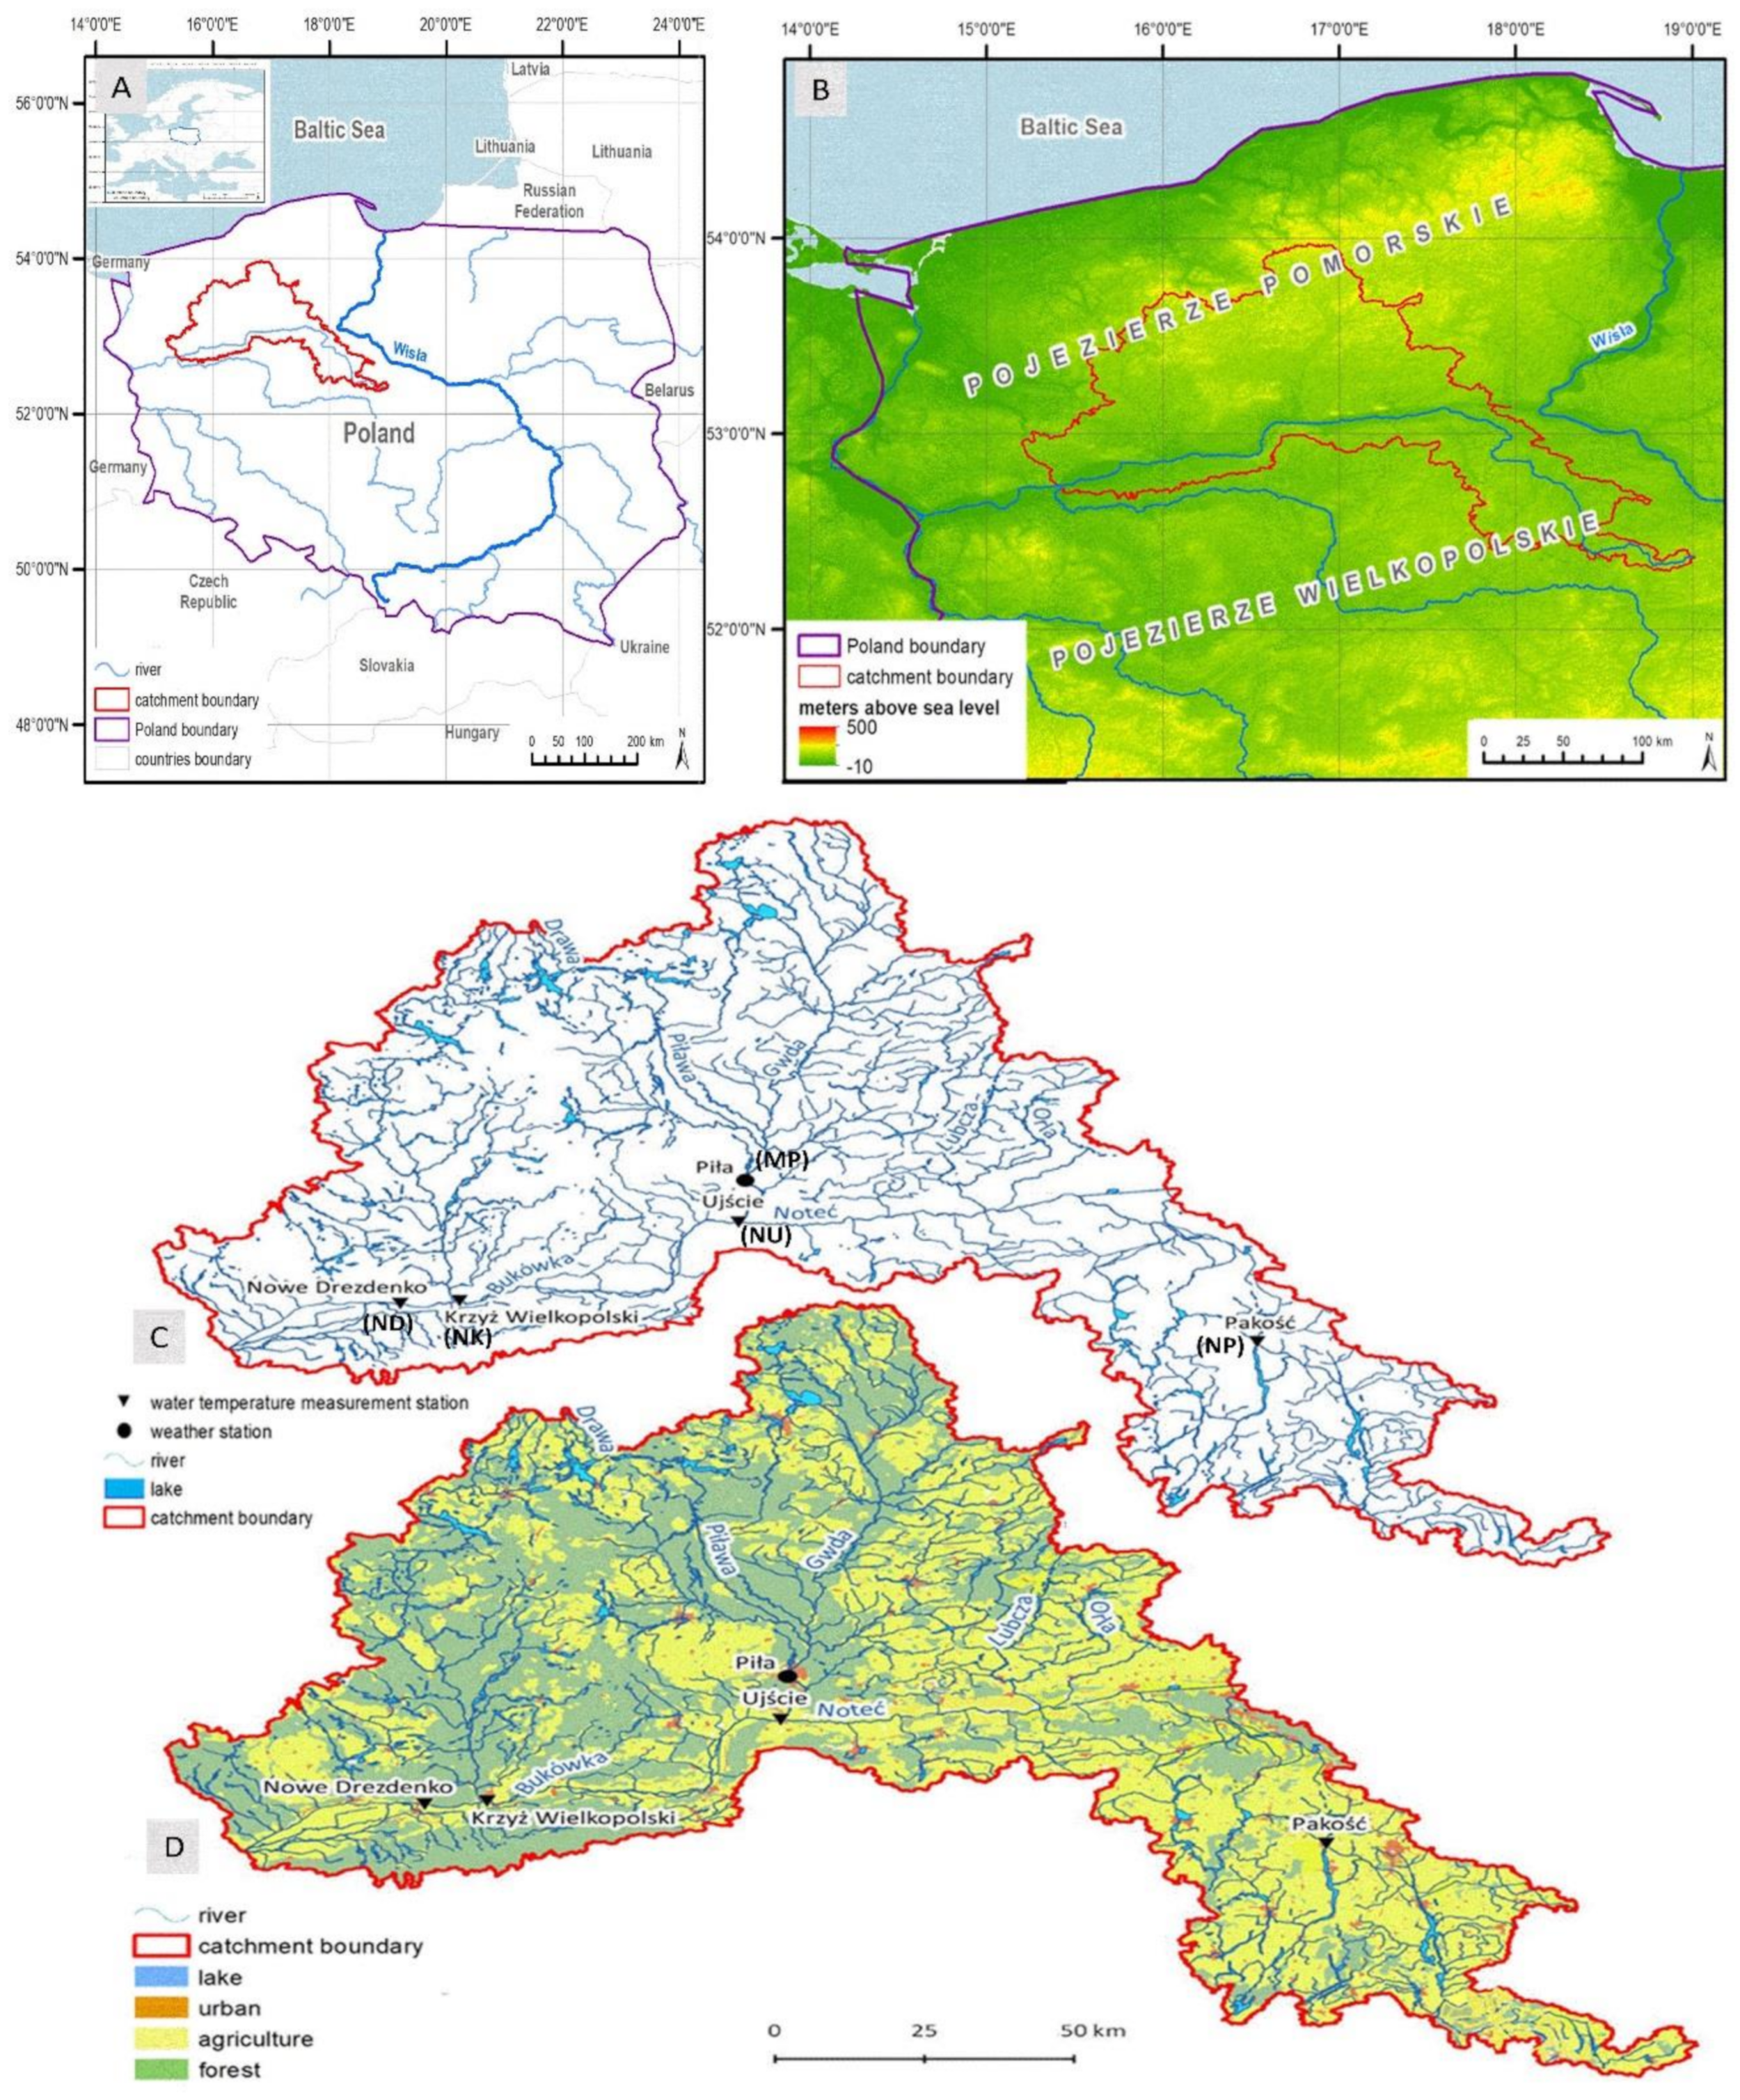
2. Study Area
3. Materials and Methods
4. Results
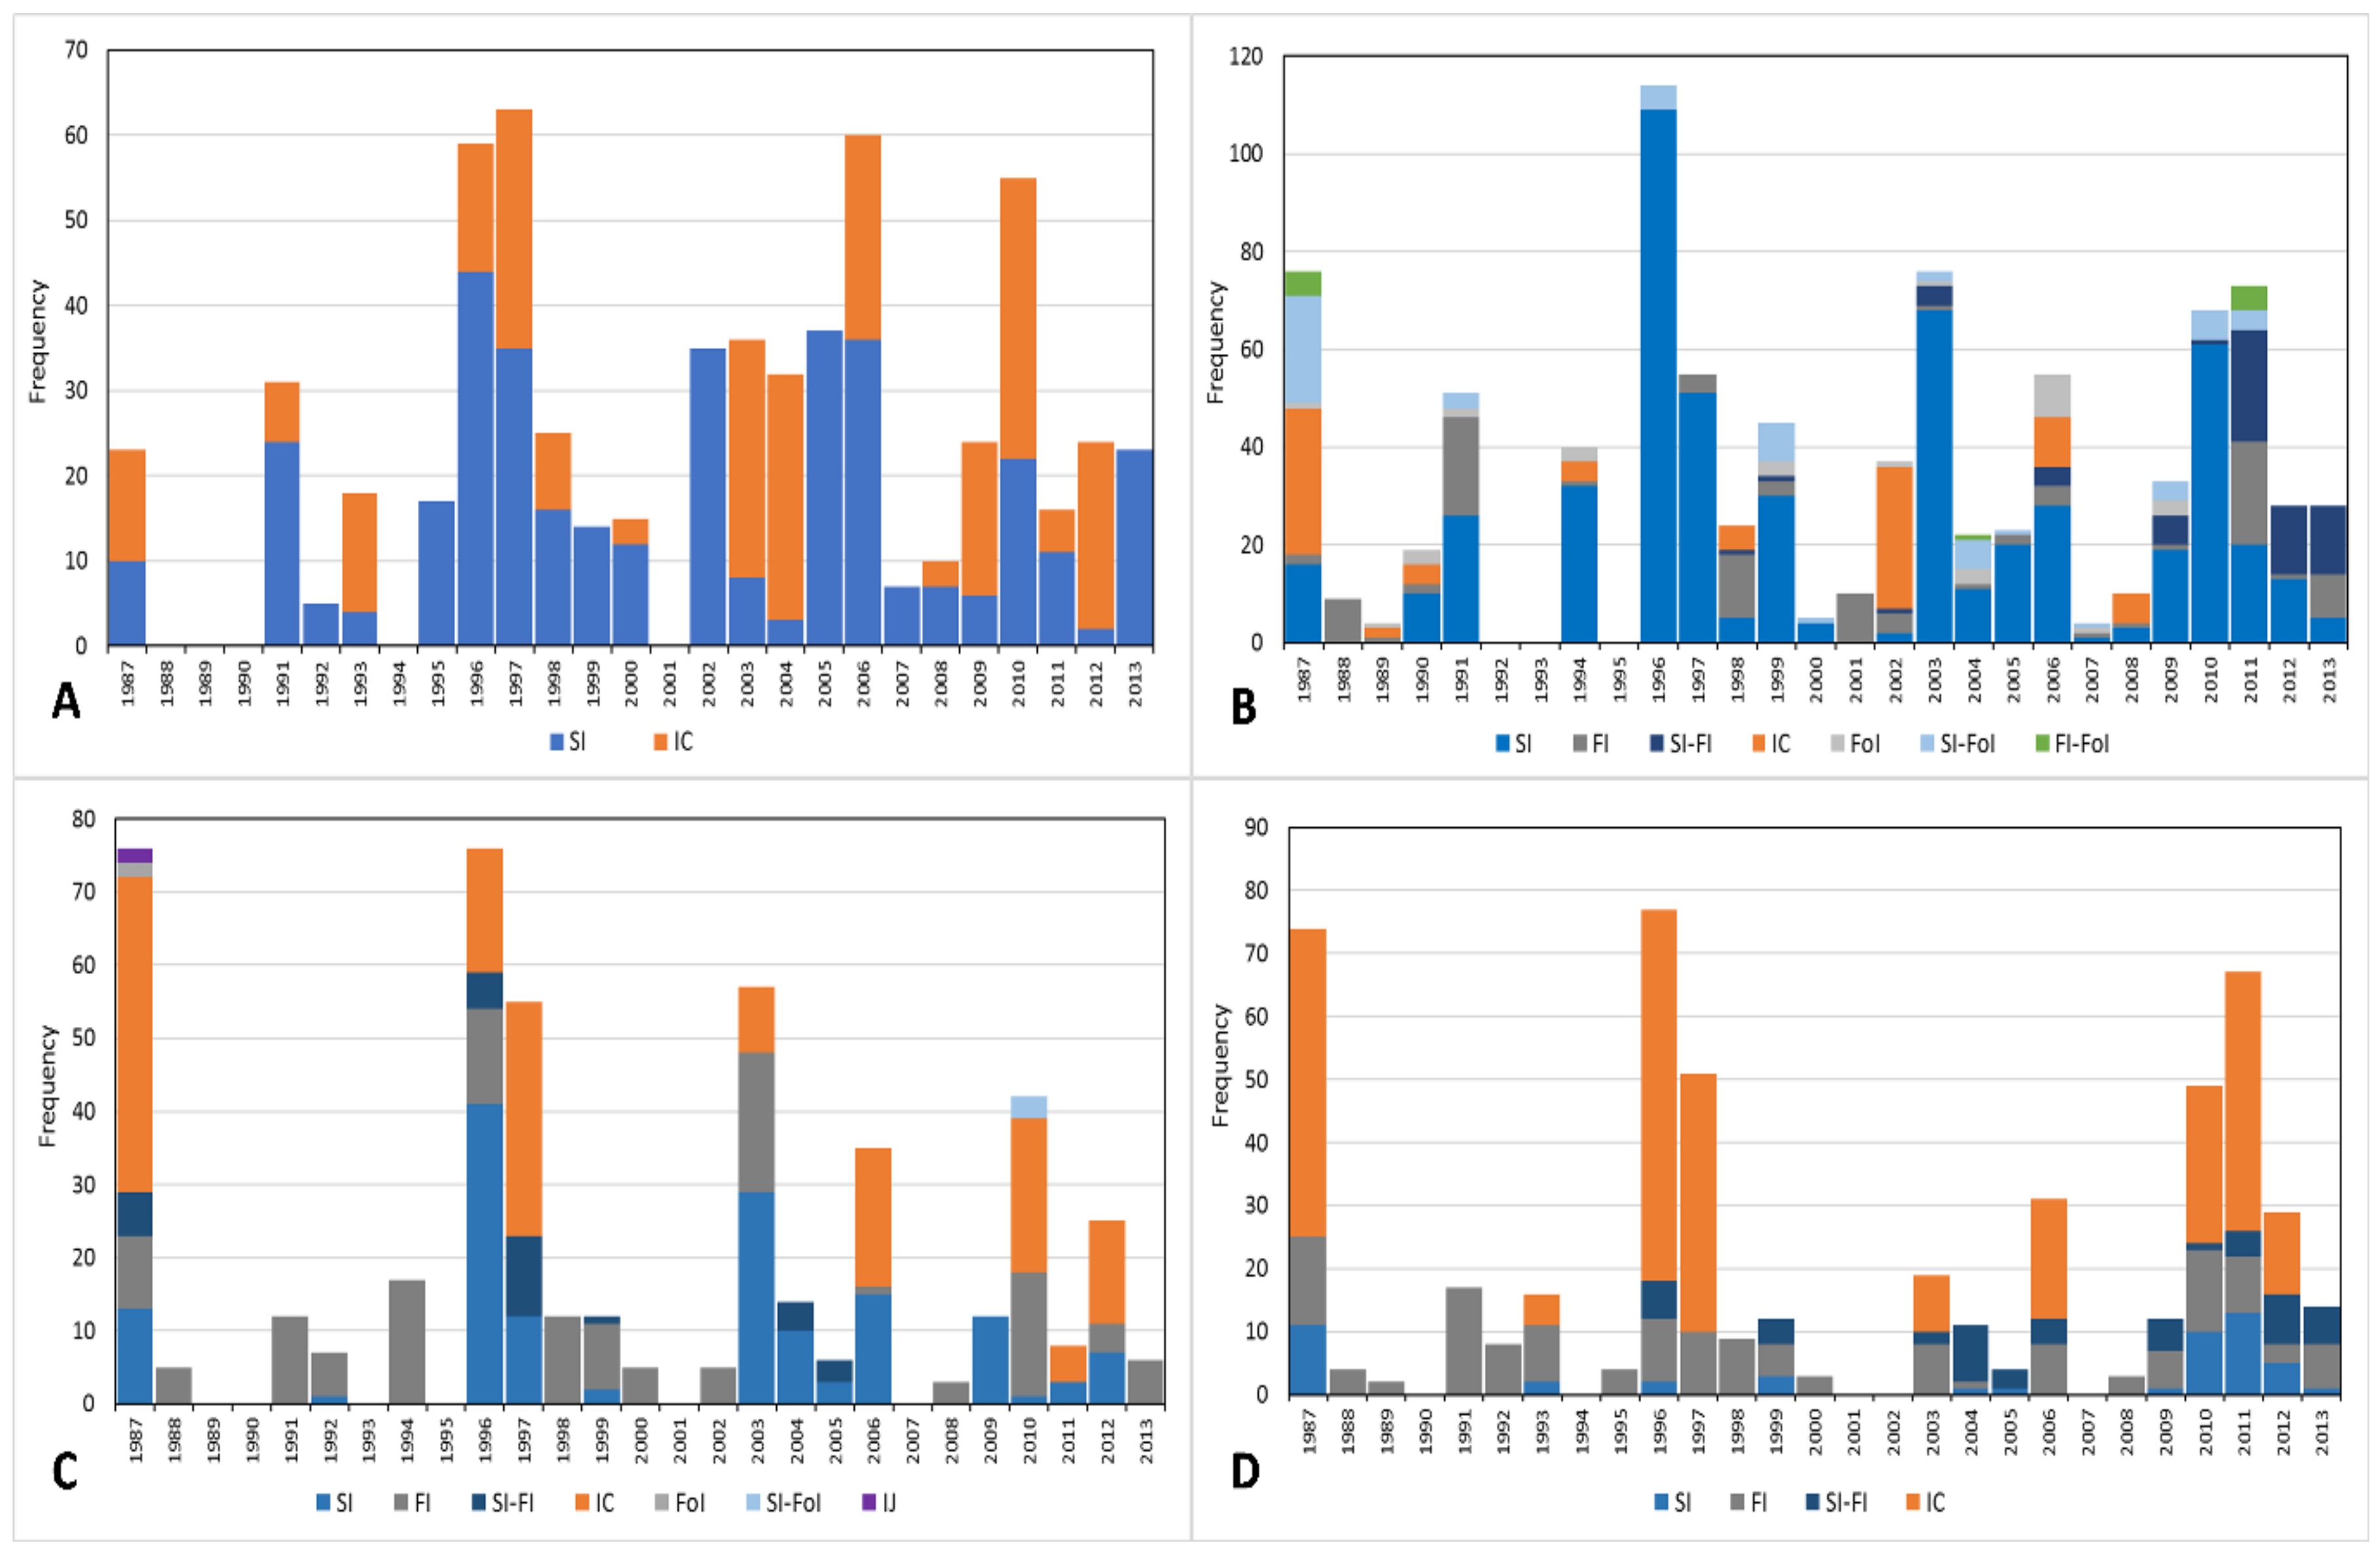
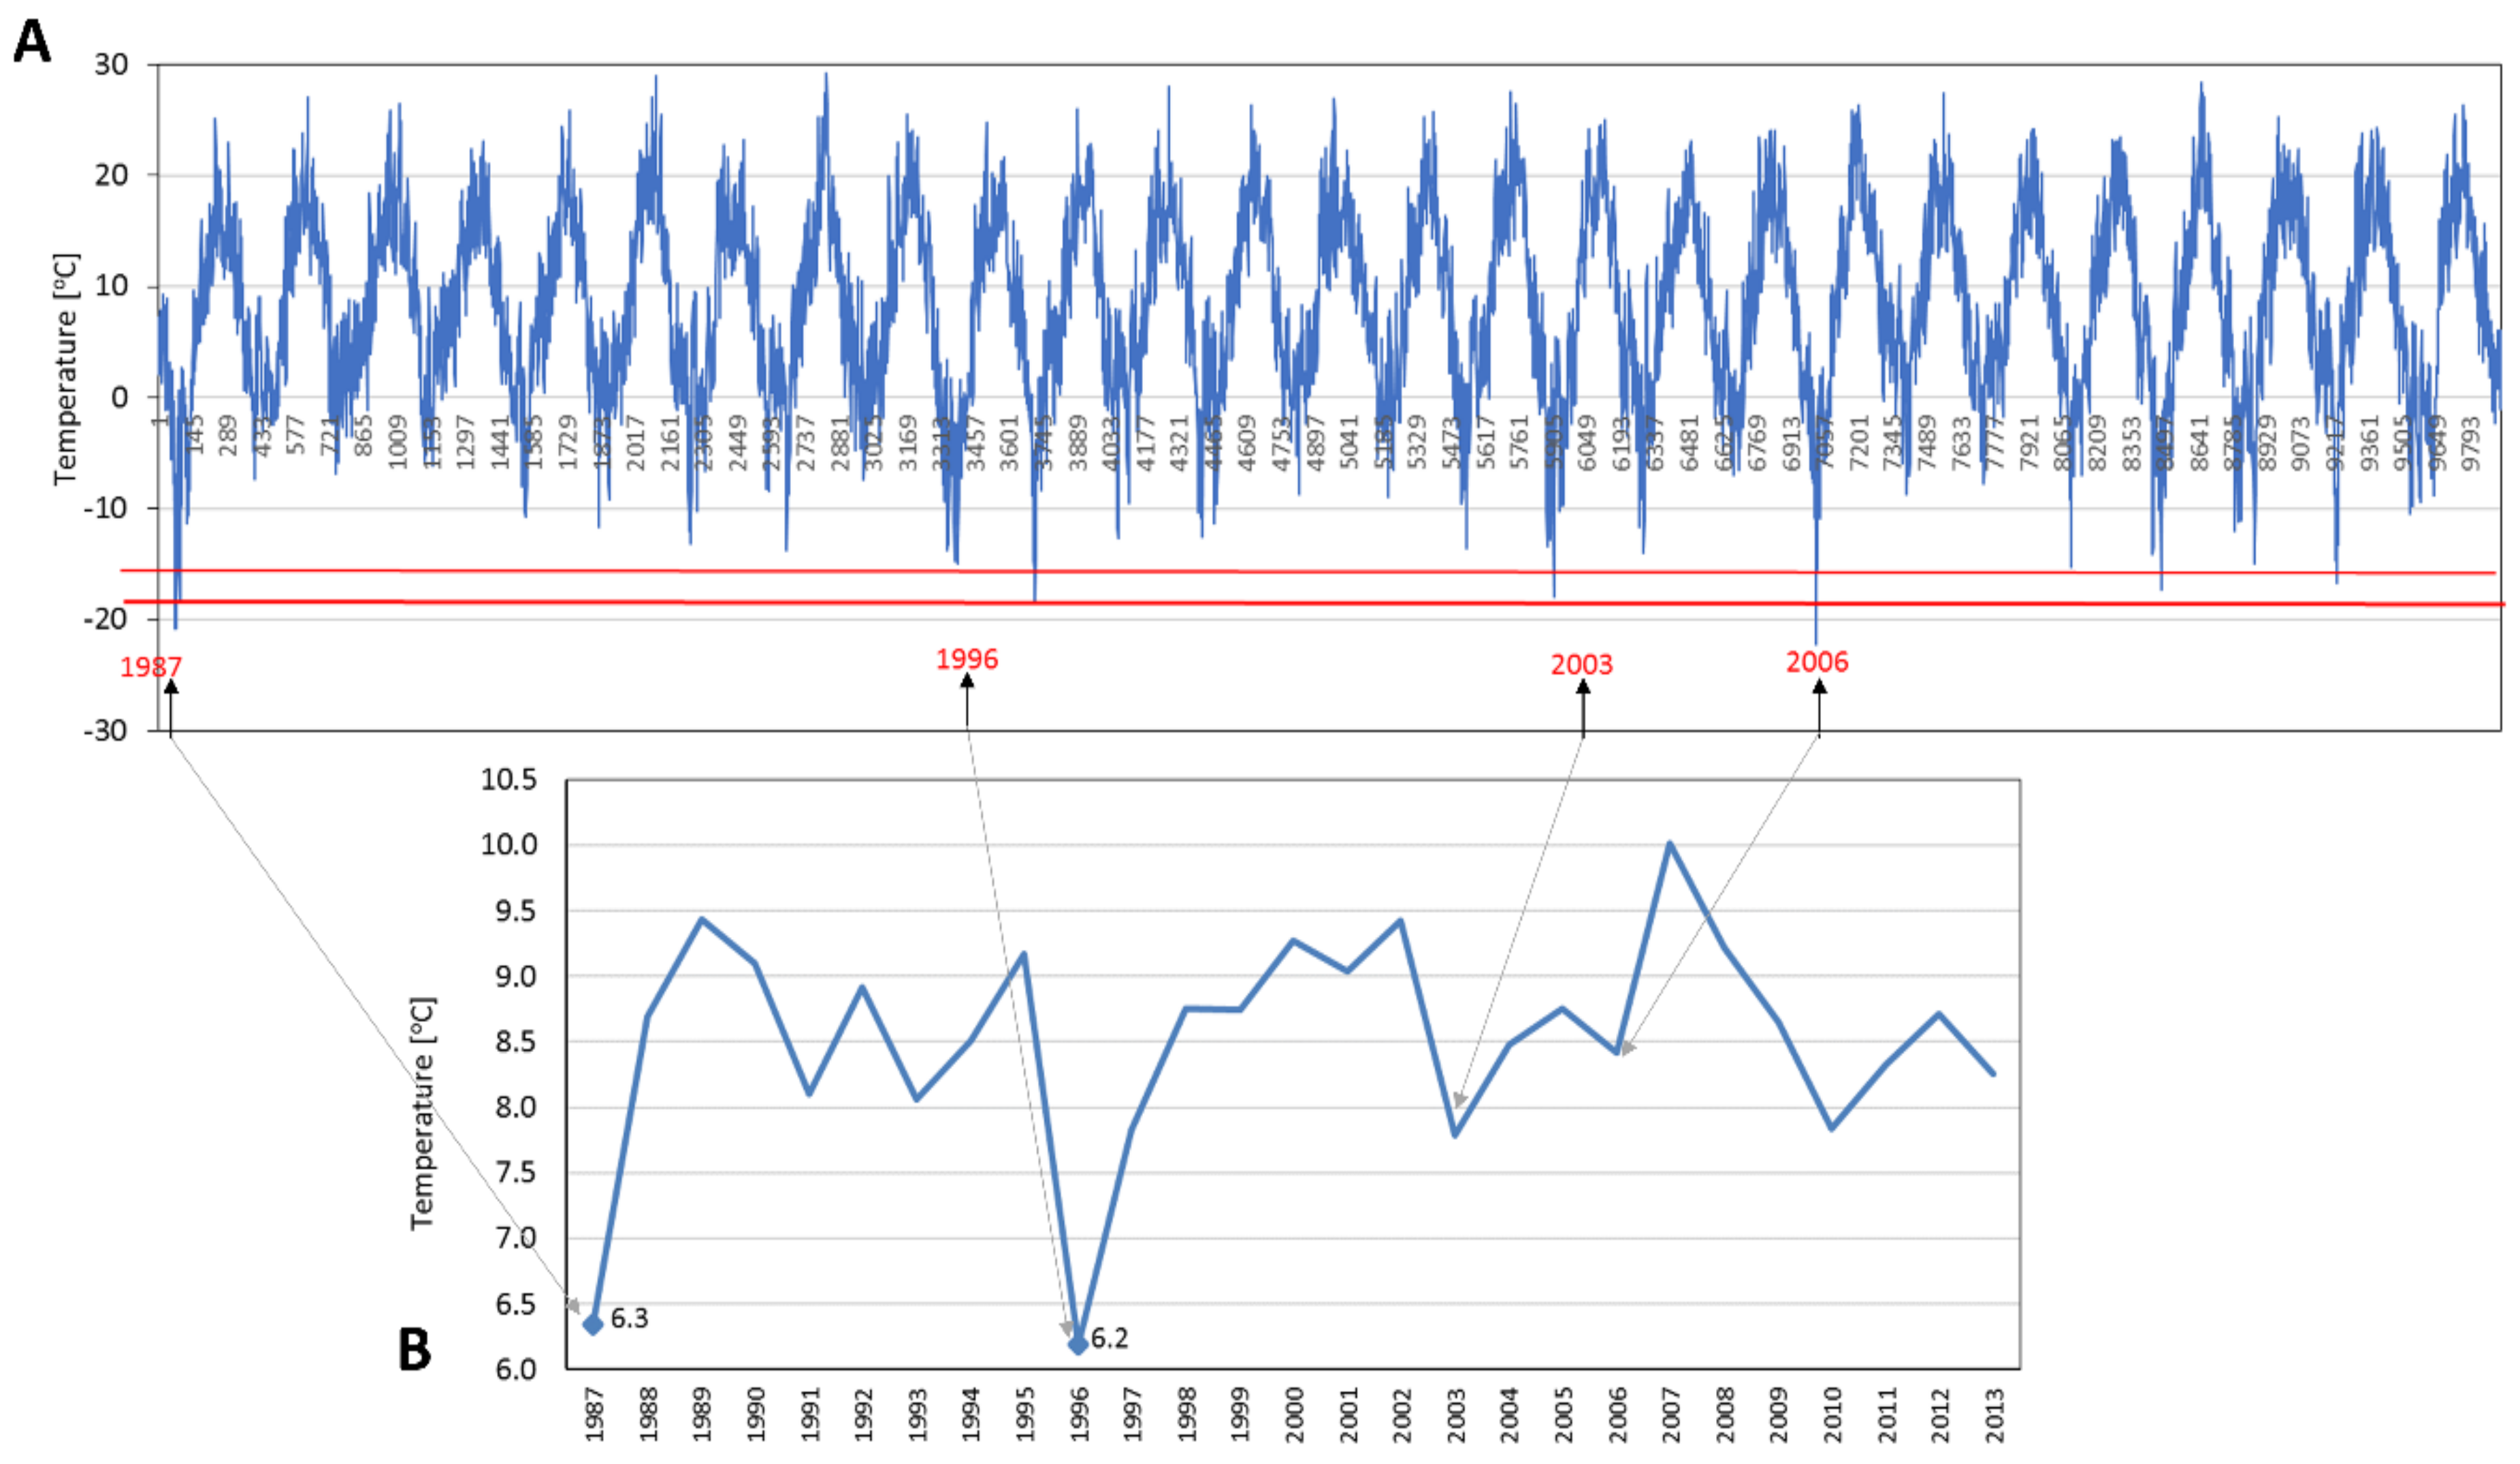
4.1. Frequency and Thermic Conditions of Occurrence of IP
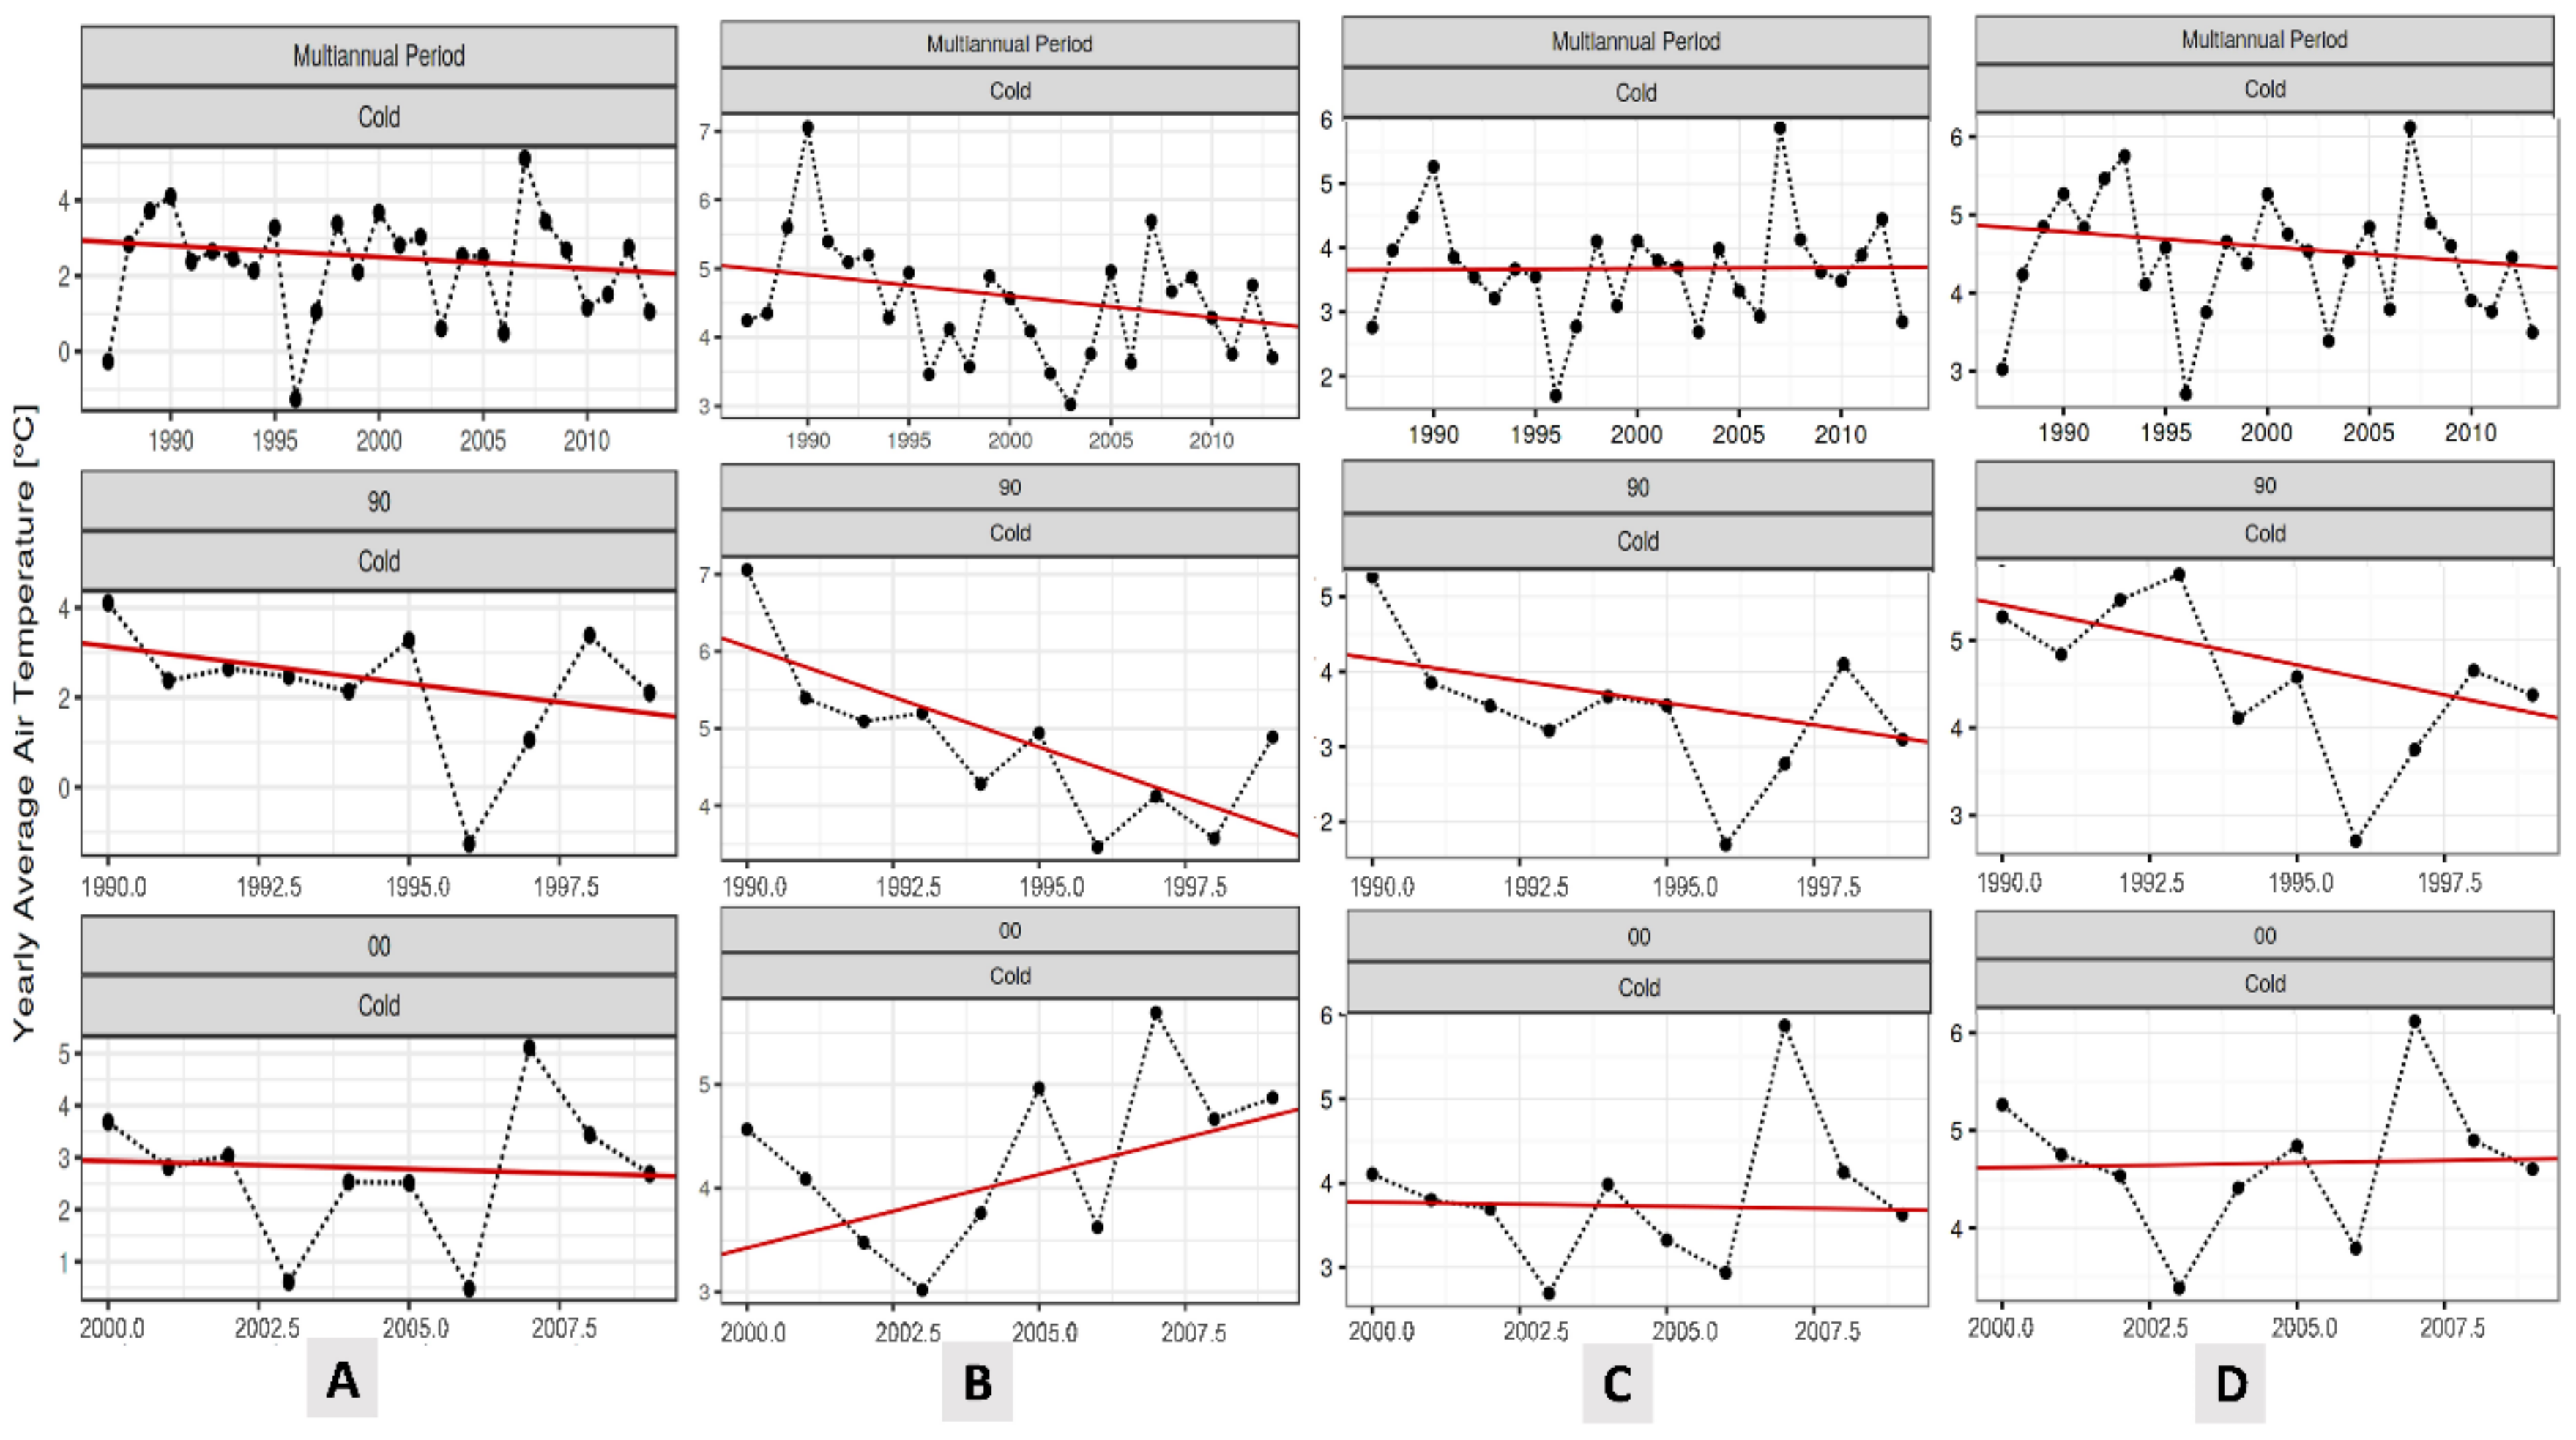
4.2. Linkage of Ice Phenomena Trends With Air and Water Temperature
5. Discussion
6. Conclusions
Funding
Acknowledgments
Conflicts of Interest
References
- Prowse, T.D.; Culp, J.M. Ice: Breakup: A neglected factor in river ecology. Can. J. Civ. Eng. 2003, 30, 128–144. [Google Scholar] [CrossRef]
- Allan, J.D.; Castillo, M.M. Stream Ecology: Structure and Function of Running Waters, 2nd ed.; Chapman and Hall: New York, NY, USA, 2007. [Google Scholar] [CrossRef]
- Borshch, S.V.; Ginzburg, B.M.; Soldatova, I.I. Modeling the development of ice phenomena in rivers as applied to the assessment of probable changes in ice conditions at various scenarios of the future climate. Water Resour. 2001, 28, 194–200. [Google Scholar] [CrossRef]
- Prowse, T.D.; Bonsal, B.R.; Duguay, C.R.; Lacroix, M.P. River-ice break-up/freeze-up: A review of climatic drivers, historical trends and future predictions. Ann. Glaciol. 2007, 26, 443–451. [Google Scholar] [CrossRef]
- Yoo, J.; D’Odorico, P. Trends and fluctuations in the dates of ice break-up of lakes and rivers in Northern Europe: The efect of the North Atlantic Oscillation. J. Hydrol. 2002, 268, 100–112. [Google Scholar] [CrossRef]
- Bonsal, B.R.; Prowse, T.D.; Duguay, C.R.; Lacroix, M.P. Impacts of large-scale teleconnections on freshwater-ice break/freeze-up dates over Canada. J. Hydrol. 2006, 330, 340–353. [Google Scholar] [CrossRef]
- Yang, X.; Pavelsky, T.M.; Allen, G.H. The past and future of global river ice. Nature 2020, 577, 69–73. [Google Scholar] [CrossRef] [PubMed]
- Grześ, M.; Ćmielewski, M. Variability of ice phenomena in selected rivers of the Arctic in the 20th century. Probl. Polar Climatol. 2008, 18, 69–78. (In Polish) [Google Scholar]
- Gebre, S.B.; Alfredsen, K.T. Investigation of river ice regimes in some Norwegian water courses. In Proceedings of the 16th Workshop on the Hydraulics of Ice Covered Rivers, Winnipeg, MB, Canada, 18–22 September 2011; CGU HS Committee on River Ice Processes and the Environment: Winnipeg, MB, Canada, 2011; pp. 1–20. [Google Scholar]
- Beltaos, S. Climate impacts on the ice regime of an Atlantic river. Nord. Hydrol. 2004, 35, 81–99. [Google Scholar] [CrossRef]
- Blenckner, T.; Järvinen, M.; Weyhenmeyer, G.A. Atmospheric circulation and its impact on ice phenology in Scandinavia. Boreal Environ. Res. 2004, 9, 371–380. [Google Scholar]
- Vuglinskly, V.S.; Gronskaya, T.P. Changing of rivers and lakes ice regime within the Russian territory and their possible consequences for economy. In Modern Problems of Hydrometeorology; Asterion: St. Petersburg, Russia, 2006; pp. 229–245. [Google Scholar]
- Kuusisto, E.; Elo, A.R. Lake and river ice variables as climate indicators in Northern Europe. Verh. Int. Ver. Limnol. 2000, 27, 2761–2764. [Google Scholar] [CrossRef]
- Magnuson, J.J.; Robertson, D.M.; Benson, B.J.; Wynne, R.H.; Livingstone, D.M.; Arai, T.; Assel, R.A.; Barry, R.G.; Card, V.; Kuusisto, E.; et al. Historical trends in lake and river ice cover in the Northern Hemisphere. Science 2000, 289, 1743–1746. [Google Scholar] [CrossRef] [PubMed]
- Sagarin, R.; Micheli, F. Climate change in nontraditional data sets. Science 2001, 294, 5543. [Google Scholar] [CrossRef] [PubMed]
- Beltaos, S.; Prowse, T.D. River-ice hydrology in a shrinking cryosphere. Hydrol. Process. 2009, 23, 122–144. [Google Scholar] [CrossRef]
- Bennett, K.E.; Prowse, T.D. Northern Hemisphere geography of ice-covered rivers. Hydrol. Process. 2010, 24, 235–240. [Google Scholar] [CrossRef]
- Ćmielewski, M. The freezing variability of the northern hemisphere rivers in the XX century. In II Workshops: Ice Problems of the Rivers “Congestion and High Water Jam” Abstracts of Lectures; Nicolaus Copernicus University: Toruń, Poland, 2010; pp. 16–17. (In Polish) [Google Scholar]
- Prowse, T.D.; Bonsal, B.R.; Duguay, C.R.; Hessen, D.O.; Vuglinsky, V.S. River and lake ice. In Global Outlook for Ice and Snow; United Nations Environment Programme (UNEP): Nairobi, Kenya, 2007; pp. 201–213. [Google Scholar]
- European Environment Agency EEA. RReport No 12/2012. Climate Change, Impacts and Vulnerability in Europe 2012en. 2012. Available online: http://www.eea.europa.eu/pl/themes (accessed on 10 July 2020).
- Graf, R. Variations of the thermal conditions of the Warta in the profile connecting the Urstromtal and gorge sections of the valley (Nowa Wieś Podgórna-Śrem-Poznań). In Nowoczesne Metody I Rozwiązania W Hydrologii I Gospodarce Wodnej; Absalon, D., Matysik, M., Ruman, M., Eds.; Komisja Hydrologiczna PTG, PTG Oddział Katowice: Katowice, Poland, 2015; pp. 177–194. (In Polish) [Google Scholar]
- Graf, R.; Łukaszewicz, J.T.; Jawgiel, K. The analysis of the structure and duration of ice phenomena on the Warta river in relation to thermic conditions in the years 1991–2010. Woda Środowisko Obsz. Wiej. 2018, 18, 5–28. (In Polish) [Google Scholar]
- Graf, R.; Tomczyk, A.M. The impact of cumulative negative air temperature degree-days on the appearance of ice cover on a river in relation to atmospheric circulation. Atmosphere 2018, 9, 204. [Google Scholar] [CrossRef]
- Graf, R.; Łukaszewicz, J.T.; Jawgiel, K. Ice phenomena. In Waters of Wielkopolska. Surface Waters. Rivers; Choiński, A., Ed.; SERIA GEOGRAFIA NR 103; Wydawnictwo Naukowe UAM: Poznań, Poland, 2019; pp. 186–226. (In Polish) [Google Scholar]
- Łukaszewicz, J.; Graf, R. The variability of ice phenomena on the rivers of the Baltic coastal zone in the Northern Poland. J. Hydrol. Hydromech. 2020, 68, 38–50. [Google Scholar] [CrossRef]
- Kalinin, V.G.; Chichagov, V.V. The study of long-term fluctuations in the dates of ice formation and ice destruction in the rivers of the Votkinsk reservoir catchment. In Modern Problems of Reservoirs and Their Catchments, IOP Conf. Series: Earth and Environmental Science; IOP Publishing: Bristol, UK, 2019; Volume 321, p. 012028. [Google Scholar]
- Efremova, T.V.; Pal’shin, N.I. Ice Phenomena Terms on the Water Bodies of Northwestern Russia. Russ. Meteorol. Hydrol. 2011, 36, 559–565. [Google Scholar] [CrossRef]
- Arctic Monitoring and Assessment Programme AMAP. Snow, Water, Ice and Permafrost in the Arctic. Summary for Policy-Makers. Climate Change and the Cryosphere; Arctic Monitoring and Assessment Programme (AMAP): Oslo, Norway, 2011; Available online: https://www.amap.no/documents/doc/snow-water-ice-and-permafrost-in-the-arctic-swipa-climate-change-and-the-cryosphere/743 (accessed on 10 July 2020).
- Cheng, B.; Vihma, T.; Launiainen, J. Modelling of the superimposed ice formation and sub-surface melting in the Baltic Sea. Geophysica 2003, 39, 31–50. [Google Scholar]
- Frauenfeld, O.W.; Zhan, T.; Mccreight, J.L. Northern Hemisphere freezing/thawing index variations over the twentieth century. Int. J. Climatol. 2007, 27, 47–63. [Google Scholar] [CrossRef]
- Majewski, W.; Mroziński, Ł. Ice phenomena on the Lower Vistula. Gospod. Wodna 2010, 1, 18–22. (In Polish) [Google Scholar]
- Caissie, D. The thermal regime of rivers: A review. Freshw. Biol. 2006, 51, 1389–1406. [Google Scholar] [CrossRef]
- Toffolon, M.; Siviglia, A.; Zolezzi, G. Thermal wave dynamics in rivers affected by hydropeaking. Water Resour. Res. 2010, 46, W08536. [Google Scholar] [CrossRef]
- Van Vliet, M.T.H.; Ludwig, F.; Zwolsman, J.J.G.; Weedon, G.P.; Kabat, P. Global river temperatures and sensitivity to atmospheric warming and changes in river flow. Water Resour. Res. 2011, 47, W02544. [Google Scholar] [CrossRef]
- Luo, Y.; Ficklin, D.L.; Liu, X.; Zhang, M. Assessment of climate change impacts on hydrology and water quality with a watershed modeling approach. Sci. Total Environ. 2013, 450–451, 72–82. [Google Scholar] [CrossRef]
- Caldwell, P.; Segura, C.; Laird, S.G.; Sun, G.; McNulty, S.G.; Sandercock, M.; Boggs, J.; Vose, J.M. Short-term stream water temperature observations permit rapid assessment of potential climate change impacts. Hydrol. Process. 2015, 29, 2196–2211. [Google Scholar] [CrossRef]
- Olsson, T.; Jakkila, J.; Veijalainen, N.; Backman, L.; Kaurola, J.; Vehviläinen, B. Impacts of climate change on temperature, precipitation and hydrology in Finland—Studies using bias corrected regional climate model data. Hydrol. Earth. Syst. Sci. 2015, 19, 3217–3238. [Google Scholar] [CrossRef]
- Graf, R.; Wrzesiński, D. Relationship between Water Temperature of Polish Rivers and Large-Scale Atmospheric Circulation. Water 2019, 11, 1690. [Google Scholar] [CrossRef]
- Graf, R.; Wrzesiński, D. Detecting Patterns of Changes in River Water Temperature in Poland. Water 2020, 12, 1327. [Google Scholar] [CrossRef]
- Graf, R. Distribution properties of a measurement series of river water temperature at different time resolution levels (Based on the example of the Lowland River Noteć, Poland). Water 2018, 10, 203. [Google Scholar] [CrossRef]
- Wrzesiński, D.; Sobkowiak, L. Detection of changes in flow regime of rivers in Poland. J. Hydrol. Hydromech. 2018, 66, 55–64. [Google Scholar] [CrossRef]
- Pawłowski, B.; Gorączko, M.; Szczerbińska, A. Zjawiska lodowe na rzekach w Polsce [Ice phenomena in Polish rivers]. In Hydrologia Polski; Jokiel, P., Marszelewski, W., Pociask-Karteczka, J., Eds.; Wydawnictwo Naukowe PWN: Warszawa, Poland, 2017; pp. 195–200. [Google Scholar]
- Ljung, G.M.; Box, G.E.P. On a Measure of Lack of Fit in Time Series Models. Biometrika 1978, 65, 297–303. [Google Scholar] [CrossRef]
- Mullahy, J. Specification and Testing of Some Modified Count Data Models. J. Econom. 1986, 33, 341–365. [Google Scholar] [CrossRef]
- Lambert, D. Zero-Inflated Poisson Regression, with an Application to Defects in Manufacturing. Technometrics 1992, 34, 1–14. [Google Scholar] [CrossRef]
- Vuong, Q.H. Likelihood Ratio Tests for Model Selection and non-Nested Hypotheses. Econometrica 1989, 57, 307–333. [Google Scholar] [CrossRef]
- Wilson, P. The misuse of the Vuong test for non-nested models to test for zero-inflation. Econom. Lett. 2015, 127, 51–53. [Google Scholar] [CrossRef]
- Yue, S.; Pilon, P.; Phinney, B.; Cavadias, G. The influence of autocorrelation on the ability to detect trend in hydrological series. Hydrol. Process. 2002, 16, 1807–1829. [Google Scholar] [CrossRef]
- Sen, P.K. Estimates of the regression coefficient based on Kendall’s tau. JASA 1968, 63, 1379–1389. [Google Scholar] [CrossRef]
- R Core Team. R: A Language and Environment for Statistical Computing; R Foundation for Statistical Computing: Vienna, Austria, 2013; Available online: http://www.R-project.org (accessed on 20 May 2020).
- Marszelewski, W.; Pawłowski, W. Long-Term Changes in the Course of Ice Phenomena on the Oder River along the Polish—German Border. In Water Resources Management: An International Journal, Published for the European Water Resources Association (EWRA); Springer: Berlin, Germany, 2019; Volume 33, pp. 5107–5120. [Google Scholar]
- Paczoska, Z. Freezing of rivers in Poland. Geogr. Res. 1937, 18–19, 29–69. (In Polish) [Google Scholar]
- Gołek, J. Ice Phenomena on Polish Rivers; PIHM, WKiŁL: Warsaw, Poland, 1957. [Google Scholar]
- Agafonova, S.A.; Frolova, N.L. Features of ice regime of Northern Dvina Rivers’ basin. Water Resour. J. 2007, 34, 123–131. (In Russian) [Google Scholar] [CrossRef]
- Klavins, M.; Briede, A.; Rodinov, V. Long term changes in ice and discharge regime of rivers in the Baltic region in relation to climatic variability. Clim. Chang. 2009, 95, 485–498. [Google Scholar] [CrossRef]
- Przybylak, R. Changes in Poland’s climate over the last millennium. Czas. Geogr. 2011, 82, 23–48. [Google Scholar]
- Dibike, Y.; Prowse, T.; Saloranta, T.; Ahmed, R. Response of Northern Hemisphere lake-ice cover and lake-water thermal structure patterns to a changing climate. Hydrol. Process. 2011, 25, 2942–2953. [Google Scholar] [CrossRef]
- Lindenschmidt, K.E.; Carstensen, D.; Fröhlich, W.; Hentschel, B.; Iwicki, S.; Kögel, M.; Kubicki, M.; Kundzewicz, Z.W.; Lauschke, C.; Łazarów, A.; et al. Development of an ice jam flood forecasting system for the Lower Oder River: Requirements for real-time predictions of water, ice and sediment transport. Water 2019, 11, 95. [Google Scholar] [CrossRef]
- Webb, B.W.; Nobilis, F. Long-term changes in river temperature and the influence of climatic and hydrological factors. Hydrol. Sci. J. 2007, 52, 74–85. [Google Scholar] [CrossRef]
- Ustrnul, Z.; Czekierda, D.; Wypych, A. Extreme values of air temperature in Poland according to different atmospheric circulation classifications. Phys. Chem. Earth 2010, 35, 429–436. [Google Scholar] [CrossRef]
- Tomczyk, A.M.; Bednorz, E. Heat and cold waves on the southern coast of the Baltic Sea. Baltica 2014, 27, 45–54. [Google Scholar] [CrossRef]
- Ginzburg, B.M.; Soldatova, I.I. Long-term fluctuations in terms of freezing and opening of rivers in various geographical areas. Meteorol. Gidrol. 1996, 6, 101–108. (In Russian) [Google Scholar]
- Frolova, N.; Agafonova, S.; Nesterenko, D. Water and ice regimes of the rivers of European Russia under climate change. In Hydro-Climatology: Variability and Change, Proceedings of the Symposium J-H02 held during IUGG2011, Melbourne, Australia, 28 June–7 July 2011; IAHS: Wallingford, UK, 2011; p. 344. Available online: https://iahs.info/uploads/dms/16763.14-63-68-344-39-Frolova--Agafonova---Nesterenko.pdf (accessed on 20 June 2020).
- Ćmielewski, M.; Grześ, M. Perennial variability of the Vistula freezing process in Toruń and Niemen in Smolniki in the 19th and 20th centuries. Gospod. Wodna 2010, 3, 112–115. (In Polish) [Google Scholar]
- Bączyk, A.; Suchożebrski, J. Variability of ice phenomena on the Bug River (1903–2012). Inżynieria Ekol. 2016, 49, 136–142. (In Polish) [Google Scholar] [CrossRef]
- Woolway, R.I.; Dokulil, M.T.; Marszelewski, W.; Schmid, M.; Bouffard, D.; Merchant, C.J. Warming of Central European lakes and their response to the 1980s climate regime shift. Clim. Chang. 2017, 142, 505–520. [Google Scholar] [CrossRef]
- Maberly, S.C.; O’Donnell, R.A.; Woolway, R.I.; Cutler, M.E.J.; Gong, M.; Jones, I.D.; Merchant, C.J.; Miller, C.A.; Politi, E.; Scott, E.M.; et al. Global lake thermal regions shift under climate change. Nat. Commun. 2020, 11, 1232. [Google Scholar] [CrossRef] [PubMed]
- Savichev, O.G.; Tarasov, A.; Zemtsov, V.A. Assessment methodology for the backwater levels caused by ice jams: A case study of the rivers of Tom and Chulym (the Ob River drainage basin, Western Siberia, Russia). Earth Environ. Sci. 2019, 400, 012005. [Google Scholar] [CrossRef]
- Kożuchowski, K.; Żmudzka, E. Warming in Poland: Scale and seasonal distribution in changes of air temperature in the second half of 20th century. Przegląd Geofiz. 2001, 46, 81–90. (In Polish) [Google Scholar]
- Kundzewicz, Z.W. Climate changes, their reasons and effects—Observations and projections. Landf. Anal. 2011, 15, 39–49. [Google Scholar]
- Marszelewski, W.; Pius, B. Long-term changes in temperature of river waters in the transitional zone of the temperate climate: A case study of Polish rivers. Hydrol. Sci. J. 2016, 61, 1430–1442. [Google Scholar] [CrossRef]
- Marszelewski, W.; Pius, B. Relation between air temperature and inland surface water temperature during climate change (1961–2014): Case study of the Polish Lowland. In Water Management and the Environment: Case Studies; Zelenakova, M., Ed.; Springer: Berlin, Germany, 2018; pp. 175–195. [Google Scholar]
- Kornaś, M. Ice phenomena in the Warta River in Poznań in 1961–2010. Quaest. Geogr. 2014, 33, 51–59. [Google Scholar] [CrossRef]
- Pawłowski, B. Determinants of change in the duration of the ice phenomena on the Vistula River in Toruń. J. Hydrol. Hydromech. 2015, 63, 145–153. [Google Scholar] [CrossRef]
- Pawłowski, B. Course of Ice Phenomena on the Lower Vistula River in 1960–2014; Nicholas Copernicus University: Toruń, Poland, 2017. (In Polish) [Google Scholar]
- Wolski, K.; Tymiński, T.; Głuchowska, B. Analysis of ice phenomena hazard on the middle Odra river. Land Reclam. Ser. Ann. Wars. Univ. Life Sci. 2017, 49, 301–314. [Google Scholar] [CrossRef]
- Hurrell, J.W. Decadal Trends in the North Atlantic Oscillation: Regional Temperatures and Precipitation. Science 1995, 269, 676–679. [Google Scholar] [CrossRef]
- Styszyńska, A.; Marsz, A. Mechanisms of Atmospheric Climate Change—The Problem of Modern Warming. In Energy of the Future, Energy Saving Installations and Systems; Kwiatkowski, Z.R., Ed.; INFOTECH: Gdańsk, Poland, 2015; p. 17. [Google Scholar]
- DeWeber, J.T.; Wagner, T. A regional neural network ensemble for predicting mean daily river water temperature. J. Hydrol. 2014, 517, 187–200. [Google Scholar] [CrossRef]
- Detenbeck, N.E.; Morrison, A.C.; Abele, R.W.; Kopp, D.A. Spatial statistical network models for stream and river temperature in New England, USA. Water Resour. Res. 2016, 52, 6018–6040. [Google Scholar] [CrossRef]
- Bogan, T.; Mohseni, O.; Stefan, H.G. Stream temperature equilibrium temperature relationship. Water Resour. Res. 2003, 39, 1245. [Google Scholar] [CrossRef]
- Van Vliet, M.T.H.; Franssen, W.H.P.; Yearsley, J.R.; Ludwig, F.; Haddeland, I.; Lettenmaier, D.P.; Kabat, P. Global river discharge and water temperature under climate change. Glob. Environ. Chang. 2013, 23, 450–464. [Google Scholar] [CrossRef]
- Hocking, D.J.; O’Neil, K.; Letcher, B.H. A hierarchical model of daily stream temperature for regional predictions. PeerJ Prepr. 2018, 6, e27069v1. [Google Scholar]
- Lowney, C.L. Stream temperature variation in regulated rivers: Evidence for a spatial pattern in daily minimum and maximum magnitudes. Water Resour. Res. 2000, 36, 2947–2955. [Google Scholar] [CrossRef]
- Takács, K.; Nagy, B.; Kern, Z. Human Impacts on River Ice Regime in the Carpathian Basin. Available online: http://meetingorganizer.copernicus.org (accessed on 28 October 2019).


| Water Gauge | The Form of the IP * |
|---|---|
| NP (Pakość) | SI * and IC |
| NU (Ujście) | SI, FI, SI–FI, IC, FoI, and SI–FoI |
| NK (Krzyż Wielkopolski) | SI, FI, SI–FI, and IC |
| ND (Nowe Drezdenko) | SI, FI, SI–FI, and IC |
| Water Gauge | NP | NU | NK | ND | ||||
|---|---|---|---|---|---|---|---|---|
| IP | X -squared | p -value | X -squared | p -value | X -squared | p -value | X -squared | p -value |
| SI | 4.715 | 0.909 | 8.449 | 0.585 | 8.265 | 0.603 | <1% | <1% |
| FI | <1% | <1% | 8.628 | 0.568 | 13.83 | 0.181 | 9.047 | 0.528 |
| SI–FI | <1% | <1% | 13.79 | 0.183 | <1% | <1% | <1% | <1% |
| IC | 12.75 | 0.238 | 3.746 | 0.958 | 11.7 | 0.306 | 12.49 | 0.254 |
| FoI | <1% | <1% | <1% | <1% | <1% | <1% | <1% | <1% |
| SI–FoI | <1% | <1% | 1.932 | 0.997 | <1% | <1% | <1% | <1% |
| IJ | <1% | <1% | <1% | <1% | <1% | <1% | <1% | <1% |
| TW (°C) | 9.893 | 0.45 | 8.352 | 0.595 | lack | lack | <1% | <1% |
| TA (°C) | X-squared = 6.286 p-value = 0.791 | |||||||
| Water Gauges | IP | Vuong z-Statistic | p-Value |
|---|---|---|---|
| NP | SI | 1.09 | 0.137 |
| IC | 1.90 | 0.028 | |
| NU | FI | −0.26 | 0.398 |
| SI | 1.02 | 0.153 | |
| IC | 1.17 | 0.121 | |
| SI–FI | −0.35 | 0.361 | |
| SI–FoI | 0.60 | 0.274 | |
| NK | FI | 1.16 | 0.121 |
| SI | −0.78 | 0.215 | |
| IC | 3.48 | 0.0002 | |
| ND | FI | 0.90 | 0.184 |
| IC | 3.16 | 0.001 |
| Water Gauges | SI | FI | SI–FI | IC | FoI | SI–FoI | FI–FoI | IJ | Sum of Days with IP | Average Number of Days with IP |
|---|---|---|---|---|---|---|---|---|---|---|
| NP—upper course | 378 | 0 | 0 | 251 | 0 | 0 | 0 | 0 | 629 | 27 |
| NU—middle course | 534 | 90 | 11 | 69 | 31 | 63 | 111 | 0 | 909 | 40 |
| NK—lower course | 149 | 144 | 30 | 160 | 2 | 3 | 0 | 2 | 490 | 21 |
| ND—lower course | 53 | 240 | 54 | 385 | 0 | 0 | 0 | 0 | 732 | 32 |
| Water Gauge | Years (Decades) | SI | FI | SI–FI | IC | FoI | SI–FoI | FI–FoI | IJ |
|---|---|---|---|---|---|---|---|---|---|
| NP | 80 | 10 | 0 | 0 | 13 | 0 | 0 | 0 | 0 |
| 90 | 159 | 0 | 0 | 73 | 0 | 0 | 0 | 0 | |
| 0 | 151 | 0 | 0 | 105 | 0 | 0 | 0 | 0 | |
| 10 | 58 | 0 | 0 | 60 | 0 | 0 | 0 | 0 | |
| NU | 80 | 16 | 12 | 0 | 32 | 2 | 22 | 5 | 0 |
| 90 | 263 | 43 | 2 | 13 | 11 | 16 | 0 | 0 | |
| 0 | 156 | 25 | 15 | 45 | 18 | 15 | 1 | 0 | |
| 10 | 99 | 31 | 52 | 0 | 0 | 10 | 5 | 0 | |
| NK | 80 | 13 | 15 | 6 | 43 | 2 | 0 | 0 | 2 |
| 90 | 56 | 69 | 17 | 49 | 0 | 0 | 0 | 0 | |
| 0 | 69 | 33 | 7 | 28 | 0 | 0 | 0 | 0 | |
| 10 | 11 | 27 | 0 | 40 | 0 | 3 | 0 | 0 | |
| ND | 80 | 14 | 107 | 2 | 173 | 0 | 0 | 0 | 0 |
| 90 | 7 | 72 | 10 | 105 | 0 | 0 | 0 | 0 | |
| 0 | 3 | 29 | 23 | 28 | 0 | 0 | 0 | 0 | |
| 10 | 29 | 32 | 19 | 79 | 0 | 0 | 0 | 0 |
| Station | Period/Decade | dT | dTn | T0 | tau | p-Value |
|---|---|---|---|---|---|---|
| NP | 1987–2013 | −0.007 | −0.18 | 11.0 | −0.13 | 0.332 |
| 90 | −0.081 | −0.81 | 11.44 | −0.38 | 0.175 | |
| 00 | −0.0003 | −0.002 | 11.04 | 0 | 1 | |
| NU | 1987–2013 | 0.028 | 0.77 | 9.73 | 0.23 | 0.093 |
| 90 | 0.004 | 0.04 | 9.95 | −0.11 | 0.754 | |
| 00 | 0.041 | 0.41 | 10.21 | 0.27 | 0.348 | |
| ND | 1987–2013 | 0.009 | 0.25 | 10.20 | 0.04 | 0.757 |
| 90 | −0.042 | −0.42 | 10.51 | −0.16 | 0.602 | |
| 00 | 0.0002 | 0.001 | 10.53 | 0.16 | 0.602 | |
| MP (meteorological station) | 1987–2913 | −0.001 | −0.04 | 8.69 | −0.12 | 0.377 |
| 90 | −0.027 | −0.27 | 8.82 | 0.05 | 0.916 | |
| 00 | −0.024 | −0.24 | 8.98 | 0.05 | 0.916 |
| Station | Period/Decade | dT | dTn | T0 | tau | p-Value |
|---|---|---|---|---|---|---|
| NP | 1987–2013 | −0.031 | −0.83 | 5.00 | −0.206 | 0.145 |
| 90 | −0.260 | −2.60 | 6.05 | −0.611 | 0.028 | |
| 00 | 0.141 | 1.41 | 3.42 | 0.555 | 0.047 | |
| NU | 1987–2013 | 0.001 | 0.04 | 3.65 | −0.089 | 0.537 |
| 90 | −0.117 | −1.17 | 4.17 | −0.222 | 0.465 | |
| 00 | −0.010 | −0.10 | 3.77 | 0.111 | 0.754 | |
| ND | 1987–2013 | −0.019 | −0.51 | 4.84 | −0.236 | 0.093 |
| 90 | −0.137 | −1.370 | 5.40 | −0.333 | 0.251 | |
| 00 | 0.009 | 0.097 | 4.6 | 0.166 | 0.602 | |
| MP (meteorological station) | 1987–2013 | −0.030 | −0.825 | 2.89 | −0.150 | 0.290 |
| 90 | −0.165 | −1.656 | 3.13 | −0.166 | 0.602 | |
| 00 | −0.030 | −0.305 | 2.93 | 0.111 | 0.754 |
| Model | Count Model Coefficients (Negbin with Log Link) | Zero-Inflation Model Coefficients (Binomial with Logit Link) | ||||||
|---|---|---|---|---|---|---|---|---|
| Frequency—Number of Days | Zero | |||||||
| Statistics | Estimate | Std. Error | z Value | Pr(>|z|) | Estimate | Std. Error | z Value | Pr(>|z|) |
| NP (water gauge) | ||||||||
| (Intercept) | 0.85 | 3.94 | 0.21 | 0.828 | −17.11 | 19.04 | −0.88 | 0.368 |
| TimeTrend | 0.004 | 0.02 | 0.18 | 0.853 | −0.32 | 0.16 | −1.92 | 0.054 |
| TA | −0.39 | 0.24 | −1.61 | 0.105 | 1.95 | 1.68 | 1.15 | 0.246 |
| TW | 0.48 | 0.46 | 1.04 | 0.296 | 0.13 | 2.14 | 0.06 | 0.948 |
| NU | ||||||||
| (Intercept) | 10.83 | 4.66 | 2.32 | 0.020 * | −19.11 | 15.36 | −1.24 | 0.213 |
| TimeTrend | 0.001 | 0.03 | 0.04 | 0.962 | −0.32 | 0.15 | −2.05 | 0.039 * |
| TA | −1.06 | 0.29 | −3.57 | 0.0003 *** | 1.19 | 1.25 | 0.94 | 0.342 |
| TW | 0.10 | 0.57 | 0.18 | 0.856 | 1.04 | 1.87 | 0.55 | 0.577 |
| NK | ||||||||
| (Intercept) | 10.08 | 3.22 | 3.12 | 0.001 ** | −18.37 | 11.06 | −1.66 | 0.096 |
| TimeTrend | 0.07 | 0.06 | 1.04 | 0.295 | −0.14 | 0.13 | −1.07 | 0.282 |
| TA | −1.12 | 0.49 | −2.26 | 0.023 * | 2.33 | 1.35 | 1.72 | 0.084 |
| Model | Count Model Coefficients (Negbin with Log Link) | Zero-Inflation Model Coefficients (Binomial with Logit Link) | ||||||
|---|---|---|---|---|---|---|---|---|
| Frequency—Number of Days | Zero | |||||||
| Statistics | Estimate | Std. Error | z Value | Pr(>|z|) | Estimate | Std. Error | z Value | Pr(>|z|) |
| NU (water gauge) | ||||||||
| (Intercept) | 6.53 | 7.30 | 0.89 | 0.371 | 6.83 | 829.34 | 0.008 | 0.993 |
| TimeTrend | 0.01 | 0.03 | 0.42 | 0.670 | 2.231 | 22.81 | 0.097 | 0.922 |
| TA | −0.57 | 0.57 | −1.01 | 0.311 | −35.82 | 131.08 | −0.273 | 0.784 |
| TW | −0.02 | 0.85 | −0.03 | 0.975 | 22.41 | 155.00 | 0.144 | 0.884 |
| NK | ||||||||
| (Intercept) | 4.89 | 1.38 | 3.52 | 0.0004 *** | −7.75 | 5.51 | −1.406 | 0.159 |
| TimeTrend | −0.007 | 0.01 | −0.41 | 0.680 | −0.007 | 0.05 | −0.143 | 0.886 |
| TA | −0.31 | 0.17 | −1.86 | 0.062 | 0.86 | 0.632 | 1.37 | 0.169 |
| ND | ||||||||
| (Intercept) | 1.11 | 2.22 | 0.50 | 0.616 | −17.77 | 18.03 | −0.98 | 0.324 |
| TimeTrend | −0.003 | 0.01 | −0.33 | 0.740 | 0.002 | 0.07 | 0.03 | 0.973 |
| TA | −0.865 | 0.27 | −3.17 | 0.001 ** | 2.77 | 1.83 | 1.50 | 0.131 |
| TW | 0.795 | 0.40 | 1.97 | 0.048 * | −0.77 | 2.55 | −0.301 | 0.762 |
| Model | Count Model Coefficients (Negbin with Log Link) | Zero-Inflation Model Coefficients (Binomial with Logit Link) | ||||||
|---|---|---|---|---|---|---|---|---|
| Frequency—Number of Days | Zero | |||||||
| Statistics | Estimate | Std. Error | z Value | Pr(>|z|) | Estimate | Std. Error | z Value | Pr(>|z|) |
| (Intercept) | −7.68 | 8.22 | −0.93 | 0.350 | −301.4 | 273.4 | −1.10 | 0.270 |
| TimeTrend | 0.26 | 0.05 | 5.17 | 2.33 × 10⁻⁷ *** | −0.60 | 1.151 | −0.52 | 0.601 |
| TA | −0.24 | 0.63 | −0.38 | 0.698 | 11.3 | 13.3 | 0.84 | 0.397 |
| TW | 0.55 | 0.88 | 0.63 | 0.526 | 19.7 | 20.4 | 0.96 | 0.334 |
| Model | Count Model Coefficients (Negbin with Log Link) | Zero-Inflation Model Coefficients (Binomial with Logit Link) | ||||||
|---|---|---|---|---|---|---|---|---|
| Frequency—Number of Days | Zero | |||||||
| Statistics | Estimate | Std. Error | z Value | Pr(>|z|) | Estimate | Std. Error | z Value | Pr(>|z|) |
| NP (water gauge) | ||||||||
| (Intercept) | 8.01 | 3.91 | 2.04 | 0.040 * | −83.2 | 42.9 | −1.93 | 0.052 |
| TimeTrend | 0.04 | 0.02 | 1.95 | 0.050 | −0.09 | 0.08 | −1.14 | 0.250 |
| TA | −0.44 | 0.261 | −1.64 | 0.101 | 0.73 | 1.53 | 0.48 | 0.630 |
| TW | −0.22 | 0.38 | −0.58 | 0.557 | 7.06 | 4.39 | 1.60 | 0.107 |
| NU | ||||||||
| (Intercept) | 22.4 | 6.64 | 3.38 | 0.0007 *** | 3.44 | 10.8 | 0.31 | 0.750 |
| TimeTrend | 0.16 | 0.06 | 2.53 | 0.011 * | 0.10 | 0.08 | 1.27 | 0.203 |
| TA | −0.03 | 0.24 | −0.16 | 0.870 | −0.57 | 0.82 | −0.69 | 0.487 |
| TW | −2.15 | 0.79 | −2.70 | 0.006 ** | 0.08 | 1.50 | 0.05 | 0.953 |
| NK | ||||||||
| (Intercept) | 2.13 | 1.77 | 1.19 | 0.230 | −40.3 | 20.8 | −1.93 | 0.052 |
| TimeTrend | −0.06 | 0.02 | −2.40 | 0.016 * | −0.23 | 0.12 | −1.80 | 0.071 |
| TA | 0.24 | 0.27 | 0.86 | 0.384 | 5.35 | 2.63 | 2.03 | 0.041 |
| ND | ||||||||
| (Intercept) | 20.0 | 4.56 | 4.39 | 1.13 × 10⁻⁵ *** | −22.9 | 27.7 | −0.82 | 0.407 |
| TimeTrend | 0.003 | 0.02 | 0.14 | 0.883 | −0.19 | 0.13 | −1.49 | 0.135 |
| TA | 1.22 | 0.74 | 1.63 | 0.102 | 8.99 | 4.69 | 1.91 | 0.055 |
| TW | −2.68 | 0.98 | −2.72 | 0.006 ** | −4.77 | 4.55 | −1.04 | 0.294 |
| Model | Count Model Coefficients (Negbin with Log Link) | Zero-Inflation Model Coefficients (Binomial with Logit Link) | ||||||
|---|---|---|---|---|---|---|---|---|
| Frequency—Number of Days | Zero | |||||||
| Statistics | Estimate | Std. Error | z Value | Pr(>|z|) | Estimate | Std. Error | z Value | Pr(>|z|) |
| (Intercept) | 9.90 | 7.66 | 1.29 | 0.196 | 39.0 | 623.1 | 0.06 | 0.950 |
| TimeTrend | −0.01 | 0.05 | −0.23 | 0.811 | −10.0 | 32.5 | −0.30 | 0.758 |
| TA | −0.41 | 0.65 | −0.63 | 0.5278 | 107.1 | 337.4 | 0.31 | 0.750 |
| TW | −0.52 | 1.19 | −0.43 | 0.660 | −86.3 | 213.9 | −0.40 | 0.686 |
Publisher’s Note: MDPI stays neutral with regard to jurisdictional claims in published maps and institutional affiliations. |
© 2020 by the author. Licensee MDPI, Basel, Switzerland. This article is an open access article distributed under the terms and conditions of the Creative Commons Attribution (CC BY) license (http://creativecommons.org/licenses/by/4.0/).
Share and Cite
Graf, R. Estimation of the Dependence of Ice Phenomena Trends on Air and Water Temperature in River. Water 2020, 12, 3494. https://doi.org/10.3390/w12123494
Graf R. Estimation of the Dependence of Ice Phenomena Trends on Air and Water Temperature in River. Water. 2020; 12(12):3494. https://doi.org/10.3390/w12123494
Chicago/Turabian StyleGraf, Renata. 2020. "Estimation of the Dependence of Ice Phenomena Trends on Air and Water Temperature in River" Water 12, no. 12: 3494. https://doi.org/10.3390/w12123494
APA StyleGraf, R. (2020). Estimation of the Dependence of Ice Phenomena Trends on Air and Water Temperature in River. Water, 12(12), 3494. https://doi.org/10.3390/w12123494