Article

Fragmentation in Seagrass Canopies Can Alter Hydrodynamics and Sediment Deposition Rates

1
Department of Physics, University of Girona, c/Universitat de Girona 4, 17003 Girona, Spain
2
Computer Vision and Robotics Group, Underwater Vision Lab, University of Girona, c/de la Universitat de Girona 6, 17003 Girona, Spain
3
Global Change Research Group, Mediterranean Institute for Advanced Studies (IMEDEA, UIB-CSIC), c/Miquel Marques 21, 07190 Esporles, Spain
*
Author to whom correspondence should be addressed.
Water 2020, 12(12), 3473; https://doi.org/10.3390/w12123473
Submission received: 12 November 2020 / Revised: 7 December 2020 / Accepted: 8 December 2020 / Published: 10 December 2020
(This article belongs to the Section Hydraulics and Hydrodynamics)

Abstract

:
Seagrasses are valuable coastal ecosystems that protect the seabed from waves and currents. They are threatened by predominately anthropogenic activities which are causing their decline in many regions, often converting large continuous meadows into highly fragmented ones with gaps or bare sand interspersed within the meadows. To evaluate the impact fragmentation is having on the meadows’ capacity to attenuate waves, the hydrodynamics in four meadows with different fragmentation were studied by measuring wave velocity and turbulent kinetic energy. In our study area, as gap size increases, both the turbulent kinetic energy and wave velocity increase in the center of the gaps. However, although wave attenuation varied between the different fragmentation levels, no clear trend was found for wave attenuation or the level of fragmentation. Simply put, neither wave velocity nor turbulent kinetic energy presented significant trends with the fragmentation levels of the canopy on larger scales. Therefore, within the spatial and temporal limitation of this study, fragmentation on a landscape scale did not affect the hydrodynamics within the gaps. Furthermore, as with hydrodynamics, sedimentation rates also increased with gap size, but did not show differences at the landscape level with the fragmentation levels of the meadows.

1. Introduction

Seagrasses are key components of coastal systems, providing crucial ecosystem services and valuable ecological productivity. They occur along the shores of every continent except Antarctica, from intertidal areas to a maximum depth of 50 m [1] and mainly grow on soft sandy bottoms [2]. Seagrass meadows provide important nurseries for a range of fish, shellfish and crustaceans [3,4,5], regulate nutrient cycling [6] and play a significant role in global carbon sequestration and burial [7,8]. Additionally, they contribute to protecting shorelines [9] by diminishing wave energy and trapping sediments [10]. The presence of seagrasses also mitigates the coastal erosion that has increased due to climate change and its associated factors [11,12]. Unfortunately, seagrass meadows are among the most threatened ecosystems in the world. Because of their proximity to the coast, they experience the pressure from human activity common to coastal areas [13]. While seagrasses are affected by natural processes such as disease [14], herbivore grazing [15], hurricanes [16] and storms through wave energy [17], many other disturbances, such as dredging [18], boat anchoring [19], sewage outflows [20], and increases in turbidity due to sediment run off and eutrophication [2] have an anthropogenic origin. Climate change, in particular, warming, is also a stressor to seagrasses worldwide [21,22,23]. In summary, human activities are chiefly the cause of the recent seagrass area decline, at rates of about 5–7% per year of their worldwide surface [2] and it has been estimated that in the last seventy years alone, one third of all seagrass coverage has already been lost [23,24].
Seagrasses can form large continuous meadows or more heterogeneous structures, forming patches of vegetated areas of different sizes mixed with unvegetated areas of sand or rocky beds [25]. Over time, valuable coastal seagrass meadows have been losing coverage and presenting an increasingly fragmented landscape configuration [26]. Habitat fragmentation is when continuous seagrass meadows lose part of their vegetated area and transform to patchier areas with unvegetated bare soil and increasing gaps within the vegetation. The fragmentation of Posidonia oceanica seabeds results in bare spaces within a meadow that afterwards generally must be recolonized by vegetative growth, (i.e., by the elongation of the P. oceanica rhizomes [27]), which is a slow process as P. oceanica is amongst the species with the slowest rhizome extension rate—about 1 to 6 cm per year [28]. Fragmentation patterns are indicators of meadow health and can serve to predict how close a particular meadow is to disappearing [29]. Once a seagrass habitat is fragmented, several negative feedback processes take place. For example, fragmentation reduces seed density in vegetated areas of Zostera marina compared to that in continuous beds [30]. Furthermore, the size of the patches resulting from fragmentation can also determine the distribution of the organisms inhabiting the ecosystem. For example, the distribution of a decapod crustacean is related to the size and age of a seagrass patch [31]. Seagrass fragmentation also alters sedimentation patterns [32]. A greater number of small particles (<10 μm) were found on bare soil close to a P. oceanica seagrass meadow compared to within the meadow [33]; however, the concentration of large particles (>10 μm) was greater within the meadow than on the bare soil. Therefore, the presence of the seagrass greatly influences particle distribution on the seabed. Seagrasses reduce mean currents, wave velocity and the magnitude of turbulent fluctuations, thus sheltering the seabed [34,35,36]. Through flow modification, seagrass canopies promote sedimentation and reduce resuspension within the meadows [37,38,39]. The material deposited within seagrass canopies can be largely (>50%) sestonic [40], pointing to a large pelagic particle flux toward seagrass meadows. This enhanced deposition aids particle and carbon burial beneath the seagrass meadows. As they grow, seagrasses accumulate carbon in their leaves and rhizomes, (which can also be buried below the meadows), thus intensifying their crucial role as agents for climate change mitigation [41,42].
The accumulation of carbon by continuous meadows [43] can change with meadow fragmentation, as stored carbon can be lost and particle flux and deposition rates might change. Laboratory studies have shown that gaps in the vegetation modify local hydrodynamics [34,44,45]. For instance, small gaps have a greater sheltering effect than large gaps because small gaps can reduce the penetration of the hydrodynamics within the meadow [45]. Interaction between subsequent gaps in the vegetation is also important because the wake generated by the patch impacts on gaps situated downstream [46]. Although laboratory studies have determined the local effect a gap in vegetation has on the turbulent kinetic energy, the effect similar gaps would have in the field has not yet been addressed. Specifically, the capacity of the nearby vegetation to shelter gaps with different sizes needs to be addressed. Furthermore, additional knowledge on the capacity of the canopy to shelter different gap sizes depending on the fragmentation of the canopy is needed. Here, we chose fragmented meadows with a wide range of fragmentation levels. The hydrodynamics within different gap sizes for different canopies with different fragmentation levels will be compared in terms of both the wave velocity attenuation and the turbulent kinetic energy attenuation. Also, total sedimentation and the percentage of organic matter in sedimented material will be compared between gap sizes. Our hypothesis was three-fold: (1) wave velocities and turbulent kinetic energy vary between gap sizes and canopy fragmentation levels because, within a meadow, the larger gaps are expected to produce a lower wave attenuation than the smaller gaps. In addition, the same gap size is expected to be less sheltered in the more fragmented meadows, (2) the differing hydrodynamics in the diverse gaps and meadows may also determine sedimentation rates, and (3) the percentage of organic and inorganic matter in the deposited sediment may vary across gaps due to the different particle transportation rates and dynamics in each meadow.

2. Materials and Methods

2.1. Description of the Sites

We selected four different sites: three along the coast of the Costa Brava (NE Spain) and one in the Bay of Palma, Mallorca (Figure 1). Cala Montgó (Site 1, 42°6.305′ N, 3°10.308″ E), Cala Aiguablava (site 2, 41°56.118′ N, 3°13.034′ E) and Cala Vigatà (site 3, 41°46.389′ N, 3°1.554′ E) made up the three sites on the Costa Brava, and S’Arenal (Site 4, 39°29.782′ N, 2°44.408′ E) in the Bay of Palma. The sites have been numbered in order from north to south (Figure 1). Water depth at all sites was 7 m ± 1 m. At each site, five stations were chosen based on their meadow fragmentation percentage. One station was setup in the continuous P. oceanica meadow, three stations (Gaps 1, 2 and 3) of increasing size (1, 2 and 3 m in diameter) corresponded to gaps within the P. oceanica meadow and the last station was positioned on the sand, far away from the meadow. Gaps were nearly circular. In some cases, when they were elliptical the gap size was considered as the mean between both axis of the ellipse. Acoustic Doppler Velocimeters (ADVs; Vector current meter, Nortek AS, Norway) measuring at a frequency of 50 Hz were placed at all the sites. The measuring volume was situated at half the canopy height (0.4 m) from the seabed. In the Costa Brava sites, two ADVs were deployed, one stationary within the P. oceanica meadow for the full measurement period while the other measured 20 min at each of the other four stations (Gaps 1, 2, and 3 and Sand). The ADV was manually moved from one station to another by divers. In the Bay of Palma, five ADVs were deployed simultaneously, one measuring at each station (continuous meadow, Gaps 1, 2, and 3, and Sand) for 48 h.

2.2. Fragmentation Level of the Meadows

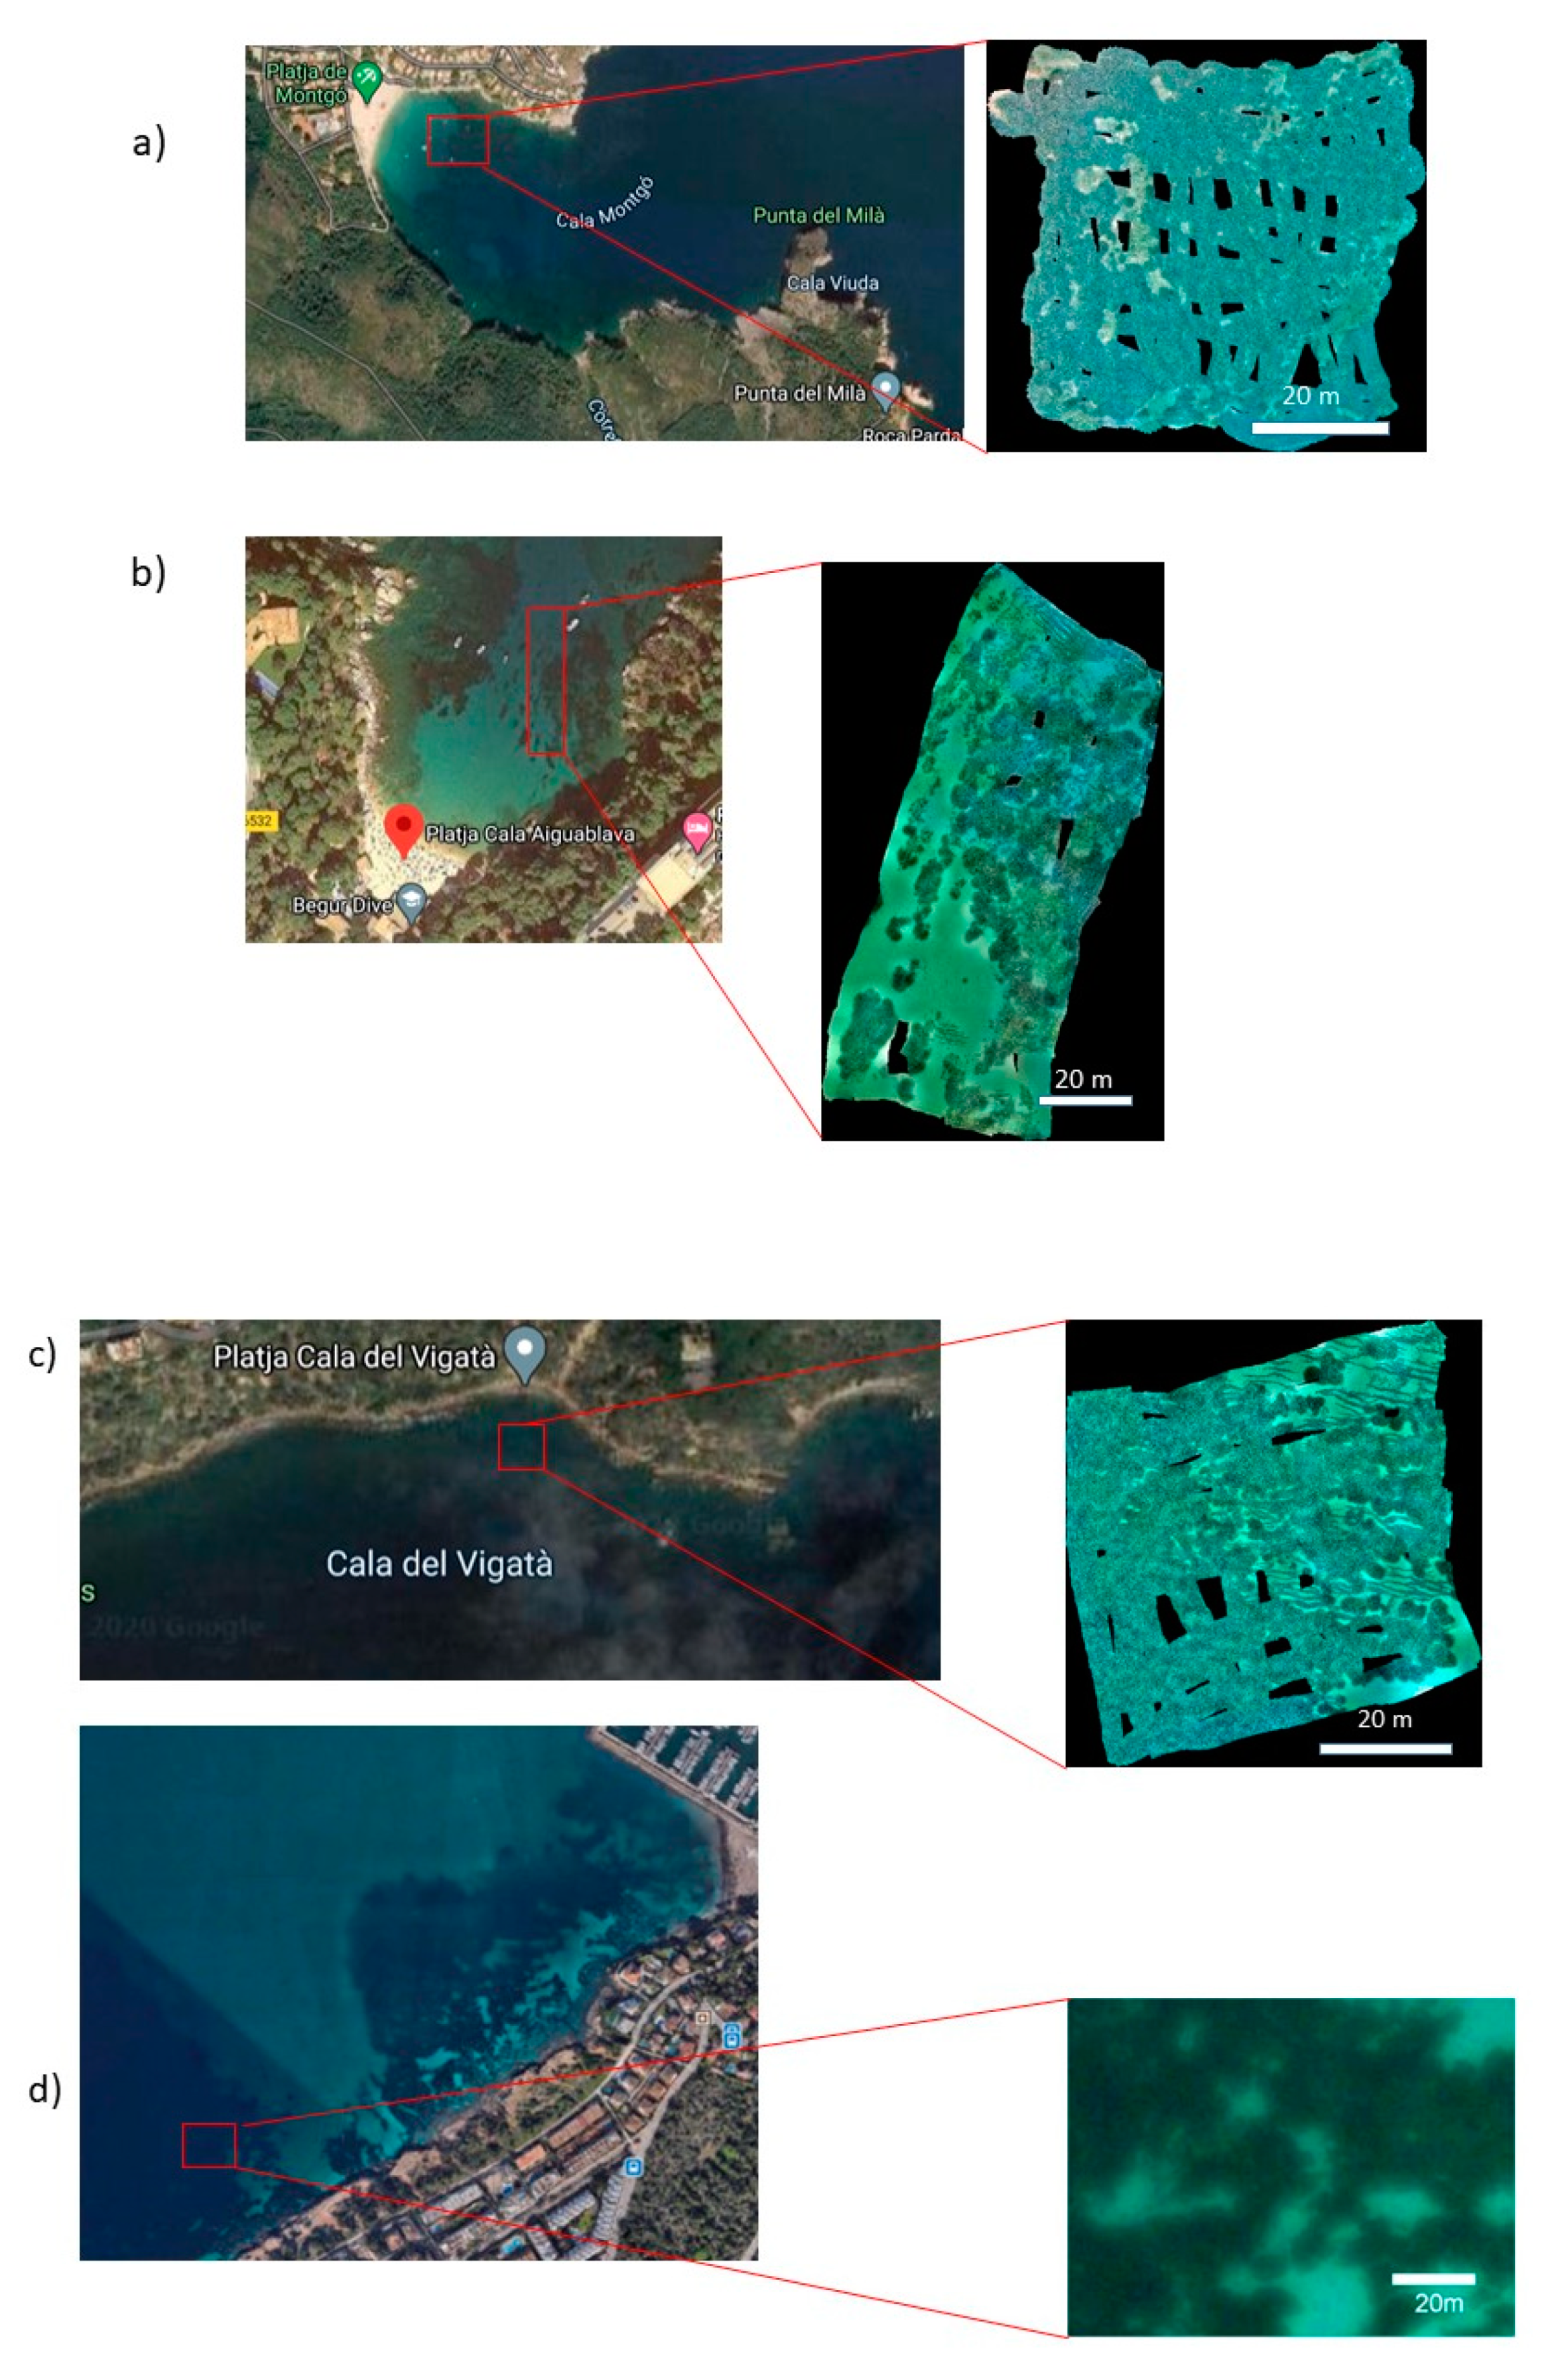
To estimate fragmentation on a landscape level, three landscape views (photomosaics) of the meadows, with a maximum extension of 50 × 50 m for the Costa Brava sites, were created (Figure 2). The mapped regions had a similar total area (Table 1) but their outline shapes varied (from a quadrat to a rectangle) due to the shape of the meadow. To obtain the photomosaic of the meadow, a diver equipped with a GoPro action camera recorded video footage 2 m above the selected area of the seabed following a back and forth path. To minimize the presence of holes in the photomosaic, the trajectory of each sequential path (back and forth) was such that a 30% overlap between the images was ensured. The photomosaics were obtained by joining the images from the video footage using the technique described in previous studies [47,48]. Georeferencing, using known GPS coordinates of a set of seafloor features that were easily identifiable in the video images, was added to the mosaic optimization process [49], allowing the metric scale of the mosaics to be set and, therefore, enabling area measurements. The mosaics were manually annotated afterwards to create an information layer that identified and distinguished the vegetation areas from the sandy areas (gaps). The percentage of the sandy area over the whole area studied, corresponded to the level of meadow fragmentation at each site. For instance, Site 1 had the least fragmented meadow, while Site 2 had the most (Table 1, Figure 2). Fragmentation for the Site 4 was obtained from a Google Earth image of a 50 m × 50 m square of the studied area. The photography was filtered and the non-vegetated area was determined. From the image, the minimum area that could be differentiated was 2.3 m2. This means that small gaps were missed, and so the fragmentation level of this area could have been slightly greater than that determined.

2.3. Method of Analysis of ADV Data

In an oscillatory flow, the instantaneous velocity ui can be decomposed into the time-averaged velocity (uc), orbital velocity (Uw) and turbulent velocity (u′) components as:
u i = u c + U w +   u
The above decomposition was made by using a phase-averaging technique [35,50,51] and the Hilbert transform to average oscillatory flow velocities with a common phase (φ), u(φ). The velocity readings were binned into different phases as described by Pujol et al. [51]. The root mean square of u(φ) was then defined as the orbital velocity Uw,rms (hereafter denoted Uw) as:
  U w , rms = 1 2 π 0 2 π ( u ( φ ) u c ) 2 d φ
To calculate the turbulent kinetic energy (TKE) profile for stationary velocity records, the instantaneous velocities (u, v, w) at each sampling point were decomposed into the sum of time-averaged velocities (uc, vc, wc), orbital velocities (Uw, Vw, Ww) and the turbulent components (u′, v′, w′) as described in Equation (1). The TKE was calculated as:
TKE = 1 / 2 ( u 2 ¯ + v 2 ¯ + w 2 ¯ )
where u 2 ¯ ,   v 2 ¯   and   w 2 ¯ are the time-average of the squared instantaneous turbulent velocities on the three axes, x, y and z, respectively.
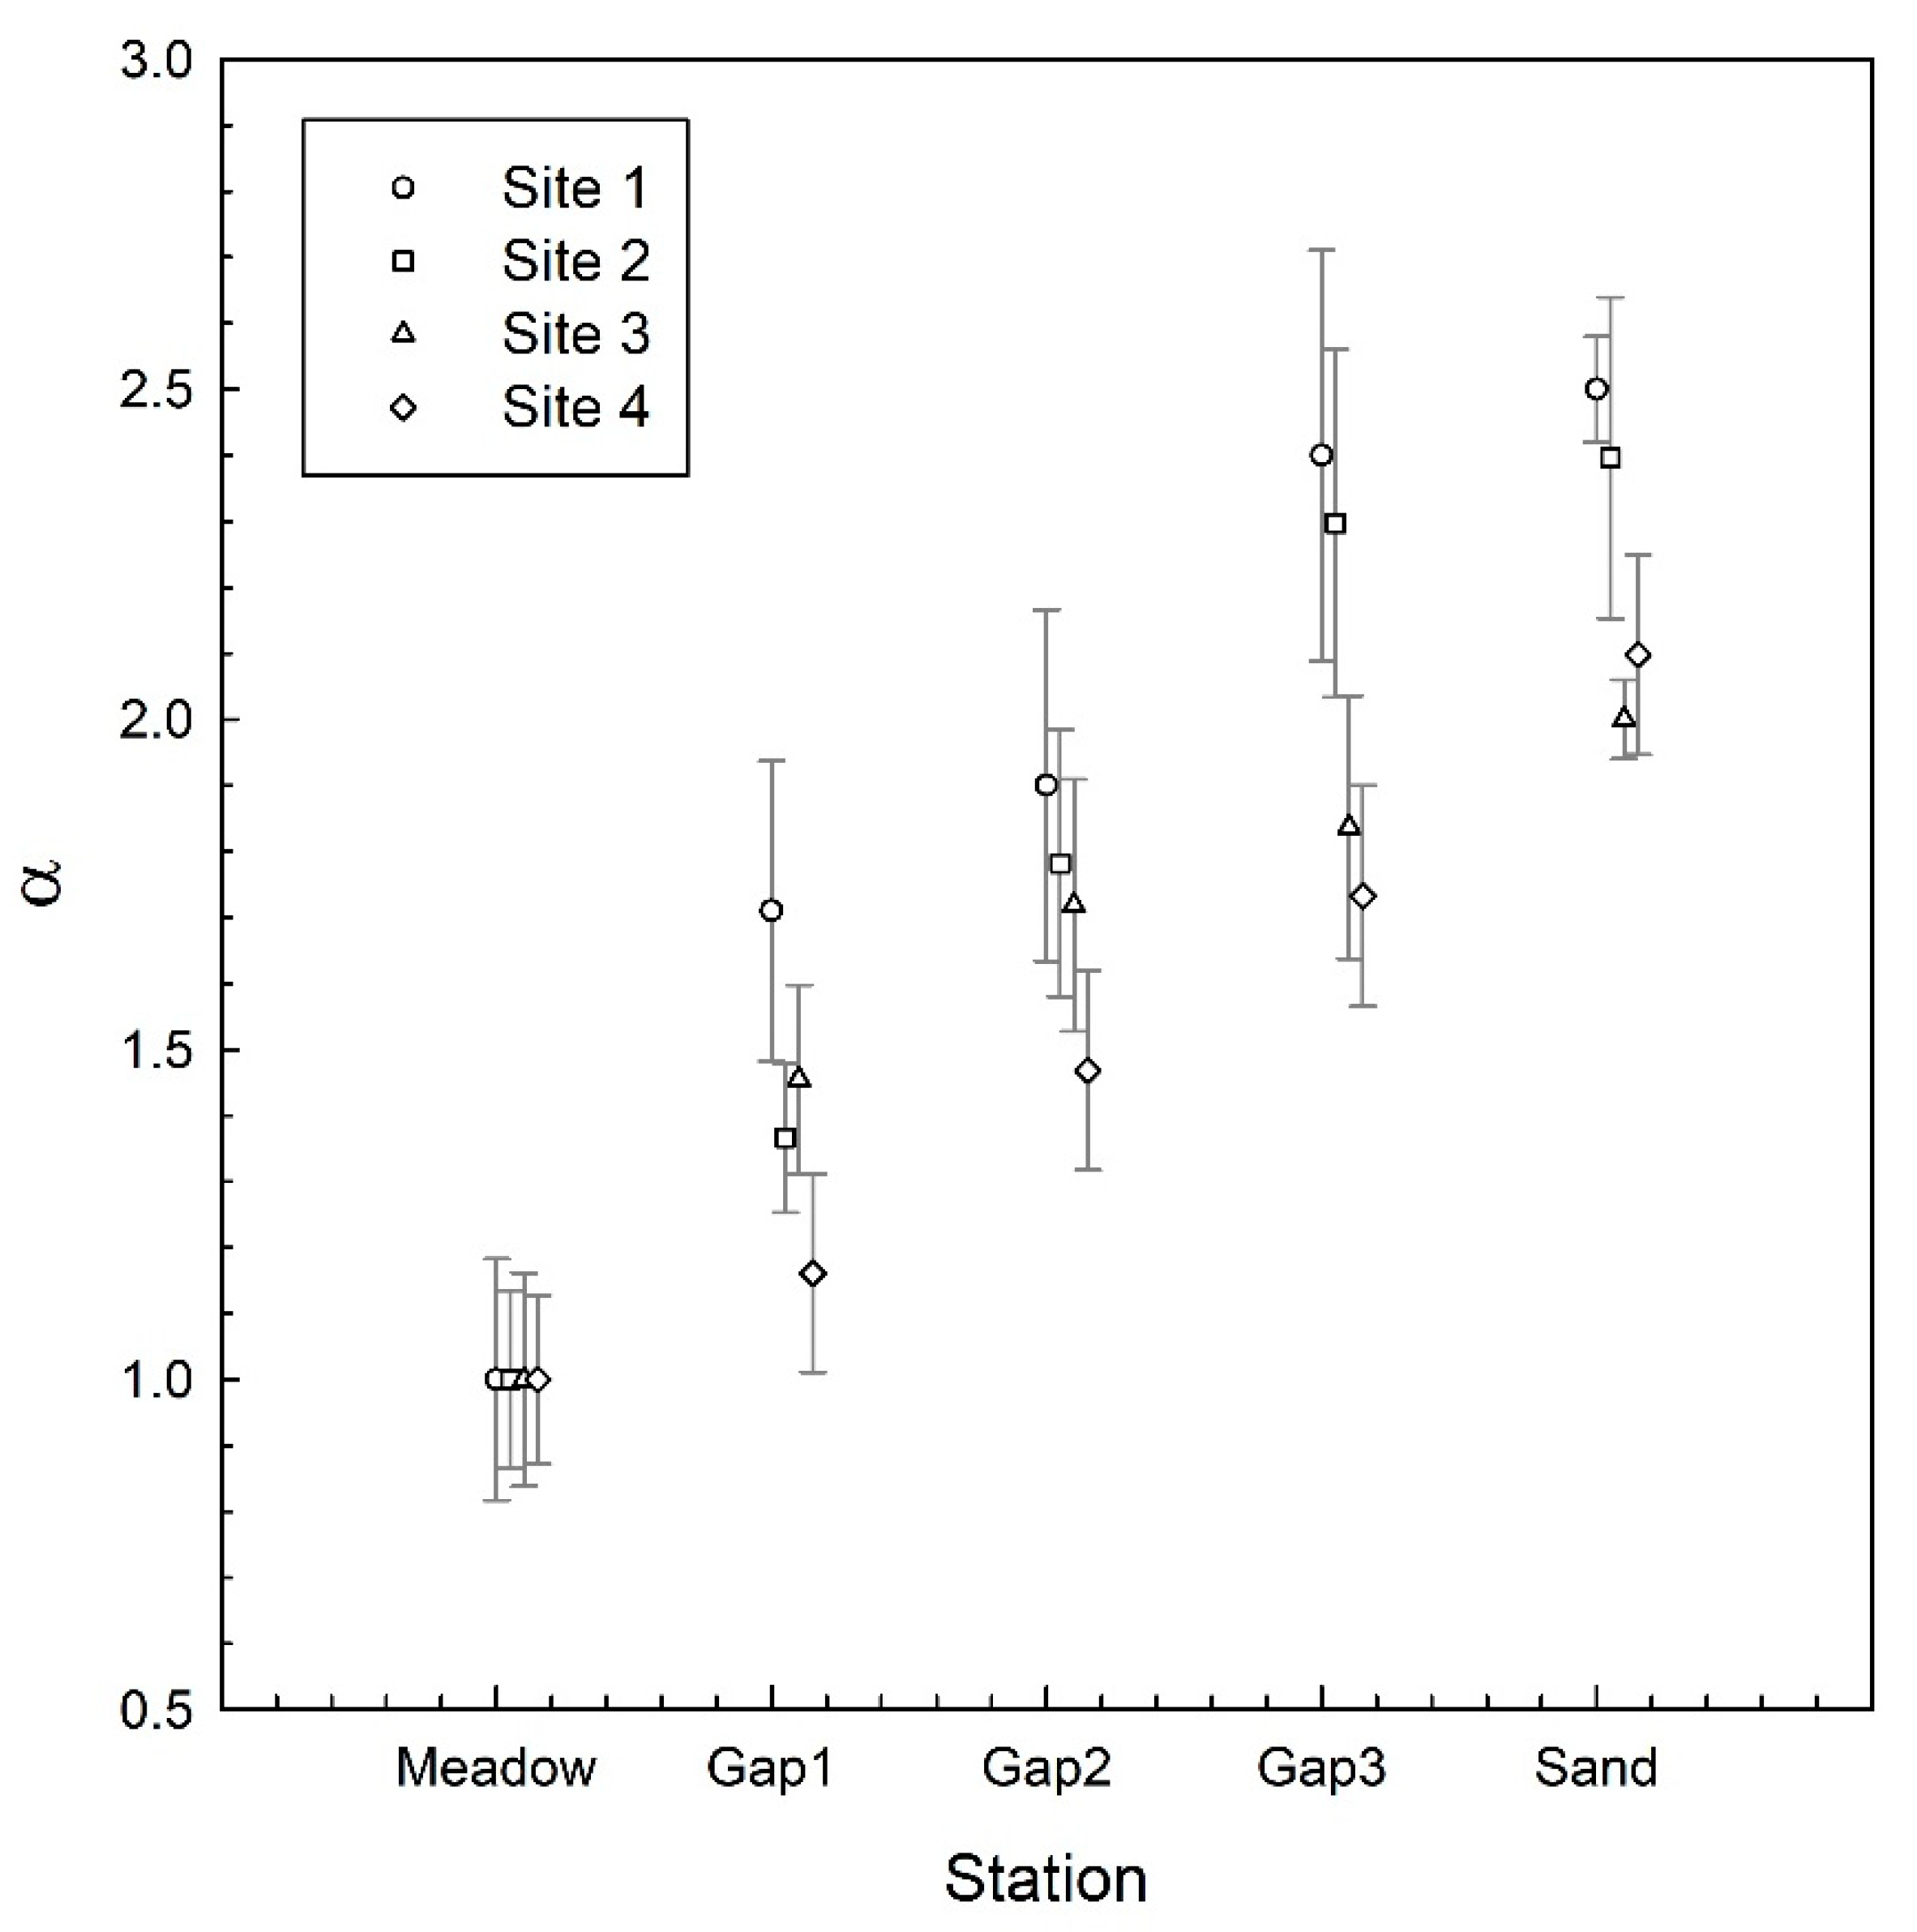
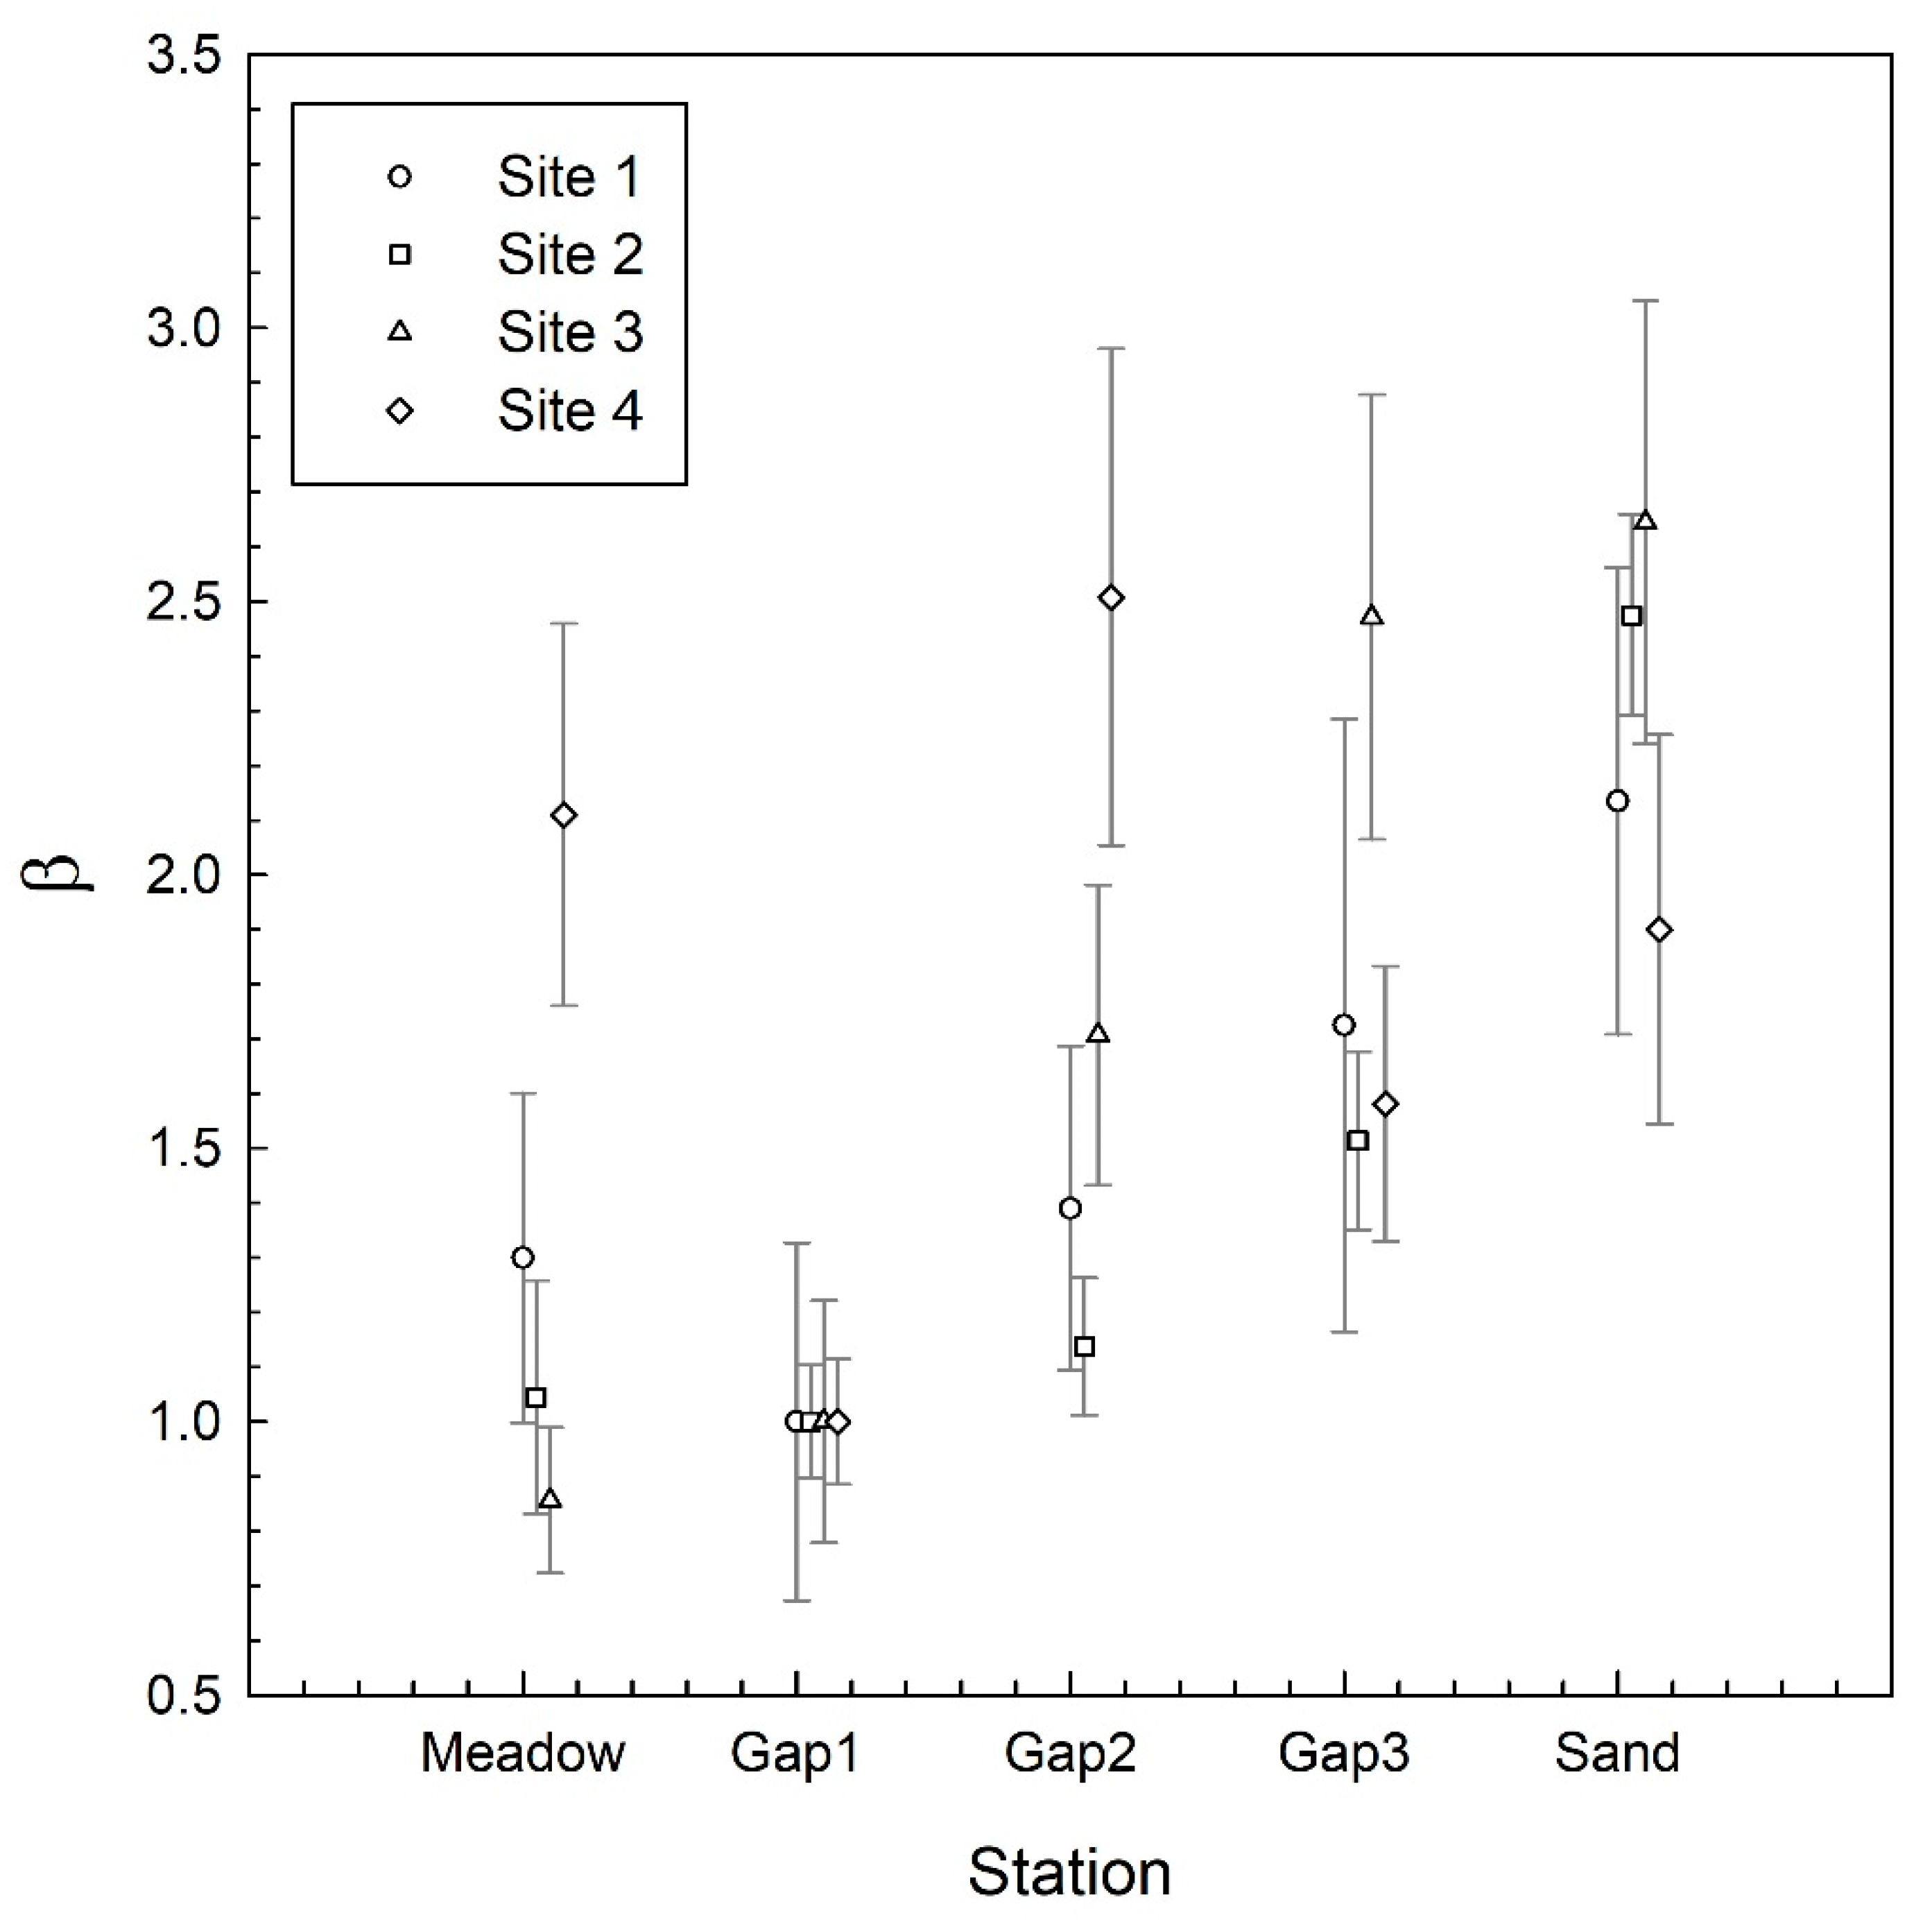
The wave velocity ratio α was calculated as the ratio between the wave velocity in each station (gap; Uw,st) and the wave velocity within the meadow (Uw,0), i.e., α= Uw,st/Uw,0. Values of α > 1 indicate wave velocities greater than those obtained within the meadow and therefore a reduction in the wave attenuation compared to the meadow stations. The ratio β was calculated as the ratio between the TKE in each station (TKEw,st) and the TKE within the smallest gap (TKEw,gap1). In this case, Gap 1 was taken as the reference value instead of the measurements within the continuous meadow because in some stations the TKE obtained within the meadow was greater than that obtained within the smallest gap (Gap 1). The reason for this could have been leaf movement close to, or even interacting with, the ADV sensor. Values of β > 1 indicate TKE values greater than those obtained within Gap 1, i.e., a reduction in the sheltering compared to the small Gap 1.

2.4. Analysis of the Sediment

Organic and inorganic carbon content was determined from sediment cores extracted from the center of each gap and within the meadow and on the sand site with a 0.1-m-long PVC tube with a 0.03-m inner diameter. The top 0.05 m of the sediment was sampled with each core. Two cores (replicates) were taken from each sampling point. The sediment sample obtained in each tube was homogenized and divided into two parts to determine the organic and inorganic carbon content following the standard 2540E method [52].
Deposition rates were estimated by deploying sediment traps at each station (for 48 h in the Mallorca site and 72 h in the Costa Brava sites) during the same period as the ADV measurements. To collect settling material, six 0.1-m-long Pyrex test tubes with a 0.02-m diameter were positioned at each station at the same height as the measuring volume of the ADVs (0.4 m above the seabed). Afterwards, the samples were filtered with Glassfiber filters previously weighted and dried at 60 °C for 24 h to determine the grams of solid mass deposited per area and time. The sediment traps used had the same design as those used by Gacia et al. [38] and Granata et al. [33]. The results from each test tube were considered replicates of each measurement.

2.5. Statistical Analysis

A two-way Analysis of Variance (ANOVA) without replication was applied to the data on hydrodynamics and sedimentation in order to test the differences between the four different sites and the four different stations in each site. First, a Levene’s test was also carried out to check for data homogeneity for both hydrodynamics and sedimentation rates. Data on sedimentation were checked for normality by using the Shapiro–Wilk test with the Excel software (Microsoft Office Professional Plus 2016). No need of transformation was required in the case of sedimentation rates. For data on hydrodynamics, data were tested for normality and data were transformed first using a log transformation following Sokal and Rohlf [53] before performing a two-way ANOVA without replication.

3. Results

The wave velocity ratio (α) increased progressively with gap size—from 1 (continuous meadow) to 2.5 (sand)—at all the sites studied (significance level p < 0.01; Figure 3). This means that waves are less attenuated within (larger) gap areas and sand compared to over a continuous meadow. Between the sites, there are differences (ANOVA; p < 0.01) in attenuation for the gap stations 1, 2 and 3. The attenuation over the sand areas was also different between sites (p < 0.05), whereas no differences between wave velocities were obtained for the canopy stations at the different sites (p > 0.05). The greatest increase in α was from the meadow station to the smallest gap station (Gap 1, with a mean value of 1.43). The smallest increase in α was from the largest gap station (Gap 3 with a mean value of 2.06) to the sand station (with a mean value of 2.25).
The TKE ratio (β) in the continuous meadow was similar to the smallest gap (Gap 1; p > 0.01), except in Site 4 (Figure 4). From Gap 1 onwards, β (and thus TKE) increased with gap size (p < 0.01). Like the wave velocity ratio α, the TKE ratio β was smaller in the largest gap (Gap 3; mean β = 1.86) compared to the sand station (with a mean β = 2.45), indicating that there was still some (as found for wave velocity) sheltering from turbulence. It also differed between the Gap 3, Gap 2 and meadow stations (p < 0.01). Site 4 had the highest β in the continuous meadow compared to the other sites.
Wave attenuation was significantly different between the sites with different fragmentation levels (p < 0.01), however, α did not present a clear trend with the fragmentation percentage for any of the gaps studied. Neither did the turbulent kinetic energy attenuation (β) show significant differences between sites (p > 0.05), nor were there any clear trends found for the fragmentation levels of any of the meadows studied.
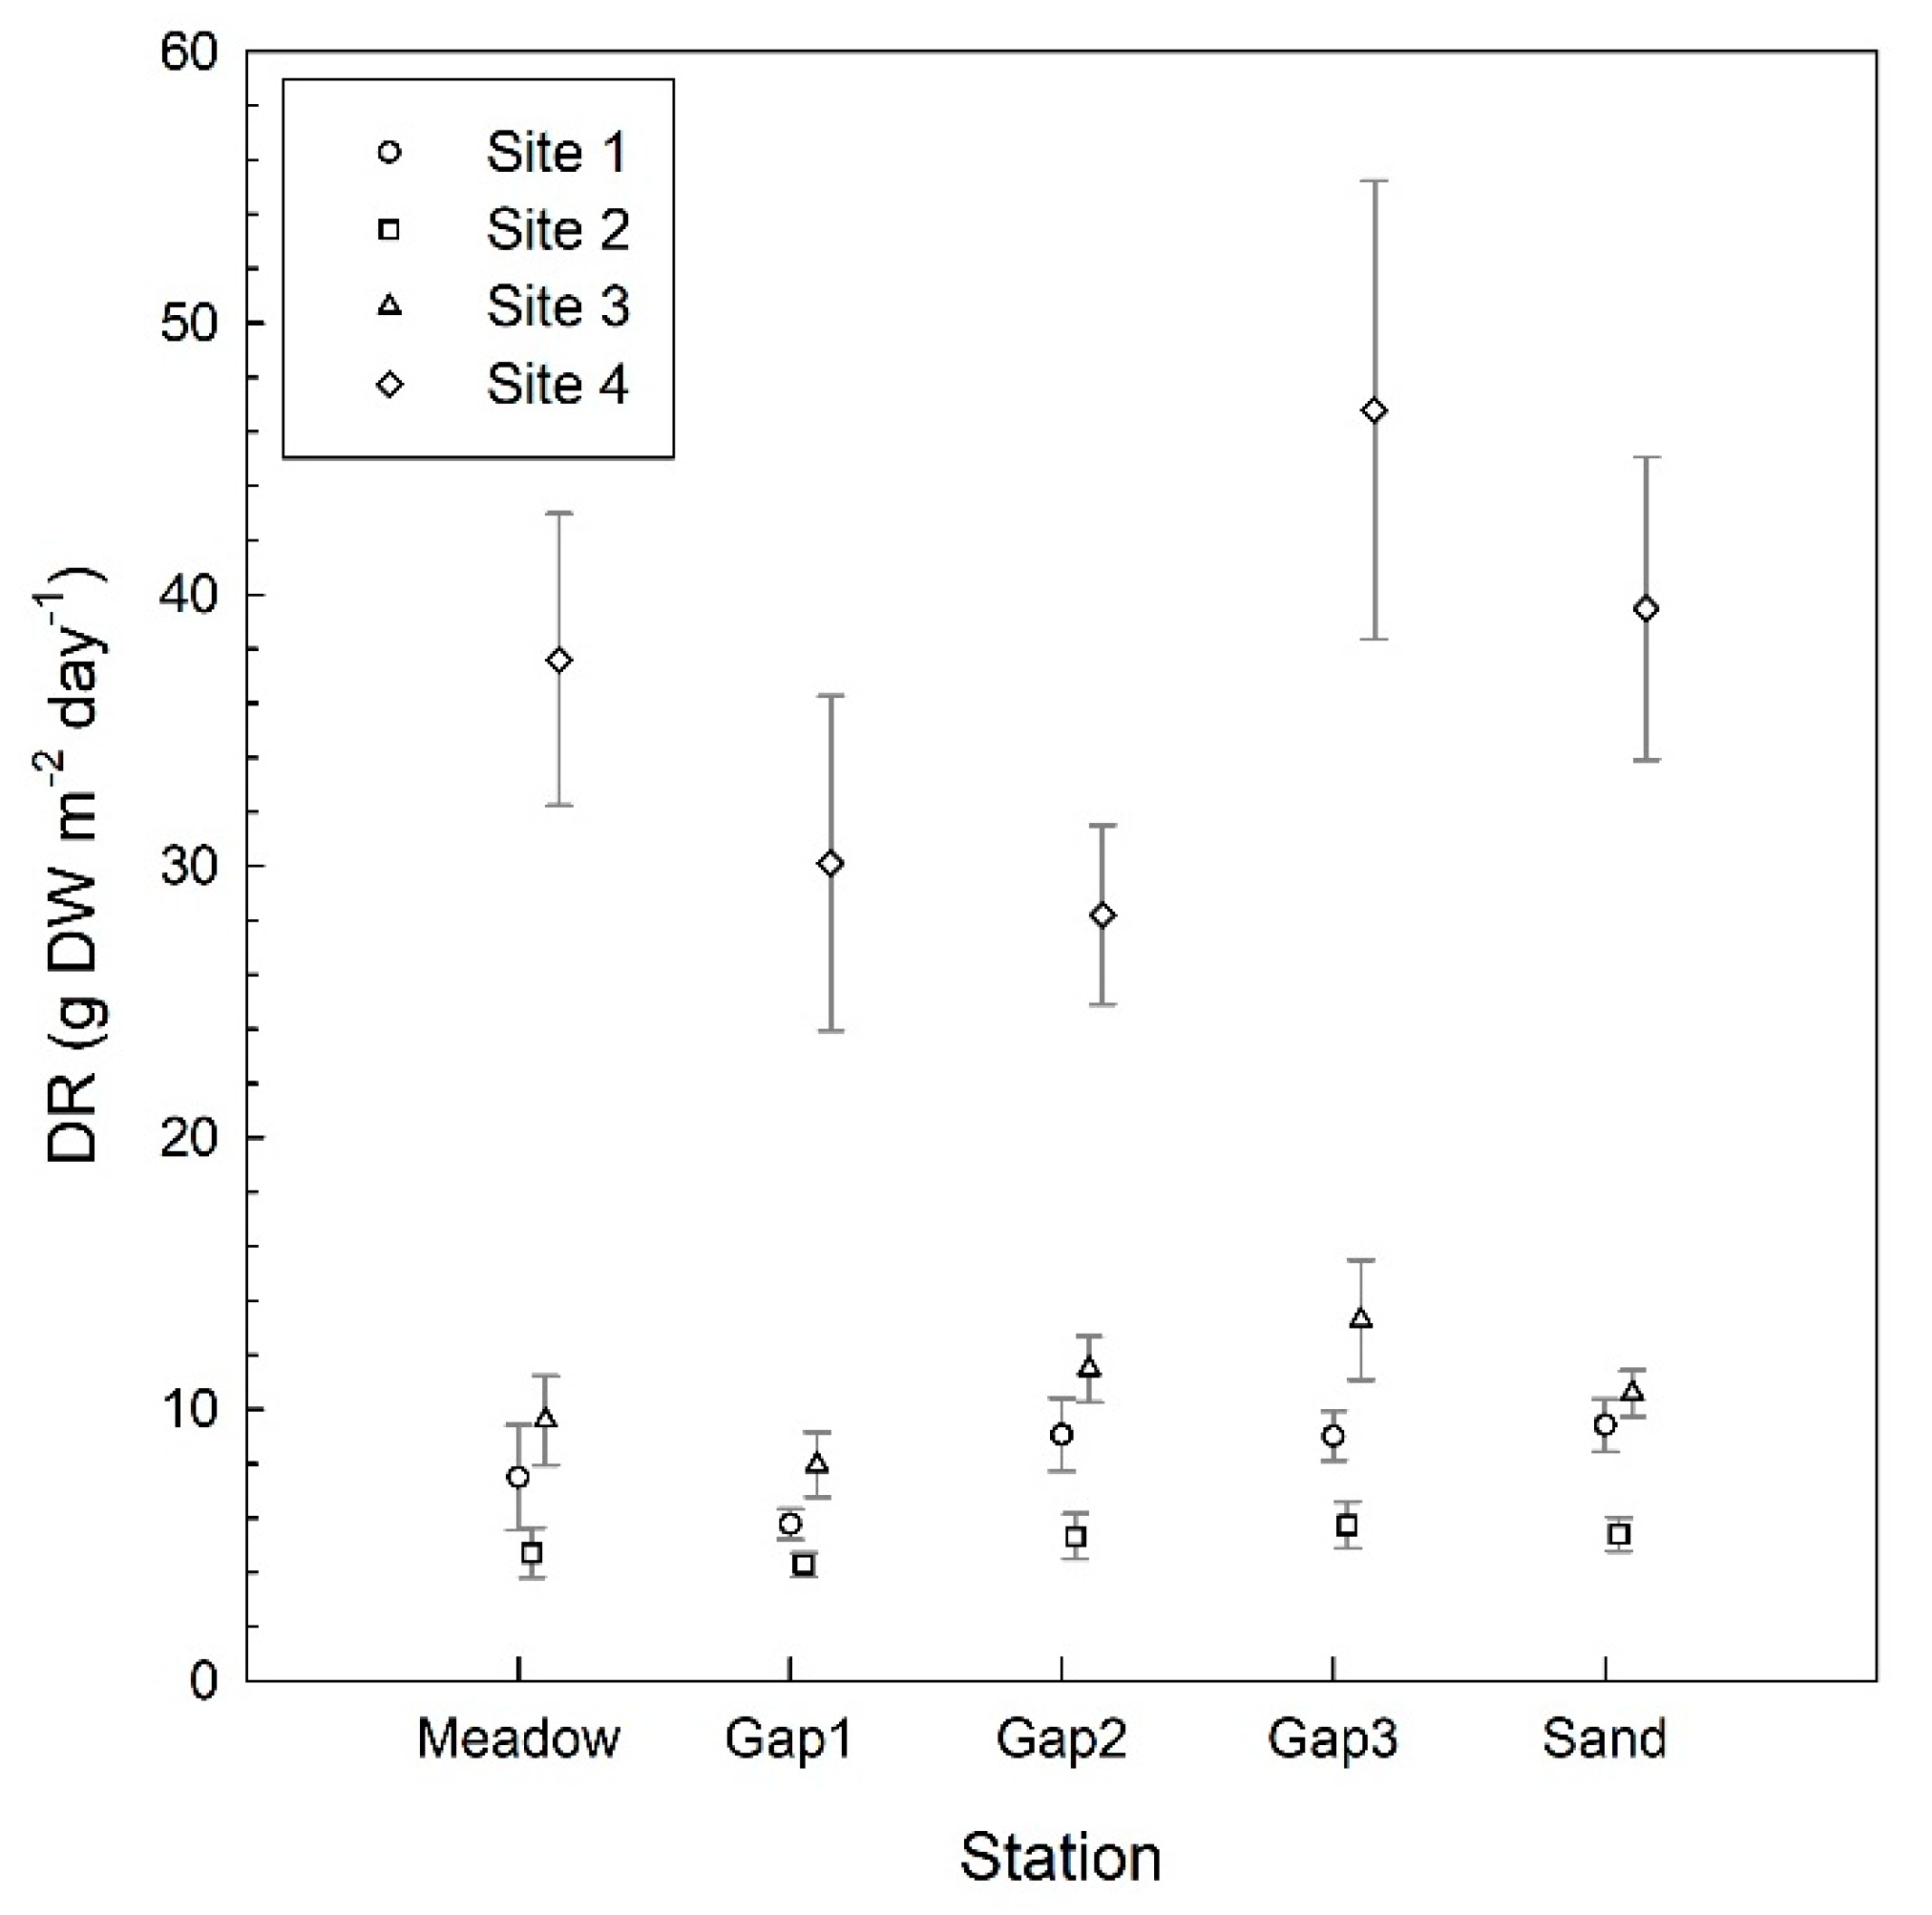
The sedimentation or deposition rates (DR; in g m−2 day−1) were calculated for each station. Deposition rates differed between the stations and gap sizes (p < 0.05) with, in general, more settled material being found in the wider gaps, but also higher deposition rates in the meadow as well compared to the sediment traps placed within gap 1 (Figure 5). Sites 1 and 3 had similar deposition rates (p > 0.05), but when Sites 3 and 2 were included, significant differences (p < 0.05) emerged between the sites with different overall fragmentation levels for the stations sampled. Site 2 had the lowest deposition rates, whereas Site 4 had the highest.
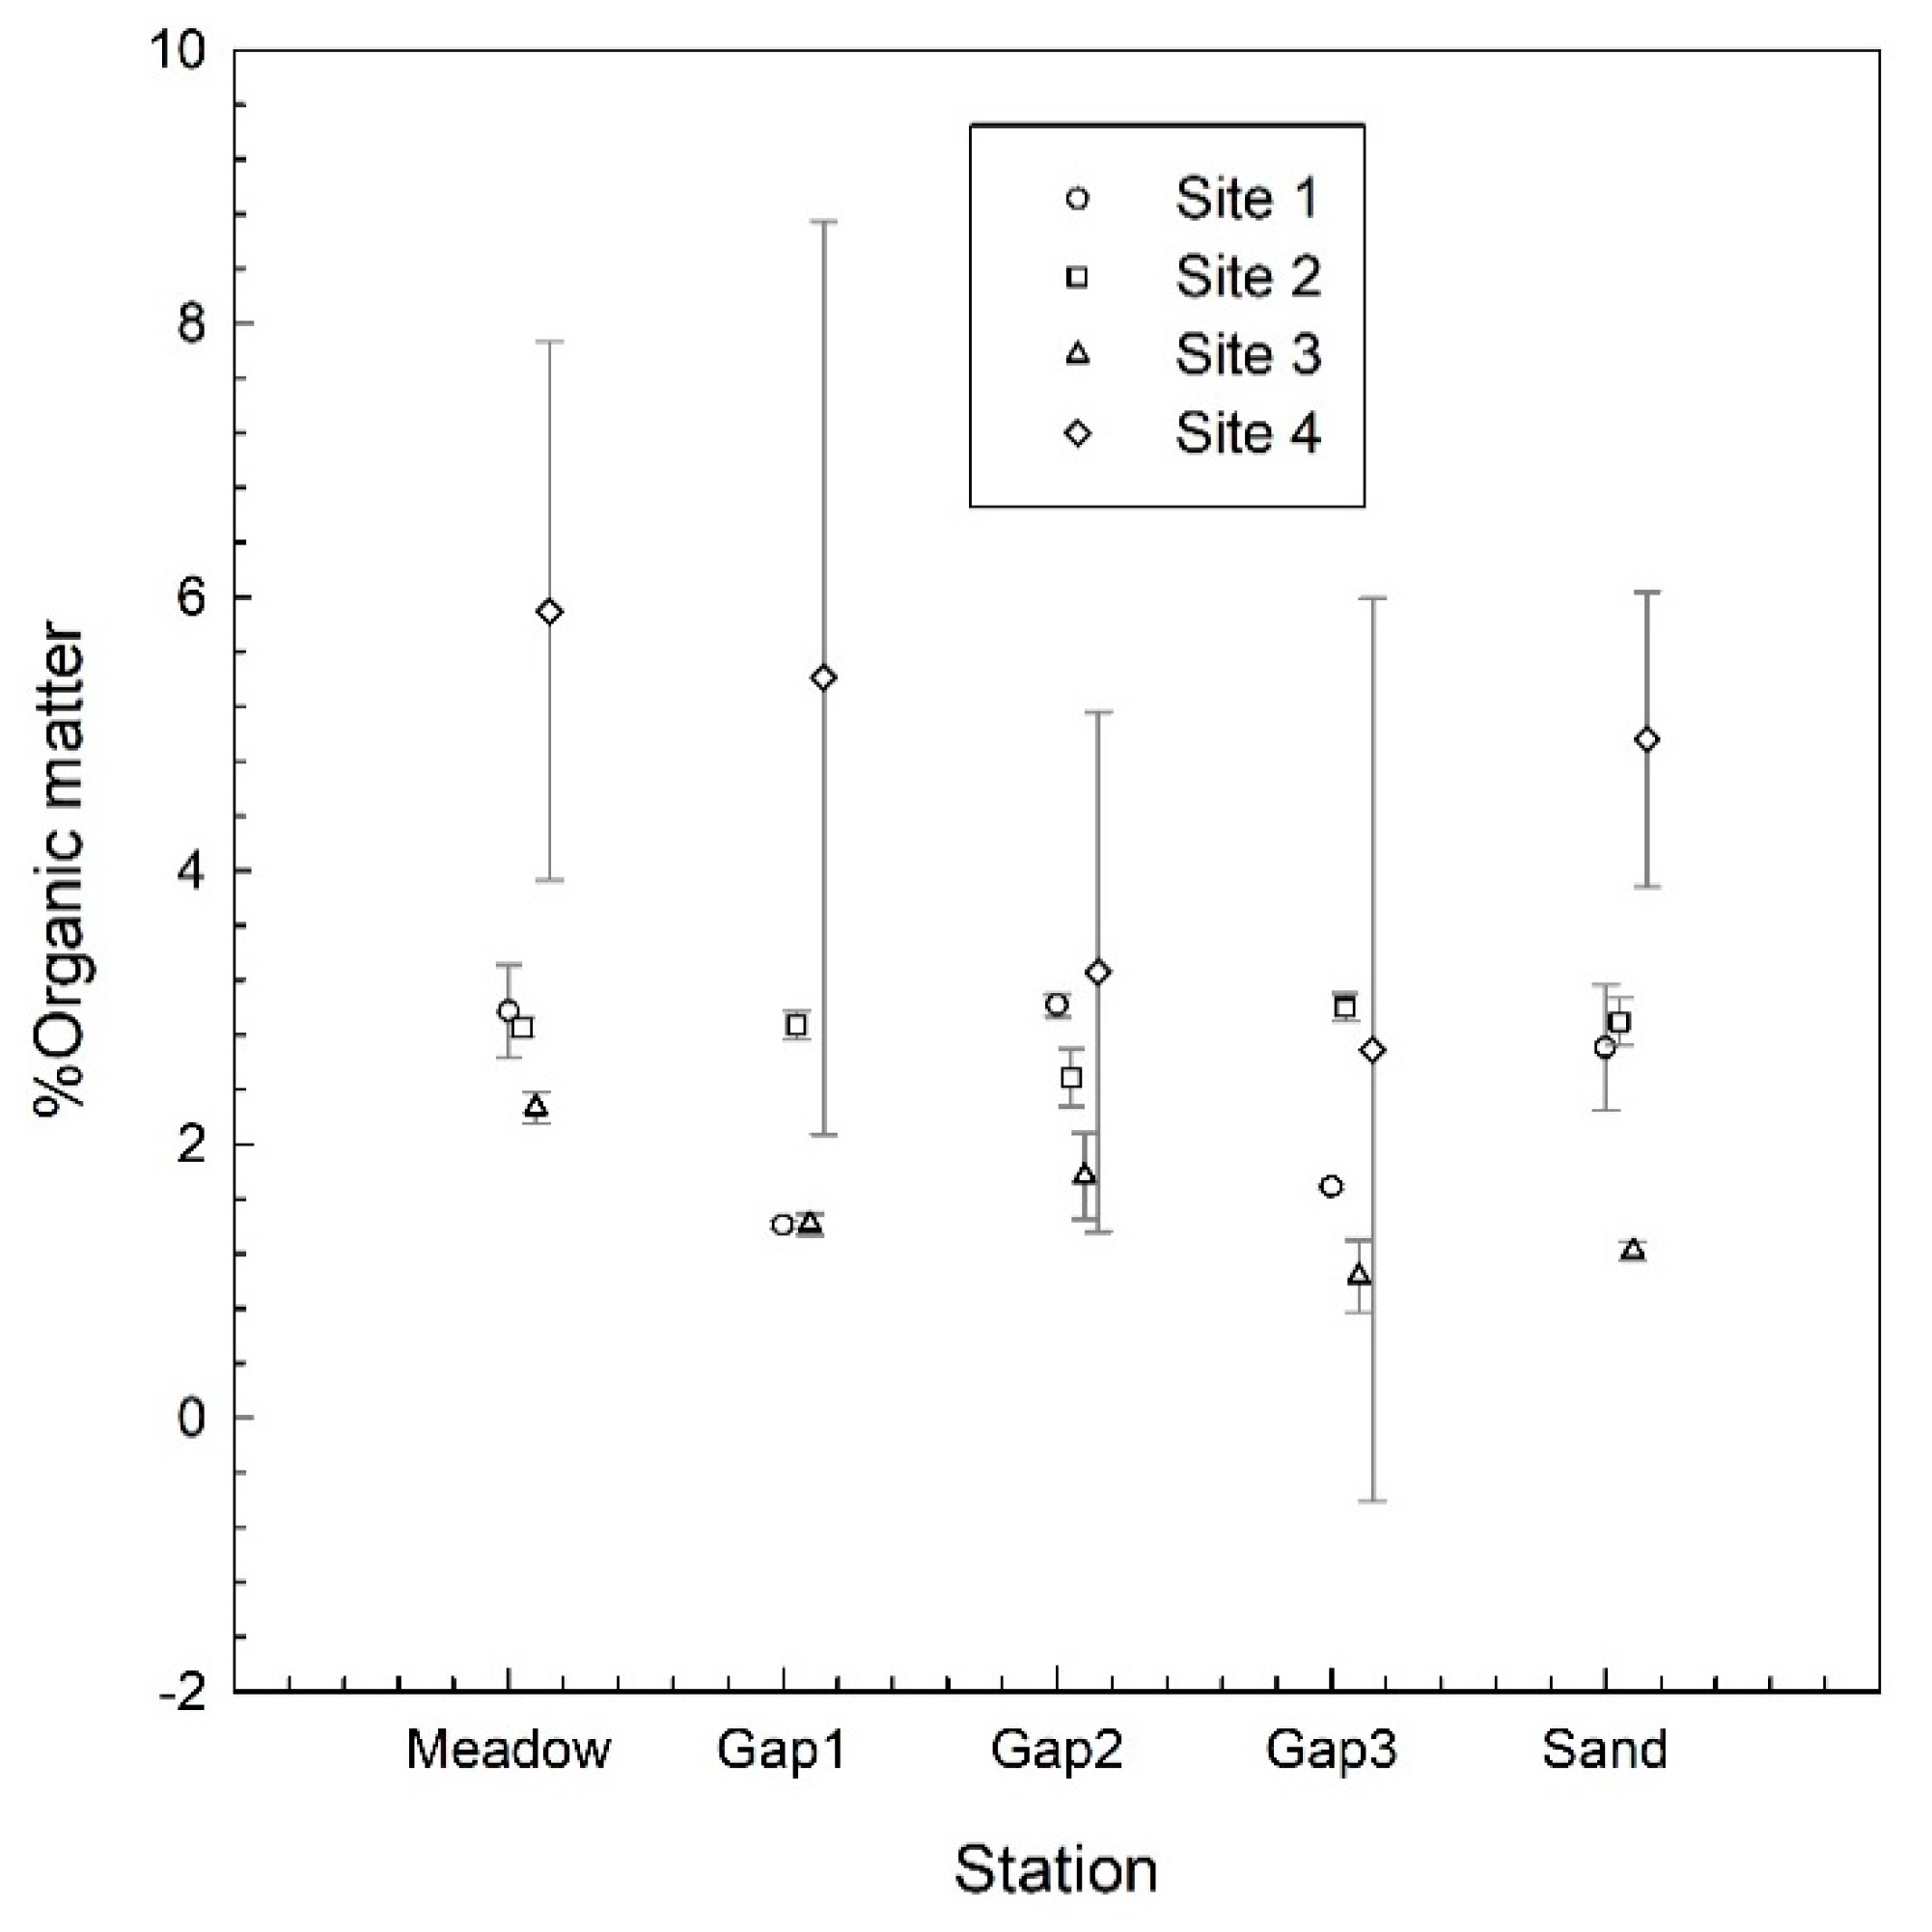
The percentage of organic matter in the sediment cores varied between 1% and 6% depending on the station and the site (Figure 6), but did not differ among the stations (meadow, gaps, sand) within the sites (p > 0.05). While Site 4 had the highest overall percentage of organic matter and Site 3 the lowest, there were significant differences (p < 0.01) between the sites.

4. Discussion

At all the sites sampled, wave velocity attenuation decreased as gap size increased. Although there were differences in the wave attenuation between the sites with different fragmentation levels on a landscape scale, they did not present a clear relationship with the fragmentation. Therefore, it would seem that the overall fragmentation of the meadow surrounding the gaps does not directly affect the wave attenuation within each gap. Consequently, neither does the fragmentation at a landscape scale seem to affect the hydrodynamics within the gap, and, in fact, it is mainly the gap size itself that causes the biggest impact on the hydrodynamics in the gap. This indicates that wave attenuation in a measurement station might depend more on the local properties of the canopy (cover or distance from the boundary) than on the large-scale properties of the meadow. This decrease in wave attenuation with the increase in gap size concurs with the laboratory studies of El Allaoui et al. [45], who found that wave velocity increased with gap size for two evaluated canopy densities: n = 318 shoots m−2 and 1273 shoot m−2. However, here, we found that the wave velocity can be twice the velocity measured within the meadow for the sand station, which is greater than the values obtained by El Allaoui et al. [45] when comparing a full meadow to a flow channel without plants. El Allaoui et al. [45] measured the wave velocity without plants as 1.09 times that within a continuous meadow. The larger difference we found could be attributed to the different wave characteristics between the field (with a mean wave period in the range of 2.56–3.64 s) and laboratory conditions (with a mean wave period of 0.71 s). In contrast to unsheltered regions, gaps within mussel beds have also been found to reduce wave forces by 40–60% [54]. The amount of reduction of wave intensity depends on the gap size. Ten-centimeter gaps within 7.7-cm-high mussel beds (10 cm/7.7 cm = 1.3) reduced wave forces by 60%. In the present study, the attenuation in 1-m-long gaps within the 0.6-m-high P. oceanica meadows (1 m/0.8 m = 1.25) produced a 40% reduction in wave velocity. Thus, the lower reduction obtained here (compared to Donnell [54]) could be attributed to the flexible structure of the seagrass leaves (as opposed to rigid mussels) or the different hydrodynamic conditions. While in the present study we observed differences in wave velocity between sites with different seagrass fragmentation levels, these differences were small and can be attributed to the different hydrodynamic conditions of the different sites (Table 1). Our results are consistent with Lara et al. [55], who stated that seagrass habitat fragmentation did not affect advection patterns in a tidal-dominated environment, indicating that flow velocities depend on the local characteristics and not on the seagrass landscape configuration.
As predicted by laboratory results [45], turbulent kinetic energy also increased with gap size. Within the meadow, the turbulent kinetic energy was similar to (and sometimes even higher than) that found for Gap 1. This can be due to the plant leaves’ proximity to the velocity sensor because the movement of the leaves adds TKE within the canopy or even directly interferes in the measurement volume. TKE was especially high for the continuous meadow in Site 4. At Sites 1, 2 and 3, the meadow station was chosen as a small gap, with a diameter below 0.5 m to avoid any such interference from the leaves. In these three sites, the turbulent kinetic energy in the meadow was lower than in Site 4, where the velocity sensor was situated within the meadow. In the present study, the wave velocity in the largest gap (d = 3 m) was closer to that over sand, in contrast to the turbulent kinetic energy that was more attenuated in the largest gap compared to the sand. Therefore, as found in laboratory studies [45], in a large gap, the TKE is more attenuated than the wave velocity. The Reynolds stress was also found to be greater for larger gaps within meadows [46], indicating that the distance between patches of vegetation (i.e., the size of the gap) determines the turbulence on the seabed. Similarly, as was found for the wave velocity attenuation, the level of TKE attenuation within the gap did not depend on the fragmentation level of the habitat. Instead, it depended on the local-length scale of the gap.
The amount of sediment caught by the sediment traps placed within the meadow, gaps or sand stations increased with the gap size, with values increasing from Gap 1 (d = 1 m) to Gap 3 (d = 3 m) with the greatest change from Gap 1 to Gap 2. These results indicate that gaps with diameters larger than 2 m have more sediment in suspension and, therefore, the overlying water has greater turbidity. When there is less light penetrating to the seafloor, the seagrasses’ photosynthetic requirements cannot be met and the plants struggle to grow. For instance, a 20% reduction in surface irradiance is the survival threshold for Z. marina [56] and an environment with a 9.72% reduction in surface irradiance can impede the survival of P. oceanica [57].
Within the meadow or in stations consisting of small gaps, there were relatively few particles in suspension. This can be explained by the enhanced particle loss in the seagrass canopies through two mechanisms: reduction in both wave velocity and TKE within the meadow, and direct trapping by the seagrass leaves [58]. The increase in TKE for large gaps can explain the increase in the amount of suspended particles obtained, according also to the results found by Chen et al. [59] that studied the relationship between the suspension of small particles under different levels of turbulence. These results also align with studies of coastal vulnerability, where regions with the presence of P. oceanica did not present bed erosion, contrary to what happened in bare beds [12]. The presence of gaps within a meadow increases the transportation of particles, especially in large gaps. This can support the filter feeders inhabiting meadows that rely on the flux of edible particles to sustain their population [60]. When gaps are small enough (i.e., Gap 1), there is limited space for turbulence to penetrate and the nearby meadow effectively protects the sediment at the bottom. The flux of material in Gap 1 is smaller compared to that found within the meadow and this could be attributed to the fact that plant leaves might maintain the particles that are interacting with their leaves in suspension. The amount of deposited sediment did not depend on the fragmentation level on a larger meadow scale. The highest deposition rates of Site 4 could be attributed to the fact that wastewater is discharged close to this area (Llucmayor wastewater treatment plant outlet at 11.3m depth in Son Veri). In contrast, the low deposition rates obtained in Site 2 could be attributed to this site having a partially rocky seabed, i.e., with less sediment available for being resuspended.
The organic matter did not present a clear pattern between stations. All the stations had similar organic content, indicating that the particles had a homogeneous distribution in the study zone. Significant differences in the organic content were observed between sites, with Site 4 presenting greater organic content in some stations (Meadow, Gap1 and Sand) than those of the other sites. This might be attributed to the fact that this site was close to a submarine wastewater discharge outlet.

5. Conclusions

The effect that fragmentation within seagrass meadows has on hydrodynamics and sedimentation rates was considered on two length scales: meadow and gap. The effect of the meadow length scale was determined through the effect of the percentage of fragmentation of the meadow, whereas the effect of the gap length scale was set as the width of the gap studied.
Both the wave velocity and the turbulent kinetic energy at the center of the gaps increased with the gap size, showing, therefore, the local effect of the fragmentation of a meadow. The larger the gap size, the lower the wave attenuation and the turbulent kinetic energy. The fragmentation level of the landscape impacted neither the wave attenuation nor the turbulent kinetic energy reduction within the gaps. Therefore, for the period and the sites studied, habitat fragmentation did not affect the hydrodynamics within the gaps and the most important length scale determining the level of the attenuation of the flow was gap size. These results for the hydrodynamics also agree with the sedimentation rates which, although they did increase with the size of the gap, did not show any differences between the fragmentation levels of the meadows.
In conclusion, the analysis in this study indicates that the hydrodynamics within gaps interspersed within a meadow have a stronger dependency on the local scale (gap size) than on large-scale parameters (the fragmentation level of the meadow).

Author Contributions

Conceptualization, T.S., N.G. and I.E.H.; methodology, T.S., N.G. and I.E.H.; software, N.G.; validation, T.S., N.G. and I.E.H.; formal analysis, T.S., N.G. and I.E.H.; investigation, T.S., N.G. and I.E.H.; resources, T.S. and I.E.H.; data curation, T.S.; writing—original draft preparation, T.S., N.G. and I.E.H.; writing—review and editing, T.S., N.G. and I.E.H.; visualization, T.S., N.G. and I.E.H.; supervision, I.E.H.; project administration, T.S. and I.E.H.; funding acquisition, T.S. and I.E.H. All authors have read and agreed to the published version of the manuscript.

Funding

This research was funded by Ministerio de Economía, Industria y Competitividad of the Spanish Government through the grants CGL2017-86515-P and MEDSHIFT CGL2015-71809-P. Partial funding was provided by the European Union’s Horizon 2020 project Eurofleets Plus (grant agreement 824077), and by the Spanish Ministry of Education, Culture and Sport under project UDRONE CTM2017-83075-R (to N. Gracias).

Conflicts of Interest

The authors declare no conflict of interest.

References

  1. Hemming, M.A.; Duarte, C.M. Seagrass Ecology; Cambridge University Press: Cambridge, UK, 2000. [Google Scholar]
  2. Short, F.; Wyllie-Echeverria, S. Natural and human-induced disturbance of seagrasses. Environ. Conserv. 1996, 23, 17–27. [Google Scholar] [CrossRef]
  3. de la Torre-Castro, M.; Rönnbäck, P. Links between humans and seagrasses—An example from tropical East Africa. Ocean Coast. Manag. 2004, 47, 361–387. [Google Scholar] [CrossRef]
  4. Jackson, E.L.; Rees, E.; Wilding, C.; Attrill, M.J. Use of a seagrass residency index to apportion commercial fishery landing values and recreation fisheries expenditure to seagrass habitat service. Conserv. Biol. 2015, 29, 899–909. [Google Scholar] [CrossRef] [PubMed] [Green Version]
  5. Whitfield, A.K. The role of seagrass meadows, mangrove forests, salt marshes and reed beds as nursery areas and food sources for fishes in estuaries. Rev. Fish Biol. Fish. 2017, 27, 75–110. [Google Scholar] [CrossRef]
  6. Costanza, R.; De Groot, R.; Sutton, P.; van der Ploeg, S.; Anderson, S.J.; Kubiszewski, J.; Farber, S.; Turner, R.K. Changes in the global value of ecosystem services. Glob. Environ. Chang. 2014, 26, 152–158. [Google Scholar] [CrossRef]
  7. Kennedy, H.; Beggins, J.; Duarte, C.M.; Fourqurean, J.W.; Holmer, M.; Marbà, N.; Middelburg, J.J. Seagrass sediments as a global carbon sink: Isotopic constraints. Glob. Biogeochem. Cycles 2010, 24, 1–8. [Google Scholar] [CrossRef] [Green Version]
  8. Duarte, C.M.; Kennedy, H.; Marbà, N.; Hendriks, I. Ocean & Coastal Management Assessing the capacity of seagrass meadows for carbon burial: Current limitations and future strategies. Ocean Coast. Manag. 2013, 83, 32–38. [Google Scholar] [CrossRef]
  9. Pergent-Martini, P.C.; Ge, C.F.B.; Ruitton, S.; Thibaut, T.; Verlaque, M. The necromass of the Posidonia oceanica seagrass meadow: Fate, role, ecosystem services and vulnerability. Hydrobiologia 2016, 781, 25–42. [Google Scholar] [CrossRef] [Green Version]
  10. Ondiviela, B.; Losada, I.J.; Lara, J.L.; Maza, M.; Galván, C.; Bouma, T.J.; van Belzen, J. The role of seagrasses in coastal protection in a changing climate. Coast. Eng. 2014, 87, 158–168. [Google Scholar] [CrossRef]
  11. Kantamaneni, K.; Du, X.; Aher, S.; Singh, R.M. Building blocks: A quantitative approach for evaluating coastal vulnerability. Water 2017, 9, 905. [Google Scholar] [CrossRef] [Green Version]
  12. Pantusa, D.; D’Alessandro, F.; Riefolo, L.; Principato, F.; Tomasicchio, G.R. Application of a coastal vulnerability index. A case study along the Apulian coastline, Italy. Water 2018, 10, 1218. [Google Scholar] [CrossRef] [Green Version]
  13. Halpern, B.S.; McLeod, K.L.; Rosenberg, A.; Crowder, L.B. Managing for cumulative impacts in ecosystem-based management through ocean zoning. Ocean Coast. Manag. 2008, 51, 203–211. [Google Scholar] [CrossRef]
  14. Trevathan-Tackett, S.M.; Sullivan, B.K.; Robinson, K.; Lilje, O.; Macreadie, P.I.; Gleason, F.H. Pathogenic Labyrinthula associated with Australian seagrasses: Considerations for seagrass wasting disease in the southern hemisphere. Microbiol. Res. 2018, 206, 74–81. [Google Scholar] [CrossRef] [PubMed]
  15. Piazzi, L.; Balestri, E.; Cinelli, F. Grazing of inflorescences of the seagrass Posidonia oceanica (L.) Delile. Bot. Mar. 2000, 43, 581–584. [Google Scholar] [CrossRef]
  16. Tyllianakis, E.; Callaway, A.; Vanstaen, K.; Luisetti, T. The value of information: Releasing the economic benefits of mapping seagrass meadows in the British Virgin Islands. Sci. Total Environ. 2019, 650, 2107–2116. [Google Scholar] [CrossRef] [PubMed]
  17. Infantes, E.; Terrados, J.; Orfila, A.; Cañellas, B.; Álvarez-Ellacuria, A. Wave energy and the upper depth limit distribution of Posidonia oceanica. Bot. Mar. 2009, 52, 419–427. [Google Scholar] [CrossRef] [Green Version]
  18. Do, V.T.; de Montaudin, X.; Blanchet, H.; Lavesque, N. Seagrass burial by dredged sediments: Benthic community alteration, secondary production loss, biotic index reaction and recovery possibility. Mar. Pollut. Bull. 2012, 64, 2340–2350. [Google Scholar] [CrossRef]
  19. Holon, F.; Boissery, P.; Guilbert, A.; Freschet, E.; Deter, J. The impacts of 85 years of coastal development on shallow seagrass beds (Posidonia oceanica L. (Delile)) in South Eastern France: A slow but steady loss without recovery. Estuar. Coast. Shelf Sci. 2015, 165, 204–212. [Google Scholar] [CrossRef] [Green Version]
  20. Fernandes, M.B.; Benger, S.; Stuart-Williams, H.; Gaylard, S.; Bryars, S. Coastal nitrogen plumes and their relationship with seagrass distribution. Estuar. Coast. Shelf Sci. 2015, 167, 390–403. [Google Scholar] [CrossRef]
  21. Short, F.T.; Neckles, H.A. The effects of global climate change on seagrasses. Aquat. Bot. 1999, 63, 169–196. [Google Scholar] [CrossRef]
  22. Marbà, N.; Duarte, C.M. Mediterranean warming triggers seagrass (Posidonia oceanica) shoot mortality. Glob. Chang. Biol. 2010, 16, 2366–2375. [Google Scholar] [CrossRef]
  23. Waycott, M.; Duarte, C.M.; Carruthers, T.J.B.; Orth, R.J.; Dennison, W.C.; Olyarnik, S.; Calladine, A.; Fourqurean, J.W.; Heck, K.L., Jr.; Hughes, A.R.; et al. Accelerating loss of seagrasses across the globe threatens coastal ecosystems. Proc. Natl. Acad. Sci. USA 2009, 1. [Google Scholar] [CrossRef] [PubMed] [Green Version]
  24. Orth, R.J.; Carruthers, T.J.B.; Dennison, W.C.; Duarte, C.M.; Fourqurean, J.W.; Heck, K.L.; Hughes, A.R.; Kendrick, G.A.; Kenworthy, W.J.; Olyarnik, S.; et al. A global crisis for seagrass ecosystems. Bioscience 2006, 56, 987–996. [Google Scholar] [CrossRef] [Green Version]
  25. Montefalcone, M.; Vacchi, M.; Archetti, R.; Ardizzone, G.; Astruch, P.; Bianchi, C.N.; Calvo, S.; Criscoli, A.; Fernández-Torquemada, Y.; Luzzu, F.; et al. Geospatial modelling and map analysis allowed measuring regression of the upper limit of Posidonia oceanica seagrass meadows under human pressure. Estuar. Coast. Shelf Sci. 2019, 217, 148–157. [Google Scholar] [CrossRef]
  26. Macreadie, P.I.; Hindell, J.S.; Jenkins, G.P.; Connolly, R.M.; Keough, M.J. Fish responses to experimental fragmentation of seagrass habitat. Conserv. Biol. 2009, 23, 644–652. [Google Scholar] [CrossRef]
  27. Marbà, N.; Duarte, C.M. Rhizome elongation and seagrass clonal growth. Mar. Ecol. Prog. Ser. 1998, 174, 269–280. [Google Scholar] [CrossRef]
  28. Marbà, N.; Duarte, C.M.; Cebrián, J.; Gallegos, M.E.; Olesen, B.; Sand-Jensen, K. Growth and population dynamics of Posidonia oceanica on the Spanish Mediterranean coast: Elucidating seagrass decline. Mar. Ecol. Prog. Ser. 1996, 137, 203–213. [Google Scholar] [CrossRef]
  29. Ruiz-Reynés, D.; Gomila, D.; Sintes, T.; Hernández-García, E.; Marbà, N.; Duarte, C.M. Fairy circle landscapes under the sea. Sci. Adv. 2017, 3, e1603262. [Google Scholar] [CrossRef] [Green Version]
  30. Livernois, M.C.; Grabowski, J.; Poray, A.K.; Gouhier, T.C.; Hughes, A.R.; O’Brien, K.; Yeager, L.A.; Fodrie, F.J. Effects of habitat fragmentation on Zostera marina seed distribution. Aquat. Bot. 2017, 142, 1–9. [Google Scholar] [CrossRef]
  31. Shinomiya, Y.; Chiva, S.; Kanamori, M.; Hashizume, S.; Yoshino, K.; Goshima, S. Importance of patch size variation for the population persistence of a decapod crustacean in seagrass beds. Mar. Ecol. Prog. Ser. 2017, 570, 157–171. [Google Scholar] [CrossRef] [Green Version]
  32. Ricart, A.M.; Dalmau, A.; Pérez, M.; Romero, J. Effects of landscape configuration on the exchange of materials in seagrass ecosystems. Mar. Ecol. Prog. Ser. 2015, 532, 89–100. [Google Scholar] [CrossRef]
  33. Granata, T.C.; Serra, T.; Colomer, J.; Casamitjana, X.; Duarte, C.M.; Gacia, E. Flow and particle distributions in a nearshore seagrass meadow before and after a storm. Mar. Ecol. Prog. Ser. 2001, 218, 95–106. [Google Scholar] [CrossRef]
  34. Colomer, J.; Soler, M.; Serra, T.; Casamitjana, X.; Oldham, C. Impact of anthropogenically created canopy gaps on wave attenuation in a Posidonia oceanica meadow. Mar. Ecol. Prog. Ser. 2017, 569, 103–116. [Google Scholar] [CrossRef] [Green Version]
  35. Pujol, D.; Serra, T.; Colomer, J.; Casamitjana, X. Flow structure in canopy models dominated by progressive waves. J. Hydrol. 2013, 486, 281–292. [Google Scholar] [CrossRef]
  36. Ros, À.; Colomer, J.; Serra, T.; Pujol, D.; Soler, M.; Casamitjana, X. Experimental observations on sediment resuspension within submerged model canopies under oscillatory flow. Cont. Shelf Res. 2014, 91, 220–231. [Google Scholar] [CrossRef]
  37. Gacia, E.; Duarte, C.M. Sediment retention by a Mediterranean Posidonia oceanica meadow: The balance between deposition and resuspension. Estuar. Coast. Shelf Sci. 2001, 52, 505–514. [Google Scholar] [CrossRef]
  38. Gacia, E.; Granata, T.C.; Duarte, C.M. An approach to measurement of particle flux and sediment retention within seagrass (Posidonia oceanica) meadows. Aquat. Bot. 1999, 65, 255–268. [Google Scholar] [CrossRef]
  39. Terrados, J.; Duarte, C.M. Experimental evidence of reduced particle resuspension within a seagrass (Posidonia oceanica L.) meadow. J. Exp. Mar. Biol. Ecol. 2000, 243, 45–53. [Google Scholar] [CrossRef]
  40. Gacia, E.; Duarte, C.M.; Middelburg, J.J. Carbon and nutrient deposition in a Mediterranean seagrass (Posidonia oceanica) meadow. Limnol. Oceanogr. 2002, 47, 23–32. [Google Scholar] [CrossRef]
  41. Duarte, C.M.; Middelburg, J.J.; Caraco, N. Major role of marine vegetation on the oceanic carbon cycle. Biogeosciences 2005, 2, 1–8. [Google Scholar] [CrossRef] [Green Version]
  42. Duarte, C.M.; Losada, I.J.; Hendriks, I.; Mazarrasa, I.; Marbá, N. The role of coastal plant communities for climate change mitigation and adaptation. Nat. Clim. Chang. 2013, 3, 961–968. [Google Scholar] [CrossRef] [Green Version]
  43. Ricart, A.M.; Perez, M.; Romero, J. Landscape configuration modulates carbon storage in seagrass sediments. Estuar. Coast. Shelf Sci. 2017, 185, 69–76. [Google Scholar] [CrossRef]
  44. El Allaoui, N.; Serra, T.; Soler, M.; Colomer, J.; Pujol, D.; Oldham, C. Modified hydrodynamics in canopies with longitudinal gaps exposed to oscillatory flows. J. Hydrol. 2015, 531, 840–849. [Google Scholar] [CrossRef]
  45. El Allaoui, N.; Serra, T.; Colomer, J.; Soler, M.; Casamitjana, X.; Oldham, C. Interactions between fragmented seagrass canopies and the local hydrodynamics. PLoS ONE 2016, 11, 1–19. [Google Scholar] [CrossRef] [PubMed]
  46. Folkard, A.M. Hydrodynamics of model Posidonia oceanica patches in shallow water. Limnol. Oceanogr. 2005, 50, 1592–1600. [Google Scholar] [CrossRef]
  47. Elibol, A.; Garcia, R.; Gracias, N.R. A new global alignment approach for underwater optical mapping. Ocean Eng. 2011, 38, 1207–1219. [Google Scholar] [CrossRef]
  48. Gleason, A.C.R.; Lirman, D.; Williams, D.E.; Gracias, N.R.; Gintert, B.; Madjidi, H.; Reid, R.P.; Boynton, G.C.; Negahdaripour, S.; Miller, M.; et al. Documenting hurricane impacts on coral reefs using two dimensional video-mosaic technology. Mar. Ecol. 2007, 28, 254–258. [Google Scholar] [CrossRef]
  49. Lirman, D.; Gracias, N.R.; Gintert, B.E.; Gleason, A.C.R.; Deangelo, G.; Dick, M.; Martinez, E.; Reid, R.P. Damage and recovery assessment of vessel grounding injuries on coral reef habitats by use of georeferenced landscape video mosaics. Limnol. Oceanogr. Methods 2010, 8, 88–97. [Google Scholar] [CrossRef]
  50. Luhar, M.; Coutu, S.; Infantes, E.; Fox, S.; Nepf, H.M. Wave-induced velocities inside a model seagrass bed. J. Geophys. Res. 2010, 115, C12005. [Google Scholar] [CrossRef] [Green Version]
  51. Pujol, D.; Casamitjana, X.; Serra, T.; Colomer, J. Canopy-scale turbulence under oscillatory flow. Cont. Shelf Res. 2013, 66, 9–18. [Google Scholar] [CrossRef]
  52. Rice, E.D.; Baird, R.B.; Eaton, A.D. (Eds.) Standard Methods for the Examination of Water and Wastewater; American Public Health Association, American Waterworks Association, Water Environment Association: Washington, DC, USA, 2017. [Google Scholar]
  53. Sokal, R.R.; Rohlf, F.J. Biometry; W.H. Freeman and Co.: New York, NY, USA, 1995. [Google Scholar]
  54. Donnell, M.J.O. Reduction of wave forces within bare patches in mussel beds. Mar. Technol. Soc. J. 2014, 362, 157–167. [Google Scholar] [CrossRef] [Green Version]
  55. Lara, M.; Peralta, G.; Alonso, J.J.; Morris, E.P.; González-Ortiz, V.; Rueda-Márquez, J.J.; Pérez-Lloréns, J.L. Effects of intertidal seagrass habitat fragmentation on turbulent diffusion and retention time of solutes. Mar. Pollut. Bull. 2012, 64, 2471–2479. [Google Scholar] [CrossRef] [PubMed] [Green Version]
  56. Dennison, W.C. Effects of light on seagrass photosynthesis, growth and depth distribution. Aquat. Bot. 1987, 27, 15–26. [Google Scholar] [CrossRef]
  57. Marbà, N.; Duarte, C.M.; Holmer, M.; Martínez, R.; Basterretxea, G.; Orfila, A.; Jordi, A.; Tintoré, J. Effectiveness of protection of seagrass (Posidonia oceanica) populations in Cabrera National Park (Spain). Environ. Conserv. 2002, 29, 509–518. [Google Scholar] [CrossRef] [Green Version]
  58. Hendriks, I.E.; Sintes, T.; Bouma, T.J.; Duarte, C.M. Experimental assessment and modeling evaluation of the effects of the seagrass Posidonia oceanica on flow and particle trapping. Mar. Ecol. Prog. Ser. 2008, 356, 163–173. [Google Scholar] [CrossRef]
  59. Chen, X.; Liu, Z.; Chen, Y.; Wang, H. Analytical expression for predicting the reduced settling velocity of small particles in turbulence. Environ. Fluid Mech. 2020, 20, 905–922. [Google Scholar] [CrossRef]
  60. González-Ortiz, V.; Egea, L.G.; Jiménez-Ramos, R.; Moreno-Marín, F.; Pérez-Llorens, J.L.; Bouma, T.J.; Brun, F.G. Interactions between seagrass complexity, hydrodynamic flow and biomixing after food availability for associated filter-feeder organisms. PLoS ONE 2014, 9, e104949. [Google Scholar] [CrossRef] [Green Version]
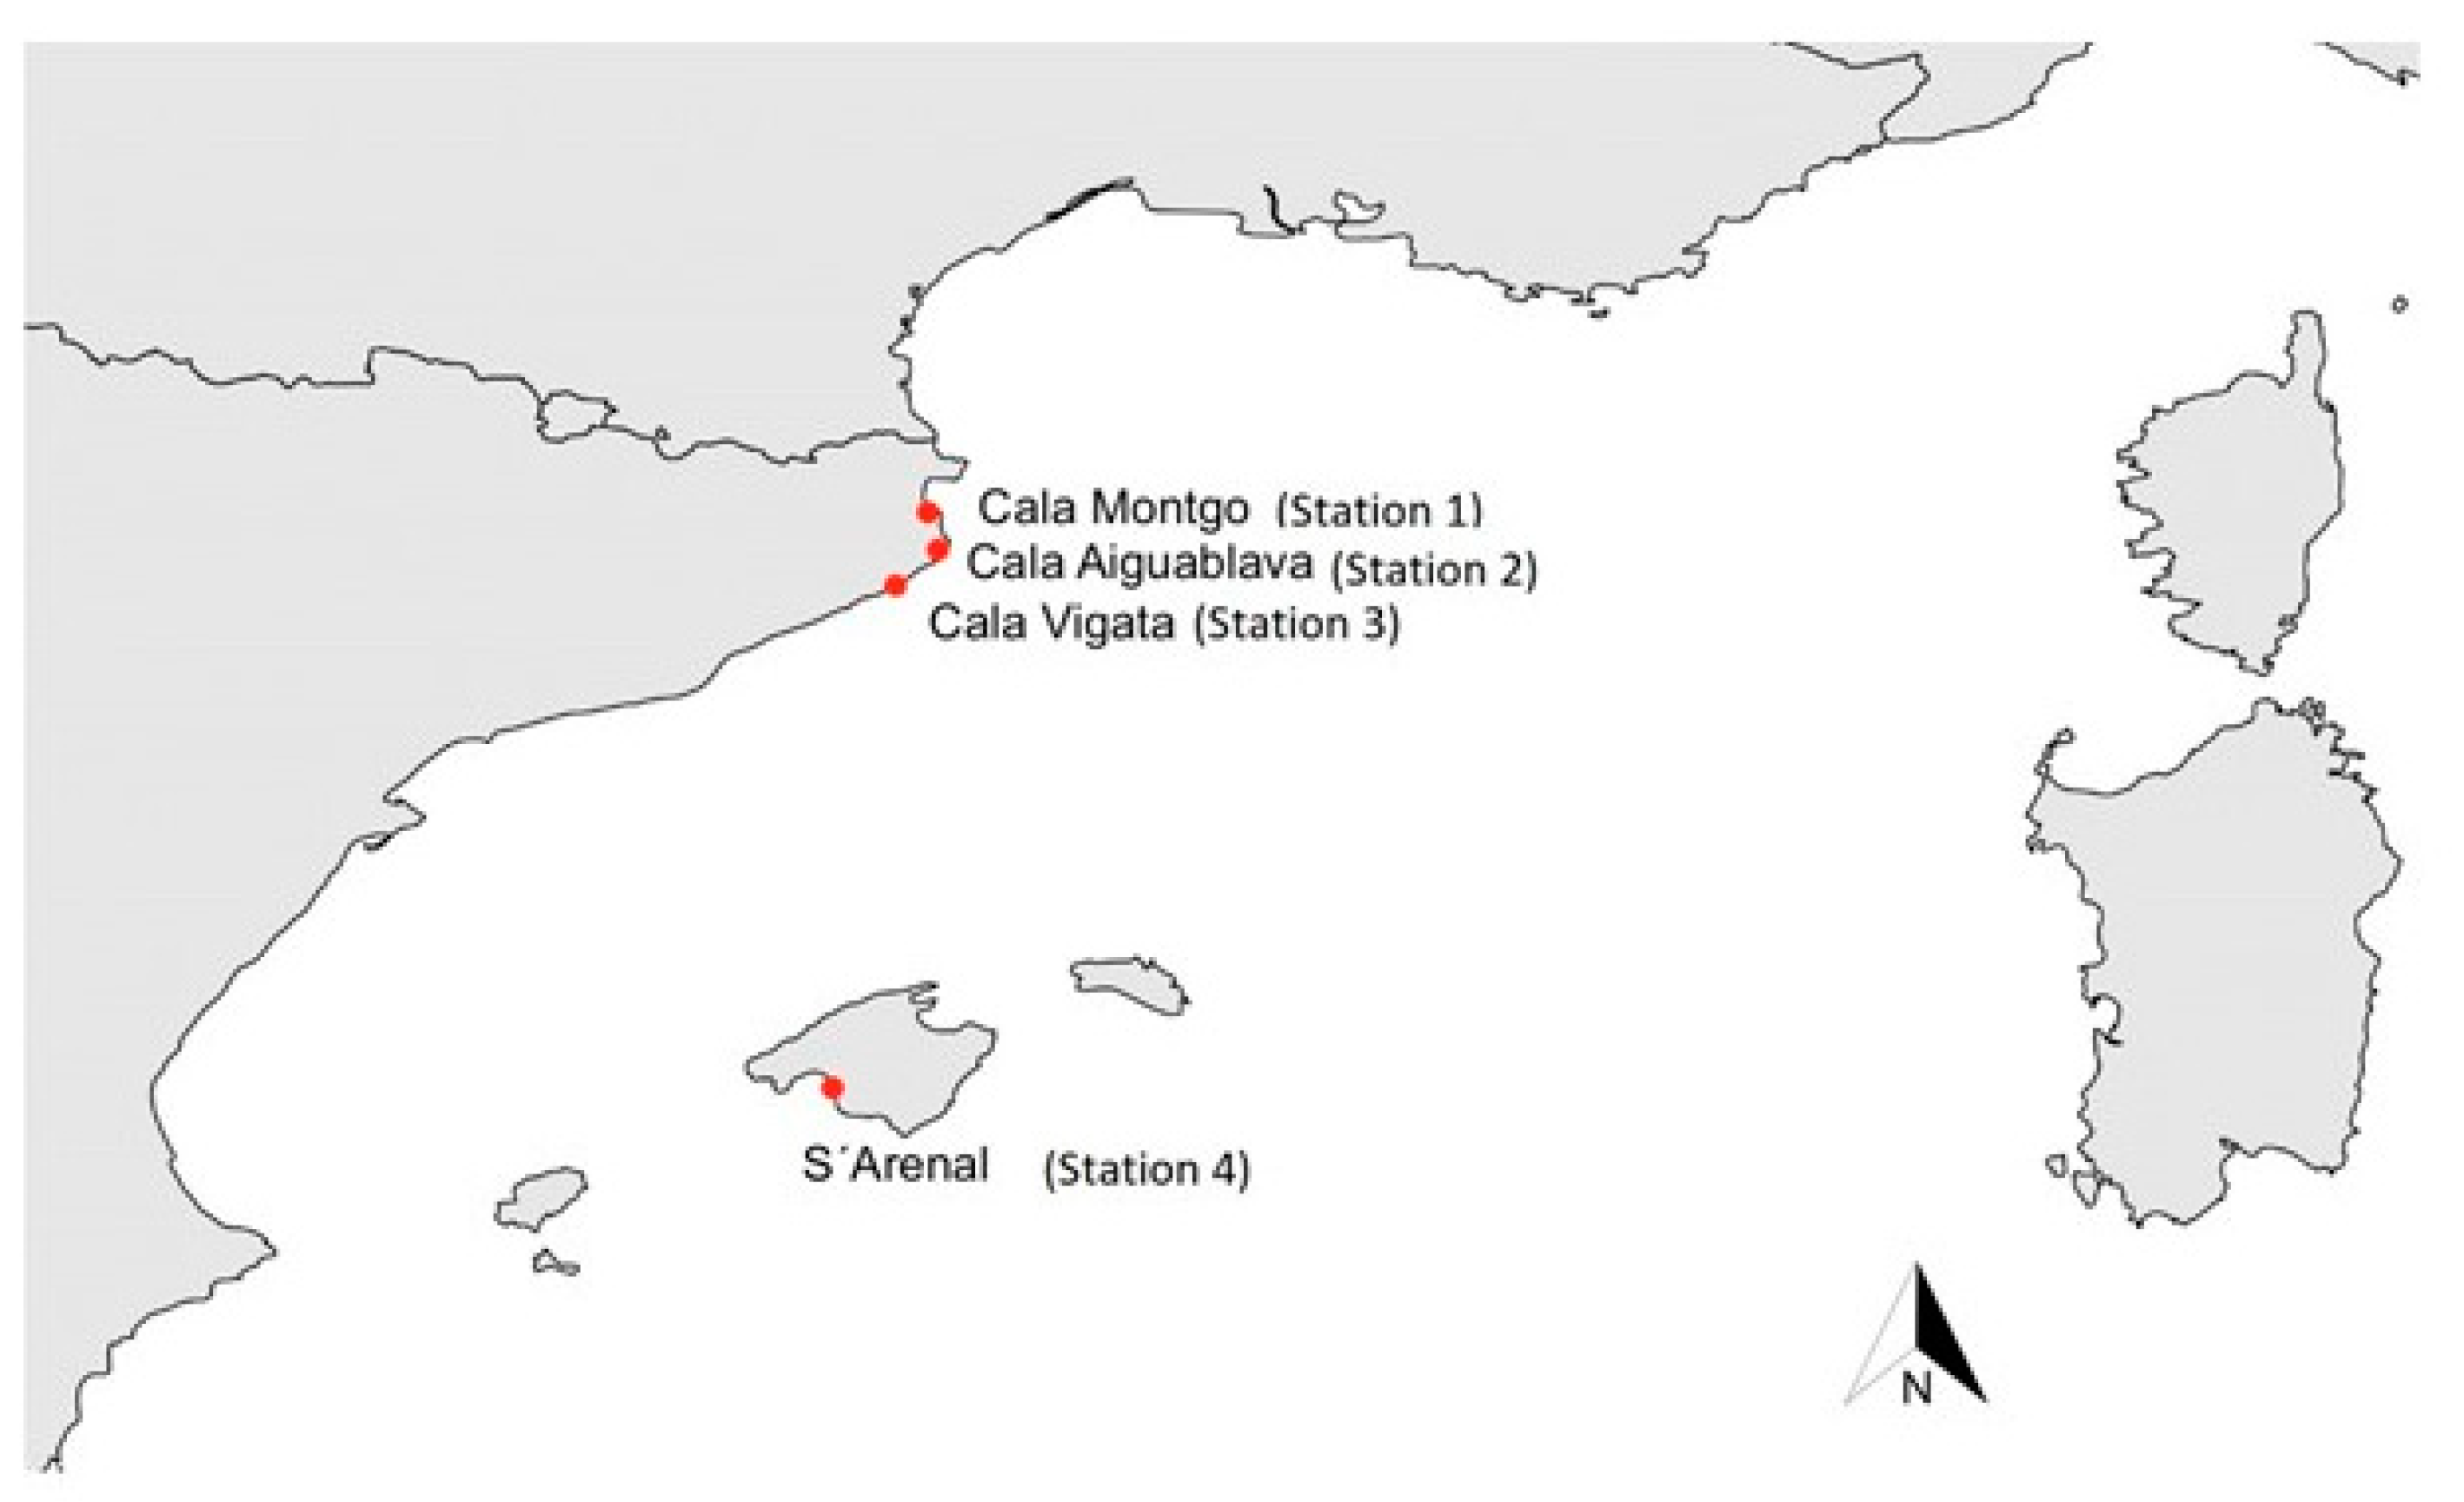
Figure 1. Map with the measurement sites studied. Source (CRAN, R).
Water 12 03473 g001
Figure 2. (a) Photographs of both the site and the photomosaic in Site 1 are shown, (b) photographs of both the site and the photomosaic in Site 2 are shown, (c) photographs of both the site and the photomosaic in Site 3 are shown, and (d) photographs of both the site and of Google Earth in Site 4 are shown. The photographs of the sites are satellite images of Google maps.
Water 12 03473 g002
Figure 3. Wave velocity ratio α = Uw,st/Uw,Meadow measured for each station and the different sites studied. Error bars indicate the standard deviation of the measurements (SD). The results for α in each station have been slightly shifted in the horizontal axis so that they are clearly seen.
Water 12 03473 g003
Figure 4. Turbulent kinetic energy ratio β = TKEw,st/TKEw,Gap1 measured for each station and the different sites studied. The results for β in each station have been slightly shifted in the horizontal axis so that they are clearly seen.
Water 12 03473 g004
Figure 5. Deposition rates (DRs) for each station evaluated within the different sites studied. Error bars indicate the standard error of the mean. The results for DR in each station have been slightly shifted in the horizontal axis so that they are clearly seen.
Water 12 03473 g005
Figure 6. Percentage of organic matter measured in the sediment obtained from the cores of each station and for the different sites studied. Error bars represent the standard error of the mean. The results for each station have been slightly shifted in the horizontal axis so that they are clearly seen.
Water 12 03473 g006
Table 1. Canopy density (n, in shoots m−2), mean wave period calculated with a fast Fourier transformation of the obtained ADV velocity data (T, in s), area (Abare sand in m2) of the bare sand patches, total area including P. oceanica (Atotal in m2), the percentage of fragmentation, the wave velocity (Uw, in m s−1) and the turbulent kinetic energy (TKE, in m2 s−2) at P. oceanica stations and the wavelength (in m) calculated using the dispersion equation of waves.
Siten
(Shoots m−2)
T
(s)
Abare sand
(m2)
Atotal
(m2)
Fragmentation
(%)
Uw
(cm s−1)
TKE
(cm2 s−2)
Wavelength
(m)
12592.56359.92622.213.70.902.5510.25
24222.671423.62247.463.30.982.1911.38
33873.17537.62442.922.51.201.6815.61
44003.64389.2216218.01.084.0324.57
Publisher’s Note: MDPI stays neutral with regard to jurisdictional claims in published maps and institutional affiliations.