Article

Effect of Soaking Time and Salt Concentration on Mechanical Characteristics of Slip Zone Soil of Loess Landslides

State Key Laboratory of Continental Dynamics, Department of Geology, Northwest University, Xi’an 710069, China
*
Authors to whom correspondence should be addressed.
Water 2020, 12(12), 3465; https://doi.org/10.3390/w12123465
Submission received: 31 October 2020 / Revised: 2 December 2020 / Accepted: 4 December 2020 / Published: 9 December 2020
(This article belongs to the Special Issue Water-Induced Landslides: Prediction and Control)

Abstract

:
Loess landslides are closely related to the variation in mechanical properties of soils due to the leaching of irrigation water in the irrigation area which causes the loss of soluble salt in the loess stratum. To investigate the effect of leaching on the mechanical characteristics of loess, ring shear tests were conducted on the slip zone soil samples obtained from a typical loess landslide under different soaking time and salt concentration. Furthermore, the microstructural observations were made on shear planes by using SEM (scanning electron microscopy) tests. The experiment revealed that: firstly, the shear strength of loess decreases with the increase of soaking time before reaching the minimum value at the soaking time of 1 d, and then increases with the soaking time until reaching a relatively stable value. Secondly, the shear strength of loess has an increasing tendency with the salt concentration before reaching a maximum value at the salt concentration of 8%, and then shear strength decreases. In addition, a “stress-softening” was found for the loess samples with the soaking time of 1 d and salt concentration of 8%. It is found that the total number of micropores and small-pores in loess samples decreases with increasing salt concentration up to 8%, but increases rapidly between salt contents of 8% and 20%. The SEM tests showed that the increase in salt concentration (0% to 8%) facilities the formation of small aggregates within loess soils, which in turn promotes the increasing of shear strength. However, further increase in salt concentration (8% to 20%) helps the development of relatively large aggregates in loess samples, resulting in the reduction in shear strength.

1. Introduction

Loess soils are widely distributed in the mid-latitude regions around the world, which include Asia, America, Australia, and Western Europe, covering about a total area of 13 million square kilometers [1,2,3]. It has be found that loess soils are typical Aeolian soils and susceptible to collapse upon wetting due to rainfall or irrigation [4,5]. The collapse of loess soils has been recognized as a fundamental cause for frequent occurrence of loess landslides along loess slopes [6,7,8].
The shear strength of soil is a key parameter for assessing stability of a slope and investigating the evolution stage of a landslide [9,10,11,12,13], and it has been widely acknowledged that the movement of most loess landslides is triggered by the reduction in the shear strength of slip zone soils [14]. Although many researchers have found that the mechanical properties of loess soils are rapidly altered due to the variation in water [15,16], it has also been reported that the shear strength of loess soils could also be strongly affected by the salt concentration in some areas [17,18,19]. For example, Di Maio and Scaringi [20] concluded that the shear strength of saline soil decreases with the low salinity of pore fluid. Up to the present, the soil moisture content and salt concentration have been recognized as the two main factors triggering geological hazards [18].
Salt has been widely observed in loess soils [17,19,21,22]. In irrigation area, with the long-term irrigation of water, loess soils are soaked in water. Consequently, the soluble salt in the soil was transported away, causing the mechanical properties of the loess to change and then the shear strength changes, which in turn results in a frequent occurrence of landslides [7,23,24]. Dijkstra et al. [2] proposed that a reduction in the shear strength of loess occurred due to the soluble salt leaching. Furthermore, it was found that the peak strength and residual strength of saturated loess were strongly modified by the variation in NaCl (sodium chloride) concentration of groundwater [19], and Zhang et al. [19] also pointed that the shear strength shows a non-linear trend of increasing with NaCl concentration, while the microstructural characterization of loess samples was not mentioned. Bing et al. [25] studied the effect of desalination on the physical and mechanical properties of loess and found that the calcium cementation of loess after desalination was weakened and the structure was also changed. More recently, Fu et al. [18] pointed out that as the salt content in loess increases from 0.00% to 12.00%, the cohesive angle and internal friction angle of loess both decrease first and then increase, while the mechanical mechanism of loess due to the variation in microstructure of loess was not investigated.
To date, it has been found that the SEM (scanning electron microscopy) technique is useful for interpreting the microstructure of a loess soil prepared with different salt contents [17,21]. For instance, Fan et al. [17] carried out SEM tests on remolded loess samples and suggested that the microstructure of loess varies with water content and sodium chloride content, which in turn leads to the strength loss of unsaturated loess. While the specific correlation between the shear strength and salt contents was not concluded since the mechanical tests were only conducted on 1 M loess soils. Xu et al. [21] combined dry-wet cycle tests with SEM tests to study the shear strength of intact loess samples prepared by infiltrating sodium sulfate solution with different concentrations, and concluded that the dissolution of salt changes the relative position of the particles in the soil, which is the cause for the strength loss of loess. However, the evolution of pore size distribution of loess soils was not statistically analyzed. A review of literature above suggests that the study on the microstructure of the slip zone soil with different soaking time and salt concentration is not well known. Especially, the variation in microstructural characteristics of pores of loess requires more experimental evidence.
Under this background, the objective of this study was to explore the shear characteristics and microstructure of loess soils treated with different soaking time and sodium chloride (NaCl) concentration by using the ring shear tests and SEM (scanning electron microscopy) techniques. It was hypothesized that the variation of the salt content in the loess soils is one cause to the landslide occurrence in the current study. SEM tests were also conducted on the specimens after the mechanical tests and the SEM images were processed with the Image Pro-Plus (IPP) software to obtain the microstructural information of the loess. Relationships between the peak strength, residual strength and the soaking time, NaCl concentration were proposed. The result is apt to provide an informative basis for landslide mitigation and prevention in the loess irrigation area.

2. Materials and Methods

2.1. Test Samples

To examine the effect of the salt concentration on the shear behavior of loess, soil samples collected from the Dangchuan landslide in Heifangtai, Yanguoxia Town, Yongjing County, Lanzhou, China (Figure 1a) were used in this study. Affected by the dry climate, the average annual rainfall in the Heifangtai terrace (36°04′10″–36°07′20″ N, 103°16′40″–103°20′50″ E) is found about 287.6 mm, but the annual evaporation averaged approximately 1593.4 mm [26]. Therefore, artificial irrigation (flood irrigation) was adopted for a long time for local farming. However, the infiltration of a large amount of irrigation water (annual irrigation amount of about 645 × 104 m3) has led to a significant increase in the groundwater level of the platform [15]. Since 1968, the phreatic level in the center of the platform has increased by 20 m, with an average annual increase of 0.27 m, causing the loess to be under soaking state for a long-term period [24,27]. Due to the unique geological environment, salt minerals of weathered rocks are abundant within the loess soils [23,25], and thus salt loss in the loess is common, triggering a large number of loess landslides in the Heifangtai area due to irrigation (Figure 1). The sampling site, which was selected at a distance of about 10 m away from the top of the platform, is located in the Dangchuan landslide in Heifangtai terrance in which salt deposits were commonly observed due to the long-term irrigation activities (Figure 1b). In the sampling site, loess was trimmed to a cube-shaped block sample with a length of about 25 to 30 cm (Figure 1c). Soil samples that were collected are classified as Malan (Q3) loess according to the stratum illustrated by the previous work [28]. Thereafter, the block samples were sealed by using plastic films and transferred back to the laboratory to conduct tests to determine some physical indexes of loess. Some physical properties of the loess are listed in Table 1.

2.2. Sample Preparation with Different Soaking Time

During the preparation of soil samples for tests, distilled water was used. Seven soil samples (each of 350 g) were firstly immersed in distilled water for 0 d (day), 1, 5, 10, 15, 20, 25 d, respectively, and then placed in an oven at the temperature of 105 °C for drying. Thereafter, soil samples were crushed and passed through a 2 mm sieve. Next, distilled water was added to samples until an initial water content of 16% was reached. After that, soil samples were sealed by using plastic films to achieve a uniform distribution of moisture content.

2.3. Sample Preparation with Different Salt Concentration

To clarify the influence of salt concentration on the strength behavior of loess, it is necessary to wash thoroughly the “salt” of loess samples that was collected from the sampling site. The washing process is described as follows: Firstly, about 2000 g loess and 6000 g distilled water (with a ratio of 1:3) were mixed in a clean bucket following the procedure proposed by Li [29], and then soil samples were stirred thoroughly by hand (Figure 2). Thereafter, soil samples were sealed by plastic films and then stored for 24 h in a sealing container to achieve a uniform distribution of moisture content within samples. Next, a medical syringe was used carefully to extract supernatant liquid at the top of the bucket. After that, the corresponding amount of distilled water was added back into the bucket and stirred again. Then, soil samples were stored at about 24 h again. The process mentioned above was carried out several times until the salt in the loess was removed almost completely. To find an optimum washing time of soil samples, a series of preliminary tests were conducted where 48, 72, 96, and 120 h are designed for specimens with the same testing conditions, the shear results show that for the cases of 72, 96, and 120 h, their strength and stress-strain curves are very close to each other with negligible differences, indicating washing time of 72 h is enough for obtaining the desalinated loess. Therefore, 72 h (three times) is selected here from the point of view of time saving. After that, the desalinated loess samples were placed into an oven for drying at the temperature of 105 °C. Then, soil samples were crushed and sieved by using a 2 mm sieve. The prepared soil samples were then divided into six groups, each with 300 g. Then, solution with different NaCl concentrations (0%, 4%, 8%, 12%, 16%, and 20%) were added to soil samples until the moisture content of 16% was achieved. After that, soil samples were sealed by using plastic films and stored in a moisturizing container to obtain a uniform distribution of moisture content.

2.4. Sample Preparation with Different Soaking Time

Ring shear apparatus has been widely used to determine both the peak and the residual strength of soils to analyze the stability of landslides [11,30,31]. In this study, ring shear tests were conducted on loess samples by using the SRS-150 dynamic ring shear apparatus manufactured by American GCTS company (Figure 3a). The ring shear apparatus has a shear box sized 150 mm in outer diameter, 100 mm in inner diameter, and 25 mm in height (Figure 3b). This apparatus enables the simulation of loading under drained and undrained condition. Soil samples can be sheared by using the torque-controlled method or the shear speed-controlled method.

2.5. Testing Program and Procedure

Two series of ring shear tests were conducted in this study. Firstly, we perform a series of ring shear tests to examine the effect of soaking time on the shear behavior of loess. In this series, seven samples were prepared with the same dry density and consolidation stress (200 kPa), but soaked with different time (0, 1, 5, 10, 15, 20, and 25 d). Secondly, a series of tests were conducted on loess samples to investigate the effect of NaCl concentration on the shear behavior of loess. In this series, six samples were prepared with the same dry density and consolidation stress (200 kPa), but prepared with different NaCl concentration (0%, 4%, 8%, 12%, 16%, and 20%).
Firstly, the prepared soil samples were placed into the shear box and tamped in three layers to achieve a uniform density. Thereafter, the soil sample was consolidated by increasing the consolidation stress at the rate of 10 kPa/min until the stress of 200 kPa was achieved. It is noted that the sample was consolidated under a normal stress of 200 kPa without applying any shear stress. This consolidation of the soil sample was considered finished until no further change in sample volume was found. After that, the soil sample was sheared at the rate of 1 mm/min under the shear stress of 200 kPa. All soil samples were sheared to a large displacement until a relatively constant value of shear resistance was achieved. The whole test process is controlled by computer and experimental data were recorded automatically.

3. Testing Results

The shear behavior of loess samples was obtained, and all the test results are summarized in Table 2.

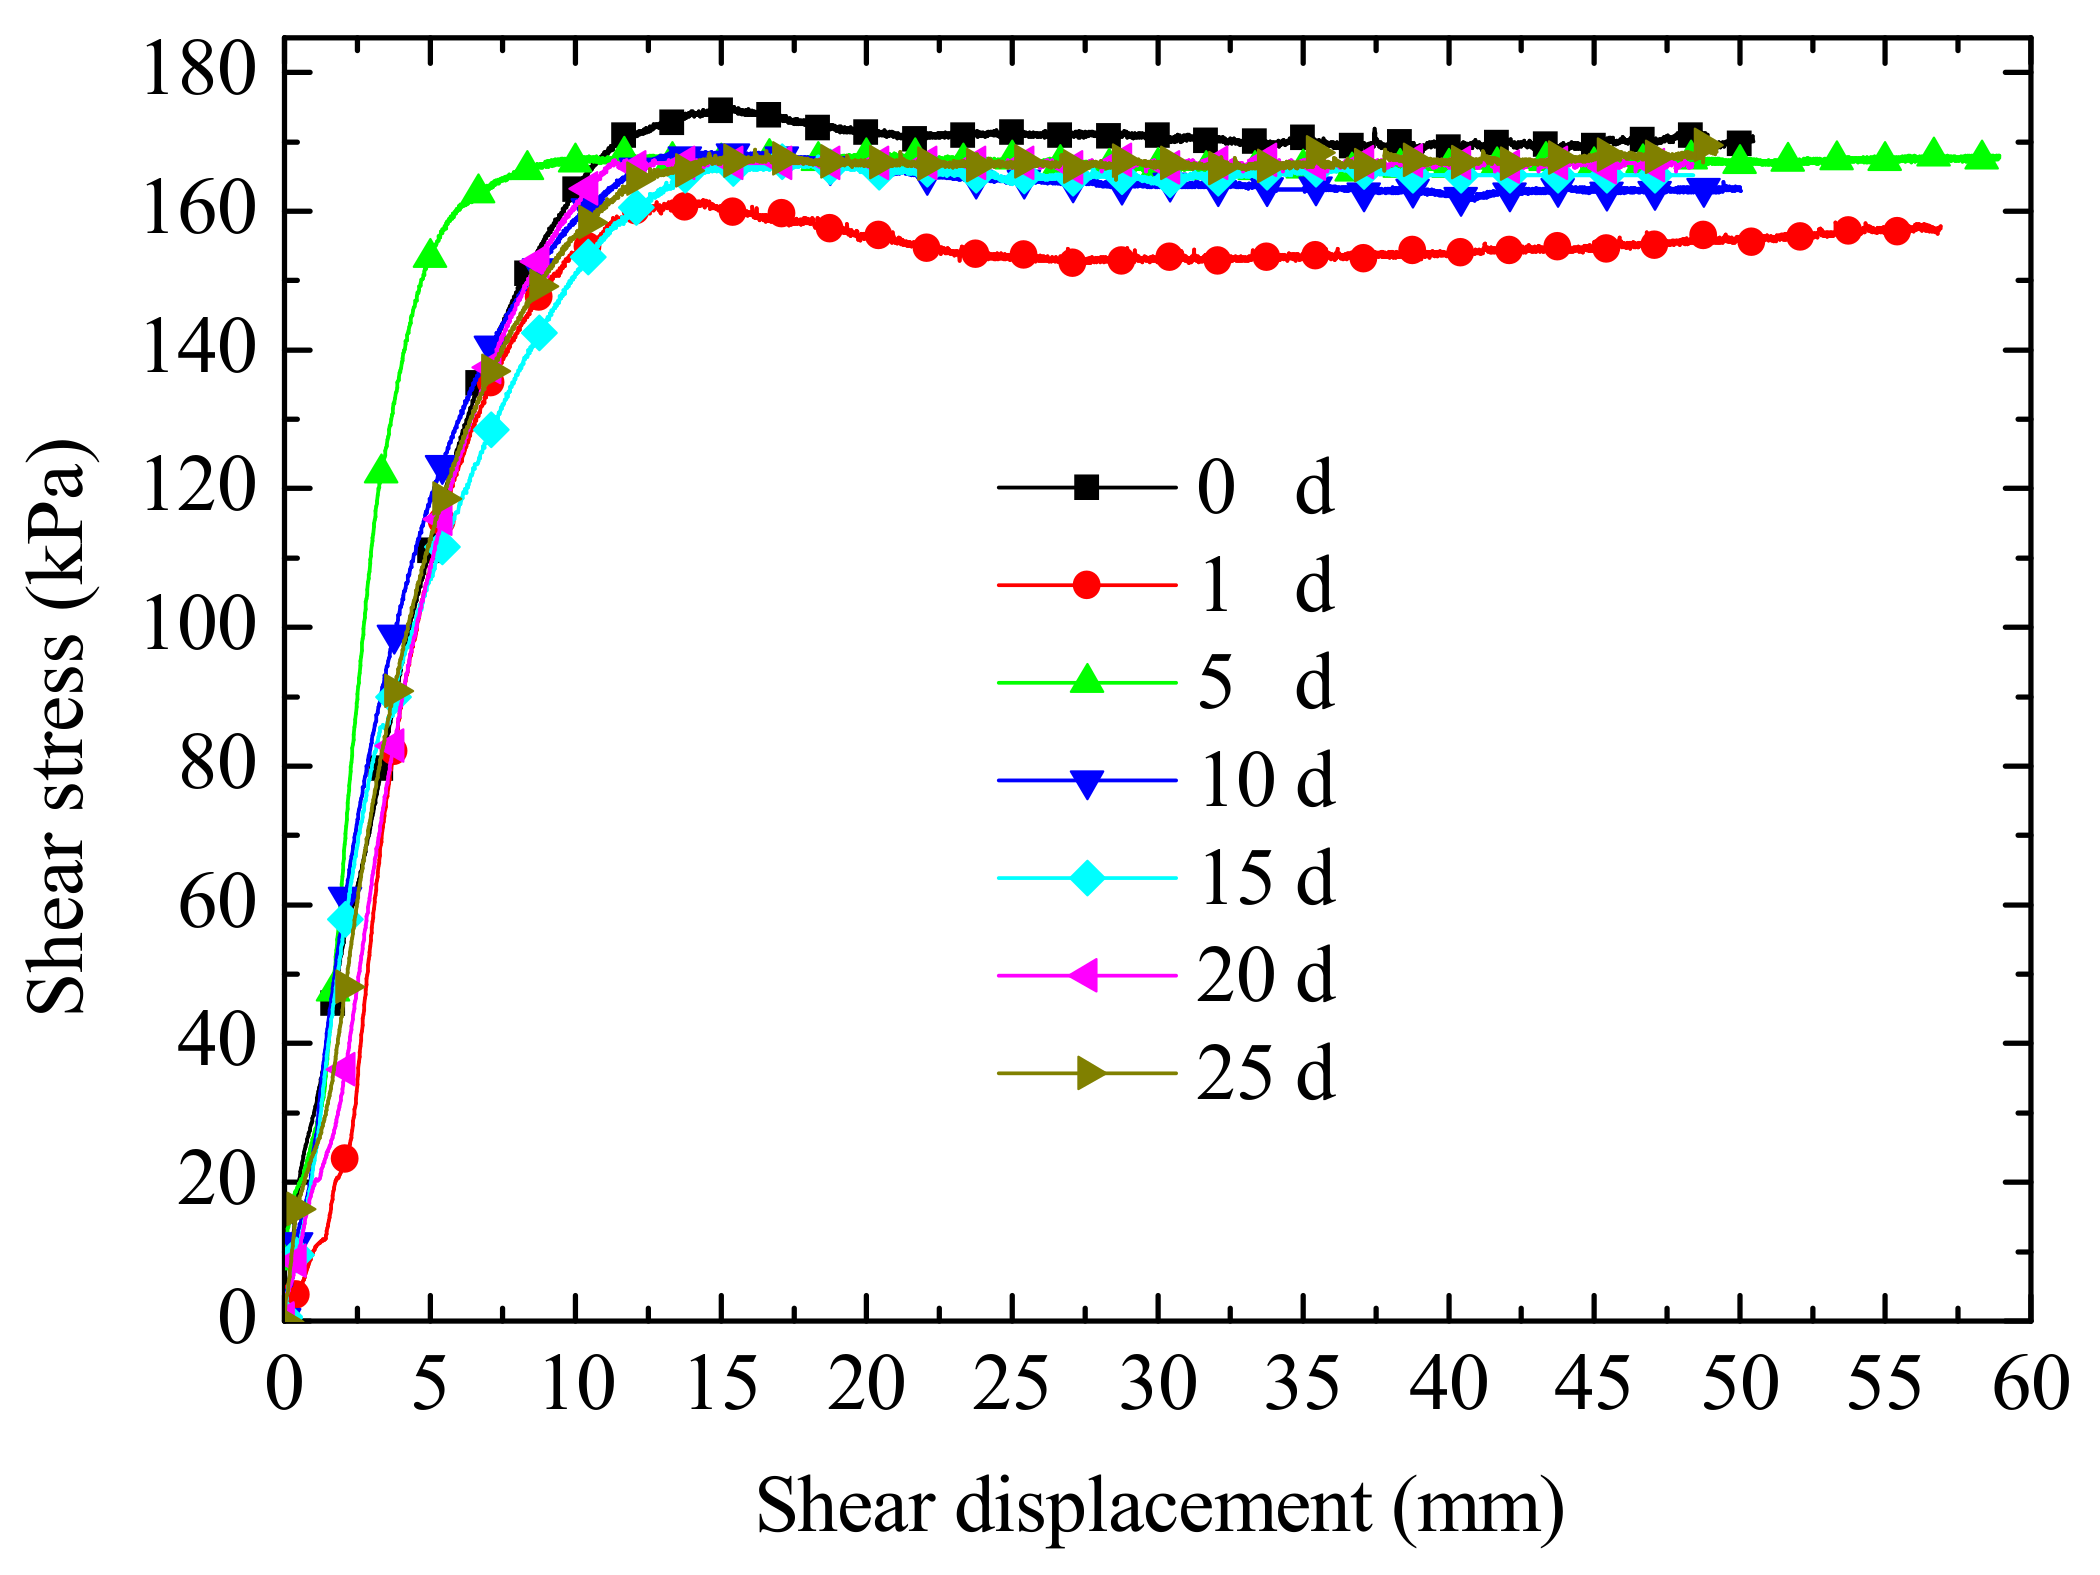
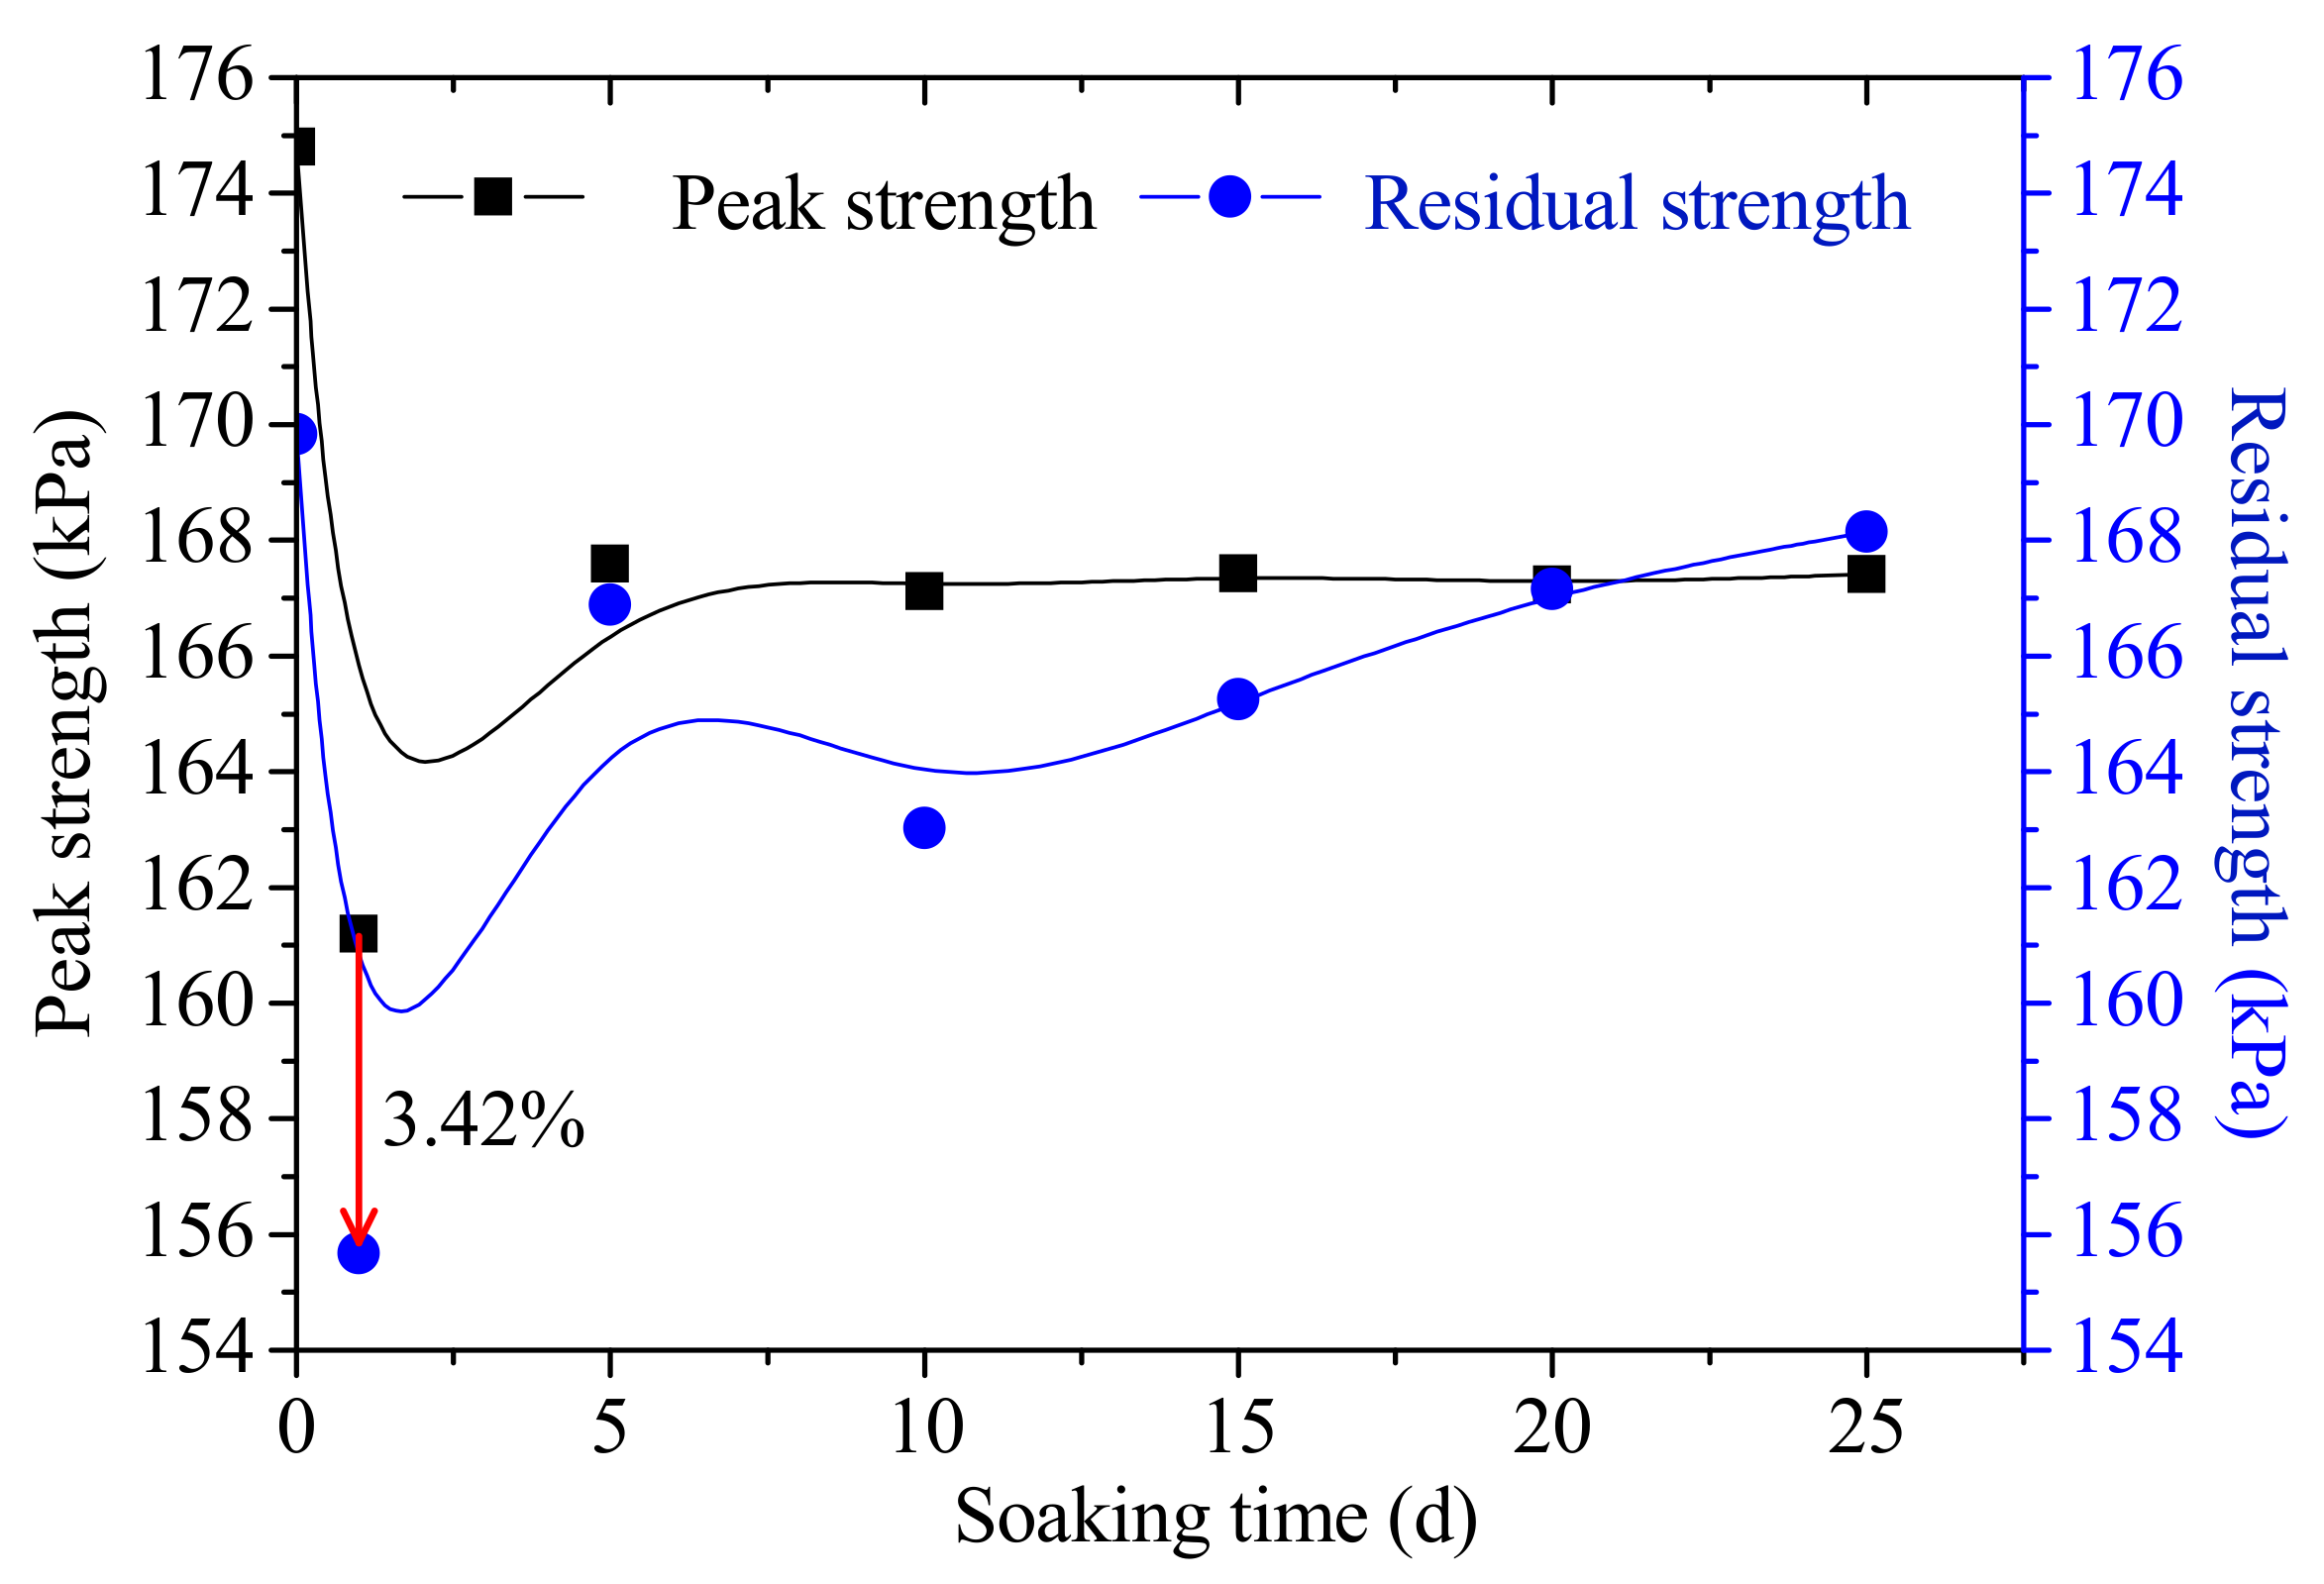
3.1. Effect of Soaking Time

Seven samples were prepared at the same initial dry density but soaked by different days, to examine the effect of soaking time on the shear behavior of loess. Test results are provided in Figure 4 and Figure 5.
Figure 4 presents the shear resistance against the shear displacement for the test under the normal stress of 200 kPa. To clarify the influence of soaking time on the shear behavior of loess, the relationship between the peak strength, residual strength with soaking time was plotted in Figure 5. It can be found that: the shear behavior of loess is strongly dependent of the soaking time. At a given shear displacement, the corresponding shear resistance became smaller with increasing soaking time from 0 to 1 day (Figure 4). It can be clearly found that both the peak strength and residual strength decreases rapidly, decreasing from 174.80 to 161.19 kPa (with about 7.78% reduction in strength) (Table 2 and Figure 5). However, with further increase of soaking time (from 1 to 5 d), the shear resistance became greater. In addition, the peak and the residual strength showed the same relations with the variation in soaking time. The peak and steady-state strength increased with increasing soaking time from 1 to 5 d. For example, the residual strength value increased from 155.67 kPa at the soaking time of 1 d to 166.89 kPa at the soaking time of 5 d, increasing by 7.21% (Table 2 and Figure 5). After that, the peak shear strength and residual shear strength of the loess samples fluctuated in a small range, indicating that a further increase of soaking time has little effect on the shear behavior of loess. Interestingly, the difference between the peak strength and residual strength reaches the maximum value at the soaking time of 1 d (Figure 5).

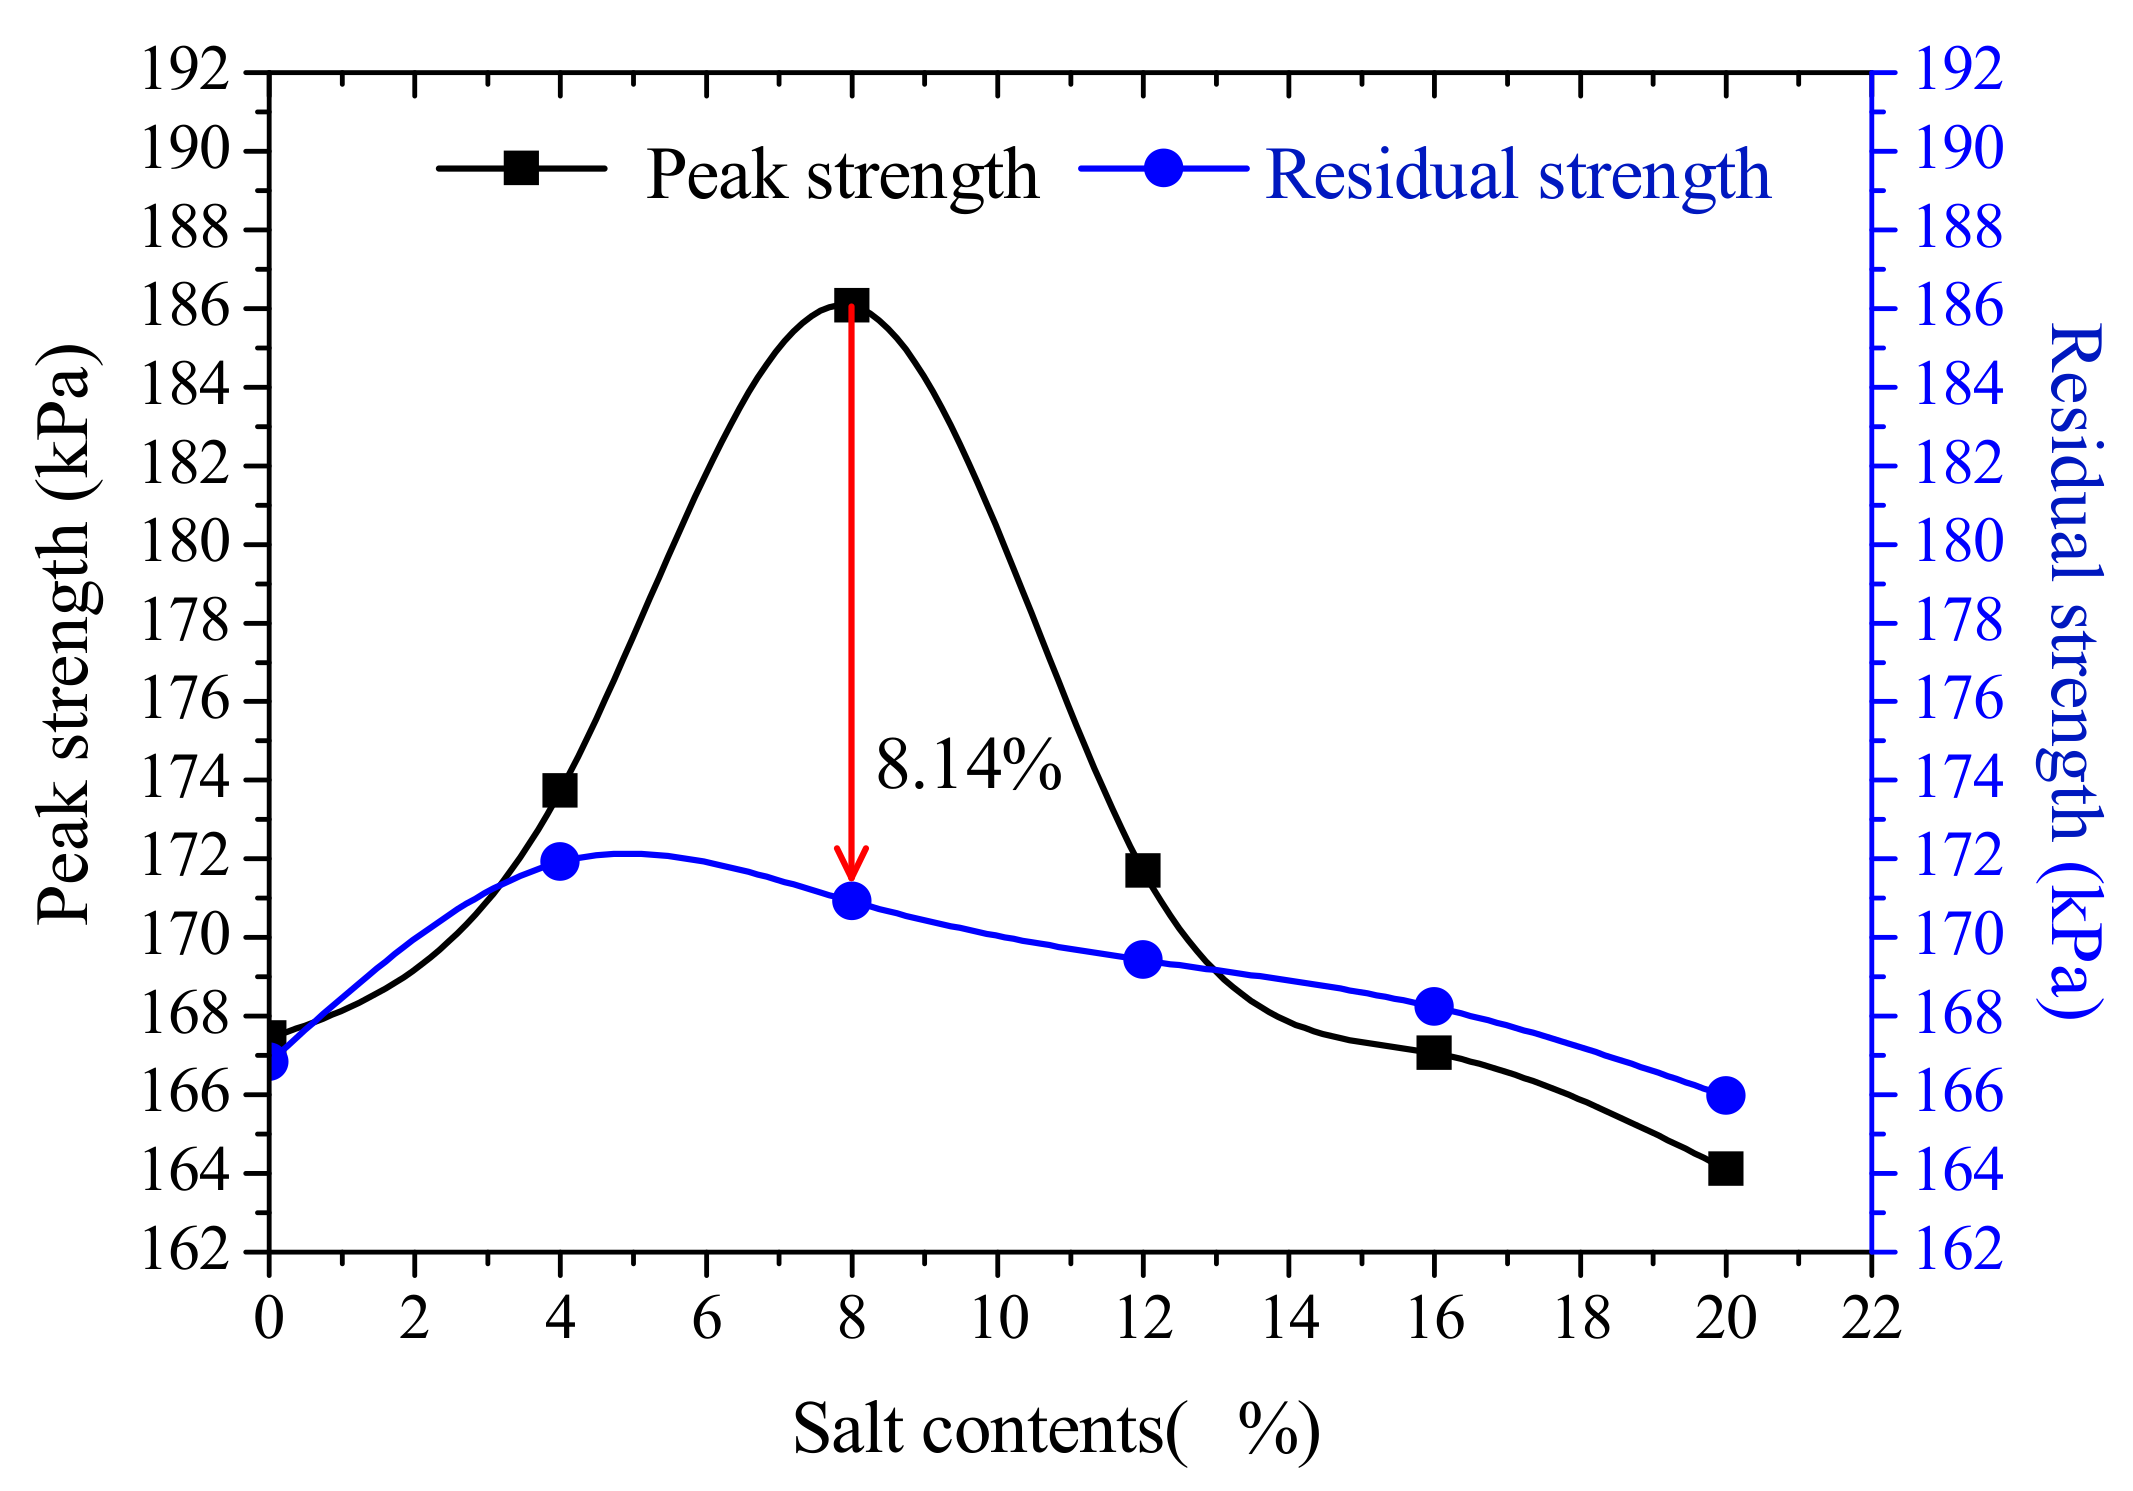
3.2. Effect of NaCl Concentration

Six samples were prepared with different NaCl concentration (0%, 4%, 8%, 12%, 16%, and 20%) to examine the effect of NaCl concentration on the shear behavior of loess soils. The variation of shear resistance is plotted in Figure 6, with respect to shear displacement. It can be found that at a specific shear displacement, the corresponding shear resistance became greater with increasing of NaCl concentration in the range of 0% to 8%. However, with further increase of NaCl concentration (from 8% to 20%), the shear resistance became smaller compared with that of loess samples with NaCl concentration of 0%. To exemplify the shear behavior observed in Figure 6, the corresponding variation of the peak strength, residual strength, with NaCl concentration was presented in Figure 7. It is found that the peak strength of loess samples reached the maximum value (186.07 kPa) with NaCl concentration of 8%, increasing about 11.12% compared with that of samples with NaCl concentration of 0%. Interestingly, the maximum difference value between the peak strength and residual strength is observed at the NaCl concentration of 8% (Figure 7).

4. Changes of Surface Morphology and Microstructure of Loess Soils with Different Salt Contents

4.1. Changes of Surface Morphology

The surface morphology of soil samples with different NaCl concentration was presented in Figure 8. It is found that the surface morphology of shear plane was relatively smooth (Figure 8a) for the loess samples with low NaCl concentration, whereas the surface morphology of shear plane became unsmooth with the relatively high NaCl concentration (Figure 8b,c). In particular, small dislocations were observed by the close-up images in Figure 8d–f. This phenomenon may be attributed to the variation in cementation between soil particles and pore structure with increasing of NaCl concentration.

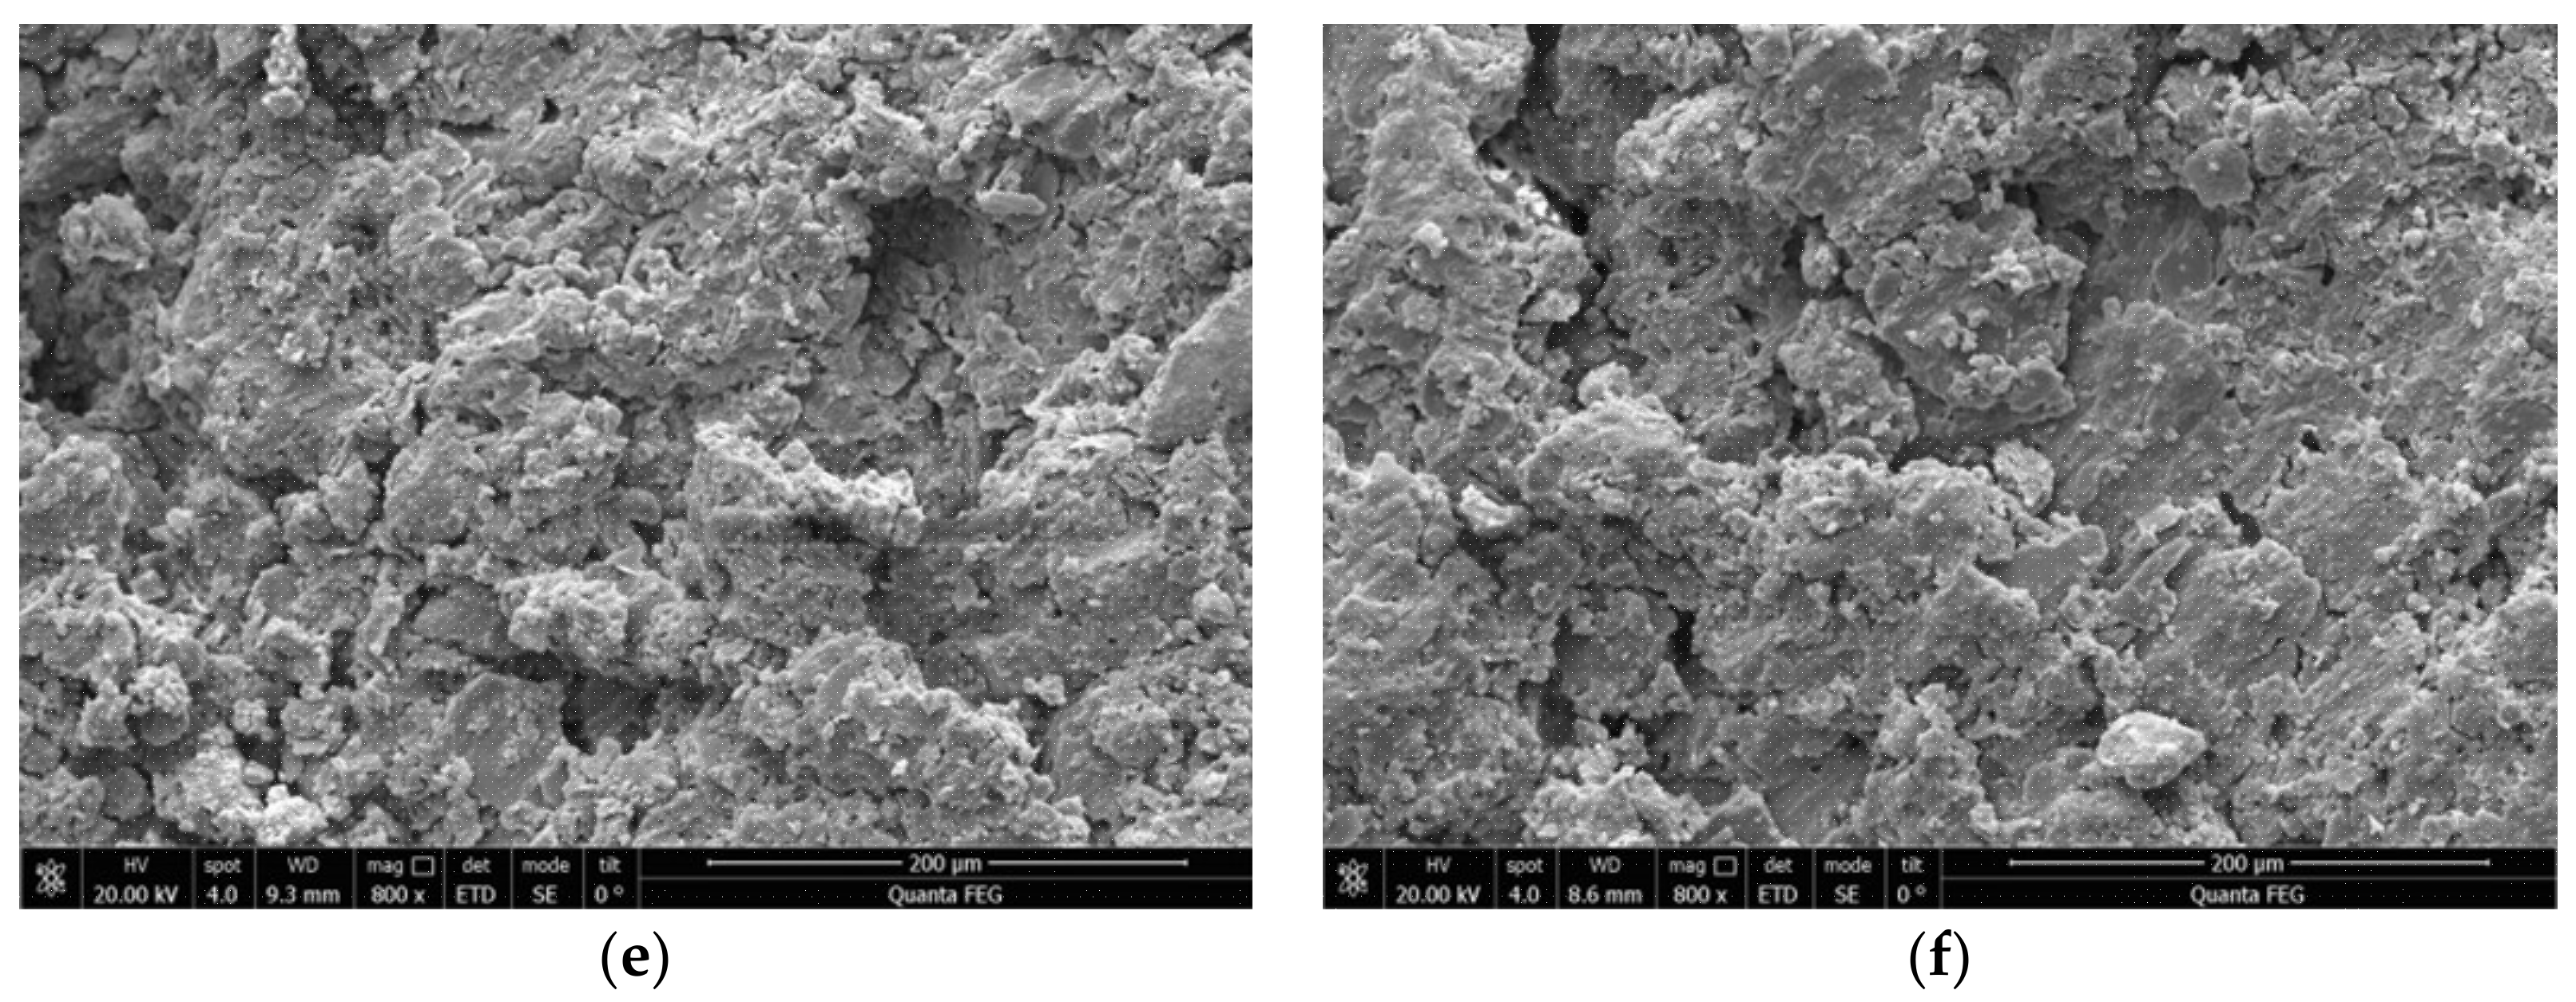
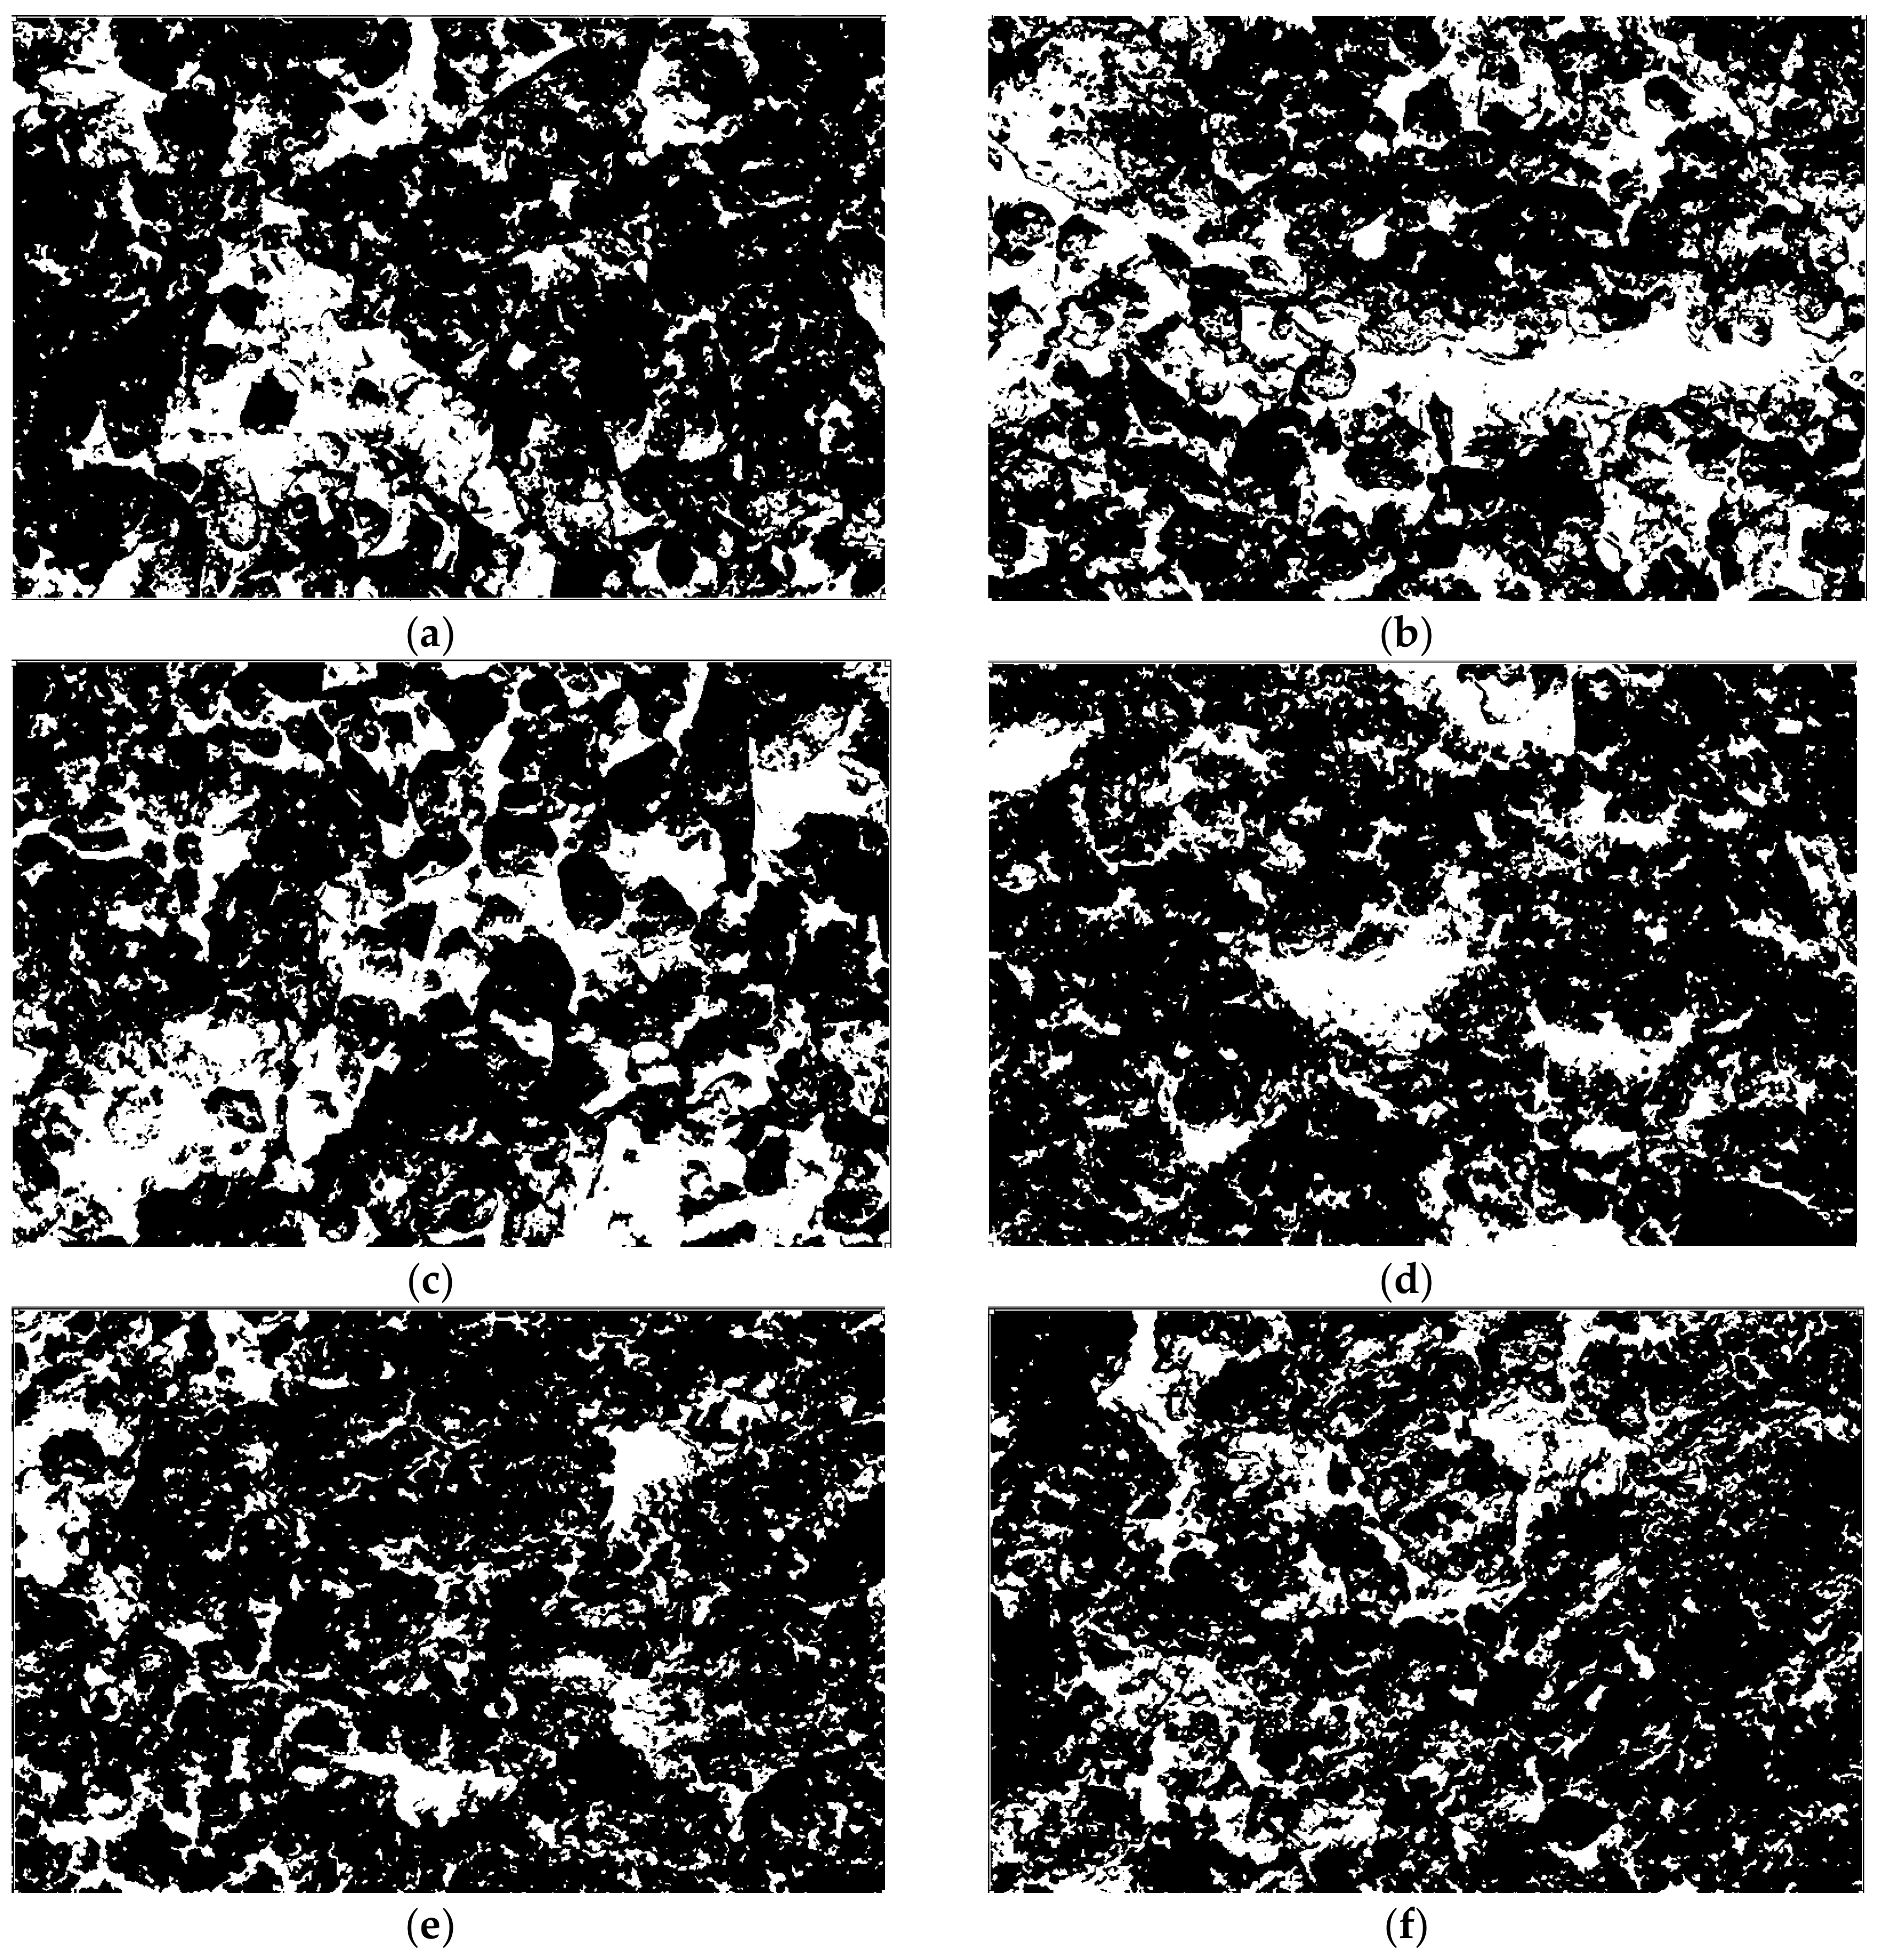
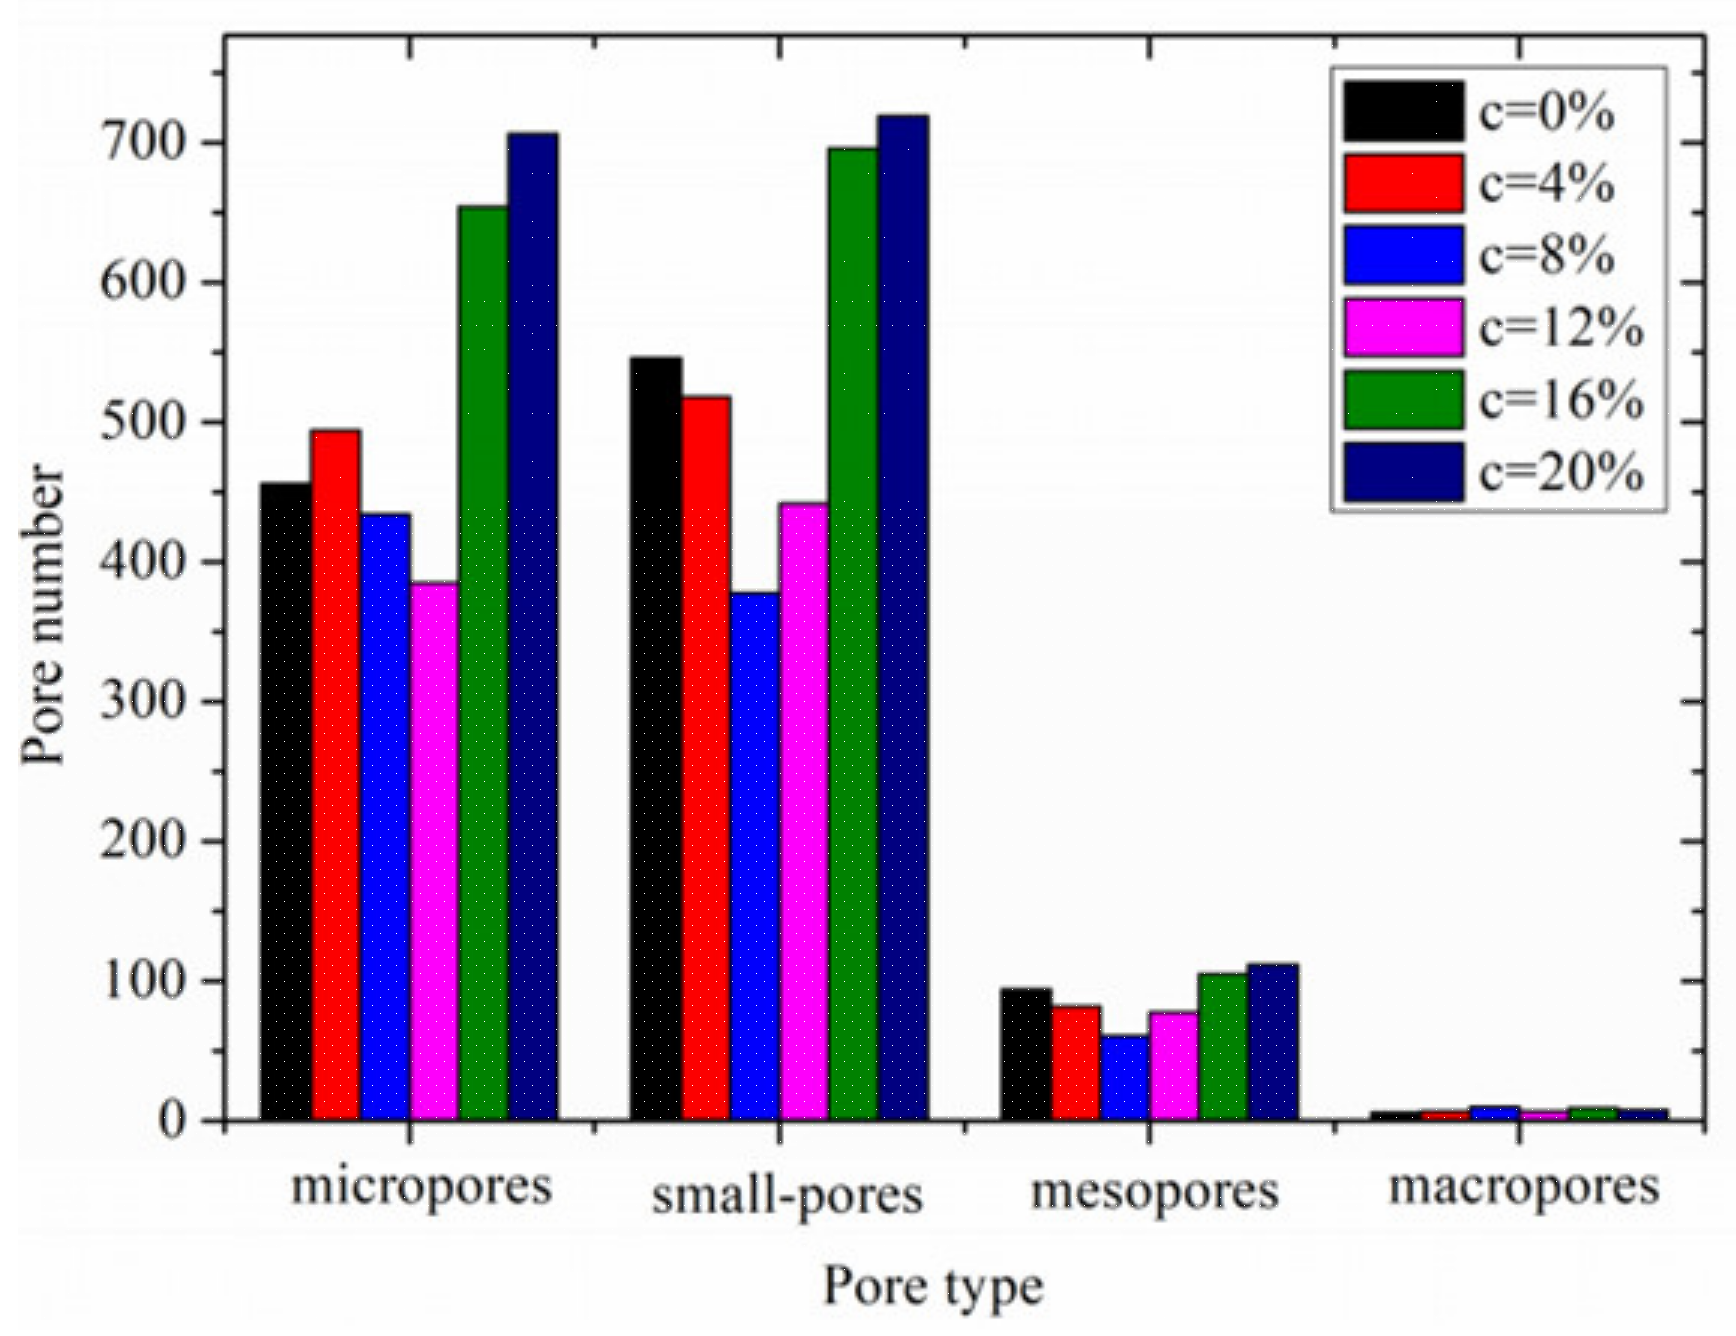
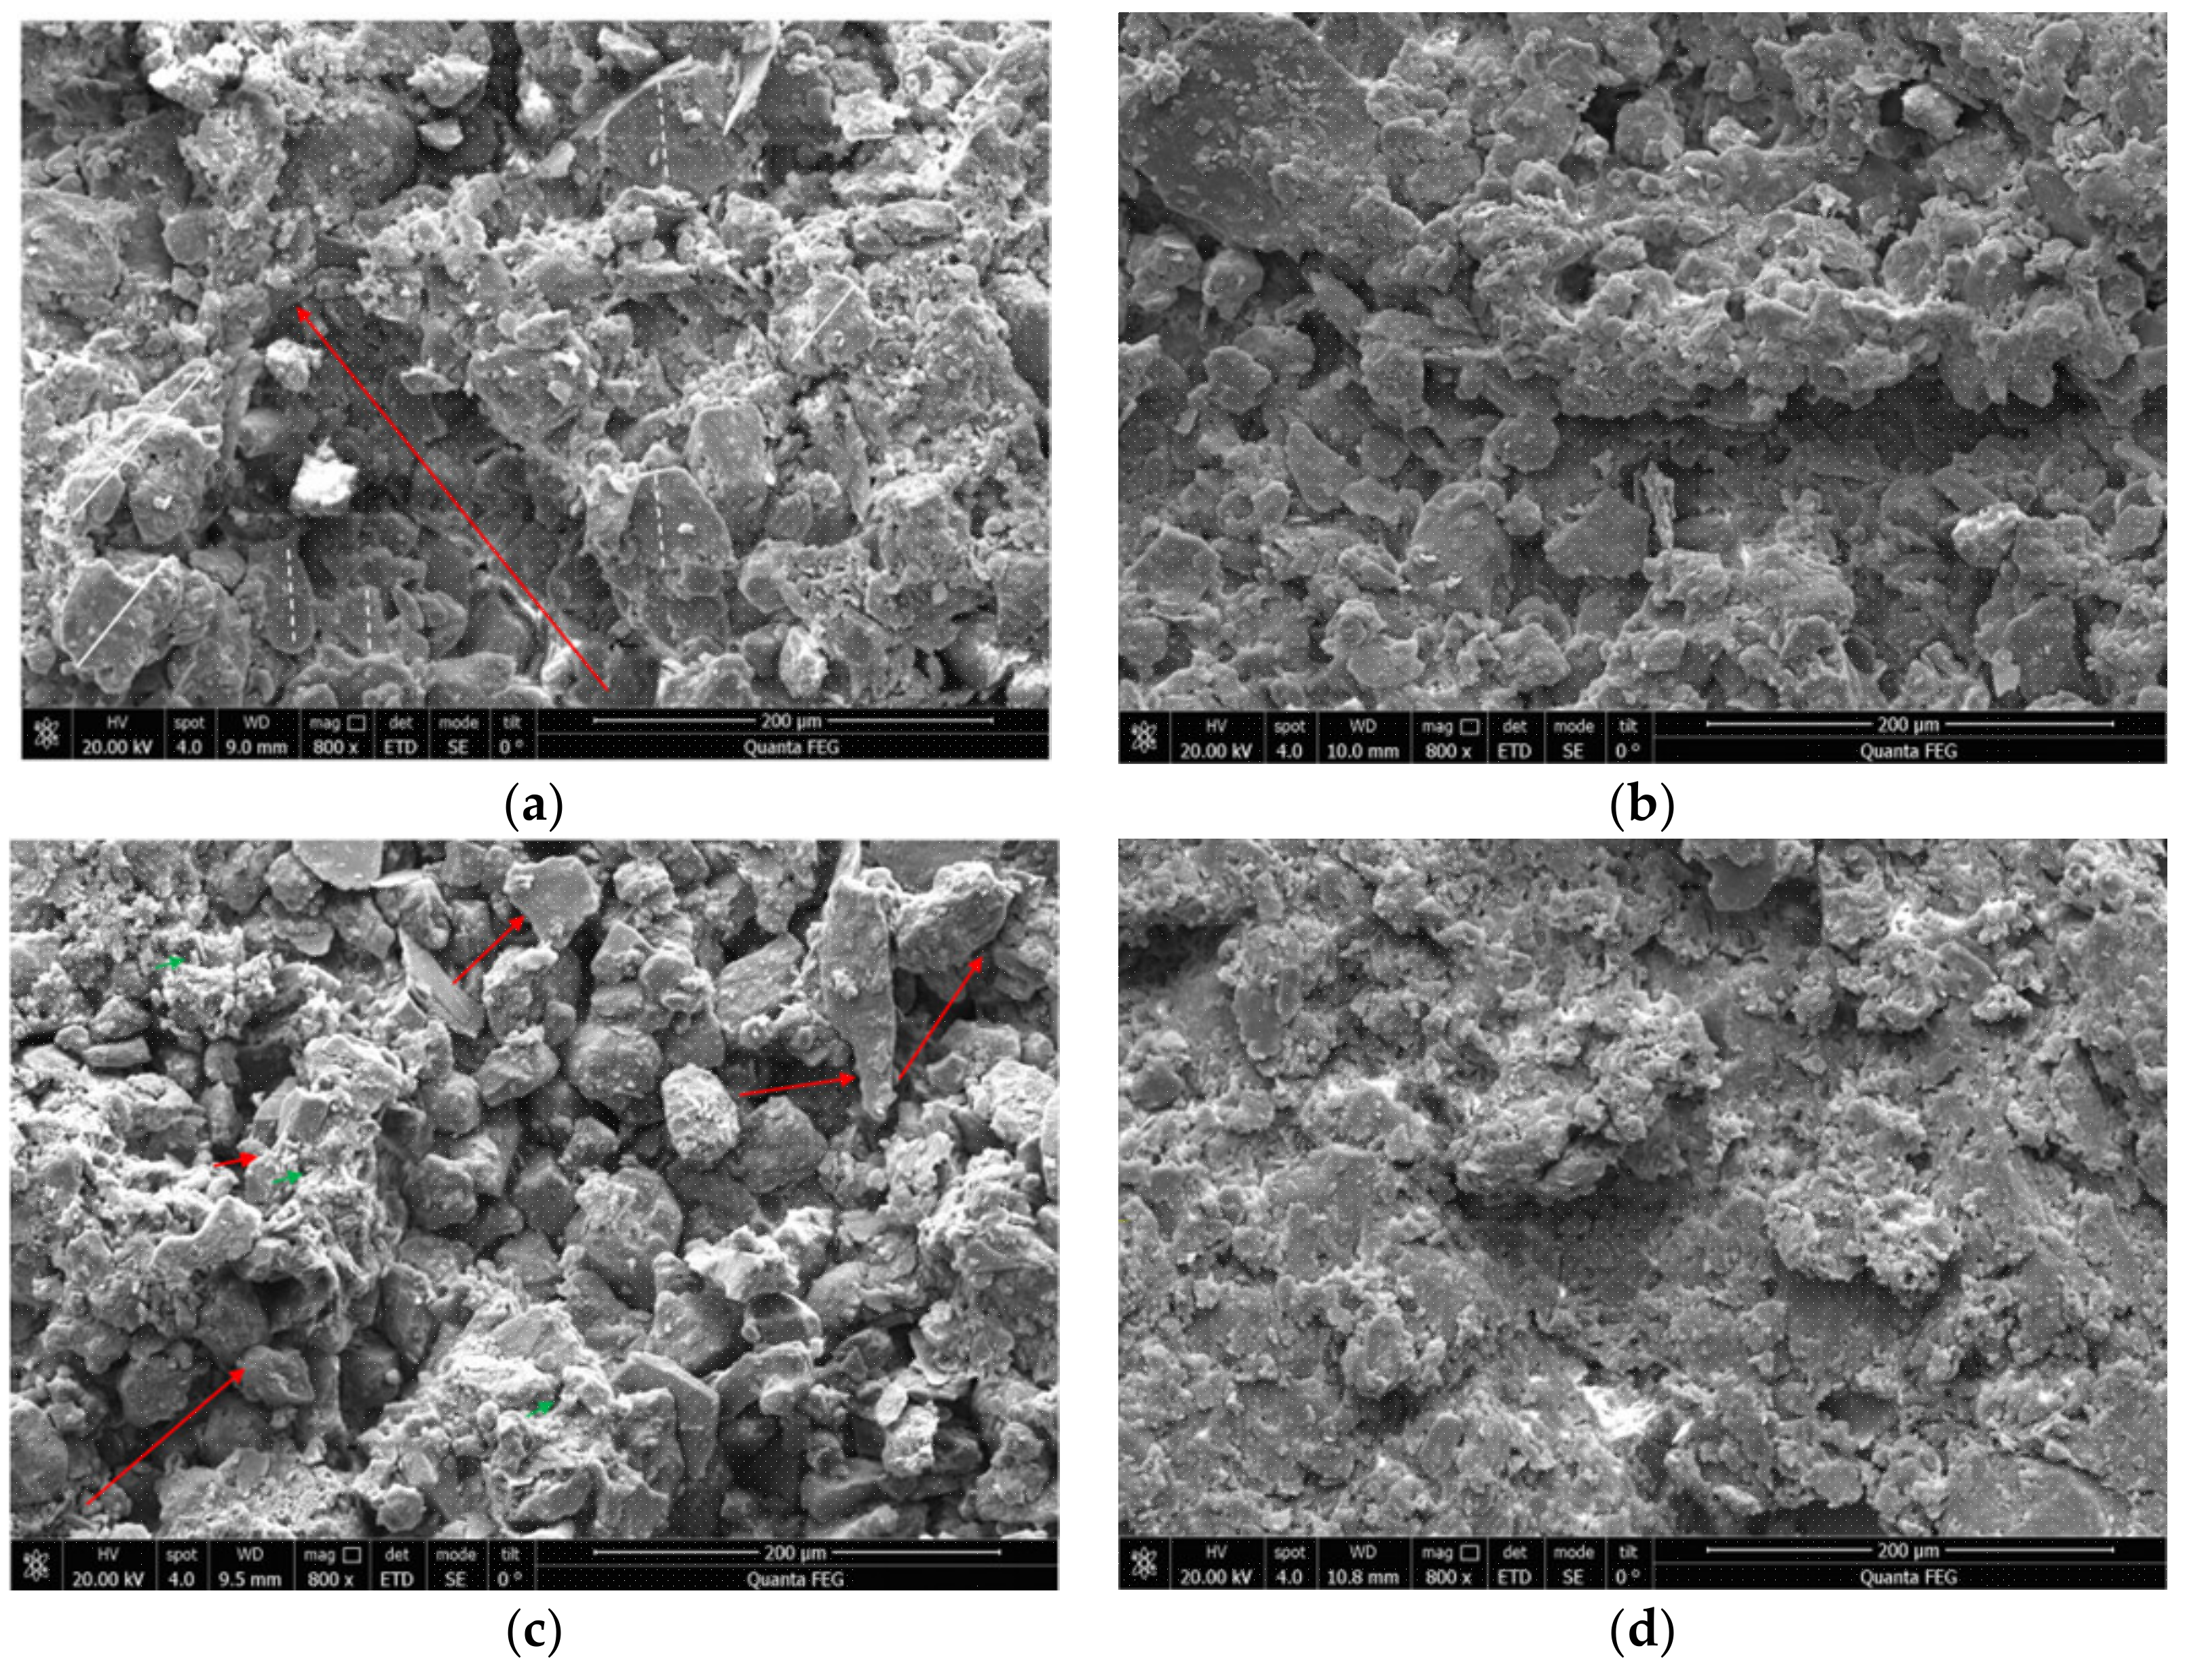
4.2. Changes of Microstructure of Loess Soils

To further analyze the effect of NaCl concentration on the microstructure of loess soils, shear planes that were shown in Figure 8 were processed by using SEM tests, and the corresponding results were shown in Figure 9.
It has been widely recognized that the development and pore size distribution of soils can be effectively investigated by using image processing techniques to quantitatively analyze SEM images of pores and particles [32,33,34]. The microstructure of loess soils has been explored by many researchers by adopting the methods mentioned above [34,35,36,37]. The microstructure of loess samples treated with salt solution are analyzed in this section for better interpretation of the mechanical response of soil. Prior to the microstructural analysis, a Quanta 400 field emission environmental SEM was used to examine the shear planes of loess samples. Samples with different NaCl concentration (0%, 4%, 8%, 12%, 16%, and 20%) were all examined under a magnification of 800 times to obtain the microscope data under the same conditions in SEM examination. Furthermore, Image-Pro Plus (IPP) 2D Image Analysis software was adopted to analyze the SEM images to obtain the quantitative microstructural information. In this study, structural parameters that are commonly used to describe pore size and pore number were selected to quantify microstructure. This focus is directed on the parameters including pore diameter, number of pores, pore area. In accordance with the classification of loess pores proposed by Lei [38], the pores in loess were divided into four types, namely: macropores, mesopores, small pores, and micropores. A pore with a radius smaller than 1 μm is classified as a micropore, 1–4 μm is a small pore, 4–16 μm is a mesopore, and larger than 16 μm is a macropore.
Figure 9 and Figure 10 present the overall image and the binarized view of the loess microstructure with different NaCl concentration, respectively. It can be found that the loess skeleton particles are dominated by silt particles (see the broken lines in Figure 9a) and aggregates (see the solid lines in Figure 9a) that are wrapped by clay membranes. Some silts are clean, while some silts are attached with clay aggregates with varying size (see the solid lines in Figure 9). Clearly, some pores are distributed among clean silts or aggregates (see the solid red lines with arrow in Figure 9c), whereas some other pores are distributed within aggregates (see the solid green lines with arrow in Figure 9c). It can be observed that pores within aggregates are relatively small (mainly compose of micropores and small-pores) (see Figure 9 and Figure 10), while pores among aggregates and clean silts are dominated by macropores (see Figure 9 and Figure 10).
The micrographs were analyzed with the IPP software to obtain statistical data. Figure 11 shows that micropores and small-pores dominate the pore type of loess samples treated with different NaCl concentration. Generally, in each loess sample, the number of pores decreased dramatically when the pore diameter exceeds about 8 μm. It can be seen from Figure 11 that, for micropores and small-pores in loess samples, the number of pores decreases with increasing salt concentration up to a salt concentration of 8%, but it increases rapidly between salt concentration of 8% and 20% (Figure 11). Interestingly, the peak strength and the residual strength of loess samples reached its maximum value with the salt concentration of 8%.

5. Discussion

5.1. The Peak Shear Strength and Residual Strength

The shear strength is an important input for analyzing the stability of a slope [39,40]. It has been found that the peak strength of a soil is closely related to the density and the initial stress state of a soil [41]; while the residual strength of a soil is typically associated with clay contents, Atterberg limits, its density, and the type of a soil [42,43], and is independent of its initial stress state [44]. As the ring shear tests in the current study were conducted under the almost the same density and initial stress state, the changes of the peak strength and residual strength of the loess soils are mainly attributed to the variation in the soaking time and NaCl concentration (Figure 4 and Figure 6).
The aforementioned results have shown that the peak strength and the residual strength decreases as the soaking time increases only up to a certain level (smaller than 2 d). When this level is exceed, any further increase of soaking time results in higher shear strengths (see Figure 4 and Figure 5). However, Fan et al. [17] claimed that the shear strength of loess remained almost constant or decreased slightly with increase of soaking time in a range of between 1–3 d. The difference in the tendency of shear strength of loess soils may result from the difference in their soaking time used. The variation in the shear strength of loess soils may result from the dilution or removal of the NaCl with the distilled water.
It has been shown that the NaCl concentration can have a fundamental influence on the shear behavior of loess soils [19,22,25]. Fan et al., [17] has reported that the shear strength of saturated loess soils increases as the NaCl concentration increases, while some other researchers have concluded that the increase of NaCl concentration leads to the reduction in shear strength of saturated loess soils [22,45]. However, we found that both the peak strength and residual strength increase as the NaCl concentration increases up to a specific value (See Figure 6 and Figure 7). To be more specific, the peak strength reached its peak at the NaCl concentration of around 8%, and showed a decrease with further increase of NaCl concentration. Similarly, the peak value of the residual strength was obtained at the low NaCl concentration (about 4%). After that, further increase of NaCl concentration results in lower shear strength (Figure 7). The experimental results herein are consistent with the observations from the similar ring shear tests reported in other studies [19]. The variation in the shear strength of loess soils with the NaCl concentration can be explained as follows: When the NaCl concentration increases from 0% to 8%, the NaCl concentration in pore fluid increases as well due to the diffusion of the salt into the loess particles especially the clay particles serving as the dominant cementation. Consequently, the thickness of the double layer of clay particles decrease, resulting in the increase of Van der Waals’s attractive forces among clay particles. Thus, the cementation force between the soil particles increases [38]. Furthermore, this process also leads to the formation of some small sized aggregates with relatively small pores (see Figure 9a–c). Thus, the peak and the residual strength of loess increases with the NaCl concentration below 8%. With further increase in NaCl concentration (from 8% to 20%), the thickness of the double layer of clay particles would keep constant after reaching a certain value, which in turn leads to a constant cemented force among clays. However, the increase in NaCl concentration also leads to the aggregation of much more bigger aggregates (see Figure 9d–f), which results in the formation of more proportion of micropores and small pores in the aggregates and mesopores among the aggregates (Figure 9), and then decreasing the shear behavior of loess samples (see Figure 7).

5.2. Implications for Loess Landslides

The experimental results from the ring shear test performed on loess specimens indicate that the variation in the soaking time and the NaCl concentration was responsible for observed strength changes (Figure 4, Figure 5, Figure 6 and Figure 7). Therefore, it is reasonable to infer that the occurrence and movement of loess landslides is closely related to the variation in the NaCl concentration induced by irrigation. In the Heifangtai area where the long-term irrigation activities are prevalent to promote the agriculture output [28], the ground water level increases and the NaCl concentration decreases as well due to the irrigation. Consequently, both the peak strength and residual strength of loess soils decreases in a long period compared with original shear strength of loess soils (Figure 4 and Figure 5). Therefore, the variation in the NaCl concentration during the irrigation process may result in the occurrence of loess landslides. The fact that landslides occurs mostly in March and November when the irrigation amount is the greatest [46,47], further supported the conclusion that the frequent occurrence of loess landslides in Heifangtai terrace is closely associated with the variation in NaCl concentration induced by irrigation.

6. Conclusions

A series of ring shear tests were conducted on loess specimen treated with different soaking time and salt concentration to investigate the shear behavior of loess soils. The following conclusions can be derived based on the experimental results and foregoing discussion:
(1)
The shear behavior of loess soils is closely related to the soaking time, and the peak strength and residual strength decreases as the soaking time increases only up to a certain value. When this level is exceeded, any further increase of soaking time results in higher shear strengths.
(2)
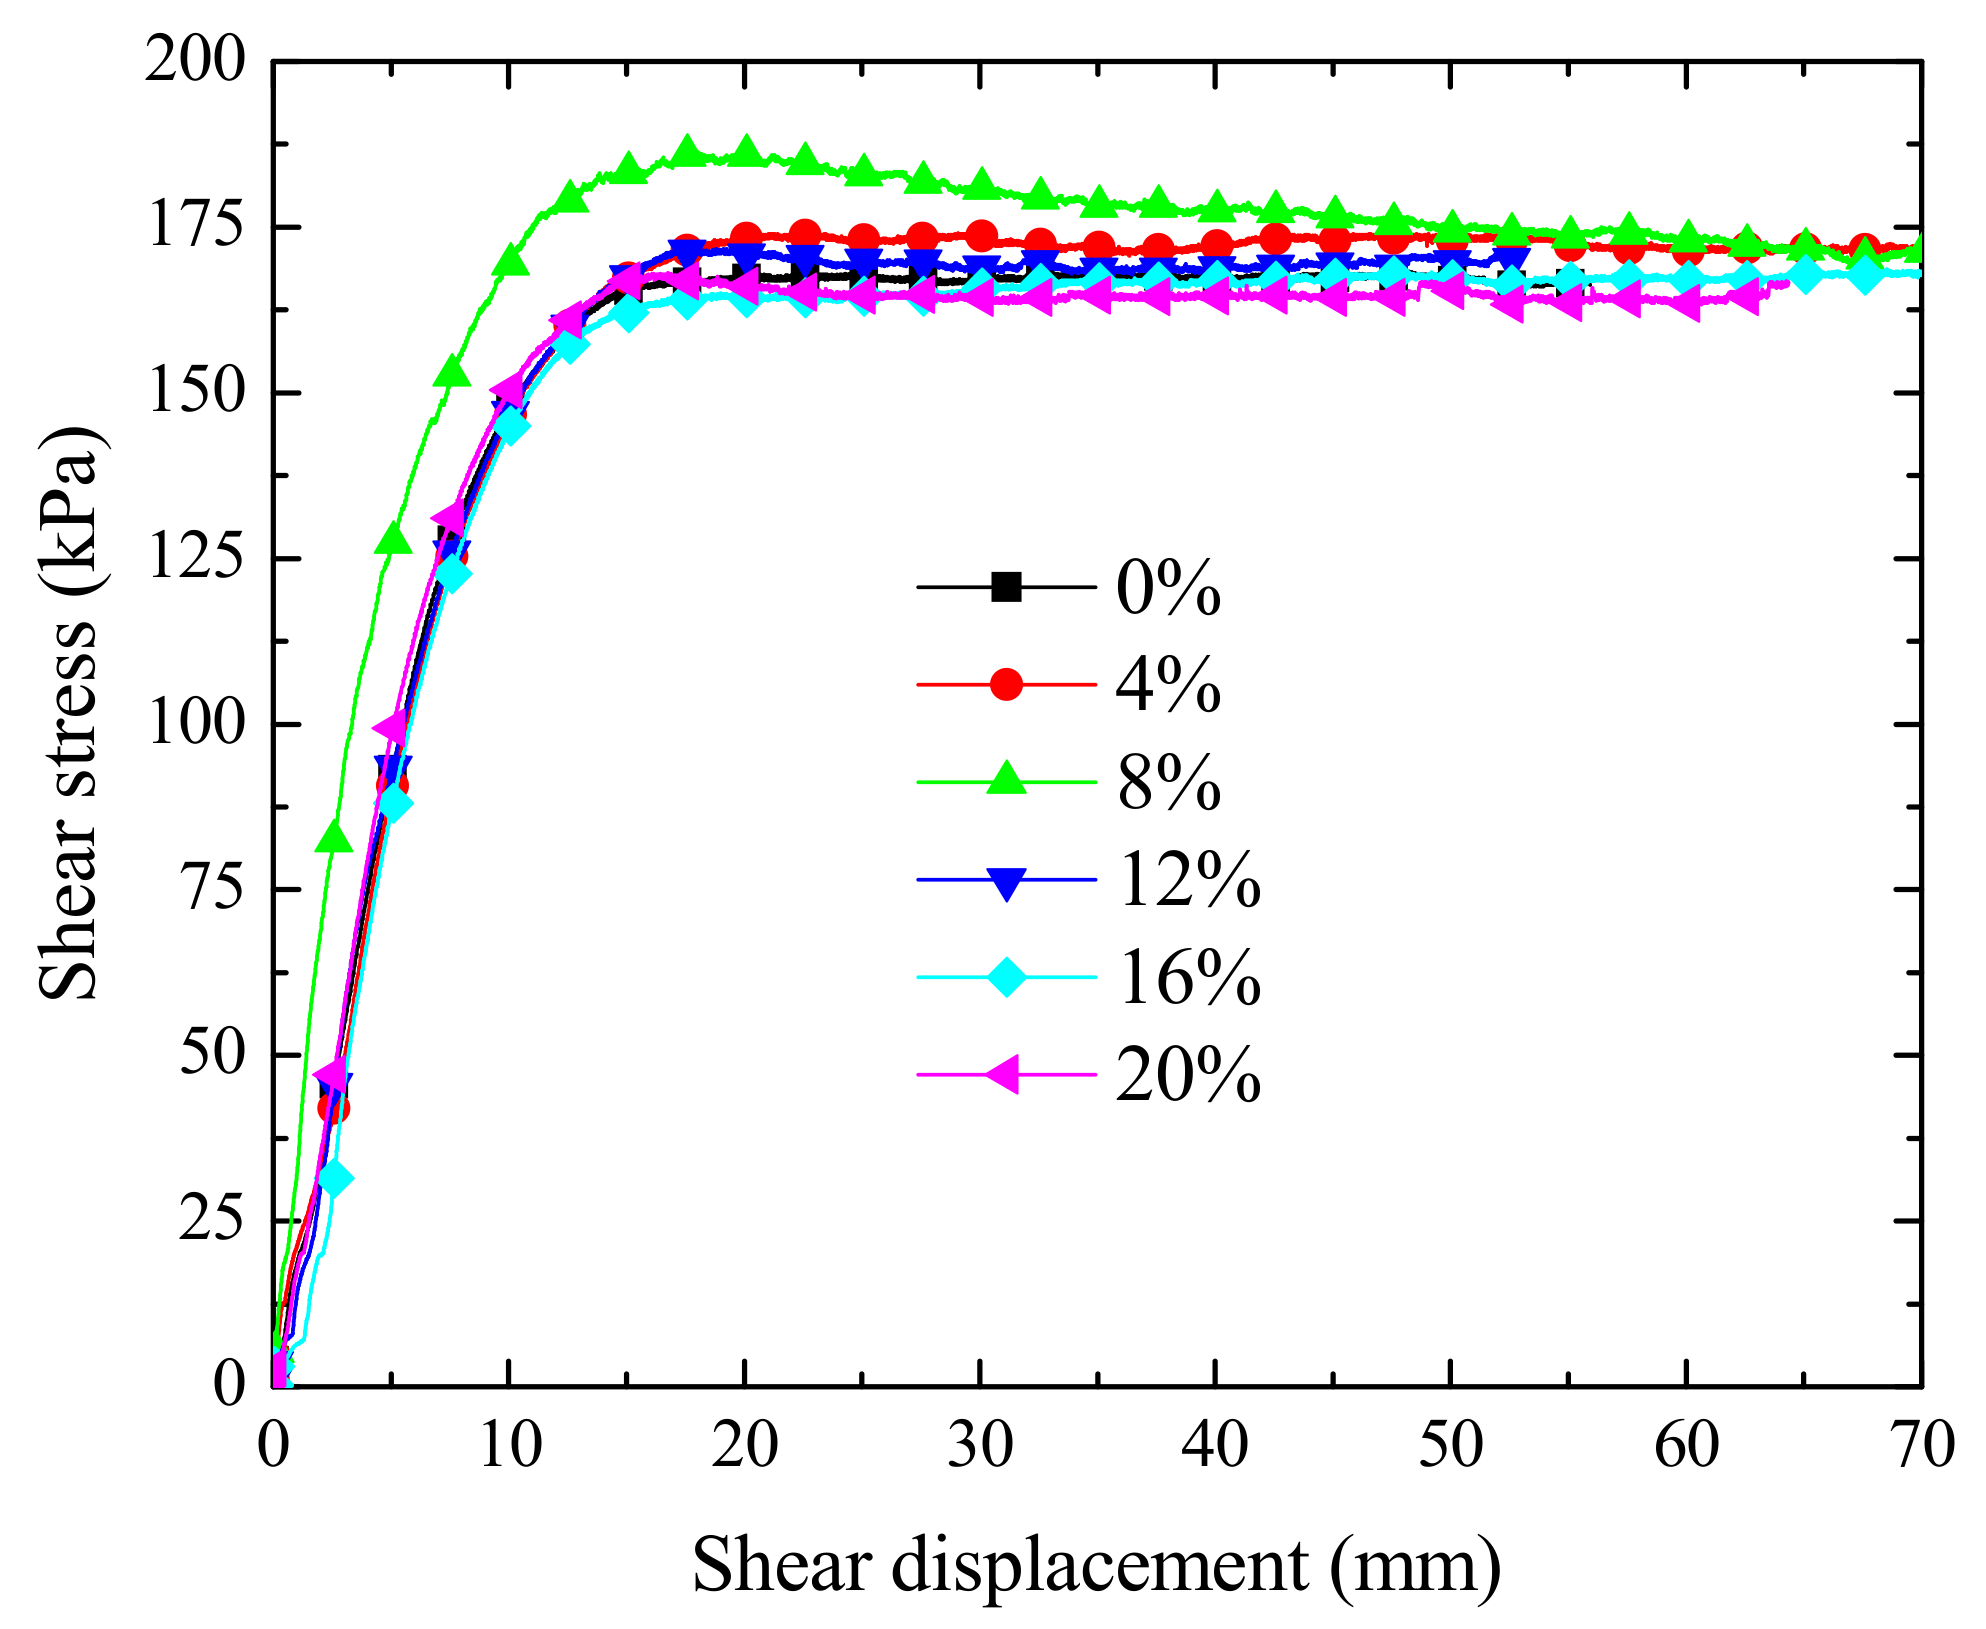
The peak strength and residual strength increased with increasing salt concentration before reaching a maximum value at the salt concentration of 8%. Above this concentration, the peak strength and residual strength decrease with further increase in the salt concentration, and both strengths decreases to a relatively small value after about salt concentration of 16%.
(3)
The maximum difference between the peak strength and residual strength was attained with the salt concentration of 8% and soaking time of 1 d, which may be attributed to the variation in the solution salt and pore structure between the soil particles.
The microstructure analysis revealed that the increase in salt concentration (0% to 8%) facilities the formation of small aggregates within loess soils and hence, increases the shear strength. However, further increase in salt concentration (8% to 20%) helps the development of relatively large aggregates in loess samples, resulting in the reduction in shear strength.

Author Contributions

Conceptualization, C.X. and X.W.; methodology, X.W.; experimental design, C.X.; validation, X.W.; laboratory experiment, C.X. and K.L., data processing, C.X. and X.W.; writing—original draft preparation, C.X.; writing—review and editing, C.X., X.W., K.L.; project administration, X.W. All authors have read and agreed to the published version of the manuscript.

Funding

These research results are supported by the Natural Science Foundation of China (No. 41902268), and the Special funded projects of China Postdoctoral Foundation (No. 2019T120871).

Conflicts of Interest

The authors declare no conflict of interest.

References

  1. Derbyshire, E.; Dijkstra, T.A.; Smalley, I.J. Failure mechanisms in loess and the effects of moisture content changes on remoulded strength. Quat. Int. 1994, 24, 5–15. [Google Scholar] [CrossRef]
  2. Dijkstra, T.A.; Rogers, C.D.F.; Smalley, I.J.; Derbyshire, E.; Yong, J.L.; Xing, M.M. The loess of north-central China: Geotechnical properties and their relation to slope stability. Eng. Geol. 1994, 36, 153–171. [Google Scholar] [CrossRef]
  3. Muhs, D.R. The geochemistry of loess: Asian and North American deposits compared. J. Asian Earth Sci. 2018, 155, 81–115. [Google Scholar] [CrossRef] [Green Version]
  4. Lian, B.; Peng, J.; Zhan, H.; Huang, Q.; Wang, X.; Hu, S. Formation mechanism analysis of irrigation-induced retrogressive loess landslides. Catena 2020, 195, 104441. [Google Scholar] [CrossRef]
  5. Wang, X.; Wang, J.; Zhan, H.; Li, P.; Hu, S. Moisture content effect on the creep behavior of loess for the catastrophic Baqiao landslide. Catena 2019, 187, 104371. [Google Scholar] [CrossRef]
  6. Leng, Y.; Peng, J.; Wang, Q.; Meng, Z.; Huang, W. A fluidized landslide occurred in the Loess Plateau: A study on loess landslide in South Jingyang tableland. Eng. Geol. 2018, 236, 129–136. [Google Scholar] [CrossRef]
  7. Xu, L.; Coop, M.R.; Zhang, M.; Wang, G. The mechanics of a saturated silty loess and implications for landslides. Eng. Geol. 2018, 236, 29–42. [Google Scholar] [CrossRef]
  8. Zhang, D.; Wang, G.; Luo, C.; Chen, J.; Zhou, Y. A rapid loess flowslide triggered by irrigation in China. Landslides 2009, 6, 55–60. [Google Scholar] [CrossRef]
  9. Kimura, S.; Nakamura, S.; Vithana, S.B.; Sakai, K. Shearing rate effect on residual strength of landslide soils in the slow rate range. Landslides 2014, 11, 969–979. [Google Scholar] [CrossRef]
  10. Lian, B.; Peng, J.; Wang, X.; Huang, Q. Moisture content effect on the ring shear characteristics of slip zone loess at high shearing rates. Bull. Eng. Geol. Environ. 2020, 79, 999–1008. [Google Scholar] [CrossRef]
  11. Sassa, K.; Fukuoka, H.; Wang, G.; Ishikawa, N. Undrained dynamic-loading ring-shear apparatus and its application to landslide dynamics. Landslides 2004, 1, 7–19. [Google Scholar] [CrossRef]
  12. Conte, E.; Pugliese, L.; Troncone, A. Post-failure stage simulation of a landslide using the material point method. Eng. Geol. 2019, 253, 149–159. [Google Scholar] [CrossRef]
  13. Conte, E.; Pugliese, L.; Troncone, A. Post-failure analysis of the Maierato landslide using the material point method-ScienceDirect. Eng. Geol. 2020, 277, 105788. [Google Scholar] [CrossRef]
  14. Wen, B.P.; He, L. Influence of lixiviation by irrigation water on residual shear strength of weathered red mudstone in Northwest China: Implication for its role in landslides’ reactivation. Eng. Geol. 2012, 151, 56–63. [Google Scholar] [CrossRef]
  15. Xu, L.; Dai, F.; Gong, Q.; Tham, L.; Min, H. Irrigation-induced loess flow failure in Heifangtai Platform, north-west China. Environ. Earth Sci. 2012, 66, 1707–1713. [Google Scholar] [CrossRef]
  16. Wu, L.; Zhou, Y.; Sun, P.; Shi, J.; Liu, G.; Bai, L. Laboratory characterization of rainfall-induced loess slope failure. Catena 2017, 150, 1–8. [Google Scholar] [CrossRef]
  17. Fan, X.; Xu, Q.; Scaringi, G.; Li, S.; Peng, D. A chemo-mechanical insight into the failure mechanism of frequently occurred landslides in the Loess Plateau, Gansu Province, China. Eng. Geol. 2017, 228, 337–345. [Google Scholar] [CrossRef]
  18. Fu, J.-T.; Hu, X.-S.; Li, X.-L.; Yu, D.-M.; Liu, Y.-B.; Yang, Y.-Q.; Zhao-xin, Q.; Li, S.-X. Influences of soil moisture and salt content on loess shear strength in the Xining Basin, northeastern Qinghai-Tibet Plateau. J. Mt. Sci. 2019, 16, 1184–1197. [Google Scholar] [CrossRef]
  19. Zhang, F.; Wang, G.; Kamai, T.; Chen, W.; Zhang, D.; Yang, J. Undrained shear behavior of loess saturated with different concentrations of sodium chloride solution. Eng. Geol. 2013, 155, 69–79. [Google Scholar] [CrossRef] [Green Version]
  20. Di Maio, C.; Scaringi, G. Shear displacements induced by decrease in pore solution concentration on a pre-existing slip surface. Eng. Geol. 2016, 200, 1–9. [Google Scholar] [CrossRef]
  21. Xu, J.; Li, Y.; Ren, C.; Lan, W. Damage of saline intact loess after dry-wet and its interpretation based on SEM and NMR. Soils Found. Tokyo 2020, 60, 911–928. [Google Scholar] [CrossRef]
  22. Xu, P.; Zhang, Q.; Qian, H. Effect of Sodium Chloride Concentration on Saturated Permeability of Remolded Loess. Minerals 2020, 10, 199. [Google Scholar] [CrossRef] [Green Version]
  23. Wen, B.P.; Yan, Y.J. Influence of structure on shear characteristics of the unsaturated loess in Lanzhou, China. Eng. Geol. 2014, 168, 46–58. [Google Scholar] [CrossRef]
  24. Zhang, F.; Wang, G. Effect of irrigation-induced densification on the post-failure behavior of loess flowslides occurring on the Heifangtai area, Gansu, China. Eng. Geol. 2018, 236, 111–118. [Google Scholar] [CrossRef]
  25. Bing, H.; Zhang, Y.; Ma, M. Impact of Desalination on Physical and Mechanical Properties of Lanzhou Loess. Eurasian Soil Sci. 2017, 50, 1444–1449. [Google Scholar] [CrossRef]
  26. Qi, X.; Xu, Q.; Li, B.; Peng, D.; Zhou, F. Preliminary study on mechanism of surface water infiltration at tHeifangtai loess landslides in Gansu. J. Eng. Geol. 2016, 24, 419–424. (In Chinese) [Google Scholar]
  27. Zeng, R.; Meng, X.; Zhang, F.; Wang, S.; Cui, Z.; Zhang, M.; Zhang, Y.; Chen, G. Characterizing hydrological processes on loess slopes using electrical resistivity tomography—A case study of the Heifangtai Terrace, Northwest China. J. Hydrol. 2016, 541, 742–753. [Google Scholar] [CrossRef]
  28. Qi, X.; Xu, Q.; Liu, F. Analysis of retrogressive loess flowslides in Heifangtai, China. Eng. Geol. 2018, 236, 119–128. [Google Scholar] [CrossRef]
  29. Li, S. Experimental Study of Influence on Strength of Loess Soaked in Water for Long-Term in Heifangtai, Gansu Province; Chengdu University of Technology: Chengdu, China, 2016. (In Chinese) [Google Scholar]
  30. Sassa, K.; Wang, G.; Fukuoka, H. Performing undrained shear tests on saturated sands in a new intelligent type of ring shear apparatus. Geotech. Test. J. 2003, 26, 257–265. [Google Scholar]
  31. Tiwari, B.; Marui, H. Objective oriented multistage ring shear test for shear strength of landslide soil. J. Geotech. Geoenvironmental Eng. 2004, 130, 217–222. [Google Scholar] [CrossRef]
  32. Li, H.-D.; Tang, C.-S.; Cheng, Q.; Li, S.-J.; Gong, X.-P.; Shi, B. Tensile strength of clayey soil and the strain analysis based on image processing techniques. Eng. Geol. 2019, 253, 137–148. [Google Scholar] [CrossRef]
  33. Moore, C.; Donaldson, C. Quantifying soil microstructure using fractals. Geotechnique 1995, 45, 105–116. [Google Scholar] [CrossRef]
  34. Tang, C.-S.; Lin, L.; Cheng, Q.; Zhu, C.; Wang, D.-W.; Lin, Z.-Y.; Shi, B. Quantification and characterizing of soil microstructure features by image processing technique. Comput. Geotech. 2020, 128, 103817. [Google Scholar] [CrossRef]
  35. Li, P.; Xie, W.; Pak, R.Y.; Vanapalli, S.K. Microstructural evolution of loess soils from the Loess Plateau of China. Catena 2019, 173, 276–288. [Google Scholar] [CrossRef]
  36. Wang, S.-L.; Lv, Q.-F.; Baaj, H.; Li, X.-Y.; Zhao, Y.-X. Volume change behaviour and microstructure of stabilized loess under cyclic freeze–thaw conditions. Can. J. Civ. Eng. 2016, 43, 865–874. [Google Scholar] [CrossRef] [Green Version]
  37. Xie, W.-L.; Li, P.; Zhang, M.-S.; Cheng, T.-E.; Wang, Y. Collapse behavior and microstructural evolution of loess soils from the Loess Plateau of China. J. Mt. Sci. 2018, 15, 1642–1657. [Google Scholar] [CrossRef]
  38. Lei, X. Pore type and collapsibility of loess in China. Sci. China (Ser. B) 1987, 17, 1309–1316. [Google Scholar]
  39. Nguyen, T.S.; Likitlersuang, S. Reliability analysis of unsaturated soil slope stability under infiltration considering hydraulic and shear strength parameters. Bull. Eng. Geol. Environ. 2019, 78, 5727–5743. [Google Scholar] [CrossRef]
  40. Qi, X.-H.; Li, D.-Q. Effect of spatial variability of shear strength parameters on critical slip surfaces of slopes. Eng. Geol. 2018, 239, 41–49. [Google Scholar] [CrossRef]
  41. Skempton, A. Long-term stability of clay slopes. Geotechnique 1964, 14, 77–102. [Google Scholar] [CrossRef] [Green Version]
  42. Wen, B.; Aydin, A.; Duzgoren-Aydin, N.; Li, Y.; Chen, H.; Xiao, S. Residual strength of slip zones of large landslides in the Three Gorges area, China. Eng. Geol. 2007, 93, 82–98. [Google Scholar] [CrossRef]
  43. Moore, R. The chemical and mineralogical controls upon the residual strength of pure and natural clays. Geotechnique 1991, 41, 35–47. [Google Scholar] [CrossRef]
  44. Wang, G.; Sassa, K.; Fukuoka, H.; Tada, T. Experimental study on the shearing behavior of saturated silty soils based on ring-shear tests. J. Geotech. Geoenviron. Eng. 2007, 133, 319–333. [Google Scholar] [CrossRef]
  45. Wang, J.; Liu, W.; Chen, W.; Liu, P.; Jia, B.; Xu, H.; Wen, L. Study on the mechanism of loess landslide induced by chlorine salt in Heifangtai terran. Jpn. Geotech. Soc. Spec. Publ. 2019, 7, 159–167. [Google Scholar] [CrossRef]
  46. Gu, T.-F.; Zhang, M.-S.; Wang, J.-D.; Wang, C.-X.; Xu, Y.-J.; Wang, X. The effect of irrigation on slope stability in the Heifangtai Platform, Gansu Province, China. Eng. Geol. 2019, 248, 346–356. [Google Scholar] [CrossRef]
  47. Cui, S.-H.; Pei, X.-J.; Wu, H.-Y.; Huang, R.-Q. Centrifuge model test of an irrigation-induced loess landslide in the Heifangtai loess platform, Northwest China. J. Mt. Sci. 2018, 15, 130–143. [Google Scholar] [CrossRef]
Figure 1. (a) Study site in Heifangtai terrace; (b) Sampling site of Dangchuan landslide; (c) Block sampling.
Water 12 03465 g001
Figure 2. Loess sample mixed with distilled water.
Water 12 03465 g002
Figure 3. Ring shear apparatus. (a) Shearing chamber; (b) Shear box.
Water 12 03465 g003
Figure 4. Stress-displacement curve of loess with different soaking time.
Water 12 03465 g004
Figure 5. Relationship between the peak strength, residual strength, and soaking time.
Water 12 03465 g005
Figure 6. Stress-displacement curve with different salt contents.
Water 12 03465 g006
Figure 7. Relationship between the peak strength, residual strength, and salt contents.
Water 12 03465 g007
Figure 8. Surface morphology of loess samples (Note: C = Concentration).
Water 12 03465 g008
Figure 9. SEM images of loess specimens with different NaCl concentration after tests (a) C = 0%; (b) C = 4%; (c) C = 8%; (d) C = 12%; (e) C = 16%; (f) C = 20%.
Water 12 03465 g009aWater 12 03465 g009b
Figure 10. Binarized views of loess samples (white-colored areas are pores and black areas are particles). (a) C = 0%; (b) C = 4%; (c) C = 8%; (d) C = 12%; (e) C = 16%; (f) C = 20%.
Water 12 03465 g010
Figure 11. Histograms of pore number.
Water 12 03465 g011
Table 1. Physical properties of loess samples.
ρρdWWLWpGrain Size Fractions (%)
<0.005 mm0.005–0.05 mm>0.05 mm
1.581.361626.3722.5513.3861.2725.34
Note: ρ: natural density (g/cm3); ρd: dry denstiy (g/cm3); W: natural water content (%); WL: liquid limit (%); Wp: plastic limit (%).
Table 2. Summary of ring shear test results.
Soaking Time (d)Peak Strength (kPa)Residual Strength (kPa)NaCl Concentration (%)Peak Strength (kPa)Residual Strength (kPa)
0174.80169.840167.45166.83
1161.19155.674173.73171.92
5167.60166.898186.07170.92
10167.12163.0312171.69169.43
15167.43165.2516167.05168.24
20167.23167.1520164.11165.97
25167.42168.15
Publisher’s Note: MDPI stays neutral with regard to jurisdictional claims in published maps and institutional affiliations.

