Combined Application of Real-Time Control and Green Technologies to Urban Drainage Systems


Abstract
:1. Introduction
2. Materials and Methods
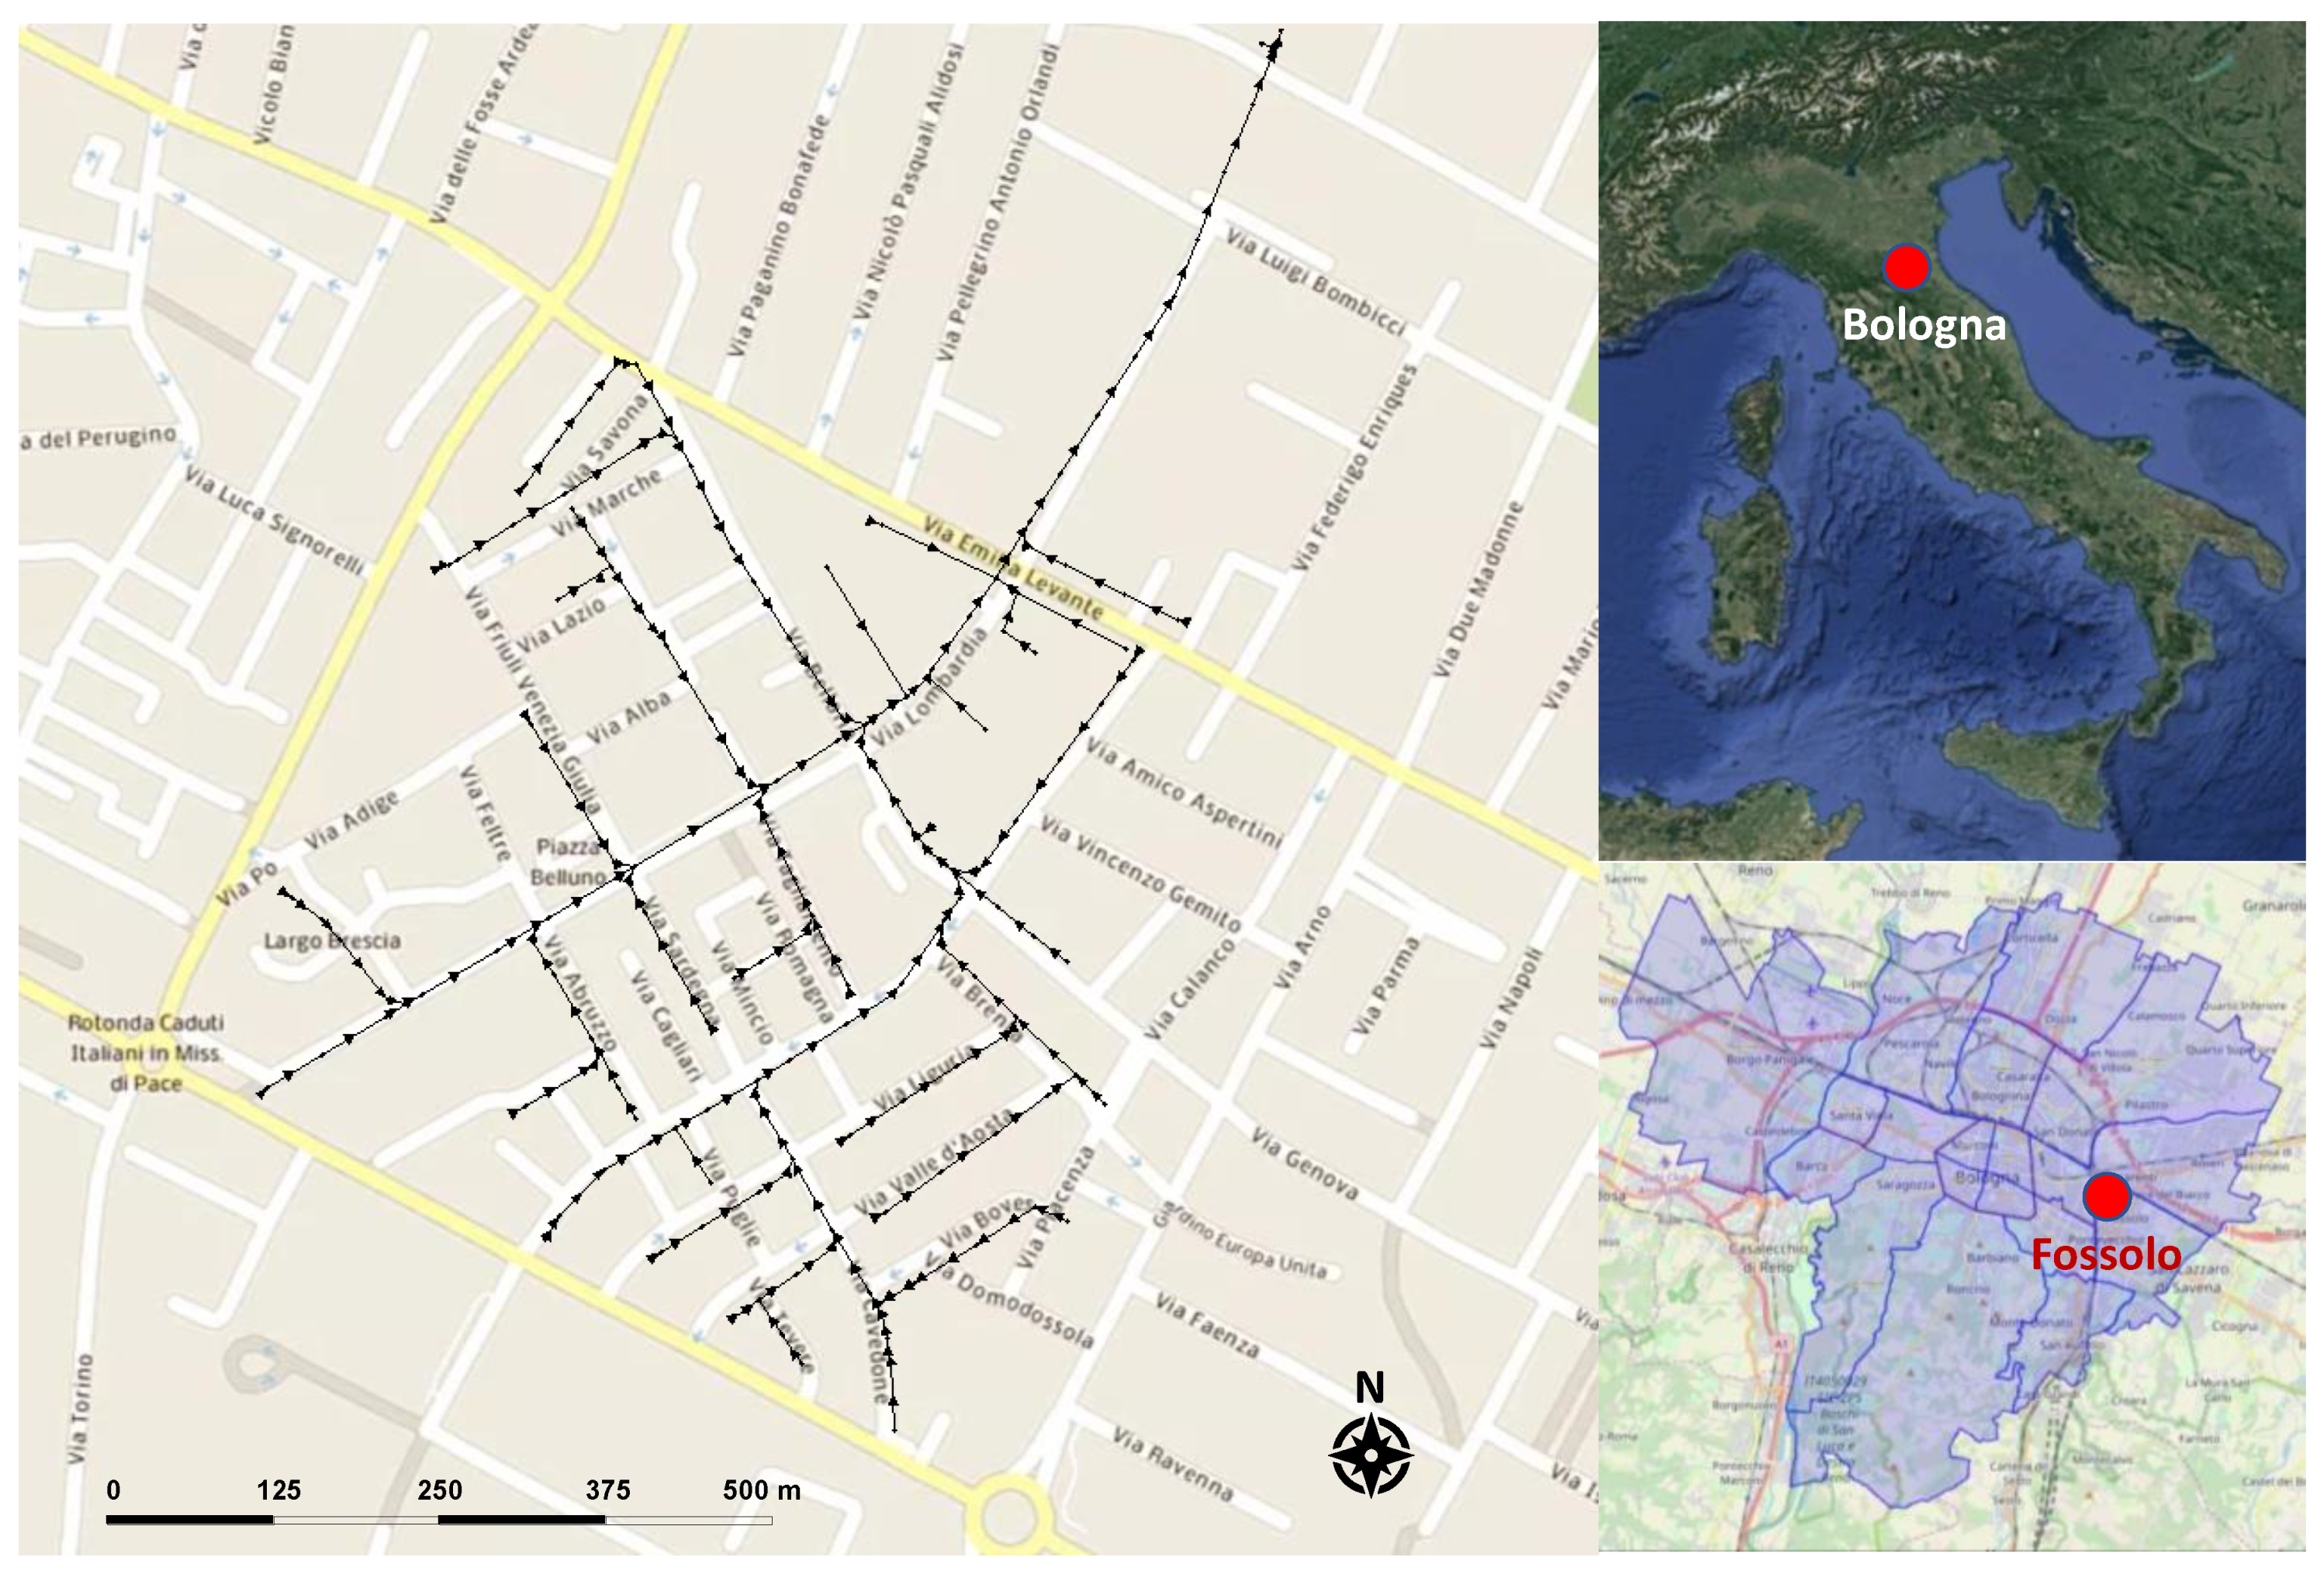
2.1. Pilot Catchment and Datasets
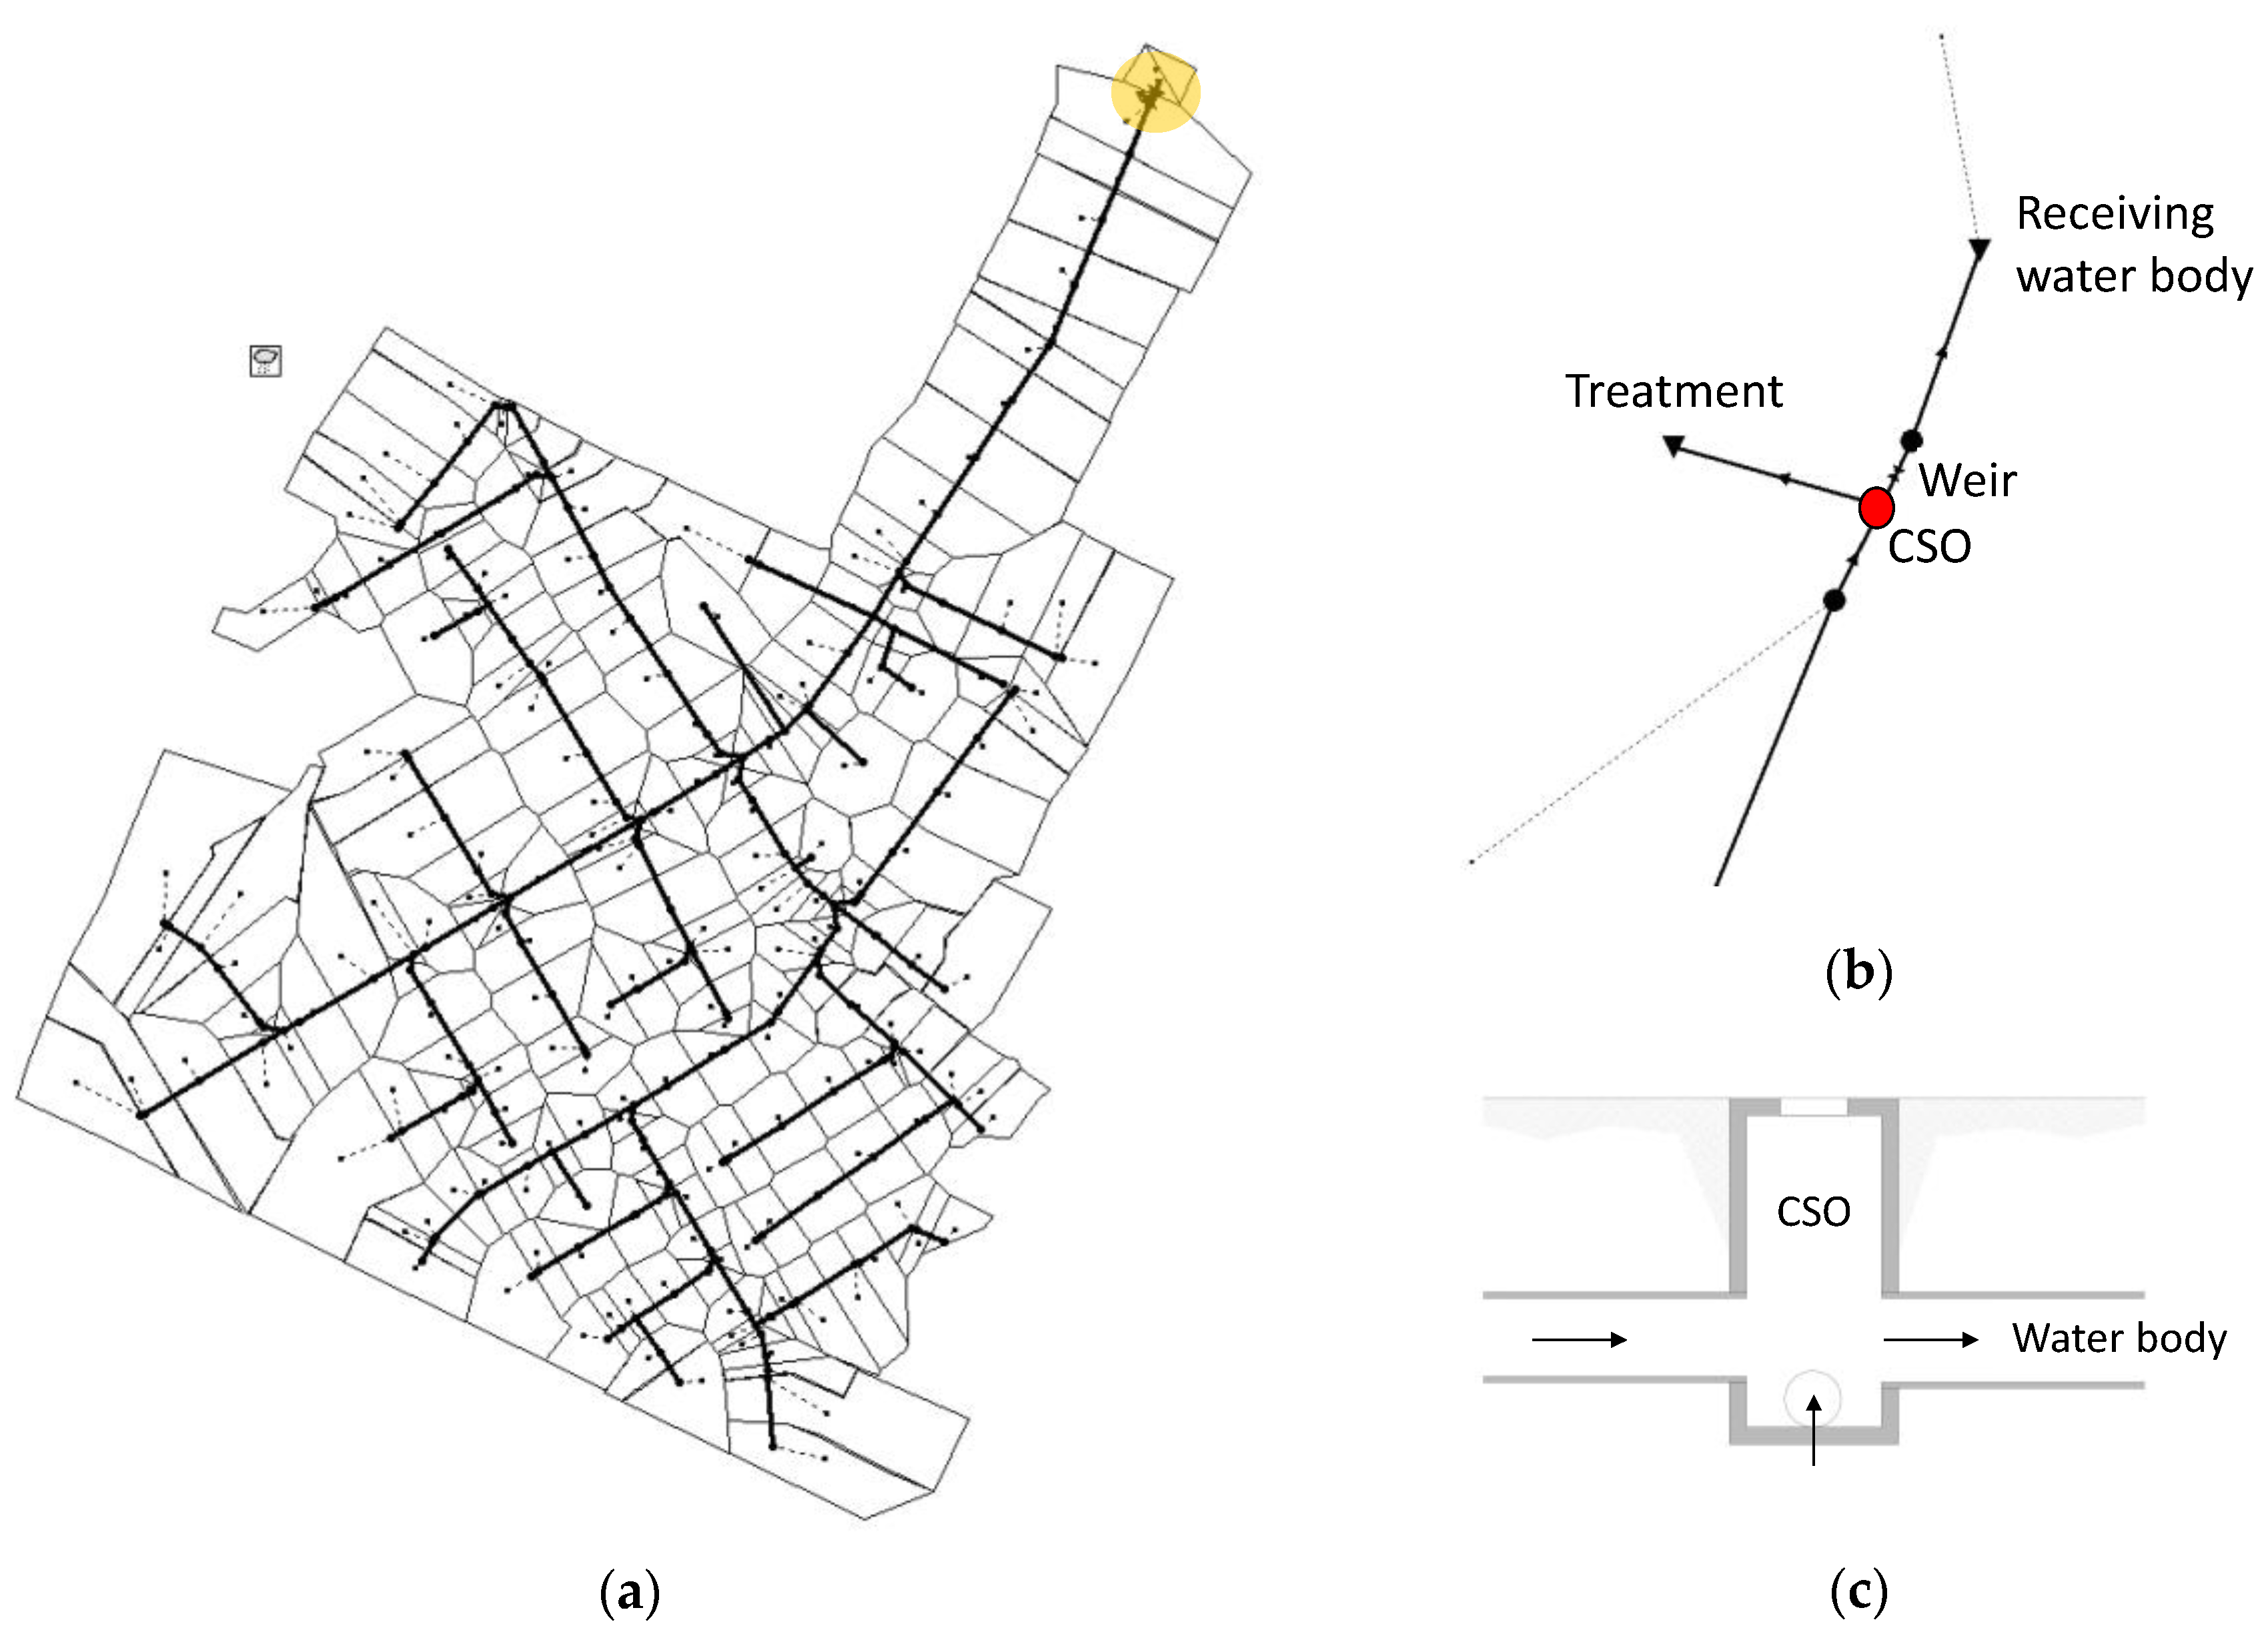
2.2. Hydraulic Model
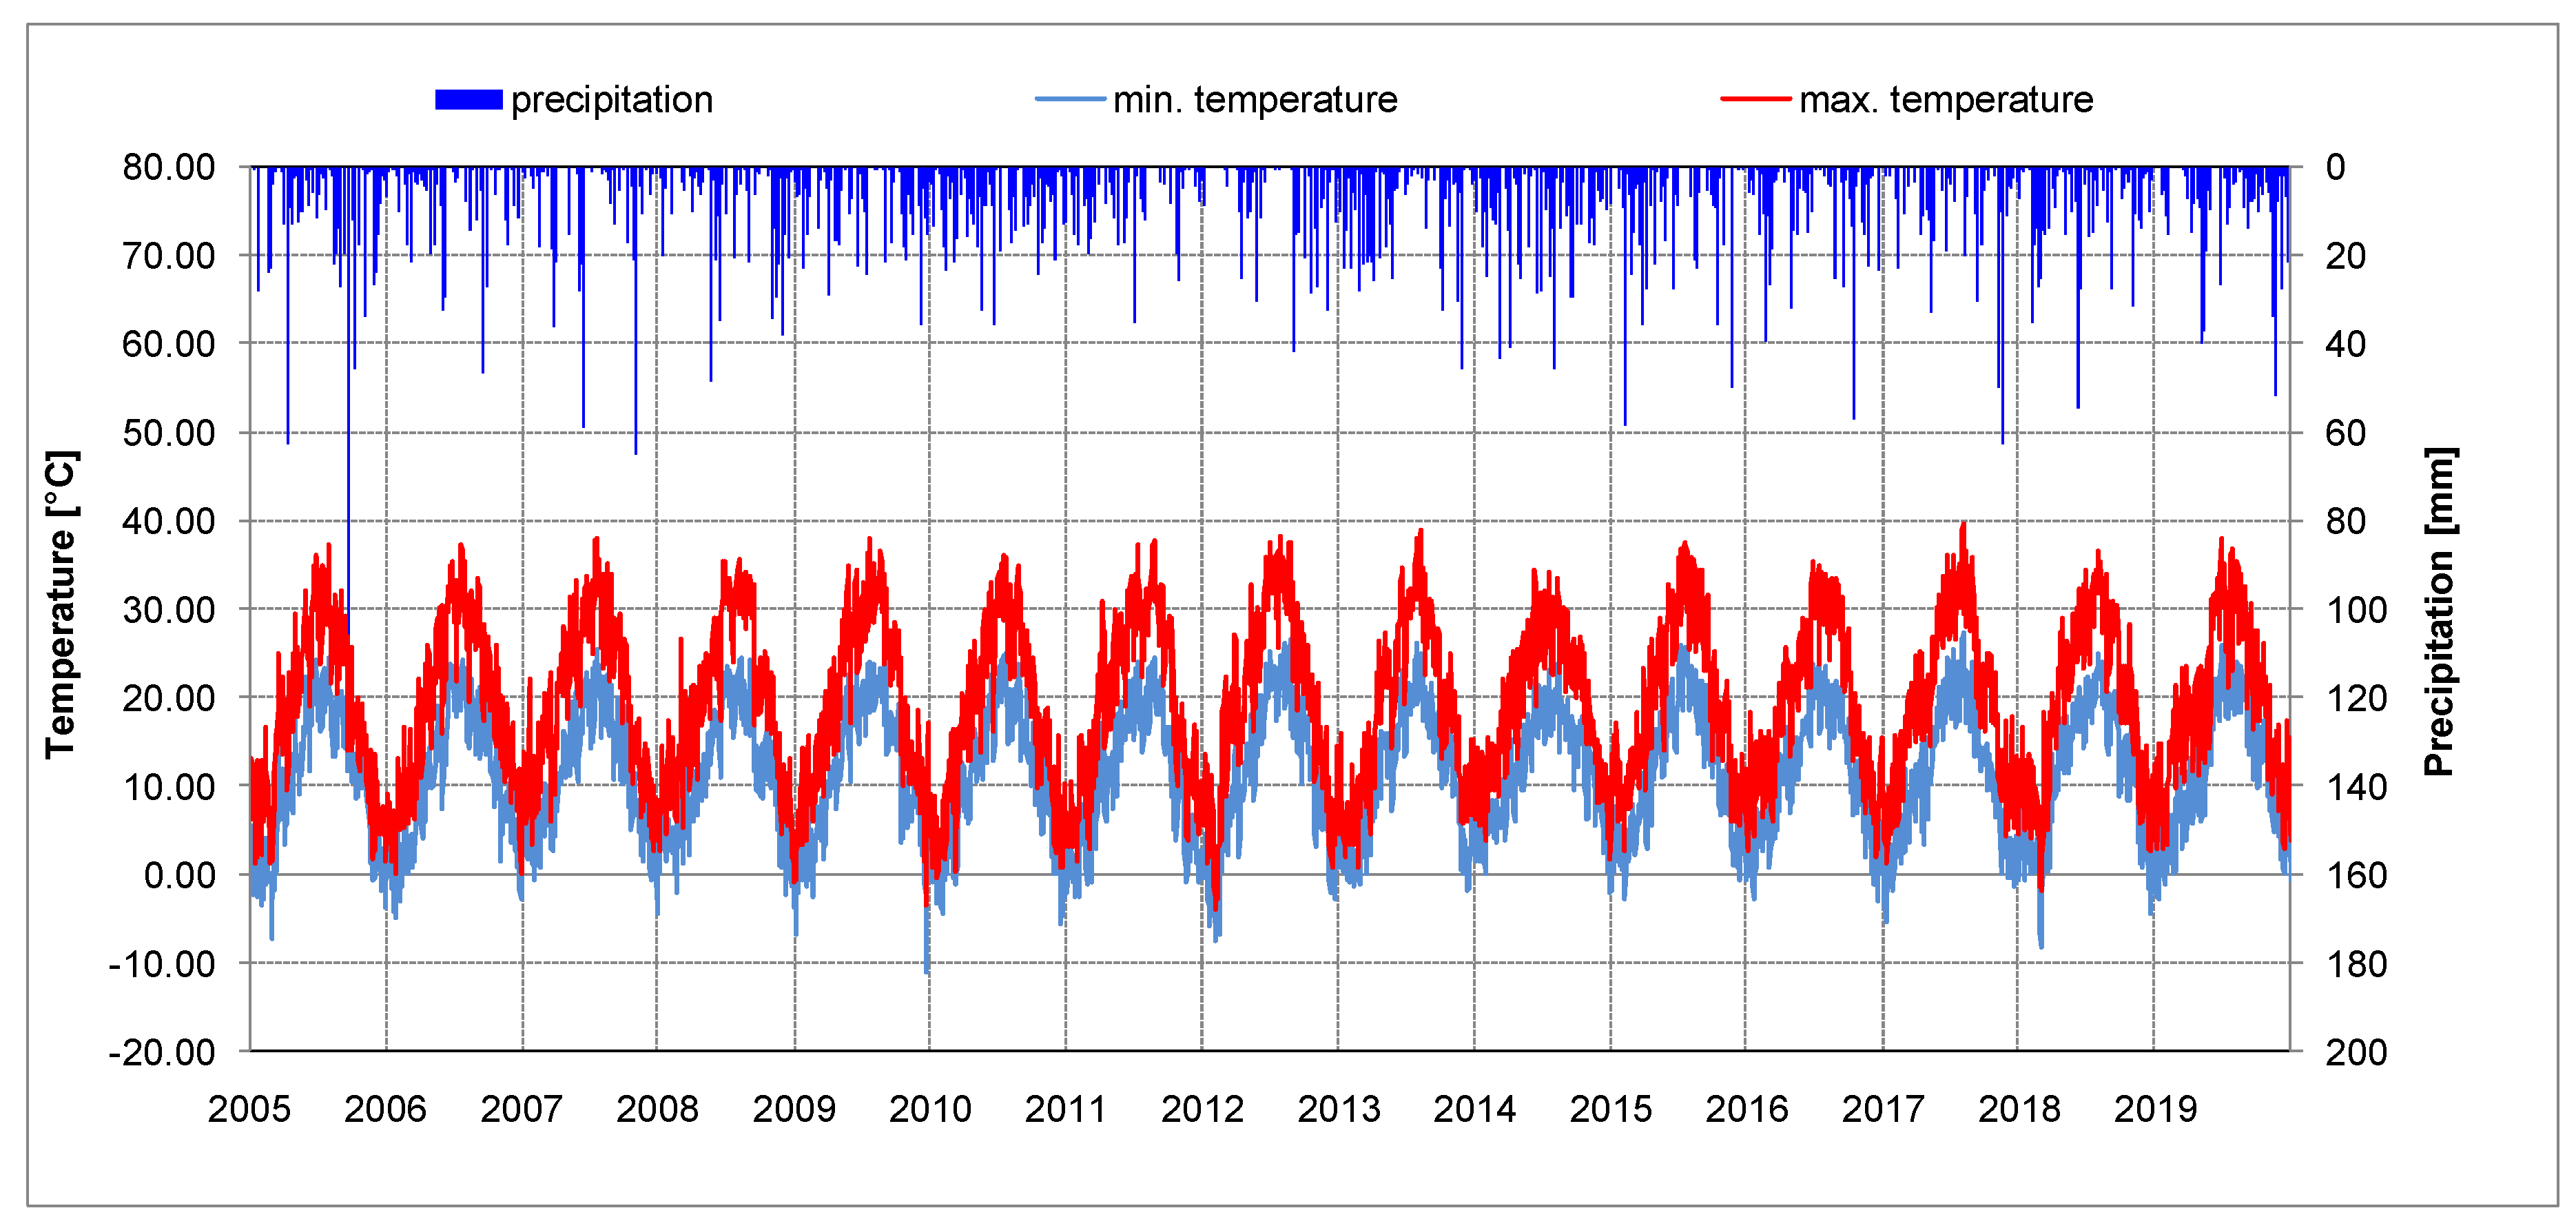
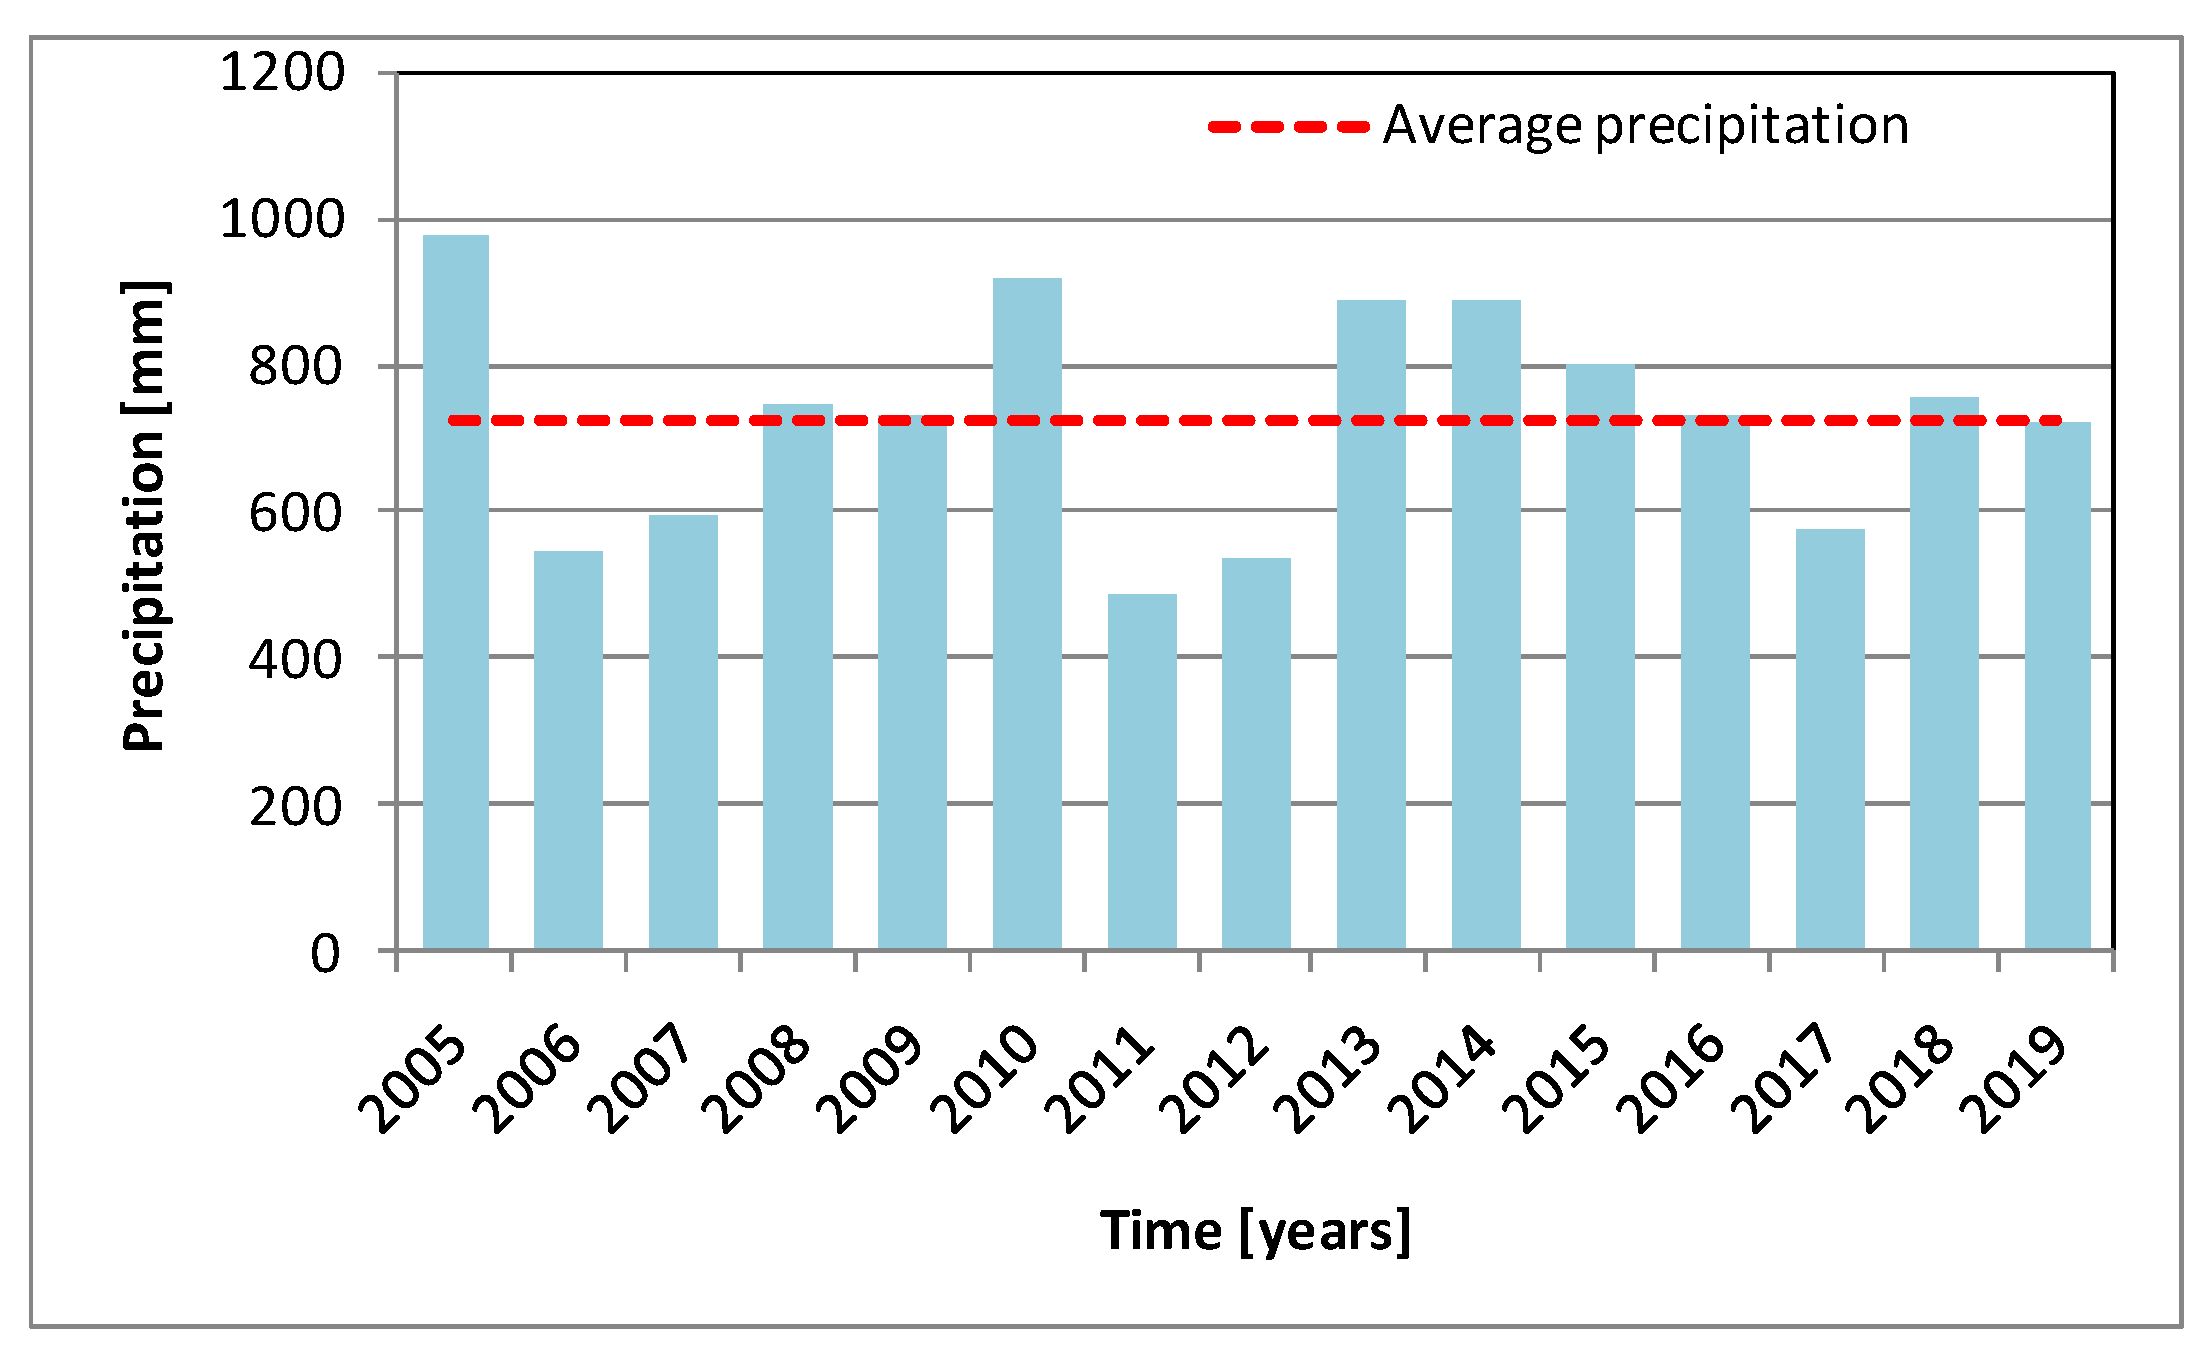
2.2.1. Input Data
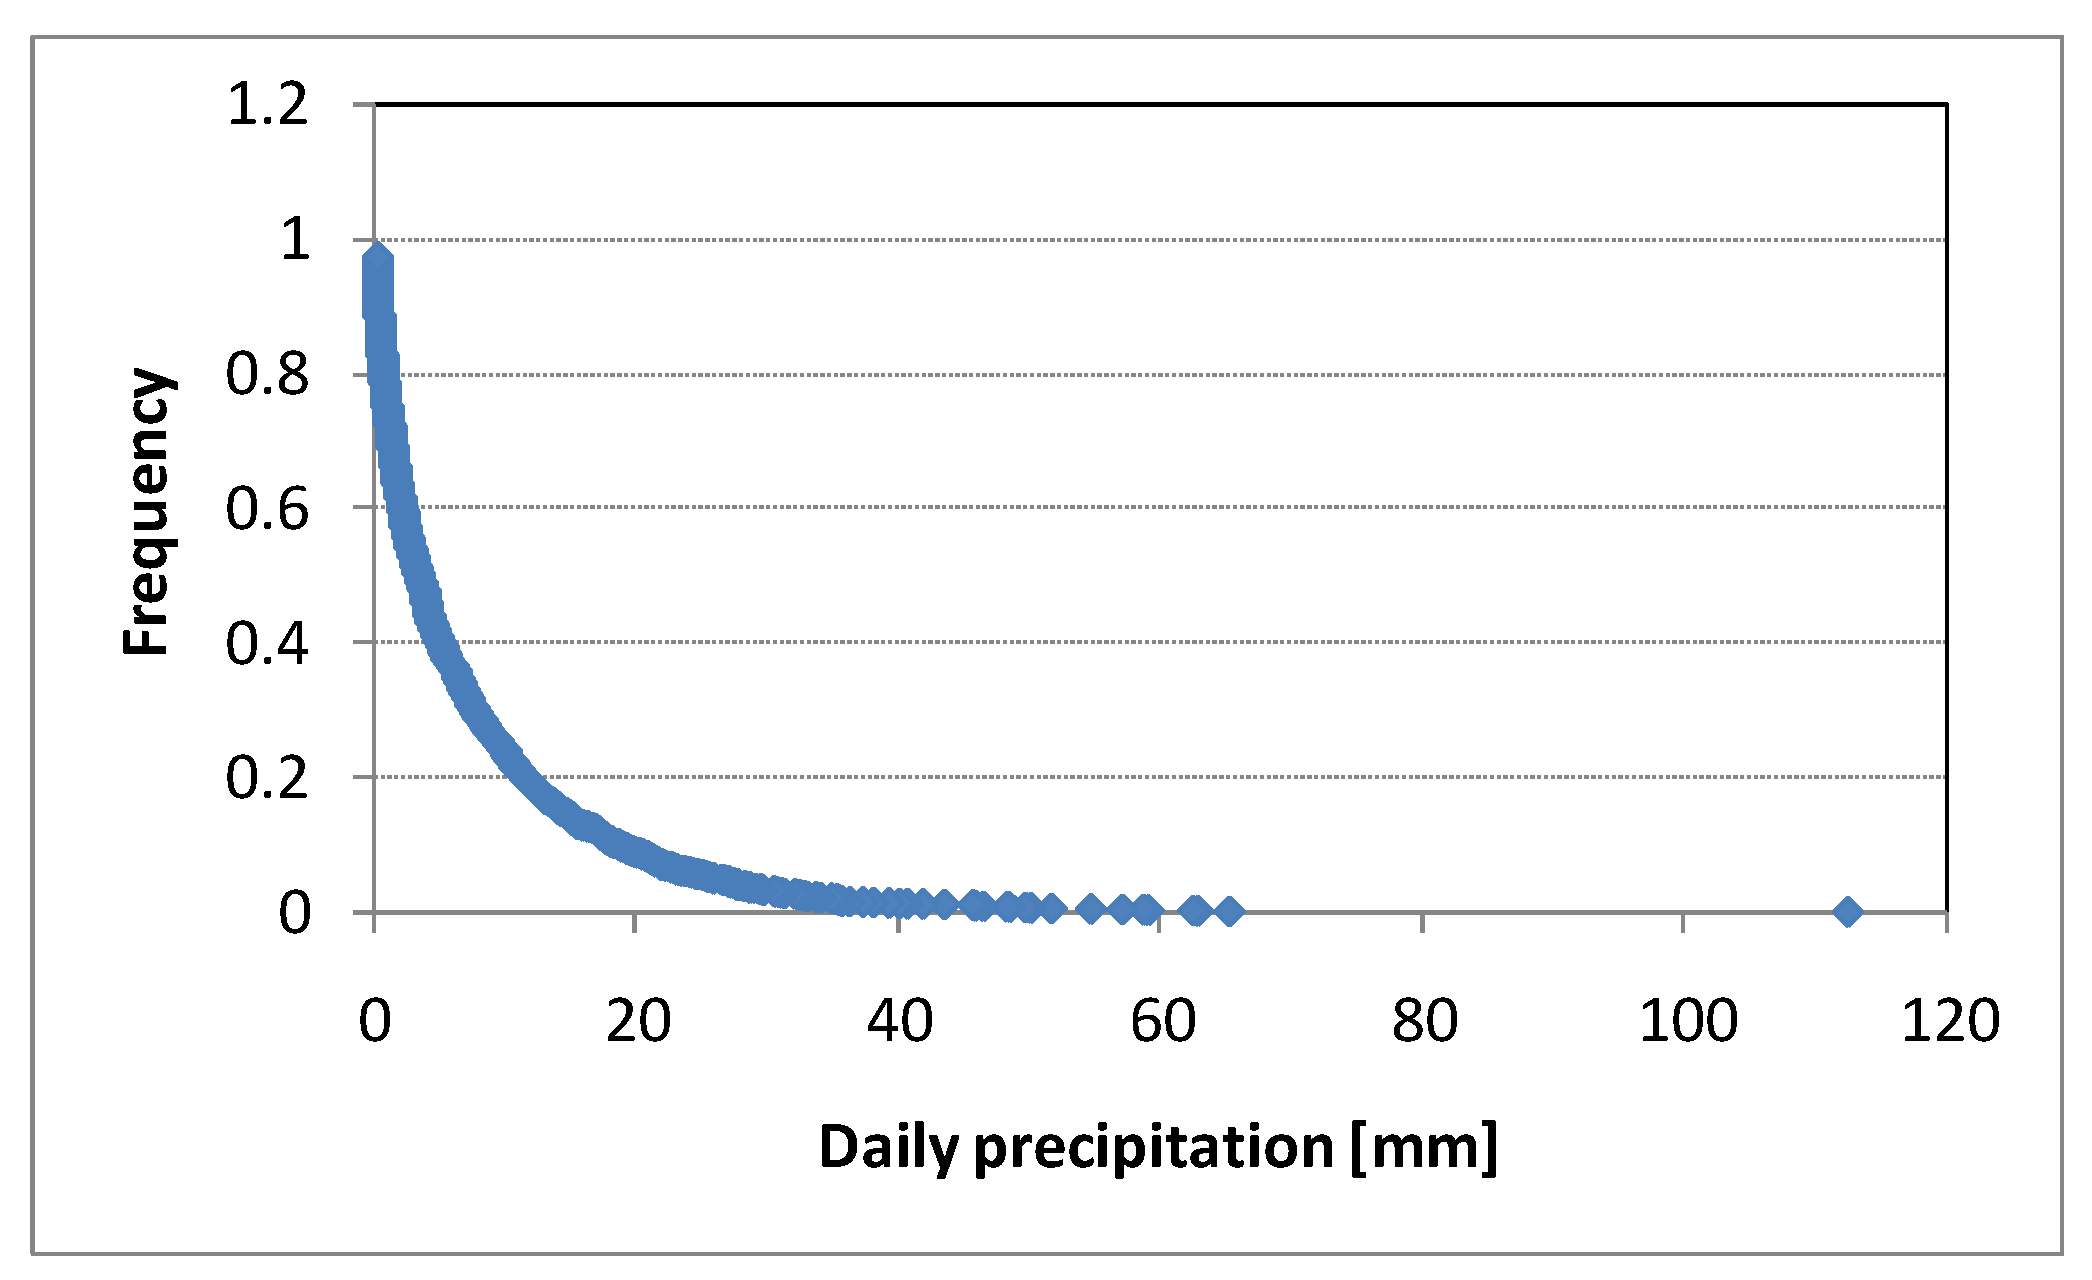
Rainfall
Dry Weather Flow
2.2.2. Green Roofs
2.2.3. Rainwater Harvesting Systems (RWHSs)
2.2.4. End-of-Pipe Solutions: Storm Detention Tanks
2.3. RTC Strategy Design
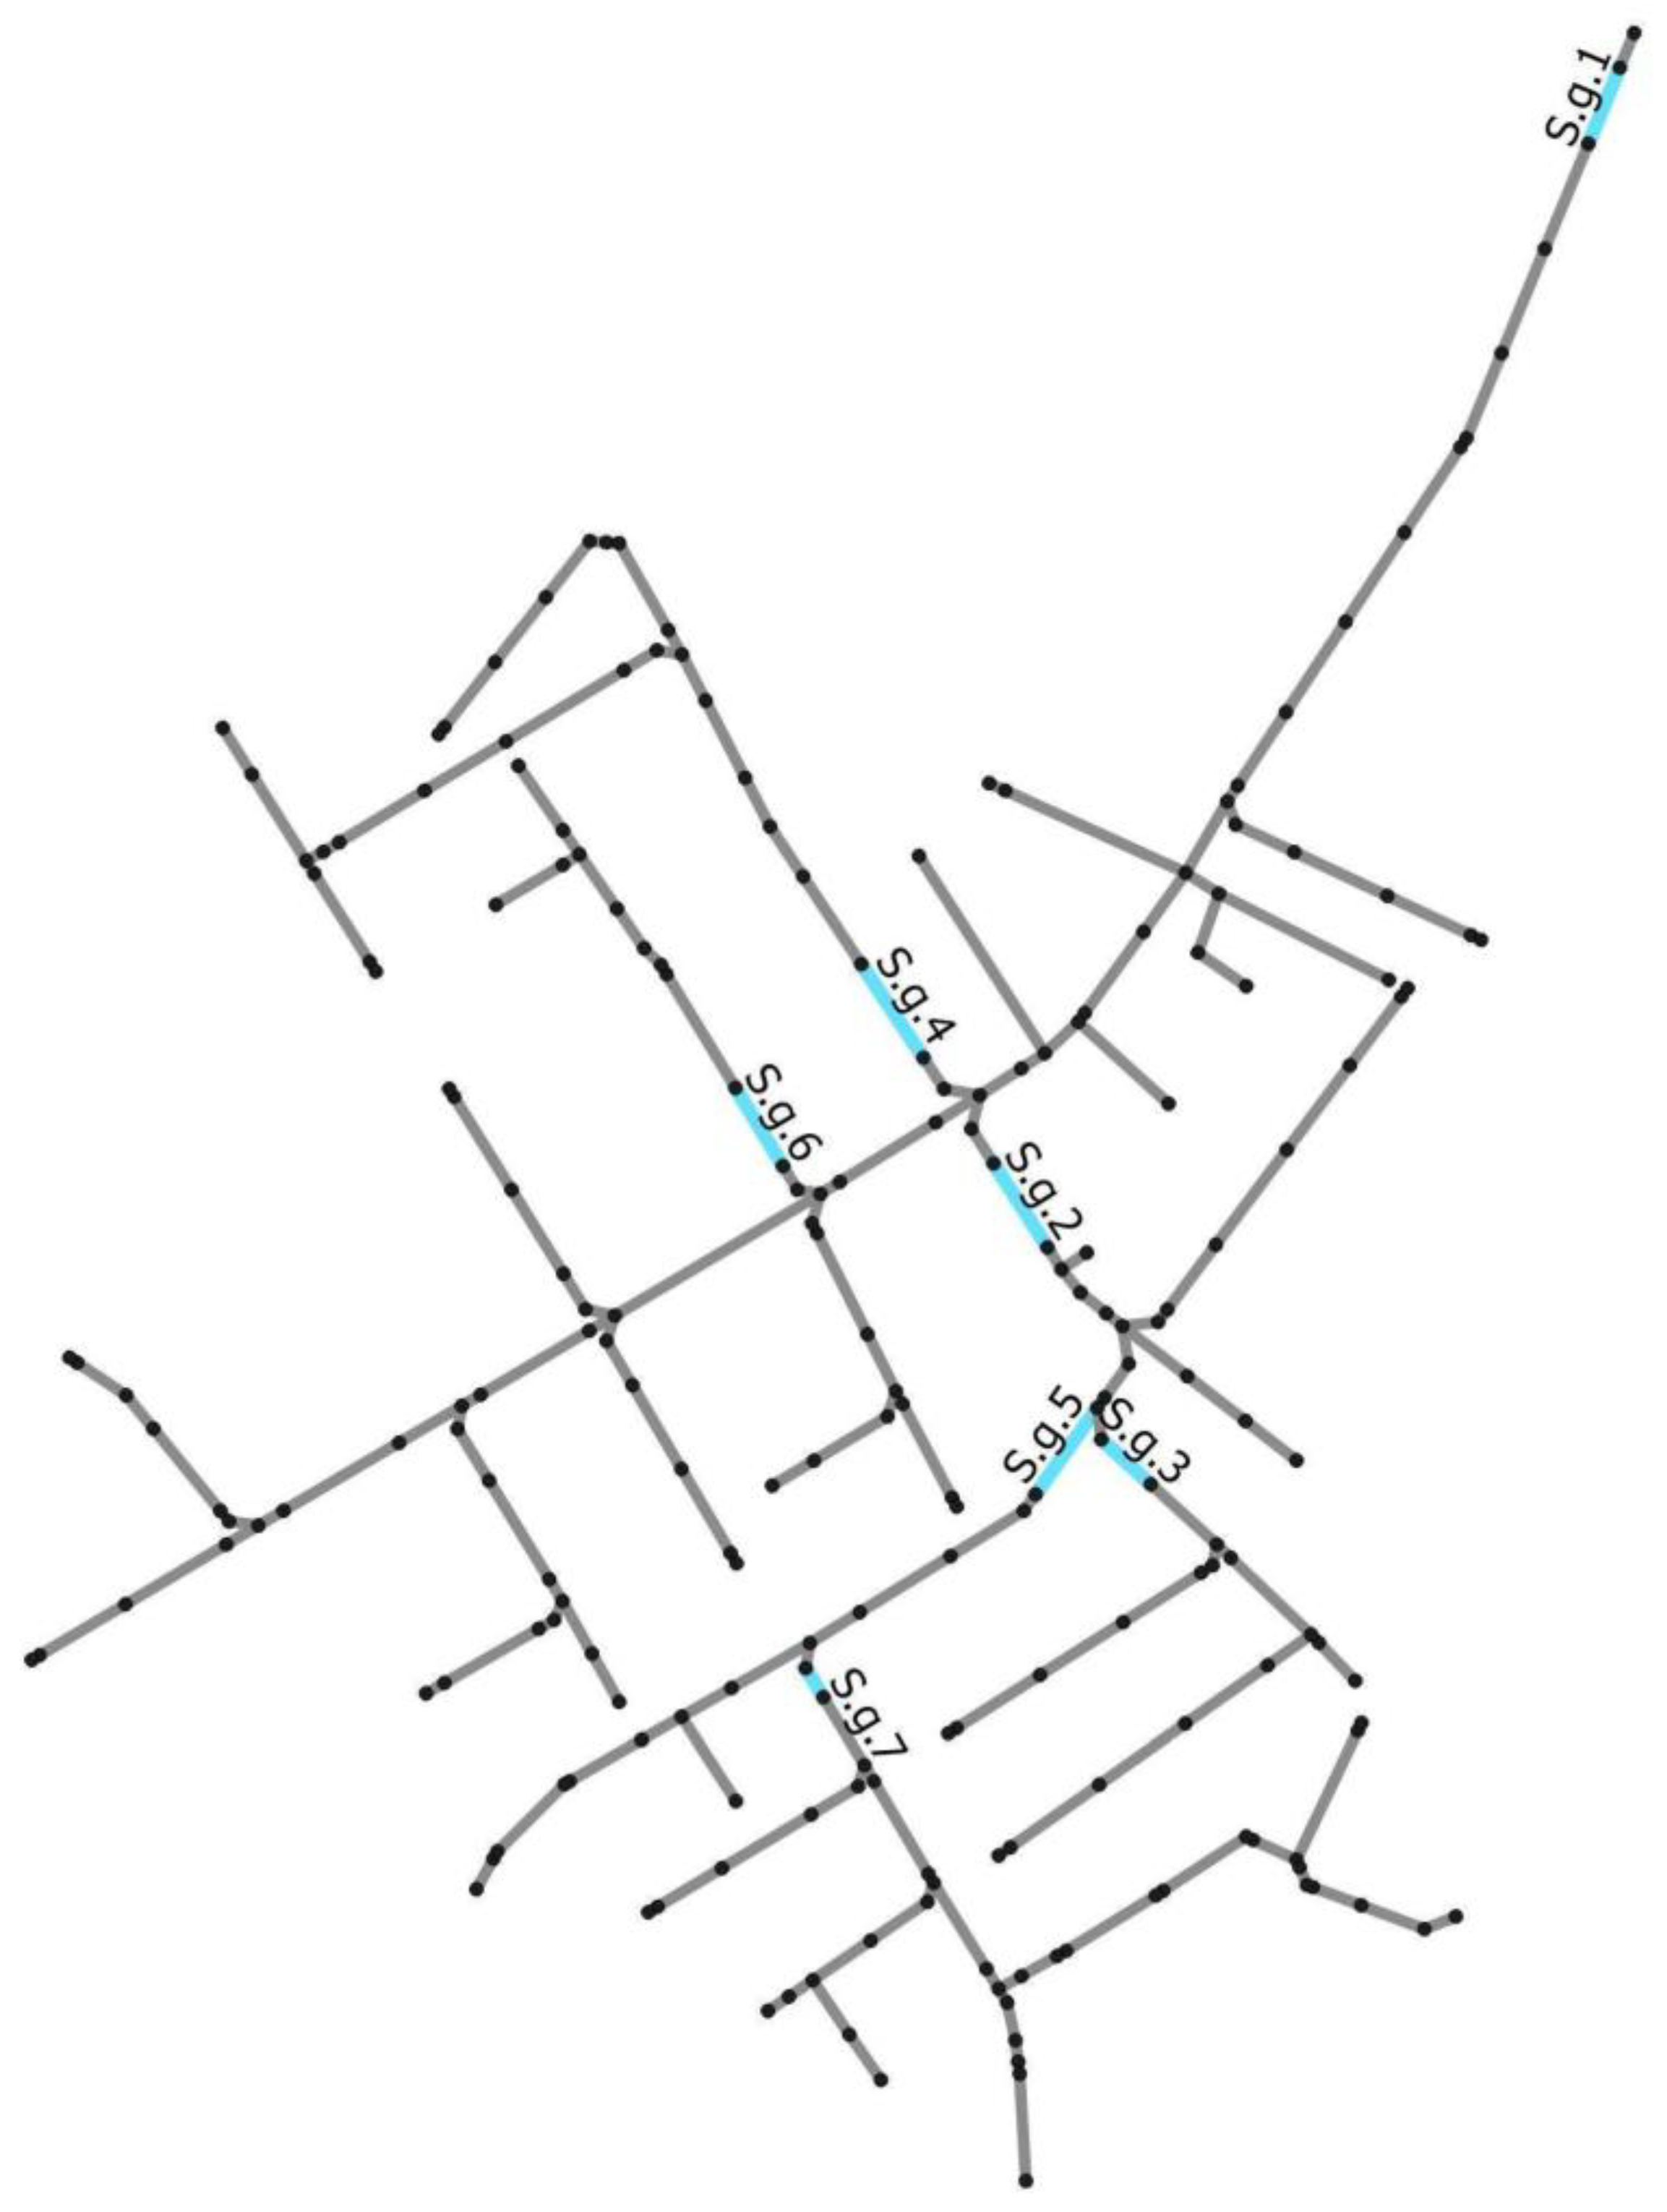
2.3.1. Identification of Control Locations
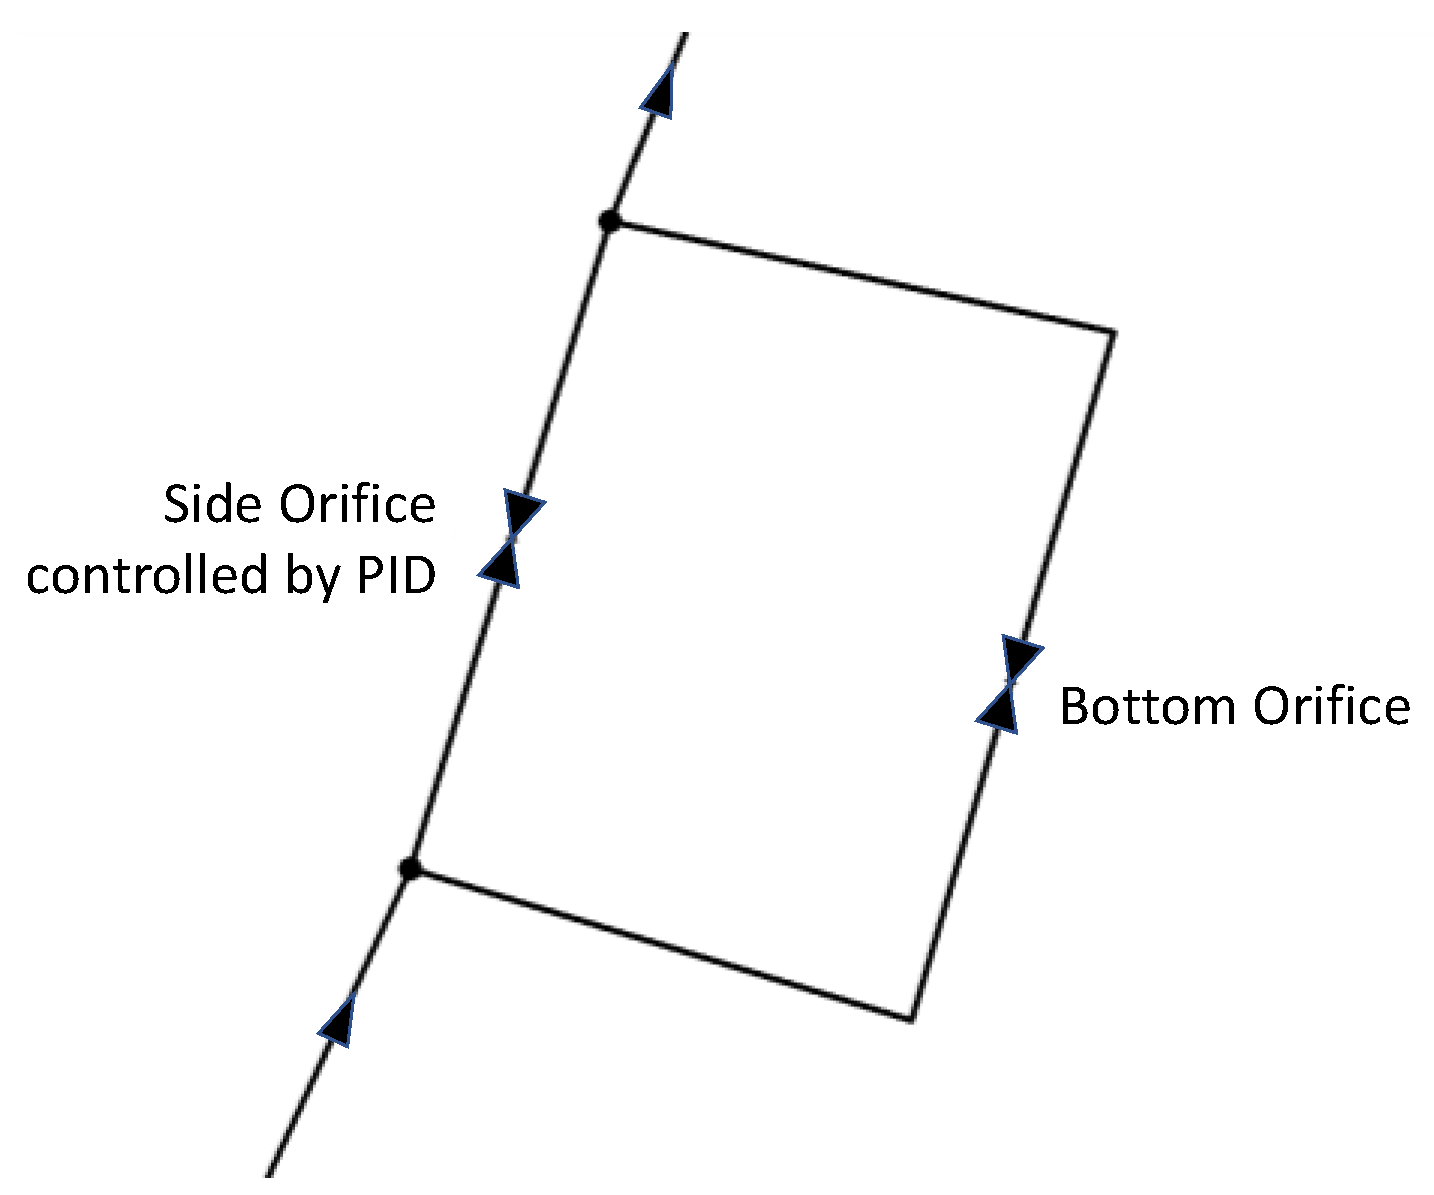
2.3.2. RTC Modeling
2.4. Scenario Development
3. Results and Discussion
4. Conclusions
Author Contributions
Funding
Conflicts of Interest
References
- Madsen, H.; Lawrence, D.; Lang, M.; Martinkova, M.; Kjeldsen, T.R. Review of trend analysis and climate change projections of extreme precipitation and floods in Europe. J. Hydrol. 2014, 519, 3634–3650. [Google Scholar] [CrossRef] [Green Version]
- Pistocchi, A.; Calzolari, C.; Malucelli, F.; Ungaro, F. Soil sealing and flood risks in the plains of Emilia-Romagna, Italy. J. Hydrol. Reg. Stud. 2015, 4, 398–409. [Google Scholar] [CrossRef]
- Astaraie-Imani, M.; Kapelan, Z.; Fu, G.; Butler, D. Assessing the combined effects of urbanisation and climate change on the river water quality in an integrated urban wastewater system in the UK. J. Environ. Manag. 2012, 112, 1–9. [Google Scholar] [CrossRef] [PubMed]
- Garofalo, G.; Giordano, A.; Piro, P.; Spezzano, G.; Vinci, A. A distributed real-time approach for mitigating CSO and flooding in urban drainage systems. J. Netw. Comput. Appl. 2017, 78, 30–42. [Google Scholar] [CrossRef]
- Tapia, C.; Abajo, B.; Feliu, E.; Mendizabal, M.; Martinez, J.A.; Fernández, J.G.; Laburu, T.; Lejarazu, A. Profiling urban vulnerabilities to climate change: An indicator-based vulnerability assessment for European cities. Ecol. Indic. 2017, 78, 142–155. [Google Scholar] [CrossRef]
- Andrés-Doménech, I.; Montanari, A.; Segura, J.B.M. Efficiency of Storm Detention Tanks for Urban Drainage Systems under Climate Variability. J. Water Resour. Plan. Manag. 2012, 138, 36–46. [Google Scholar] [CrossRef]
- Abawallo, S.S.; Brandimarte, L.; Maglionico, M. Analysis of the Performance Response of Offline Detention Basins to Inlet Structure Design. Irrig. Drain. 2013, 62, 449–457. [Google Scholar] [CrossRef]
- Fletcher, T.D.; Shuster, W.D.; Hunt, W.F.; Ashley, R.; Butler, D.; Arthur, S.; Trowsdale, S.; Barraud, S.; Semadeni-Davies, A.; Bertrand-Krajewski, J.L.; et al. SUDS, LID, BMPs, WSUD and more–The evolution and application of terminology surrounding urban drainage. Urban Water J. 2015, 12, 525–542. [Google Scholar] [CrossRef]
- Masseroni, D.; Ercolani, G.; Chiaradia, E.A.; Maglionico, M.; Toscano, A.; Gandolfi, C.; Bischetti, G.B. Exploring the performances of a new integrated approach of grey, green and blue infrastructures for combined sewer overflows remediation in high-density urban areas. J. Agric. Eng. 2018, 49, 233–241. [Google Scholar] [CrossRef] [Green Version]
- Cipolla, S.S.; Maglionico, M.; Stojkov, I. Experimental Infiltration Tests on Existing Permeable Pavement Surfaces. Clean Soil Air Water 2015, 44, 89–95. [Google Scholar] [CrossRef]
- Gambi, G.; Maglionico, M.; Tondelli, S. Water management in local development plans: The case of the old Fruit and Vegetable Market in Bologna. Procedia Eng. 2011, 21, 1110–1117. [Google Scholar] [CrossRef] [Green Version]
- Fu, X.; Goddard, H.; Wang, X.; Hopton, M. Development of a scenario-based stormwater management planning support system for reducing combined sewer overflows (CSOs). J. Environ. Manag. 2019, 236, 571–580. [Google Scholar] [CrossRef] [PubMed]
- Palla, A.; Gnecco, I.; La Barbera, P. The impact of domestic rainwater harvesting systems in storm water runoff mitigation at the urban block scale. J. Environ. Manag. 2017, 191, 297–305. [Google Scholar] [CrossRef] [PubMed]
- UNESCO. UN-WWAP Wastewater: The Untapped Resource; UNESCO: Paris, France, 2017. [Google Scholar]
- Carbone, M.; Garofalo, G.; Nigro, G.; Piro, P. A Conceptual Model for Predicting Hydraulic Behaviour of a Green Roof. Procedia Eng. 2014, 70, 266–274. [Google Scholar] [CrossRef] [Green Version]
- Cipolla, S.S.; Maglionico, M.; Stojkov, I. A long-term hydrological modelling of an extensive green roof by means of SWMM. Ecol. Eng. 2016, 95, 876–887. [Google Scholar] [CrossRef]
- Fioretti, R.; Palla, A.; Lanza, L.; Principi, P. Green roof energy and water related performance in the Mediterranean climate. Build. Environ. 2010, 45, 1890–1904. [Google Scholar] [CrossRef]
- Scholz, M.; Grabowiecki, P. Review of permeable pavement systems. Build. Environ. 2007, 42, 3830–3836. [Google Scholar] [CrossRef]
- Kumar, K.; Kozak, J.; Hundal, L.; Cox, A.; Zhang, H.; Granato, T. In-situ infiltration performance of different permeable pavements in a employee used parking lot—A four-year study. J. Environ. Manag. 2016, 167, 8–14. [Google Scholar] [CrossRef]
- Zhang, S.; Guo, Y. SWMM Simulation of the Storm Water Volume Control Performance of Permeable Pavement Systems. J. Hydrol. Eng. 2015, 20, 06014010. [Google Scholar] [CrossRef]
- Fassman, E.; Blackbourn, S. Urban Runoff Mitigation by a Permeable Pavement System over Impermeable Soils. J. Hydrol. Eng. 2010, 15, 475–485. [Google Scholar] [CrossRef]
- D’Arcy, B.; Frost, A. The role of best management practices in alleviating water quality problems associated with diffuse pollution. Sci. Total. Environ. 2001, 265, 359–367. [Google Scholar] [CrossRef]
- Dirckx, G.; Schutze, M.; Kroll, S.; Thoeye, C.; De Gueldre, G.; Van De Steene, B. Cost-efficiency of RTC for CSO impact mitigation. Urban Water J. 2011, 8, 367–377. [Google Scholar] [CrossRef]
- Cipolla, S.S.; Maglionico, M. Heat recovery from urban wastewater: Analysis of the variability of flow rate and temperature. Energy Build. 2014, 69, 122–130. [Google Scholar] [CrossRef]
- Marinelli, A.; Maglionico, M.; Artina, S. Water Quality Simulation in an Urban Drainage Catchment. In Proceedings of the 1997 European Water Resources Association Conference, Copenhagen, Denmark, 3–6 September 1997; pp. 383–390. [Google Scholar]
- Calabrò, P.; Maglionico, M. Comparison between a Detailed Model and Two Simplified Models in Urban Stormwater Quality Simulation. In Global Solutions for Urban Drainage; ASCE: Portland, OR, USA, 2002; pp. 1–14. [Google Scholar]
- Rossman, L.A. Storm Water Management Model. User’s Manual, Version 5.0; United States Environmental Protection Agency: Cincinnati, OH, USA, 2005. [Google Scholar]
- Hargreaves, G.H.; Samani, Z.A. Reference Crop Evapotranspiration from Temperature. Appl. Eng. Agric. 1985, 1, 96–99. [Google Scholar] [CrossRef]
- UNI/TS 11445—Impianti per la Raccolta e Utilizzo Dell’acqua Piovana per usi Diversi dal Consumo umano—Progettazione Installazione e Manutenzione. 2012. Available online: http://www.pvcforum.it/wp-content/themes/twentyseventeen/assets/pdf/tubi/Riassunto%20UNI%2011445.pdf (accessed on 12 November 2020).
- Cipolla, S.S.; Altobelli, M.; Maglionico, M. Systems for Rainwater Harvesting and Greywater Reuse at the Building Scale: A Modelling Approach. Environ. Eng. Manag. J. 2018, 17, 2349–2360. [Google Scholar] [CrossRef]
- Cipolla, S.S.; Altobelli, M.; Maglionico, M. Decentralized Water Management: Rainwater Harvesting, Greywater Reuse and Green Roofs within the GST4Water Project. Proceedings 2018, 2, 673. [Google Scholar] [CrossRef] [Green Version]
- Kroll, S.; Weemaes, M.; Van Impe, J.F.; Willems, P. A Methodology for the Design of RTC Strategies for Combined Sewer Networks. Water 2018, 10, 1675. [Google Scholar] [CrossRef] [Green Version]
- Vonach, T.; Tscheikner-Gratl, F.; Rauch, W.; Kleidorfer, M. A Heuristic Method for Measurement Site Selection in Sewer Systems. Water 2018, 10, 122. [Google Scholar] [CrossRef] [Green Version]
- Garofalo, G.; Giordano, A.; Spezzano, G.; Vinci, A. Definizione e Sperimentazione di un Sistema per la Gestione dei Deflussi nella Rete Idrica Tramite Smart Object; ICAR-CNR: Calabria, Italy, 2015. [Google Scholar]
- Campisano, A.; Modica, C. PID and PLC units for the real-time control of sewer systems. Water Sci. Technol. 2002, 45, 95–104. [Google Scholar] [CrossRef]
- Campisano, A.; Creaco, E.; Modica, C. Application of Real-Time Control Techniques to Reduce Water Volume Discharges from Quality-Oriented CSO Devices. J. Environ. Eng. 2016, 142, 04015049. [Google Scholar] [CrossRef]
- Ashley, R.; Faram, M.; Chatfield, P.R.; Gersonius, B.; Andoh, R. Appropriate Drainage Systems for a Changing Climate in the Water Sensitive City. In Low Impact Development 2010; American Society of Civil Engineers: San Francisco, CA, USA, 2010; pp. 864–877. [Google Scholar]
- Oral, H.V.; Carvalho, P.; Gajewska, M.; Ursino, N.; Masi, F.; Van Hullebusch, E.D.; Kazak, J.K.; Exposito, A.; Cipolletta, G.; Andersen, T.R.; et al. A review of nature-based solutions for urban water management in European circular cities: A critical assessment based on case studies and literature. Blue-Green Syst. 2020, 2, 112–136. [Google Scholar] [CrossRef] [Green Version]
- Rodríguez, M.I.; Cuevas, M.M.; Martinez, G.; Moreno, B. Planning criteria for Water Sensitive Urban Design. WIT Trans. Ecol. Environ. 2014, 191, 1579–1591. [Google Scholar] [CrossRef]


| Type | Name | Description | Unit | Value |
|---|---|---|---|---|
| Quantity | N-imperv | Manning coefficient for impervious area | - | 0.02 |
| Quantity | N-perv | Manning coefficient for pervious area | - | 0.16 |
| Quantity | Dstore-perv | Depth of depression storage on pervious area | mm | 3.0 |
| Quantity | Dstore-imperv | Depth of depression storage on impervious area | mm | 0.7 |
| Quantity | % Slope | Average surface slope | % | 1.7 |
| Quality | DWF | Concentration of the pollutant in dry weather sanitary flow | mg/L | 230 |
| Quality | Max buildup | Maximum buildup | kg/ha/day | 16 |
| Quality | Rate Constant | Rate constant of buildup function | 1/day | 0.08 |
| Quality | Washoff Coefficient | Washoff coefficient | 1/mm | 0.203 |
| Quality | Exponent | Runoff exponent in washoff function | - | 1.8 |
| Name | Drained Area (ha) | Upstream Sluice Gate |
|---|---|---|
| S.g.1 | 43.14 | S.g.2, S.g.3, S.g.4, S.g.5, S.g.6, S.g.7 |
| S.g.2 | 14.24 | S.g.3, S.g.5, S.g.7 |
| S.g.3 | 2.27 | - |
| S.g.4 | 4.40 | - |
| S.g.5 | 8.16 | S.g.7 |
| S.g.6 | 2.13 | - |
| S.g.7 | 5.52 | - |
| Smart Gate | Kp | Ti (Minutes) | Td (Minutes) |
|---|---|---|---|
| S.g.1 | −10 | 0.1 | 0 |
| S.g.2 | −10 | 0.1 | 0 |
| S.g.3 | −10 | 0.1 | 0 |
| S.g.4 | −1 | 0 | 0 |
| S.g.5 | −10 | 0.01 | 0 |
| S.g.6 | −1 | 0 | 0.01 |
| S.g.7 | −10 | 0.1 | 0 |
| N | Case | Description | Acronym | EOPS | SCT | RTC |
|---|---|---|---|---|---|---|
| 1 | Case 1 | Benchmark network | C1real | |||
| 2 | Case 1 | Benchmark network with RTC | C1RTC | x | ||
| 3 | Case 2 | Green roofs with RTC | C2RTC | x | x | |
| 4 | Case 2 | Green roofs | C2real | x | ||
| 5 | Case 3 | +15% pervious surfaces with RTC | C3RTC | x | x | |
| 6 | Case 3 | +15% pervious surfaces | C3real | x | ||
| 7 | Case 4 | 7 rainwater harvesting tanks + RTC | C4RTC | x | x | |
| 8 | Case 4 | 7 rainwater harvesting tanks | C4real | x | ||
| 9 | Case 5a | 6 detention tanks (10 m3/ha) + RTC | C5aRTC | x | x | |
| 10 | Case 5a | 6 detention tanks (10 m3/ha) | C5areal | x | ||
| 11 | Case 5b | 6 detention tanks (50 m3/ha) + RTC | C5bRTC | x | x | |
| 12 | Case 5b | 6 detention tanks (50 m3/ha) | C5breal | x |
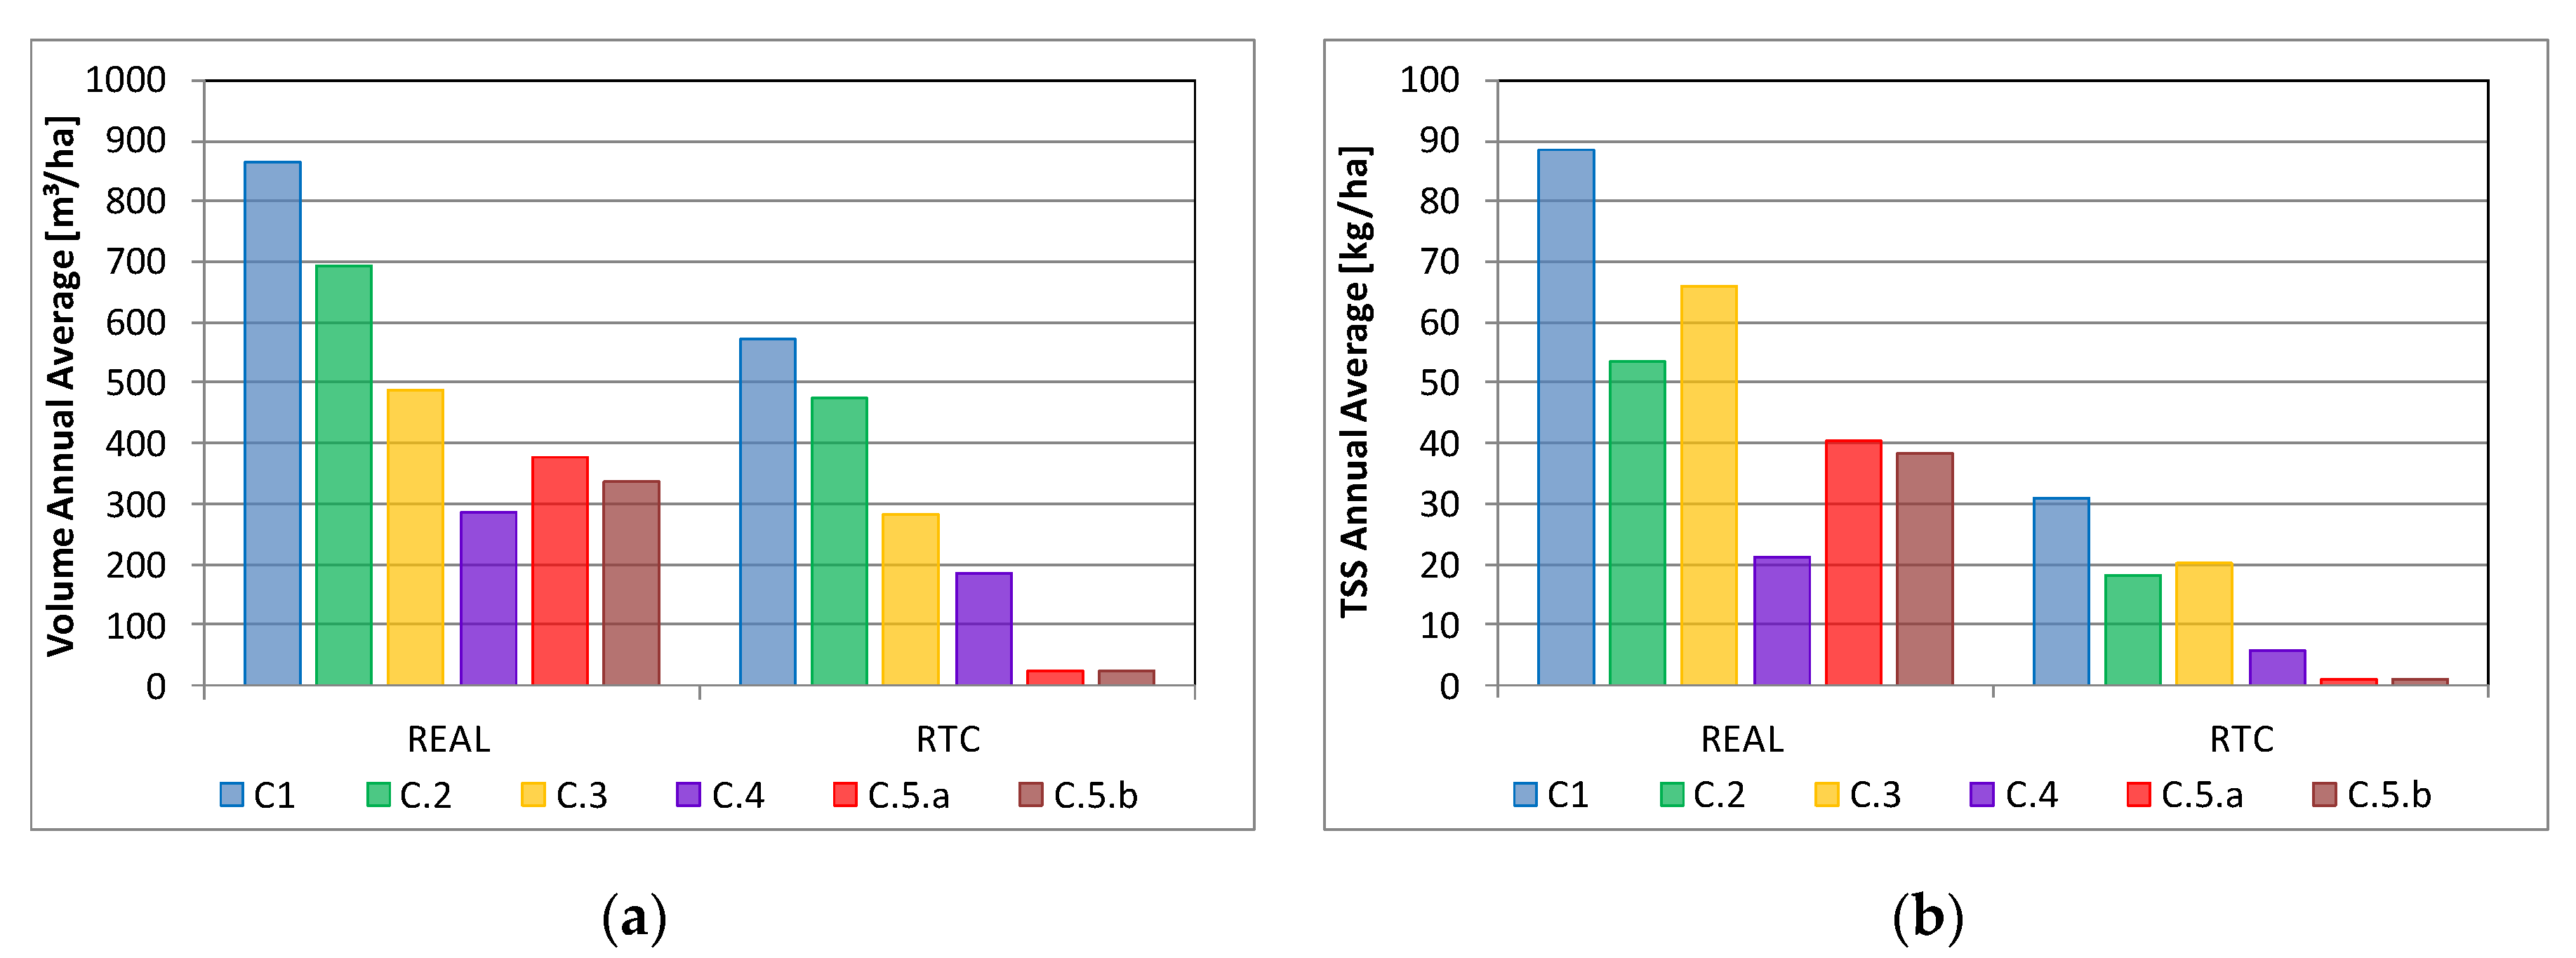
| Case | Volume Annual Average (m3/ha) | TSS Annual Average (kg/ha) | Volume Reduction Compared to C1real (%) | TSS Reduction Compared to C1real (%) |
|---|---|---|---|---|
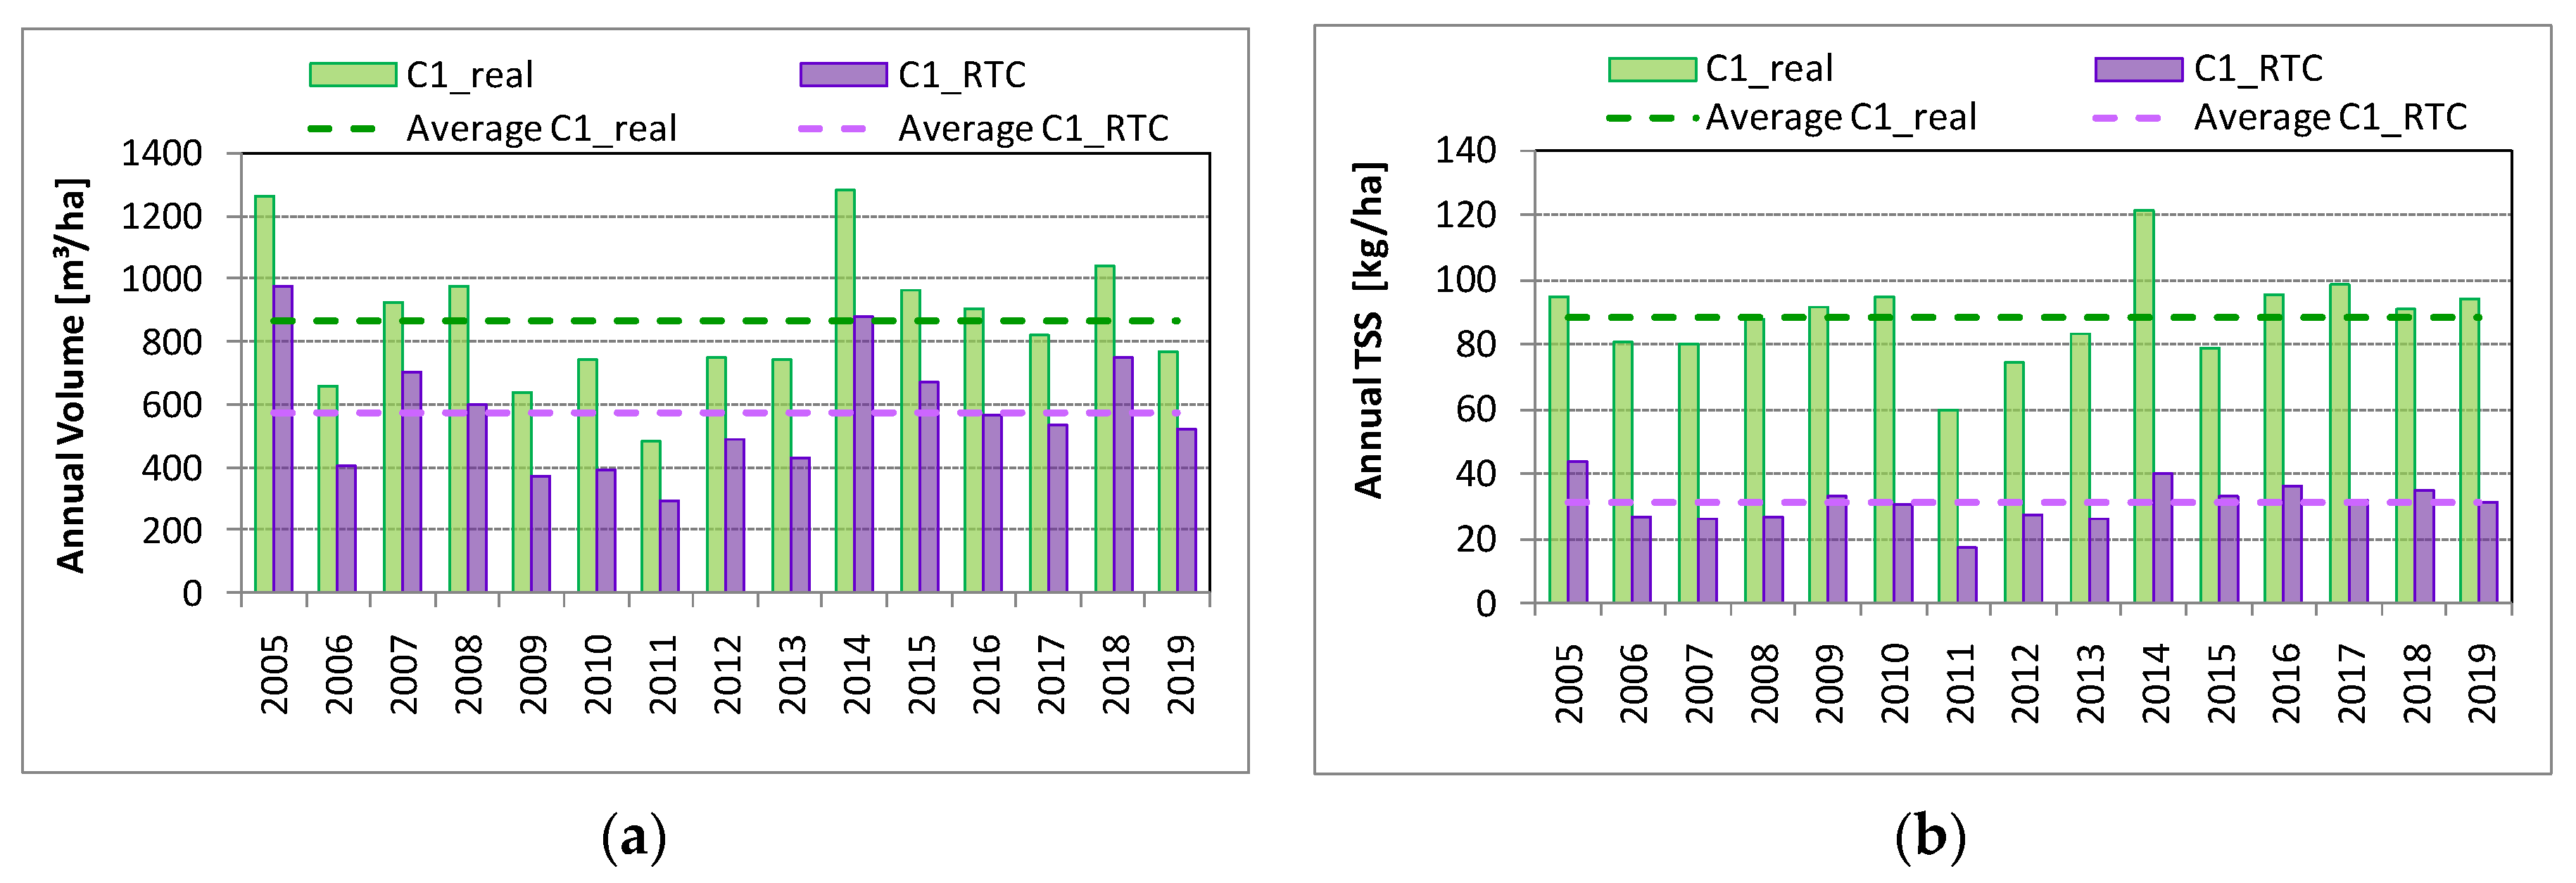
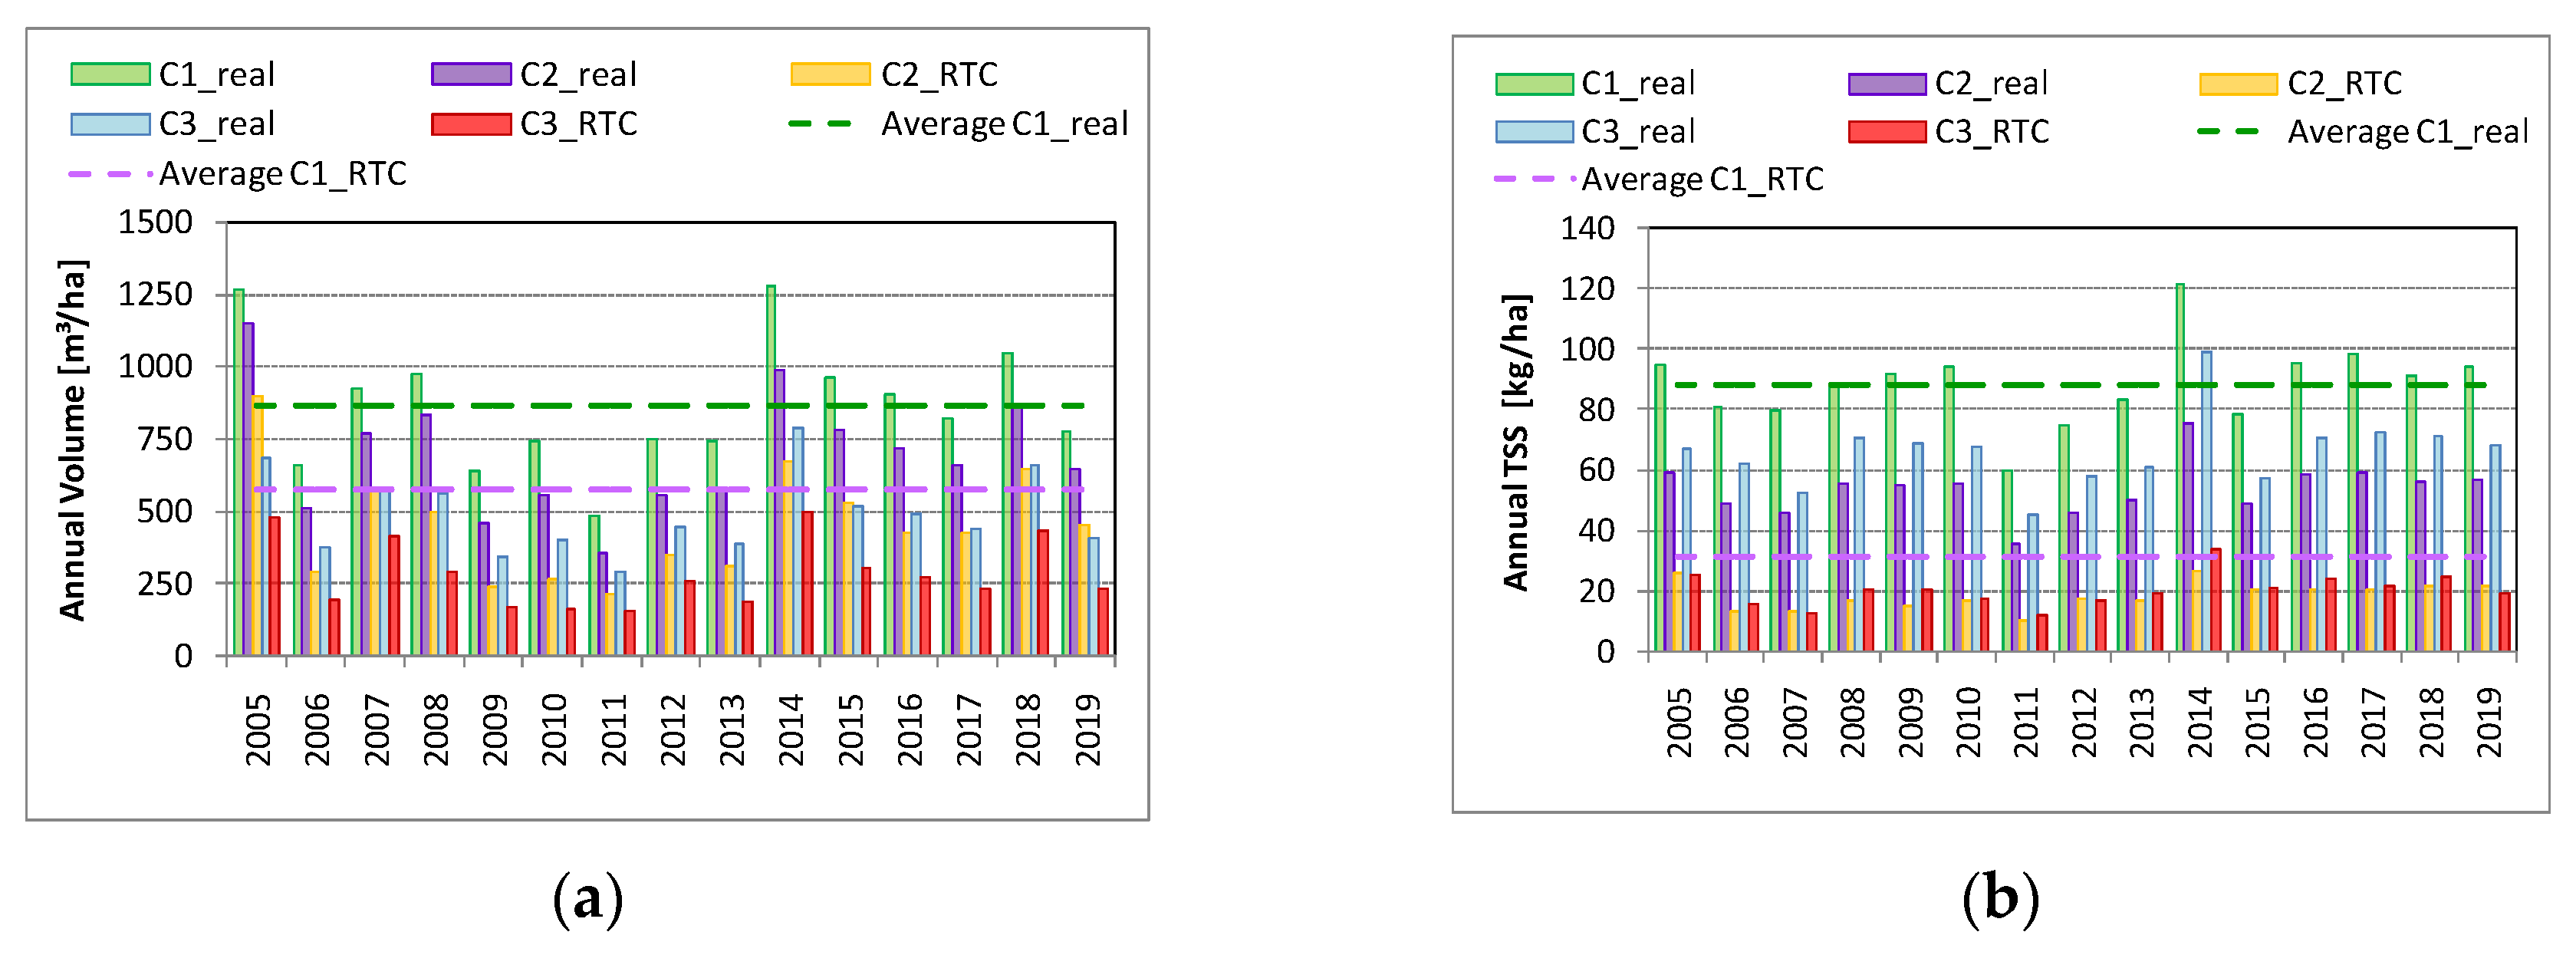
| C1real | 864 | 88 | / | / |
| C RTC | 571 | 31 | 34% | 65% |
| C2real | 692 | 54 | 20% | 39% |
| C2RTC | 474 | 18 | 45% | 79% |
| C3real | 489 | 66 | 43% | 25% |
| C3RTC | 283 | 20 | 67% | 77% |
| C4real | 285 | 65 | 67% | 76% |
| C4RTC | 186 | 21 | 78% | 93% |
| C5areal | 376 | 40 | 56% | 54% |
| C5aRTC | 24 | 1 | 97% | 99% |
| C5breal | 336 | 39 | 61% | 56% |
| C5bRTC | 24 | 1 | 97% | 99% |
Publisher’s Note: MDPI stays neutral with regard to jurisdictional claims in published maps and institutional affiliations. |
© 2020 by the authors. Licensee MDPI, Basel, Switzerland. This article is an open access article distributed under the terms and conditions of the Creative Commons Attribution (CC BY) license (http://creativecommons.org/licenses/by/4.0/).
Share and Cite
Altobelli, M.; Cipolla, S.S.; Maglionico, M. Combined Application of Real-Time Control and Green Technologies to Urban Drainage Systems. Water 2020, 12, 3432. https://doi.org/10.3390/w12123432
Altobelli M, Cipolla SS, Maglionico M. Combined Application of Real-Time Control and Green Technologies to Urban Drainage Systems. Water. 2020; 12(12):3432. https://doi.org/10.3390/w12123432
Chicago/Turabian StyleAltobelli, Margherita, Sara Simona Cipolla, and Marco Maglionico. 2020. "Combined Application of Real-Time Control and Green Technologies to Urban Drainage Systems" Water 12, no. 12: 3432. https://doi.org/10.3390/w12123432
APA StyleAltobelli, M., Cipolla, S. S., & Maglionico, M. (2020). Combined Application of Real-Time Control and Green Technologies to Urban Drainage Systems. Water, 12(12), 3432. https://doi.org/10.3390/w12123432