Article

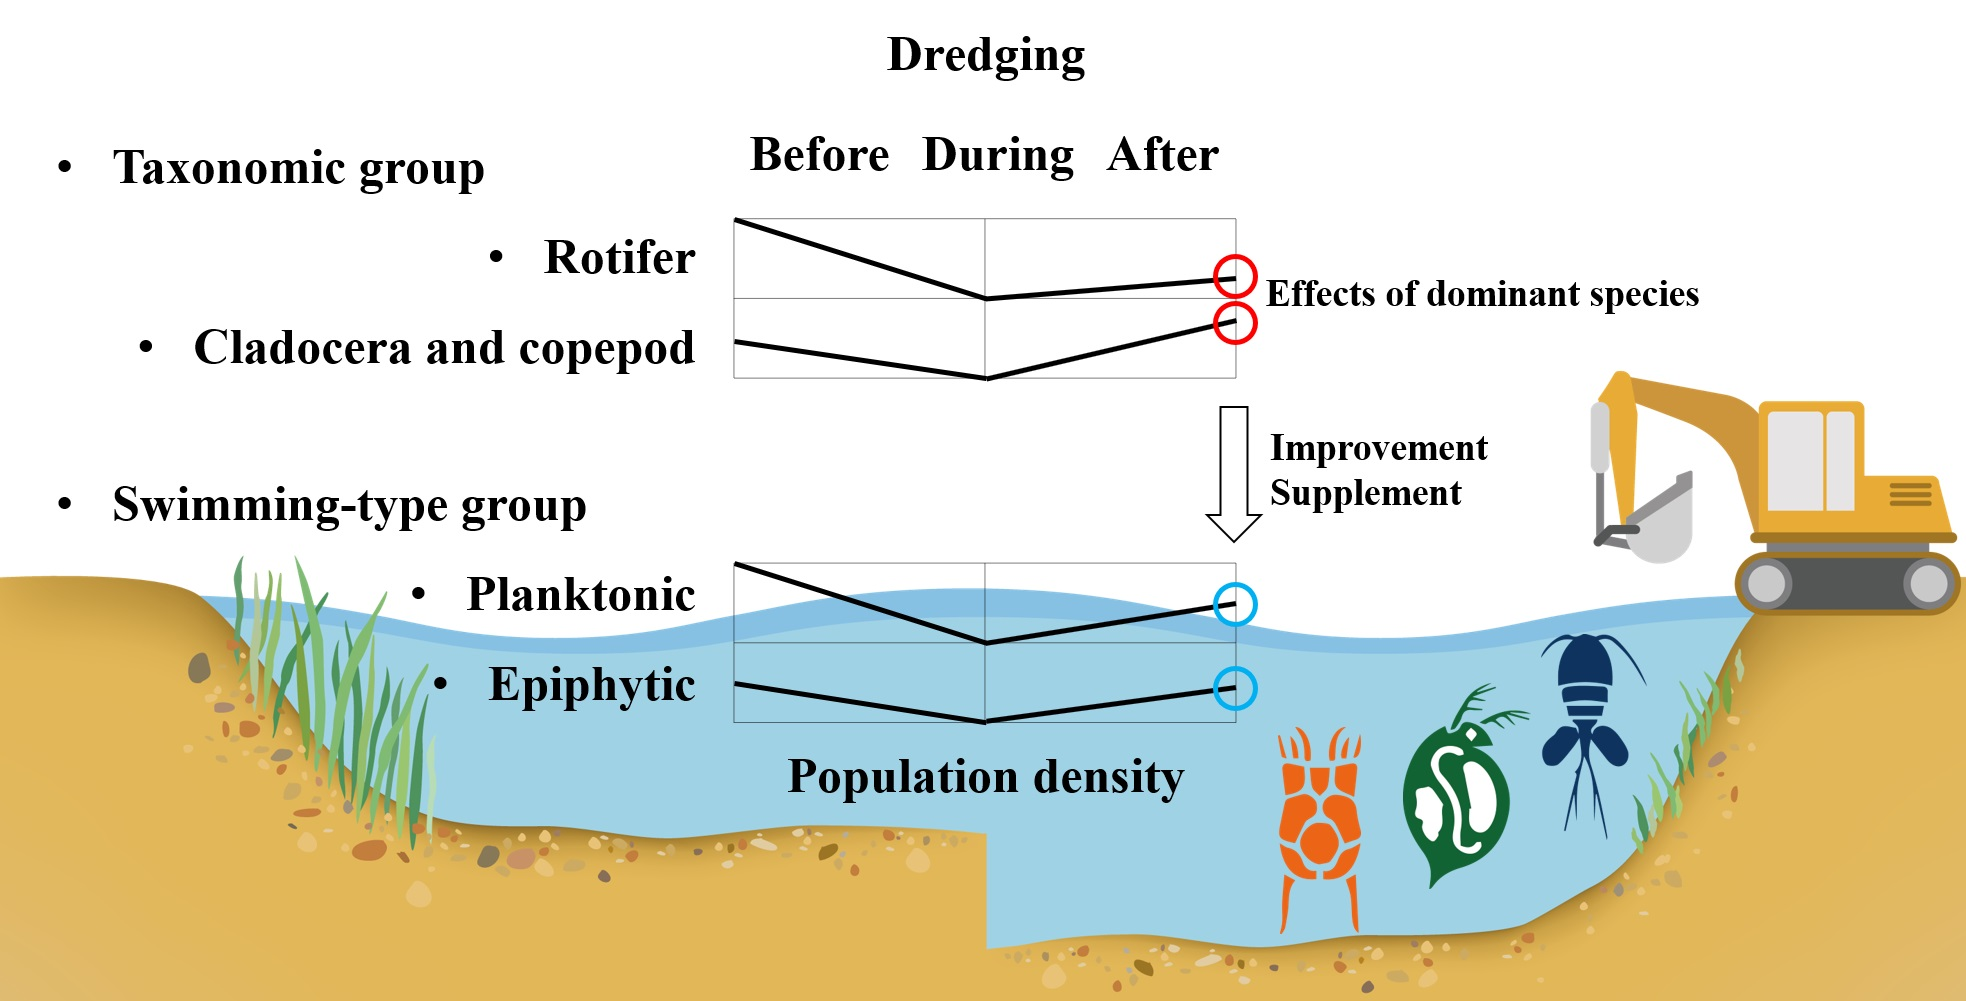
Comparison of Zooplankton Community Patterns in Relation to Sediment Disturbances by Dredging in the Guemho River, Korea

1
Department of Biological Science, Pusan National University, Busan 46241, Korea
2
K-water Institute, Daejeon 34350, Korea
3
Department of Environmental Education, Sunchon National University, Suncheon 57922, Korea
*
Authors to whom correspondence should be addressed.
Water 2020, 12(12), 3434; https://doi.org/10.3390/w12123434
Submission received: 2 November 2020 / Revised: 2 December 2020 / Accepted: 4 December 2020 / Published: 7 December 2020
(This article belongs to the Section Biodiversity and Functionality of Aquatic Ecosystems)

Abstract

:
This study aimed to determine whether a swimming-type (planktonic and epiphytic) zooplankton group compared with the taxonomic group is appropriate to indicate the environmental changes caused by dredging. Water sampling in the littoral zone was conducted from 2007 to 2015, including the dredging period from October 2010 to June 2012. The water quality, number of species, population densities, and biotic indices were compared for both dredging period and grouping type. Nine of 11 water quality parameters were changed by the dredging period. The results showed that the rotifer and planktonic groups were consistently dominant. In all groups, population density was the lowest during the dredging period. After dredging, both the number of species and population density increased only in the epiphytic group. The dominant species, including Polyarthra vulgaris, Brachionus calyciflorus, B. rubens, and Bosmina longirostris, were included in the planktonic group for 9 years. Evenness did not differ, but diversity increased after the dredging period. This study showed that zooplankton could be used as a supplemental biological assessment tool for evaluating the impact of river dredging.

Graphical Abstract

1. Introduction

Globally, dredging is a major artificial disturbance in freshwater ecosystems [1,2,3,4,5]. Dredging has been conducted continuously to transport people and supplies using vessels in estuaries [6,7]. It has also been conducted to improve the water quality that has been deteriorated by organic matter deposited from aquatic organisms and outside-inflow in lakes [8]. The impact of dredging in aquatic ecosystems is diverse. Eliminating the deposited ground soil results in a deep water level [4], which has implications for the disappearance of specific habitats [9]. Dredging can result in an increase [10] or decrease [11] in the total phosphate level. In other cases, such as water quality (i.e., conductivity, Secchi-transparency, suspended solids, and chlorophyll-a), parameters are caused to fluctuate by dredging disturbances [10,11].
The densities of mussels and macroinvertebrates are also reduced by dredging [12,13]. Sessile and swimming organisms show changes in the diversity index (zooplankton: [10,11], fish: [5,14]). The dredging effect can be different, even in the same ecological group. Lotic species are replaced by lentic species because of physicochemical alterations in the aquatic environment [5,15]. Collectors, gatherers, and grazers in the functional feeding group (FFG) of benthic macroinvertebrates are reduced due to the alteration of sediments, whereas shredders and decomposers of FFG are increased. These changes affect the upper predator communities that consume benthic animals [4,5,16,17]. In the case of zooplankton, the density of the rotifer population is reduced after dredging, but the density of the cladoceran population is increased in lakes [10,11].
Assessments of morphological and hydrological changes in a river caused by dredging cannot identify the watersheds within a dredging area [18]. The biotic community was essentially utilized to provide general information in an aquatic ecosystem because the biotic community is affected by the watersheds [19]. Furthermore, a biological assessment method for the aquatic environment is limited at the taxon level, including only the major biotic index. Macroinvertebrates, as a universal biotic index, are representative taxa that show the saprobity in rivers [20,21]. The index of biological integrity (IBI) is used to assess the river using fish. Recently, periphytic algae and macrophytes have also been utilized because they cannot move; therefore, the accumulated impact of environmental variations can be considered [22,23]. Zooplankton are present in all aquatic ecosystems, regardless of the season [24,25,26,27,28]. They can respond rapidly to the environment because of their short life cycle [29,30]. In addition, an approach based on species as an evaluation criterion is limited [31,32] because physiological and ecological comprehension is restricted. Nevertheless, zooplankton, as a secondary producer in rivers, play an important role in delivering the nutrients of the primary producer to the upper trophic level [33], making it essential to understand the alteration of rivers.
This study hypothesized that species classification, according to the swimming-type group (planktonic and epiphytic), would better indicate the environmental changes caused by dredging than the changes in zooplankton taxa (rotifers, cladocerans, and copepods). In particular, epiphytic species would have more negative responses than planktonic species because dredging causes direct disturbances to the substrates of the habitat. To test this hypothesis, the following were determined: (1) the effects of dredging on the river through changes in the water quality parameters, (2) community changes according to the taxonomic group, and (3) community changes according to the swimming-type group.

2. Materials and Methods

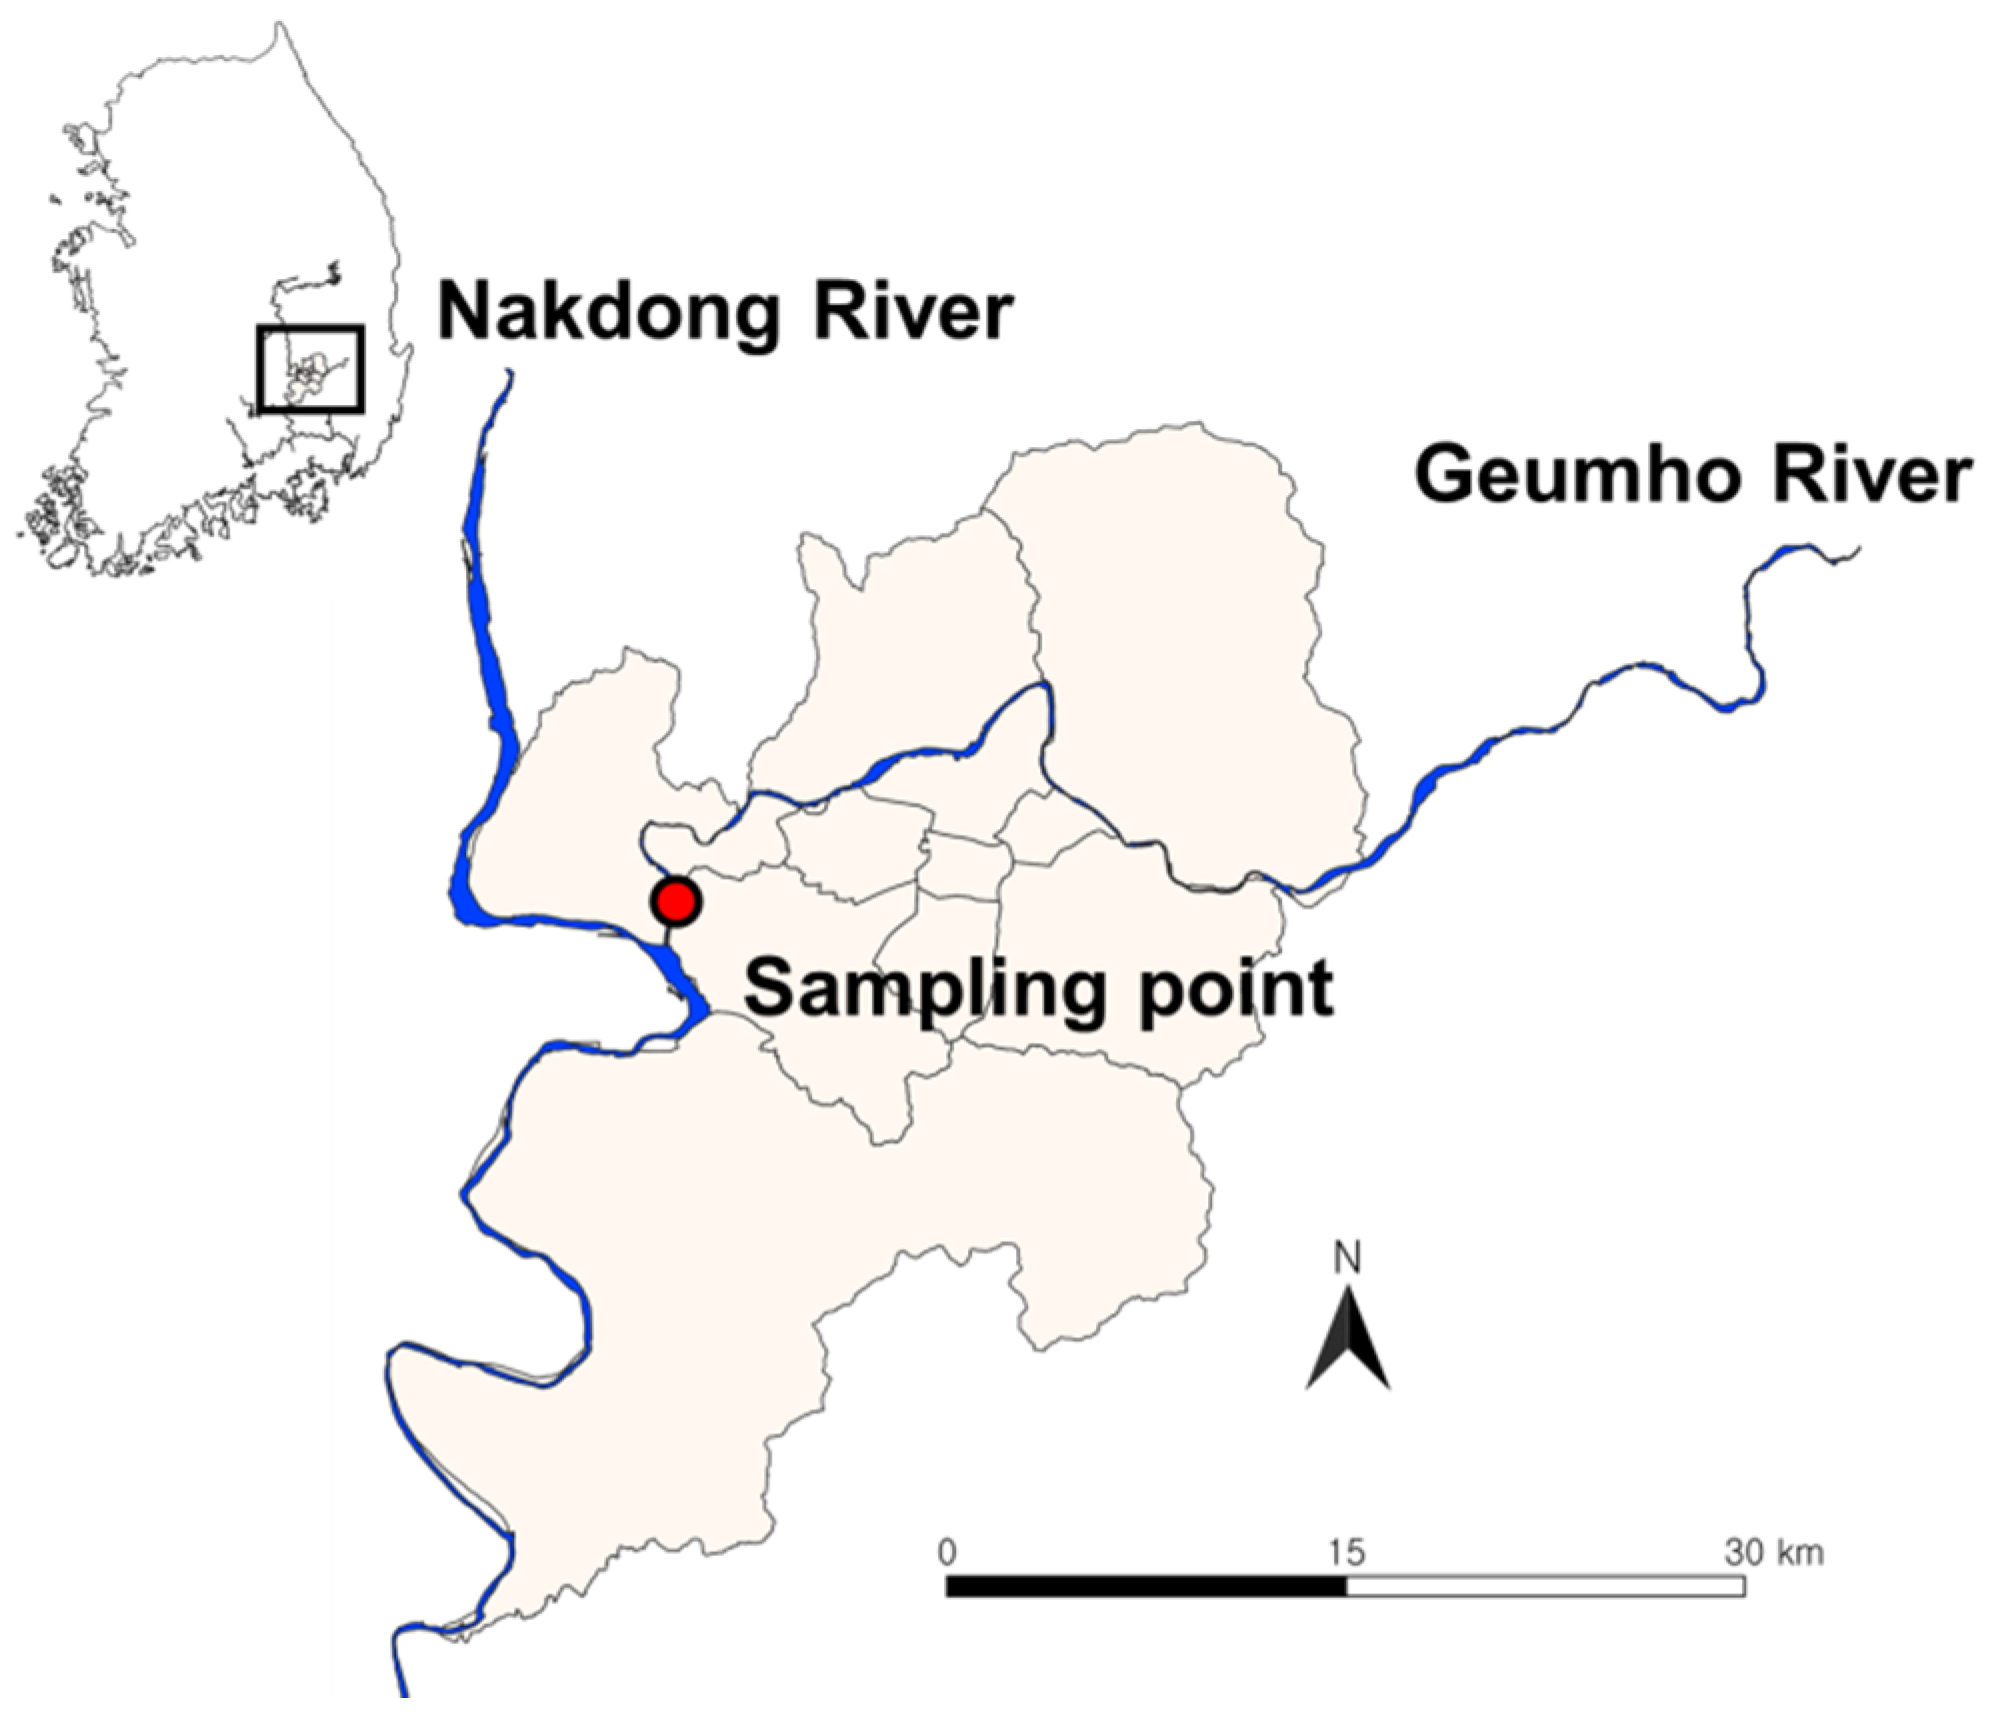
2.1. Description of the Study Site

The Geumho River is the second largest tributary of the Nakdong River (approximately 520 km long) in the southeastern region of Korea (Figure 1). Its length is 117.5 km, and it has a catchment area of 2087.9 km2. This river was changed considerably by the Eco River Development Project (ERDP) as a part of the Four Large River Projects [14] from October 2010 to June 2012. The ERDP cost approximately 2.5 billion USD and aimed to improve the water quality, produce a citizen-friendly river basin, and restore the overall Geumho River ecosystem. To achieve these goals, major processes included dredging the benthic littoral area and installing weirs. The specific survey point (N 35°51′, E 128°28′) was 4 km upstream from the Nakdong River confluence and at the end of the ERDP region.

2.2. Water Quality and Hydrological Dataset

The zooplankton sampling site corresponded to one of the national water quality measurement points. The biweekly or monthly measured dataset from the Water Environment Information System [34] from January 2007 to December 2015 was used. The water quality data consisted of ten parameters: water temperature (°C), pH, dissolved oxygen (mg/L), conductivity (Cond, µS/cm), biological oxygen demand (BOD, mg/L), chemical oxygen demand (COD, mg/L), suspended solids (SS, mg/L), total nitrogen (T-N, mg/L), total phosphate (T-P, mg/L), and chlorophyll-a (Chl-a, µg/L). In addition, a daily discharge (m3/s) dataset was obtained from the Water Resources Management Information System [35] for the same period.

2.3. Sampling for Zooplankton Identification

Zooplankton sampling was conducted biweekly for nine years from January 2007 to December 2015. We collected 218 zooplankton samples. Zooplankton in the littoral zone were collected in 4–8 L water samples at 0.5 m depth. The samples were filtered through a 32 µm nylon mesh and preserved with 100 mL of 5% sucrose formalin. The zooplankton samples were gently mixed. Aliquots of a known volume were removed, and the number of animals was counted. Identification was conducted using an optical microscope at ×40–×100 magnification. Zooplankton taxa were identified at the genus or species level, with the exception of the juvenile copepods [36,37,38]. The zooplankton were categorized by taxon (rotifers, cladocerans, and copepods) and the swimming-type group [39,40,41,42]. The dominant species were classified according to population density.

2.4. Data Analysis

To identify the changes in water quality and zooplankton community composition over time in relation to ERDP, the sampling period was divided into the following three periods: before the ERDP (from January 2007 to September 2010), during the ERDP (from October 2010 to June 2012), and after the ERDP (from July 2012 to December 2015). Carlson’s trophic state index (TSI) was calculated using T-P and Chl-a data [43]. Eleven parameters of water quality, TSI, and zooplankton composition were analyzed using a Kruskal–Wallis test (sampling site) to compare the average dataset according to the ERDP period and according to the normality of the data distribution (Levene’s test, p < 0.05). Kendall’s Tau-B test was used to test the correlation between zooplankton data and water quality dataset, with the exception of the copepods data. Statistical analysis was performed using SPSS (version 25.0, IBM, Armonk, Armonk, New York, NY, USA). The potential total number of species at the sampling point was confirmed using a rarefaction curve using the Paleontological Statistics (PAST) program (Palaeontologia Electronica, version 2.17c) [44]. The sample-based rarefaction curves were plotted to calculate the expected maximum number of species. The time-series data collected in the field were used to determine the presence or absence of species. The diversity index (Shannon diversity index, H’) and evenness index (Pielou’s evenness index, J’) were calculated using the PAST program to analyze the detailed community structure considering the dominant species [45,46]. The biotic index divided by the ERDP period was compared using the Kruskal–Wallis test.
Shannon   diversity   index   ( H ) ,     H   = P i lnP i   ( P i = N i / N )
Pielou s   evenness   index   ( J ) ,     J   = H / log e S
N: total population, Ni: population of class i, S: total number of species.

3. Results

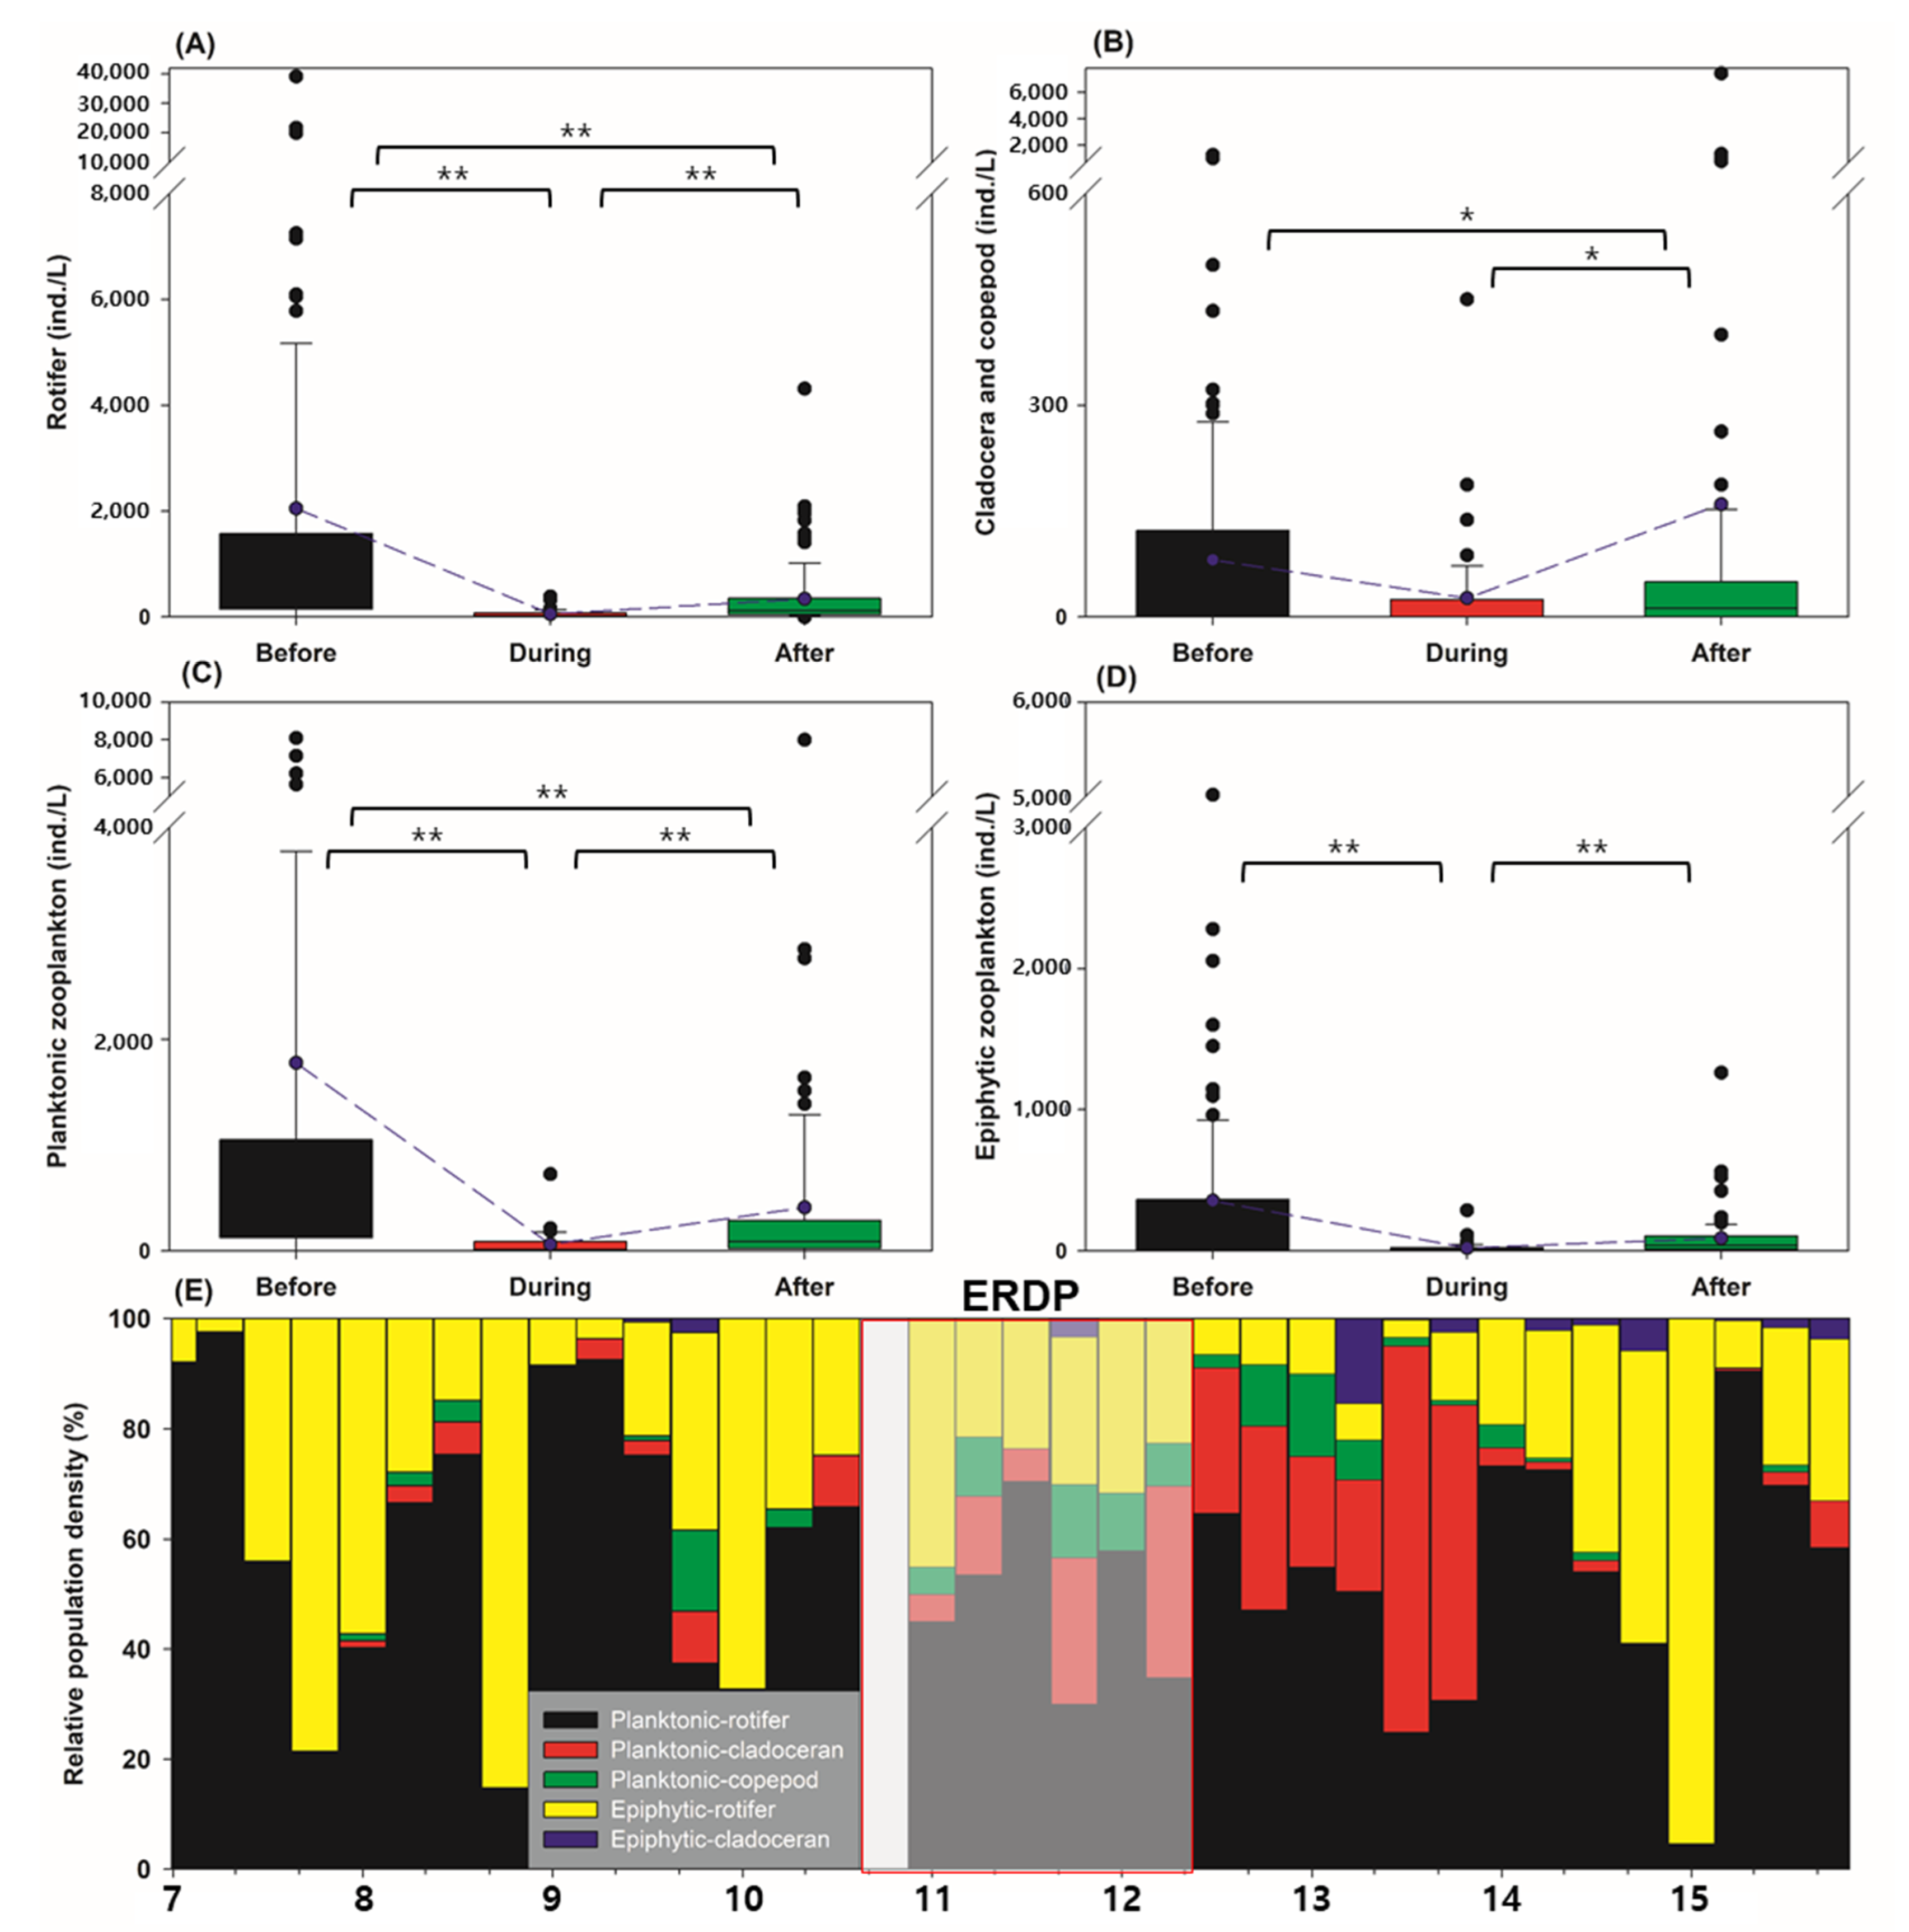
3.1. Dredging Effect on the Water Quality Parameters

Dredging changed the aquatic environment. After dredging, nine of the eleven mean water quality parameters and TSI of T-P showed significant fluctuations according to the ERDP period (with the exception of BOD, T-N and TSI of Chl-a; Table 1). During the dredging period, the SS level doubled but returned to its original state after dredging (p < 0.001). The water temperature decreased during the ERDP period but returned to its original temperature (p < 0.05). Chlorophyll-a did not show a significant difference after being reduced during the construction period (p < 0.05). The pH and DO increased after construction (before-after: p < 0.01; during-after: p < 0.05). The conductivity and COD decreased during the ERDP, and these states were maintained (before-during: p < 0.05; before-after: p < 0.01 (Cond) and p < 0.05 (COD)). The T-P, discharge, and TSI of T-P decreased steadily during and after dredging (p < 0.01).

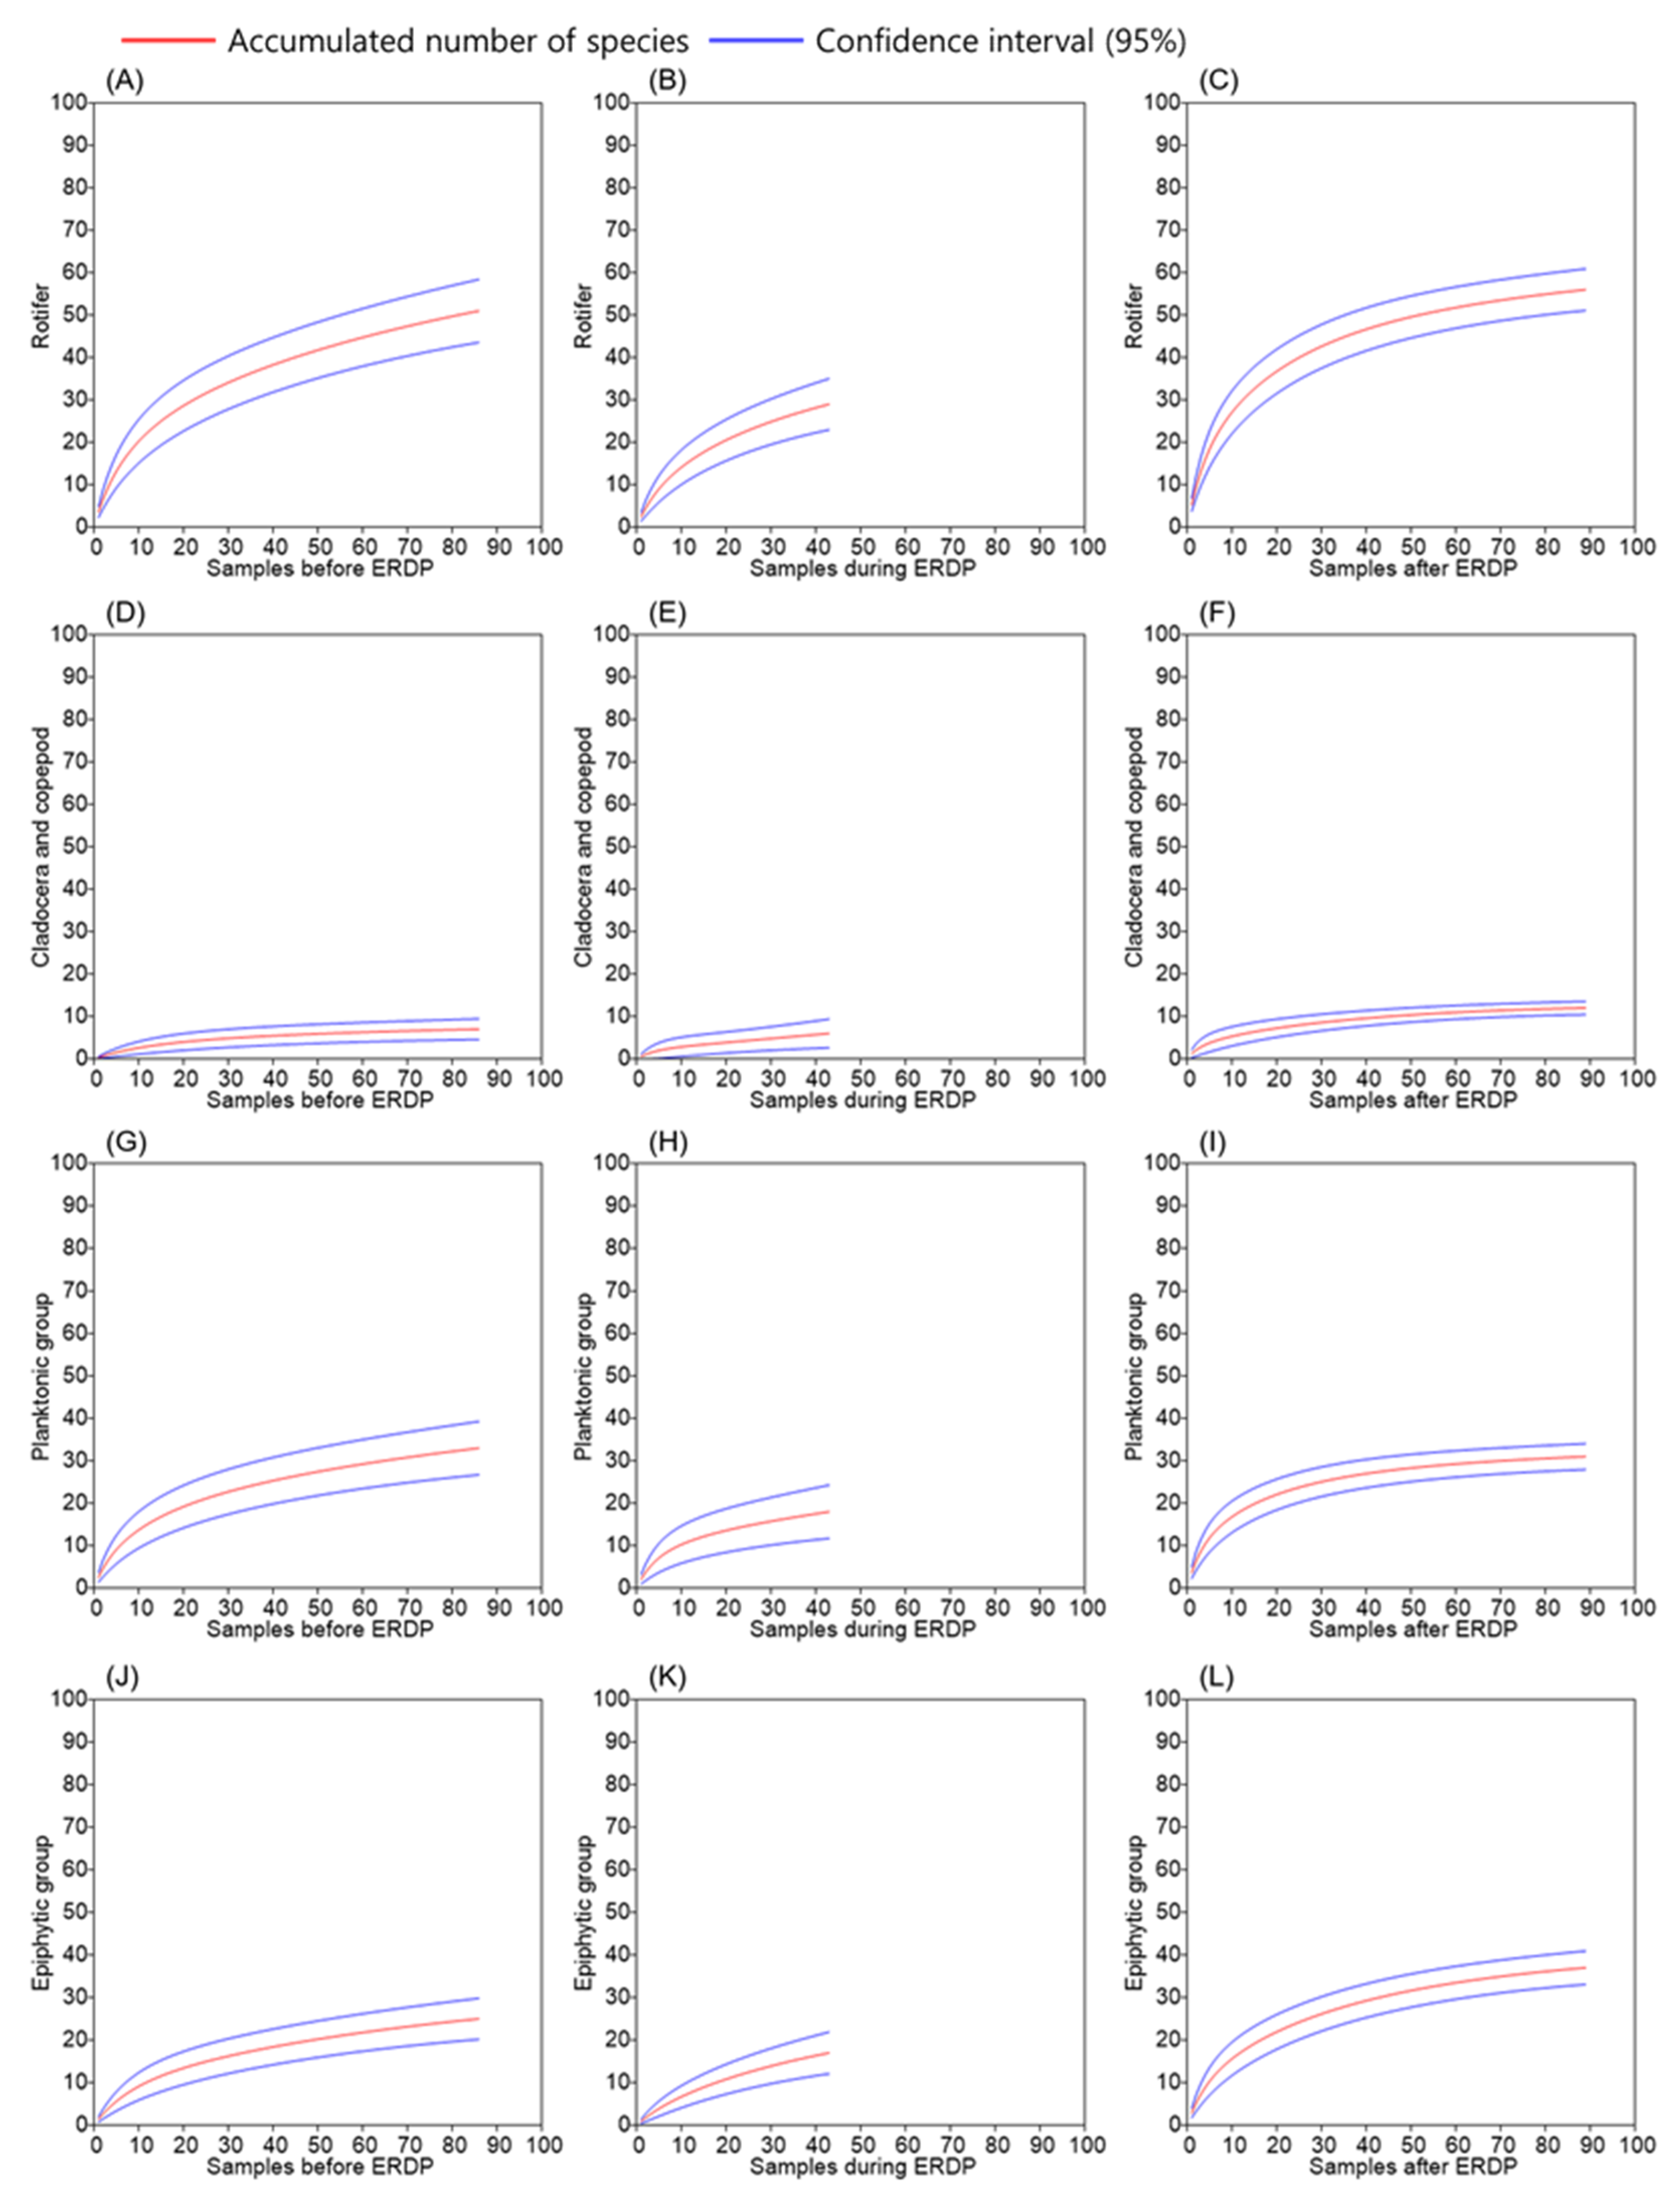
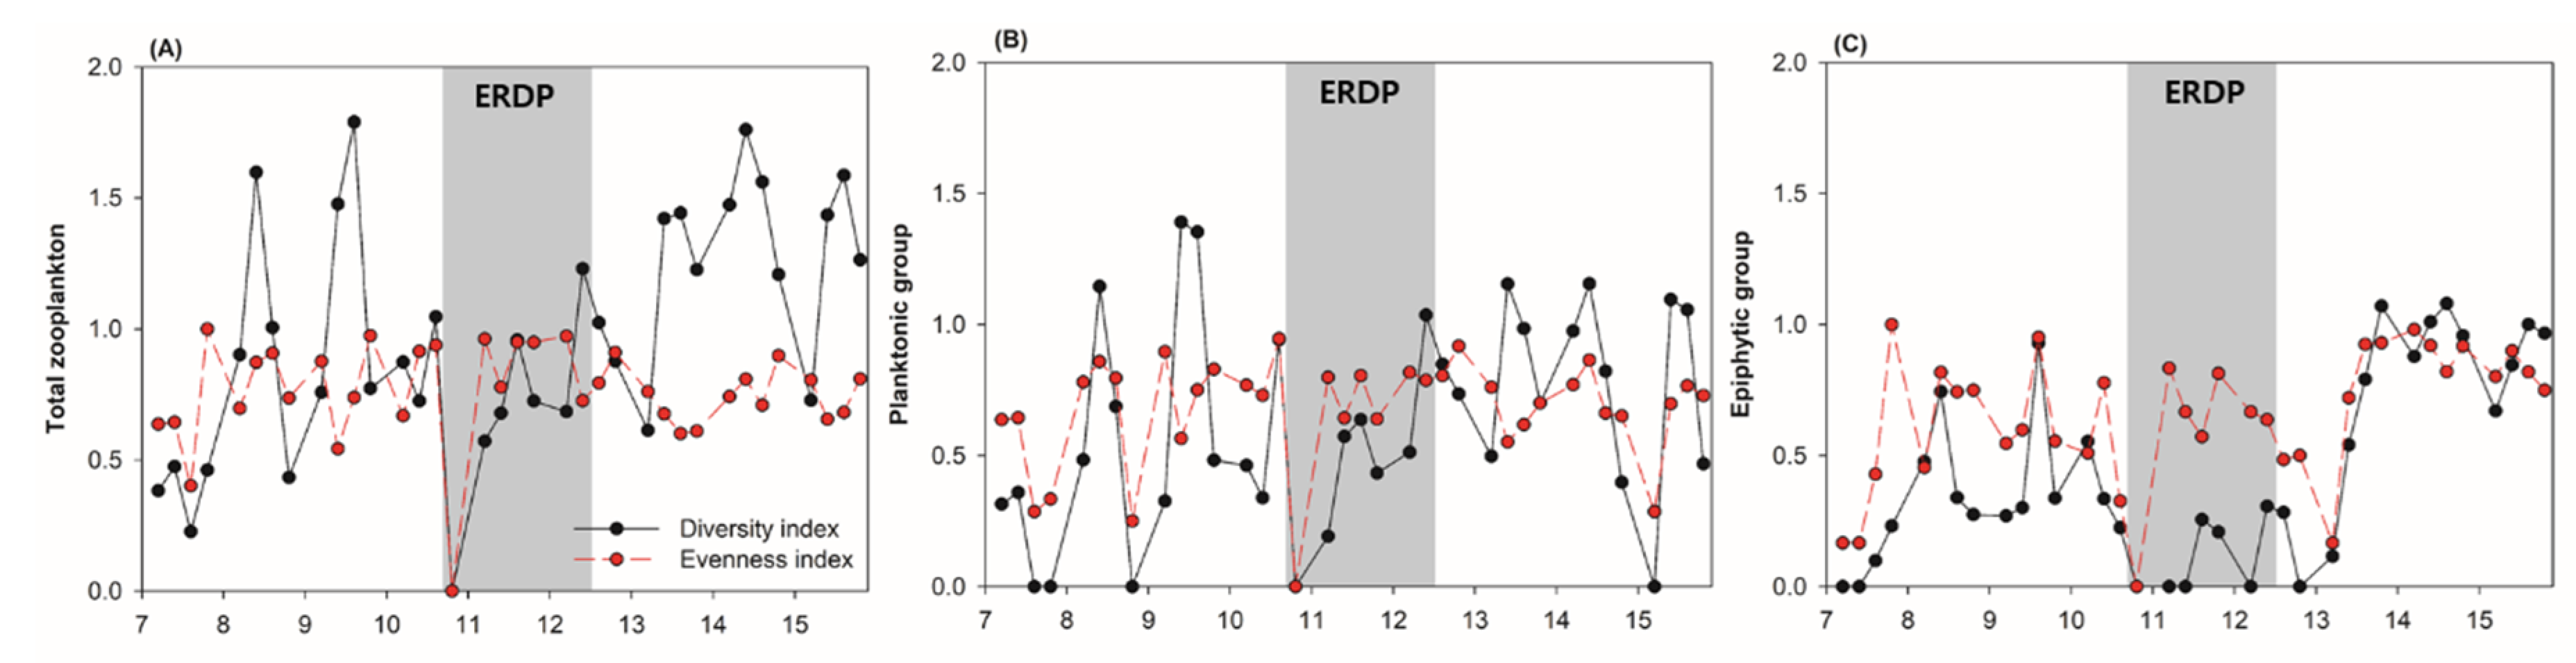
3.2. Differences between the Responses of Zooplankton Groups to Dredging

Two hundred and eighteen observations were collected from the sampling site during a period of nine years. The number of zooplankton species was 85 during 2007–2015 (Table 2; rotifers: 71; cladocerans: 12; copepods: 2). Fifty-eight, thirty-five, and sixty-eight species were observed before, during, and after the ERDP appeared, respectively. The mean population density was 1061.1 ind./L for nine years, but the fluctuation of the values was significant during the ERDP period (p < 0.001; before: 2130.3 ind./L, during 83.1 ind./L, after: 500.6 ind./L). The dominant taxonomic group was in the order of rotifers (958.8 ind./L), cladocerans, and copepods (102.3 ind./L). The mean population density of the rotifers fluctuated according to the ERDP period (Figure 2A). Particularly over the dredging period, their population density decreased up to 23.5% (p < 0.001; before: 2049.3 ind./L, during 56.4 ind./L, after: 341.0 ind./L). In contrast to rotifers, the mean population density of cladocerans and copepods increased up to 97.1% after dredging (Figure 2B; p = 0.001; before-after: p = 0.005; during-after: p = 0.008). Interestingly, there was no significant difference in the mean population density before and during dredging (p > 0.05).
Forty-one species belonged to the planktonic group (rotifers: 32; cladocerans: 7; copepods: 2). The number of species decreased during dredging and increased after ERDP but could not recover to their original state (33, 18, and 31 species before, during, and after the ERDP, respectively). Forty-four species belonged to the epiphytic group (rotifers: 39; cladocerans: 5). The number of species decreased during dredging but increased and exceeded the original number after ERDP (25, 17, and 37 species before, during, and after the ERDP, respectively). The mean population density of the planktonic and epiphytic types for nine years was 880.2 ind./L and 181.0 ind./L, respectively. The planktonic group showed significant changes in the population density before and after, but similar to the number of species, they did not reach the average population density before construction (Figure 2C). The epiphytic group showed similar patterns to the planktonic group, but their population density recovered after ERDP (Figure 2D). In particular, no zooplankton appeared from October to December 2010 (Figure 2E), and the dominant period of the planktonic group was four times longer than that of the epiphytic group.
Significant correlation coefficients (p < 0.05) were shown in ten of eleven water quality parameters (except the DO) in all groups. Water quality parameters with many related groups were in the order of WT, Chl-a, pH, T-P = BOD, COD = T-N, discharge, SS, and Cond. The high correlation coefficients were concentrated in Chl-a and WT, and the low correlation coefficients was concentrated in T-P and T-N. Comparison identified a positive relationship between TSI of Chl-a and zooplankton groups. In all groups, rotifers showed the highest positive correlation in the number of species (planktonic rotifer; p < 0.001, b = 0.492) and population density (planktonic rotifer; p < 0.001, b = 0.558). TSI of T-P had negative correlations with zooplankton groups. In particular, cladocerans showed the lowest negative correlation in the total number of species (p < 0.001, b = −0.434) and epiphytic population density (p = 0.002, b = −0.403).
The dominant species in the Geumho River consistently belonged to the planktonic group (Table 3). During the dredging period, the dominant species changed. The mean population of Polyarthra vulgaris decreased dramatically by 98.6% and increased by 936% (before: 692.8 ind./L; during: 9.6 ind./L; after: 89.9 ind./L), but this could not recover to the previous status. Although dredging also affected the Bosmina longirostris population (before: 40.3 ind./L; during: 18.9 ind./L; after: 123.9 ind./L), their population prosperity increased compared to that in the existing environment. Finally, dredging altered the Brachionus calyciflorus, and B. rubens were excluded from the dominant species, including Keratella cochlearis and B. longirostris.
The taxonomic group and swimming-type group showed different patterns according to the stage of the ERDP (Figure 3). Regardless of the ERDP period, rotifers showed more diversity in species numbers than the cladocerans and copepods (Figure 3A–F). Rarefaction curves of the rotifers had a steeper slope than that of the cladocerans and copepods, indicating that there was a high likelihood that more rotifers would be found in a further investigation. Cladocerans and copepods appeared to converge despite the small number of species. As habitat types, the number of species reacted differently (Figure 3G–L). Before dredging, the planktonic species formed more diverse communities, but the situation was reversed after dredging. After dredging, seven planktonic species appeared, but the total number of species decreased by two. During the same period, 19 new types of epiphytic species were found, and the total number of species increased by 12.
Overall, the number of species after the ERDP was higher than before, but the mean population density decreased. Therefore, H’ after ERDP was higher than before ERDP (Figure 4A, p = 0.003). J’ did not show a significant difference according to the ERDP period (Figure 4A, p = 0.055). In detail, none of the swimming-type communities showed statistical differences in J’ according to the period (Figure 4B, planktonic p = 0.576; Figure 4C, epiphytic p = 0.250), whereas H’ showed significant differences in all communities (Figure 4B, planktonic p = 0.018; Figure 4C, epiphytic p < 0.001). In particular, the H’ of epiphytic species was consistently high after the ERDP (before-after p < 0.001, during-after p < 0.001).

4. Discussion

4.1. Is Swimming-Type Classification Effective in Explaining the Dredging Effect?

Dredging is a common disturbance in aquatic ecosystems. Changes of zooplankton community associated with dredging have been widely studied [10,11,47]. Water quality and nutrient variation in conjunction with dredging have a cascading effect on phytoplankton and zooplankton. Dominant species associated with eutrophic state changed into less eutrophic species [11]. In this respect, correlation analysis results showed that zooplankton was influenced by WT [48], but a food source (i.e., Chl-a) and nutrients (i.e., T-P and T-N) were more critical factors to specific zooplankton groups when they were subdivided into swimming type. In fact, these results were also confirmed by TSI. Although TSI of both Chl-a and T-P showed a relationship with specific zooplankton groups, it was difficult to extract patterns from analyzing long-term and multivariate data because the relationship of the independent variables to the dependent variables is not linear [48]. The results of this study suggest that it will be helpful to utilize zooplankton as a bioindicator to identify physicochemical factors [11,49]. Classification based on swimming type rather than conventional taxonomy could be more effective in explaining effects of dredging disturbance, and in consideration of physicochemical factors in addition to as habitat factors.
Considering that the trophic status in a waterbody is a critical factor affecting the zooplankton community, changes in the environmental conditions caused by dredging might lead to changes in the zooplankton community [18,49]. Although planktonic and epiphytic groups showed similar decreasing rates in population densities due to dredging (Figure 2C,D; planktonic: 76.9% reduction; epiphytic: 74.7% reduction), in terms of species, the planktonic group showed a 6.1% reduction, but the epiphytic groups showed a 48.0% increase. Therefore, the overall species diversity increased. These results contrast with the expectation that direct substrate destruction by dredging decreases the diversity of the epiphytic group. Nonetheless, although diversity was increased, the evenness did not show significant differences in both the planktonic and epiphytic groups (Figure 4). Considering that all dominant species were included in the planktonic group, even if there was a decrease in the population density and fluctuations in the number of species, the dominant species still comprised a major portion of the planktonic group, and the epiphytic group was considered to have increased the overall population density. Therefore, zooplankton have a limitation in utilizing the assessment index from a taxonomic group approach [31,32], but like macroinvertebrates that are categorized as FFGs using an assessment index [50], swimming-type groups in zooplankton also could help better understand the changes in an ecosystem due to disturbances. This study showed that zooplankton could be used as a supplemental biological assessment tool for evaluating the impact of river dredging.

4.2. Is the Littoral Zone Collection Representative?

The waterbody in the littoral zone was effective in collecting both planktonic and epiphytic species. Collecting zooplankton did not require complicated tools. For survey purposes, researchers need to use a suitable size mesh net for filtering water [51]. In addition, zooplankton preferred a microhabitat with different species. This microhabitat was also subdivided into the pelagic zone, littoral zone, water column, sand, sediment, and substrates. Therefore, collection should be conducted after identifying the characteristics of the species. This study was also conducted in the littoral zone, which both planktonic and epiphytic groups inhabit because of the shallow water level and abundant substrates. Despite filtering the water, the epiphytic group was more abundant than the planktonic group in our results. Previous studies have collected epiphytic zooplankton [38,52,53], but the survey intensity and characteristics of the substrates affected the population density and the number of species [39,42]. To conduct a survey biweekly, consistency is important. In particular, the proficiency between researchers in a field survey needs to be considered. To effectively control the external variables, the littoral zone was chosen to consider the qualitative and quantitative representative sites simultaneously. Although the survey method had a shortcoming, the long-term data obtained through a consistent method could consider the characteristics of planktonic and epiphytic groups.

4.3. What Is the Application of Zooplankton as an Aquatic Ecosystem Health Evaluation Index?

Environmental alterations caused by dredging converted the Geumho River to an ecosystem that could accommodate more species compared to that before the dredging period. Previous studies also revealed that disturbance is one factor causing an increase in species diversity [54,55]. Dredging causes physical disturbances such as increasing SS [56,57]. In the case of the Geumho River, the SS and nine parameters reacted to the environmental conditions (Table 1). Hence, B. longirostris, emerging as the dominant species, flourished under optimal T-P levels [58]. The predominance of these cladocerans is a critical factor in community formation through predation and competition with rotifers [59]. After dredging, increasing population densities of B. longirostris have also been reported in other studies of dredging effects [10,11,59]. Polyarthra sp. regardless of dredging continued to be a dominant species. This is consistent with the phenomenon of highly polluted river ecosystems with no significant changes in T-N during our survey period [60]. In addition, the Geumho River has two features that are distinct from other studies: (1) After the dredging, the discharge decreased steadily (91.8% reduction in discharge before and after dredging). Due to the damming of the upper stream, the Geumho River has been regulated anthropogenically. However, the deep water level caused by dredging usually increases the discharge rate. A previous study of the Nakdong River, with which the Geumho River merges, showed that discharge and zooplankton population density have an inverse relationship [48]. The population density was not increased in every group despite dramatically reduced discharges in Geumho River. This phenomenon is more considered to be the result of habitat destruction due to dredging than the decrease in flow, particularly in the rotifer group [10,48]. (2) Zooplankton species did not appear at the beginning of dredging in the Geumho River (fourth quarter in 2010). This suggests that physical and morphological disturbances occurred (Figure 2E). Subsequently, influx processes from upstream and outside (drift) constructed a new ecosystem [61]. Although this study continued until 3.5 years after dredging was completed, the rarefaction curves show that both planktonic and epiphytic zooplankton groups underwent intensive invasion processes.
Studying zooplankton in the littoral zone can confirm the hypothetical food web pathway, including the aquatic decomposer pathway and algal-grazer food pathway [51,62]. In particular, this study showed significant differences in the swimming-type grouping. A study of the swimming-type community in the littoral zone is important to understand that zooplankton are a connecting link between producers (i.e., periphyton) [22,23] and upper consumers (i.e., macroinvertebrates and fish) [18,20,21]. Zooplankton are in an important position to become a missing food chain link among the stream health assessment indices. Therefore, understanding the zooplankton community through these approaches would overcome the shortcomings of using a species composition-based approach as an evaluation index [31,32].

Author Contributions

Conceptualization, H.-W.K. and G.-J.J.; methodology, E.-J.K. and D.-K.K.; software, G.-J.J.; validation, E.-J.K. and D.-K.K.; formal analysis, E.-J.K. and E.-S.J.; investigation, E.-J.K. and E.-S.J.; resources, H.-W.K. and G.-J.J.; data curation, E.-J.K. and E.-S.J.; writing—original draft preparation, E.-J.K.; writing—review and editing, H.-W.K. and G.-J.J.; visualization, E.-S.J. and Y.-J.H.; supervision, D.-K.K.; project administration, H.-W.K. All authors have read and agreed to the published version of the manuscript.

Funding

This research received no external funding.

Acknowledgments

We thank Freshwater Ecology Lab members at Pusan National University who share their ecological knowledge of limnology, especially Nakdong River basins.

Conflicts of Interest

The authors declare no conflict of interest.

References

  1. Meador, M.R.; Layher, A.O. Instream sand and gravel mining: Environmental issues and regulatory process in the United States. Fisheries 1998, 23, 6–13. [Google Scholar] [CrossRef]
  2. Davis, J.; Brid, J.; Finlayson, B.; Scott, R. The management of gravel extraction in alluvial rivers: A case study from the Avon River, southeastern Australia. Phys. Geogr. 2000, 21, 133–154. [Google Scholar] [CrossRef]
  3. Rovira, A.; Batalla, R.J.; Sala, M. Response of a river sediment budget after historical gravel mining (the lower Tordera, NE Spain). River Res. Appl. 2005, 21, 829–847. [Google Scholar] [CrossRef]
  4. Rempel, L.L.; Church, M. Physical and ecological response to disturbance by gravel mining in a large alluvial river. Can. J. Fish Aquat. Sci. 2009, 66, 52–71. [Google Scholar] [CrossRef]
  5. Freedman, J.A.; Carline, R.F.; Stauffer, J.R., Jr. Gravel dredging alters diversity and structure of riverine fish assemblages. Freshw. Biol. 2013, 58, 261–274. [Google Scholar] [CrossRef]
  6. Kenny, A.J.; Rees, H.L. The effects of marine gravel extraction on the macrobenthos: Early post-dredging recolonization. Mar. Pollut. Bull. 1994, 28, 442–447. [Google Scholar] [CrossRef]
  7. Spencer, K.L.; Dewhurst, R.E.; Penna, P. Potential impacts of water injection dredging on water quality and ecotoxicity in Limehouse Basin, River Thames, SE England, UK. Chemosphere 2006, 63, 509–521. [Google Scholar] [CrossRef] [PubMed]
  8. Ryding, S.O. Lake Trehörningen restoration project. Changes in water quality after sediment dredging. Hydrobiologia 1982, 91, 549–558. [Google Scholar] [CrossRef]
  9. Ricciardi, A.; Rasmussen, J.B. Extinction rates of North American freshwater fauna. Conserv. Biol. 1999, 13, 1220–1222. [Google Scholar] [CrossRef]
  10. Rehman, M.; Yousur, A.R.; Balkhi, M.H.; Rather, M.I.; Shahi, N.; Meraj, M.; Hassan, K. Dredging induced changes in zooplankton community and water quality in Dal Lake, Kashmir, India. Afr. J. Environ. Sci. Technol. 2016, 10, 141–149. [Google Scholar]
  11. Zhang, S.; Zhou, Q.; Xu, D.; Lin, J.; Cheng, S.; Wu, Z. Effects of sediment dredging on water quality and zooplankton community structure in a shallow of eutrophic lake. J. Environ. Sci. 2010, 22, 218–224. [Google Scholar] [CrossRef]
  12. Aldridge, D.C. The impacts of dredging and weed cutting on a population of freshwater mussels (Bivalvia: Unionidae). Biol. Conserv. 2000, 95, 247–257. [Google Scholar] [CrossRef]
  13. Lewis, M.A.; Weber, D.E.; Stanley, R.S.; Moore, J.C. Dredging impact on an urbanized Florida bayou: Effects on benthos and algal-periphyton. Environ. Pollutt. 2001, 115, 161–171. [Google Scholar] [CrossRef]
  14. Jo, H.; Jeppesen, E.; Ventura, M.; Buchaca, T.; Gim, J.S.; Yoon, J.D.; Kim, D.H.; Joo, G.J. Responses of fish assemblage structure to large-scale weir construction in riverine ecosystems. Sci. Total. Environ. 2019, 657, 1334–1342. [Google Scholar] [CrossRef] [PubMed] [Green Version]
  15. Bailly, D.; Cassemiro, F.A.; Winemiller, K.O.; Diniz-Filho, J.A.F.; Agostinho, A.A. Diversity gradients of Neotropical freshwater fish: Evidence of multiple underlying factors in human-modified systems. J. Biogeogr. 2016, 43, 1679–1689. [Google Scholar] [CrossRef]
  16. Harvey, B.C. Effects of suction gold dredging on fish and invertebrates in two California streams. N. Am. J. Fish Manag. 1986, 6, 401–409. [Google Scholar] [CrossRef]
  17. Brown, A.V.; Lyttle, M.M.; Brown, K.B. Impacts of gravel mining on gravel bed streams. Trans. Am. Fish. Soc. 1998, 127, 979–994. [Google Scholar] [CrossRef]
  18. Karr, J.R. Assessment of biotic integrity using fish communities. Fisheries 1981, 6, 21–27. [Google Scholar] [CrossRef]
  19. Won, D.H.; Jun, Y.C.; Kwon, S.J.; Hwang, S.J.; Ahn, K.G.; Lee, J.K. Development of Konan Saprobic Index using benthic macroinvertebrates and its application to biological stream environment assessment. Korean Soc. Mar. Environ. 2006, 22, 768–783. [Google Scholar]
  20. Pantle, R. Die biologische Uberwachung der Gewasser und die Darstellung der Ergebnisse. Gas. Und Wasserfach 1955, 96, 604. [Google Scholar]
  21. Woodwis, F. The biological system of stream classification used by the Trent River Board. Chem. Ind. 1964, 11, 443–447. [Google Scholar]
  22. Gómez, N.; Licursi, M. The Pampean Diatom Index (IDP) for assessment of rivers and streams in Argentina. Aquat. Ecol. 2001, 35, 173–181. [Google Scholar] [CrossRef]
  23. Miller, S.J.; Wardrop, D.H.; Mahaney, W.M.; Brooks, R.P. A plant-based index of biological integrity (IBI) for headwater wetlands in central Pennsylvania. Ecol. Indic. 2006, 6, 290–312. [Google Scholar] [CrossRef]
  24. Yoshida, T.; Urabe, J.; Elser, J.J. Assessment of ‘top-down’ and ‘bottom-up’ forces as determinants of rotifer distribution among lakes in Ontario, Canada. Ecol. Res. 2003, 18, 639–650. [Google Scholar] [CrossRef]
  25. Chang, K.H.; Doi, H.; Imai, H.; Gunji, F.; Nakano, S.I. Longitudinal changes in zooplankton distribution below a reservoir outfall with reference to river planktivory. Limnology 2008, 9, 125–133. [Google Scholar] [CrossRef]
  26. Baranyi, C.; Hein, T.; Holarek, C.; Keckeis, S.; Schiemer, F. Zooplankton biomass and community structure in a Danube River floodplain system: Effects of hydrology. Freshw. Biol. 2002, 47, 473–482. [Google Scholar] [CrossRef]
  27. Zhou, S.; Tang, T.; Wu, N.; Fu, X.; Cai, Q. Impacts of a small dam on riverine zooplankton. Intern. Rev. Hydrobiol. 2008, 93, 297–311. [Google Scholar] [CrossRef]
  28. Czerniawski, R. Zooplankton community changes between forest and meadow sections in small headwater streams, NW Poland. Biologia 2013, 68, 448–458. [Google Scholar] [CrossRef]
  29. Gurav, M.N.; Pejaver, M.K. Survey of rotifers to evaluate the water quality of the river Gadhi and its reservoir. Ecol. Environ. Conserv. 2013, 19, 417–423. [Google Scholar]
  30. Gutkowska, A.; Paturej, E.; Kowalska, E. Rotifer trophic state indices as ecosystem indicators in brackish coastal waters. Oceanologia 2013, 55, 887–899. [Google Scholar] [CrossRef]
  31. Gannon, J.E.; Stemberger, R.S. Zooplankton (especially crustaceans and rotifers) as indicators of water quality. Trans. Am. Microsc. Soc. 1978, 97, 16–35. [Google Scholar] [CrossRef]
  32. Saksena, D.N. Rotifers as indicators of water quality. Acta Hydrochim. Hydrobiol. 1987, 15, 481–485. [Google Scholar] [CrossRef]
  33. Pace, M.L.; Cole, J.J.; Carpenter, S.R.; Kitchell, J.F.; Hodgson, J.R.; Van de Bogert, M.C.; Bade, D.L.; Kritzberg, E.S.; Bastviken, D. Whole-lake carbon-13 additions reveal terrestrial support of aquatic food webs. Nature 2004, 427, 240–243. [Google Scholar] [CrossRef] [PubMed]
  34. Water Environment Information System (Korean). Available online: http://water.nier.go.kr (accessed on 2 February 2020).
  35. Water Resources Management Information System (Korean). Available online: http://wamis.go.kr (accessed on 19 November 2020).
  36. Koste, W. Rotatoria, Die Radertiere Mitteleuropas: Uberordnung Monogononta: Ein Bestimmungswerk (German Edition), 2nd ed.; Gebruder Borntraeger: Stuttgart, German, 1978. [Google Scholar]
  37. Smirnov, N.N.; Timms, B.V. A revision of the Australian Cladocera (Crustacean). Rec. Aust. Mus. Suppl. 1983, 1, 1–132. [Google Scholar] [CrossRef]
  38. Einsle, U. Crustacea, Copepoda: Calanoida und Cyclopoida. Susswasswefauna von Mitteleuropa; Gustav Fisher Verlag: Stuttugart, German, 1993; Volume 8, part 4-1. [Google Scholar]
  39. Sakuma, M.; Hanazato, T.; Nakazato, R.; Haga, H. Methods for quantitative sampling of epiphytic microinvertebrates in lake vegetation. Limnology 2002, 3, 115–119. [Google Scholar] [CrossRef]
  40. Einarsson, A.; Örnólfsdóttir, E.B. Long-term changes in benthic Cladocera populations in Lake Myvatn, Iceland. Aquat. Ecol. 2004, 38, 253–262. [Google Scholar] [CrossRef] [Green Version]
  41. De Troch, M.; Cnudde, C.; Vyverman, W.; Vanreusel, A. Increased production of faecal pellets by the benthic harpacticoid Paramphiascella fulvofasciata: Importance of the food source. Mar. Biol. 2008, 156, 469–477. [Google Scholar] [CrossRef]
  42. Choi, J.Y.; La, G.H.; Kim, S.K.; Jeong, K.S.; Joo, G.J. Zooplankton community distribution in aquatic plants zone: Influence of epiphytic rotifers and cladocerans in accordance with aquatic plants cover and types. J. Ecol. Environ. 2013, 46, 86–93. [Google Scholar] [CrossRef]
  43. Carlson, R.E. A trophic state index for lakes. Limnol. Oceanogr. 1977, 22, 361–369. [Google Scholar] [CrossRef] [Green Version]
  44. Hammer, Ø.; Harper, D.A.; Ryan, P.D. PAST: Paleontological statistics software package for education and data analysis. Palaeontol. Electron. 2001, 4, 9. [Google Scholar]
  45. Shannon, C.E. A mathematical theory of communication. Bell. Syst. Tech. J. 1948, 27, 379–423. [Google Scholar] [CrossRef] [Green Version]
  46. Pielou, E.C. The measurement of diversity in different types of biological collections. J. Theor. Biol. 1966, 13, 131–144. [Google Scholar] [CrossRef]
  47. Sullivan, B.K.; Hancock, D. Zooplankton and dredging: Research perspectives from a critical review. J. Am. Water. Resour. Assoc. 1977, 13, 461–468. [Google Scholar] [CrossRef]
  48. Kim, D.K.; Jeong, K.S.; Chang, K.H.; La, G.W.; Joo, G.J.; Kim, H.W. Patterning zooplankton communities in accordance with annual climatic conditions in a regulated river system (Nakdong River, South Korea). Intern. Rev. Hydrobiol. 2012, 91, 55–72. [Google Scholar] [CrossRef]
  49. Sládeček, V. Rotifers as indicators of water quality. Hydrobiologia 1983, 1, 169–201. [Google Scholar] [CrossRef]
  50. Rawer-Jost, C.; Böhmer, J.; Blank, J.; Rahmann, H. Macroinvertebrate functional feeding group methods in ecological assessment. Hydrobiologia 2000, 422, 225–232. [Google Scholar] [CrossRef]
  51. Thorp, J.H.; Covich, A.P. Ecology and Classification of North American Freshwater Invertebrates, 3rd ed.; Academic Press: Cambridge, MA, USA; Elsevier: Amsterdam, The Netherlands, 2009. [Google Scholar]
  52. Whiteside, M.C.; Williams, J.B. A new sampling technique for aquatic ecologists. Int. Ver. Theor. Angew. Limnol. 1975, 19, 1534–1539. [Google Scholar] [CrossRef]
  53. DiFonzo, C.D.; Campbell, J.M. Spatial partitioning of microhabitats in littoral cladoceran communities. J. Freshw. Ecol. 1988, 4, 303–313. [Google Scholar] [CrossRef]
  54. Suding, K.N. The effect of spring burning on competitive ranking of prairie species. J. Veg. Sci. 2001, 12, 849–856. [Google Scholar] [CrossRef]
  55. Suding, K.N.; Goldberg, D.E. Do disturbances alter competitive hierarchies? Mechanisms of change following gap creation. Ecology 2001, 82, 2133–2149. [Google Scholar] [CrossRef]
  56. Newell, R.C.; Seiderer, L.J.; Hitchcock, D.R. The impact of dredging works in coastal waters: A review of the sensitivity to disturbance and subsequent recovery of biological resources on the sea bed. Oceanogr. Mar. Biol. Annu. Rev. 1998, 36, 127–178. [Google Scholar]
  57. Cabrita, M.T. Phytoplankton community indicators of changes associated with dredging in the Tagus estuary (Portugal). Environ. Pollut. 2014, 191, 17–24. [Google Scholar] [CrossRef] [PubMed]
  58. Straile, D.; Geller, W. Crustacean zooplankton in Lake Constance from 1920 to 1995: Response to eutrophication and re-oligotrophication. Adv. Limnol. 1998, 53, 255–274. [Google Scholar]
  59. Tavernini, S.; Viaroli, P.; Rossetti, G. Zooplankton community structure and inter-annual dynamics in two sand-pit lakes with different dredging impact. Int. Rev. Hydrobiol. 2009, 94, 290–307. [Google Scholar] [CrossRef]
  60. Xiong, W.; Li, J.; Chen, Y.; Shan, J.; Wang, W.; Zhan, A. Determinants of community structure of zooplankton in heavily polluted river ecosystems. Sci. Rep. 2016, 6, 1–11. [Google Scholar] [CrossRef] [PubMed] [Green Version]
  61. Sandlund, O.T. The drift of zooplankton and microzoobenthos in the river Strandaelva, western Norway. Hydrobiologia 1982, 94, 33–48. [Google Scholar] [CrossRef]
  62. Thorp, J.H.; Delong, M.D. Dominance of autochthonous autotrophic carbon in food webs of heterotrophic rivers. Oikos 2002, 96, 543–550. [Google Scholar] [CrossRef]
Figure 1. Study site in the Geumho River in South Korea. The red dot is the sampling point.
Water 12 03434 g001
Figure 2. Mean population density with the standard error of taxonomic (A,B) and swimming-type (C,D) zooplankton community as ERDP (using Kruskal–Wallis test; ** p < 0.001, * p < 0.05) (blue dash line: mean population density (ind./L)). Relative rate (%) of collected zooplankton using the mean of 3 months data of the population density by each type (E) (red box: Eco River Development Project period, ERDP). No zooplankton appeared in the fourth quarter of 2010.
Water 12 03434 g002
Figure 3. Sample-based rarefaction curves using the population density in the sampling site (ERDP: Eco River Development Project). The red curves are the calculated rarefaction curves, and the blue curves are the 95% confidence interval. (AL): accumulative number of species found through survey results.
Water 12 03434 g003
Figure 4. Changes in the mean of the 3 months data of biotic index of zooplankton by swimming-type classification (gray area: Eco River Development Project). (AC): diversity index (black dot) and evenness index (red dot) of swimming-type classification in zooplankton.
Water 12 03434 g004
Table 1. Average water quality dataset and Carlson’s trophic state index (TSI) of the sampling site from 2007 to 2015 in Geumho River (mean ± standard error; DO, dissolved oxygen; BOD, biological oxygen demand; COD, chemical oxygen demand).
CategoryBefore ERDP
(n = 186)
During ERDP
(n = 84)
After ERDP
(n = 168)
* Water temperature (°C)17.32 ± 0.6014.95 ± 0.8317.94 ± 0.65
* pH7.87 ± 0.047.92 ± 0.048.14 ± 0.04
* DO (mg/L)10.52 ± 0.2110.61 ± 0.2611.66 ± 0.20
* Conductivity (µS/cm)825.76 ± 19.21719.73 ± 23.94700.38 ± 14.57
BOD (mg/L)3.66 ± 0.123.35 ± 0.163.67 ± 0.15
* COD (mg/L)9.17 ± 0.158.52 ± 0.218.53 ± 0.16
* Suspended solid (mg/L)11.93 ± 1.3022.93 ± 2.1011.43 ± 1.18
Total nitrogen (mg/L)7.06 ± 0.146.83 ± 0.186.56 ± 0.12
* Total phosphate (mg/L)0.62 ± 0.020.43 ± 0.010.11 ± 0.00
* Chlorophyll-a (µg/L)51.72 ± 3.4437.55 ± 3.5749.70 ± 3.58
* TSI (T-P)85.46 ± 0.3181.43 ± 0.3765.74 ± 0.38
TSI (Chl-a)60.39 ± 0.6456.88 ± 1.0359.20 ± 0.79
* Discharge (m3/s)* 414.08 ± 11.43
(n = 1369)
* 60.88 ± 21.88
(n = 637)
* 38.83 ± 2.94
(n = 1124)
* Statistically significant parameter.
Table 2. Classification of the swimming-type zooplankton.
Habitat CharacterTaxaSpecies
PlanktonicRotifersAnuraeopsis fissa
Asplanchna spp.
Brachionus angularis
Brachionus budapestinesis
Brachionus calyciflorus
Brachionus forticula
Brachionus rubens
Brachionus urceolaris
Brachionus sp.
Conochiloides dossuarius
Conochiloides spp.
Conochilus spp.
Euchlanis dilatata
Euchlanis sp.
Euchlanis triquetra
Filinia longiseta
Filinia terminalis
Hexarthra mira
Kelicottia longispina
Keratella cochlearis
Keratella quadrata
Keratella valga f. monstrosa
Keratella valga f. tropica
Keratella valga
Platyias patulus
Philodium roseola
Ploesoma lenticulare
Ploesoma tetractis
Polyarthra trigla
Polyarthra vulgaris
Polyarthra spp.
Pompholyx complanata
CladoceransBosmina longirostris
Ceriodaphnia spp.
Diaphanosoma brachyurum
Daphnia galeata
Daphnia spp.
Moina spp.
Scapholeberis kingi
Copepodscopepodacopepodid
EpiphyticRotifersBrachionus quadridentatus
Cephalodella spp.
Colurella uncinata
icuspidata
Colurella spp.
Dissotrocha acureata
Lecane aculeata
Lecane flexilis
Lecane haliclysta
Lecane leontina
Lecane luna
Lecane nana
Lecane sp.
Lepadella acumnata
Lepadella oblonga
Lepadella quadricarinata
Lepadella sp.
Monostyla bulla
Monostyla closterocerca
Monostyla crenata
Monostyla hamata
Monostyla lunaris
Monostyla pygmaea
Monostyla sp.
Mytilina ventralis
Notholca labis
Philodina spp.
Scaridium longicauda
Synchaeta spp.
Testudinella elliptica
Testudinella sp.
Trichocerca capucina
Trichocerca elongate
Trichocerca longiseta
Trichocerca pusilla
Trichocerca sp.
Trichotria tetractys
Trichocerca tenuior
Trichotria tetractys
Trichotria truncata
CladoceransAlona gutta
Alona rectangular
Alona sp.
Chydorus sphaericus
Pleuroxus spp.
Copepods-
Table 3. Dominant species and population density (mean ± standard error; PD: population density, ind./L).
CategoryBefore ERDPDuring ERDPAfter ERDP
SpeciesPDSpeciesPDSpeciesPD
1stP. vulgaris692.8 ± 328.8B. longristris18.9 ± 10.9B. longristris123.9 ± 75.0
2ndB. calyciflorus375.5 ± 166.5P. vulgaris9.6 ± 2.6P. vulgaris.89.9 ± 48.5
3rdB. rubens127.0 ± 33.7B. calyciflorus6.1 ± 2.2K. cochlearis45.1 ± 22.5
Publisher’s Note: MDPI stays neutral with regard to jurisdictional claims in published maps and institutional affiliations.

