Small Floodplain Reservoirs in the Face of Climate Change—Sink or Source of Nutrients?


Institute of Soil Science, Environment Engineering and Management, University of Life Sciences in Lublin, Leszczyńskiego St. 7, 20-069 Lublin, Poland
*
Authors to whom correspondence should be addressed.
Water 2020, 12(12), 3423; https://doi.org/10.3390/w12123423
Submission received: 4 November 2020
/
Revised: 30 November 2020
/
Accepted: 3 December 2020
/
Published: 5 December 2020
(This article belongs to the Section Water Quality and Contamination)
Abstract
:Despite various water protection measures, good water quality and reduction of nutrient loads seem very distant goals, largely due to limited knowledge of processes occurring in river valleys. Our study aimed at establishing the role of small floodplain reservoirs in the eutrophication processes, in the face of recent climate changes. The content of phosphorus and nitrogen compounds was determined in sediments and water of small floodplain reservoirs, (the Vistula River Valley, Poland) using spectrophotometric and Kjeldahl’s method. Nutrient loads in sediments were linked to the texture and total organic carbon content. Seasonal changes in water quality were strictly connected to changing weather conditions, flood and drought. The concentrations of PO43− and NO3− were found to rise after summer flooding. Increases in NH4+, total phosphorus (TP) and total nitrogen (TN) were correlated with the surface water area reduction in the reservoirs, which during the year of the study was on average 62%. Therefore, small floodplain reservoirs could be considered simultaneously as sinks and sources of nutrients. On the one hand, they accumulate P and N compounds carried by the river during the flood. On the other hand, climate change cause that small floodplain reservoirs may be responsible for enhanced biomass production.

1. Introduction
Phosphorus (P) and nitrogen (N) are important components of aquatic ecosystems. They are closely linked to the carbon cycle, determining the primary production and the mineralization of organic matter in water. Considered the main cause of eutrophication, these macronutrients are vital in the management of riverine and lacustrine ecosystems [1,2,3,4].
Eutrophication is a global-scale environmental issue responsible for water quality deterioration, toxic algal bloom, anoxia, and loss of biodiversity [5,6,7]. Inputs of N and P from natural sources are generally low and comprise P release from weathering rocks, leaching from soils and decomposed plant material, atmospheric deposition of N compounds, and biological N fixation through cyanobacteria [4,8,9]. The causes of eutrophication are primarily anthropogenic—processes of industrialization, urbanization and, to a considerable extent, intensification in agriculture. Other sources of anthropogenic inputs of nutrients to riverine systems are municipal and industrial wastewater, runoff from urban areas, increased atmospheric deposition of NOx due to burning of fossil fuels, agricultural fertilizers, increased soil leachate and erosion due to tillage [9,10,11,12].
In recent years, special measures have been taken to mitigate nutrient loads in rivers, specifically the improvement of wastewater treatment, banning phosphates in detergents or implementation of good management practices in agriculture [13,14,15]. However, their effects on water quality are often modest due to N and P accumulated in soils, groundwater, lakes and reservoirs, especially in floodplains. Although zones adjacent to rivers have proven to be especially effective in trapping nutrients, the processes occurring there have not been closely examined [4,16,17]. Therefore, riverine system management should be supported by research aimed at an in-depth investigation of floodplains, including river channels, riparian zones, wetlands and water bodies.
Small floodplain reservoirs are one of the least-studied elements of floodplains. Downing et al. [18] estimated that globally there are about 277 million lakes with a surface area <0.01 km2, which accounts for 16.5% of global lake area, however, due to their small size, these reservoirs tend to be underestimated and poorly examined. Many of those water bodies are located within the floodplains, in the close vicinity of the river and play an important role in retaining and transforming N and P compounds. The first source of nutrients is allochthonous input. Seasonal river water level fluctuations lead to the periodic connection and disconnection of the river channel and floodplain reservoirs, thus causing the exchange of chemically different water sources. Sediments of floodplain reservoirs become an N and P sink for the river, contributing to the improvement of river water quality [19]. Moreover, floodplain lakes trap nutrients and sediments from surface runoff, generally from agricultural sources, preventing it from entering the river [20,21]. Particular forms of autochthonous N and P depend on the conditions in the water body. Aerobic conditions favor nitrification (transformation of NH4+ into NO3−). In anaerobic conditions, NO3− is transformed into N2 in the denitrification process. Phosphorus, on the other hand, is adsorbed by sediment particles, however, it could also be released again to the water column and act as the internal P source [22,23].
The described processes take place both in large and small floodplain lakes, however, the latter are more sensitive to nutrient enrichment. Owing to a higher sediment-area–water-volume ratio than large lakes, the release of nutrients from the sediment into the water is more possible [24]. Moreover, small reservoirs are more susceptible to climate change. Increasing mean air temperature causes a direct increase in surface water temperatures, intensification of evaporation and eutrophication processes, decrease in oxygen and increase in pollutant concentrations in water bodies [25,26].
Small floodplain lakes accumulate N and P from the river, surface runoff and primary production [27]. On the other hand, they are sensitive to nutrient enrichment and the influence of climate changes. During floods, pollutants accumulated in the reservoir water and sediments could be fed into the river; thereby, the protective role of small lakes as ”river pollutant buffer zones” would be reversed as they could become one of the main diffuse sources of contamination and pose a threat to the river [28]. Therefore, effective and sustainable international efforts to improve water quality require a profound understanding of complex processes and nutrient cycling within small lakes and reservoirs.
In our study, we determine nutrient concentrations in water and sediments of 10 small floodplain reservoirs, located within the floodplain of the Vistula river, Poland. This type of water bodies is poorly examined, in contrast to oxbow lakes and old riverbeds e.g., [29,30,31]. Small floodplain reservoirs are formed mainly by deep local erosion of materials deposited on the floodplain [32].
It was assumed that recent climate change, i.e., rising air and water temperature, increased evaporation and drying up of reservoirs, could intensify eutrophication. Therefore, seasonal changes in nutrient concentrations (NH4+, NO3−, total nitrogen TN, PO43− and total phosphorus TP) were measured in water of floodplain reservoirs. In addition, the impact of N and P contents in reservoir sediments, morphological and locations features with respect to influencing the concentrations and spatial horizontal distribution of nutrients within the water bodies.
2. Materials and Methods
2.1. Study Area—Description
The Vistula is the longest and the largest river in Poland (1047 km) and the longest river in the Baltic Sea catchment area [33]. Its source is located in the mountains, in the southern part of the country. The mountain section of the Vistula accounts for 10% of its course and the remaining part is a lowland river, consisting of braided channels and low class regulated waterways. The Vistula flows north and enters the Baltic Sea in the Bay of Gdańsk [34]. The floodplain of the river is limited by embankments to a narrow approximately 1.0–4.5 km-wide strip [35,36].
The largest part of the Vistula’s catchment is located in Poland (approximately 87%), it is densely populated, inhabited by nearly 21 million people, which has a negative impact on water quality. The Vistula is characterized by the highest total nitrogen and total phosphorus loads among the biggest rivers flowing into the Baltic (Figure 1). The most important diffuse sources of pollution are atmospheric deposition, scattered dwelling and agriculture—50% of the catchment is agricultural land and forests cover only 30% of the area. The sources of point pollution are industry, municipal wastewater treatment plants, mining and landfill leachate [33].
There is ample evidence that climate has changed within the study area. Mean annual air temperature (MAAT) rose by 1 °C since 1961. Extremely high temperatures are more frequent, while very and extremely cold days are observed less often. In Poland, the five years between 2001 and 2019 were extremely warm (MAAT > 95% quantile), during the whole 20th century only one (2000) [37,38]. Moreover, there is less cloud cover and more sunshine hours, even >600 hours per year above the norm. The year 2019 had been the warmest since the beginning of the measurements, MAAT was 10.2 °C, while average MAAT in the period 1981–2010 was 2 °C lower [37,38]. The distribution of precipitation during the year has also changed. More heavy precipitation events and droughts are observed along with substantially extended average longest dry period (with daily precipitation below 1 mm)—approximately by 20 days [39]. Consequently, the frequency of low flows on the Vistula in the 21st century has increased [40].
2.2. Sediment Sampling and Analysis
The investigated 100 km middle section of the Vistula (Figure 2) stretches between the cities of Annopol (404 km from the source) and Dęblin (499 km). Ten small floodplain reservoirs were selected, five along the western bank of the river and five along the eastern one. The reservoirs were located within the floodplain, between the embankments, did not have a permanent connection with the river (lentic type) and were elongated in shape. The area of each water body did not exceed 0.01 km2 (1 ha) and a maximum depth of 4 m.
To investigate spatial horizontal distribution of N and P in sediments, the samples were collected in three parts of each reservoir: Initial (southern (S)), middle (M) and final (northern (N)), parallel to the direction of water flow during floods (Figure 3). Morphometric and location features were established: Area, maximum depth, the distance between the embankments, the distance from the river channel, the angle between the reservoir axis and the river.
The specimens from the top layer of bottom sediments (0–15 cm) were collected with a sediment sampler (approximately 2 L). The material was put into clean polyethylene containers and transported to the laboratory. Sediments were air-dried, remnants of plants and gravel removed, and the remaining material sieved through a 2-mm sieve. The contents of the fractions, sand (2.0–0.05 mm), silt (0.05–0.002 mm) and clay (<0.002 mm), were set according to the Bouyoucose areometric method modified by Casagrande and Prószyński [41]. The content of total organic carbon (TOC) was determined in triplicate with the wet combustion method—oxidation of organic matter by a mixture of H2SO4 and potassium dichromate (K2Cr2O7) [42]. The water samples were collected monthly, between March and November 2019, three times during each season: Spring (March to May), summer (June to August) and autumn (September to November). The samples were taken at the surface of each reservoir (0–1 m), due to their shallow depth, they were assumed to be representative of the whole water column. The water was transported to the laboratory in clean (acid-washed) polyethylene bottles (volume 1.5 L). Concentrations of NH4+, NO3−, PO43− and TP in sediments and water were measured by spectrophotometric method. The content of TN was determined in compliance with Kjeldahl’s method (distillation) after mineralization and reduction of NO2− and NO3− into NH4+. The trophic states of reservoirs were described according to the trophic state index (TSI) [43,44] which is based on the TP water content.
2.3. Statistical Analysis
ANOVA and the Tukey’s a posteriori tests were conducted to determine the significance of differences in sediment and water quality between reservoirs and their parts, as well as to establish significant seasonal water quality changes. The relationships between concentrations of NH4+, NO3−, PO43−, TP and TN in sediments and water and morphological/location features were evaluated by Pearson’s linear correlation test. A correlation analysis was performed for reservoirs 1–10 and their parts S, M and N. All statistical analysis was performed with Statistica 13.1 software (StatSoft Polska Sp. z o.o., Kraków, Poland).
3. Results and Discussion
The variability of nutrient contents in sediments in reservoirs (res.) 1–10 was high (Table 1). Water bodies number 8 and 10 displayed the highest difference from the sample, with significantly higher amounts of PO43− than in sediments of reservoirs 1, 5, 7 and 1, 5, respectively (based on Tukey’s test—the Least Significant Difference (LSD) value). Additionally, in comparison to other reservoirs in res. number 8 the TP levels were 2–2.5 times higher, which was statistically significant difference. Parts S, M and N showed modest variation, with the mean coefficient of variation value about 10%. Although the differences between reservoir sections were not statistically significant, there was a tendency for nutrients to accumulate mainly in the initial and final parts. This spatial distribution of N and P compounds confirmed our assumption that small floodplain reservoirs are subject to similar processes as dam reservoirs. The elevated nutrient content was recorded in the initial parts of these water bodies due to the fresh influx of allochthonous matter. However, most N and P compounds accumulated in their final parts (at the dam), where fine-grained material of strong sorption properties is deposited [45,46,47].
The correlation analysis indicates a strong influence of total organic carbon content and texture on the content of N and P compounds in the sediments (Table 2). The fine-grained material was characterized by better sorption properties, more effectively binding various compounds, including nutrients. This explains the high content of N and P in res. number 10, whose sediments consisted in almost 50% of silt and clay. Coarse material was found to accumulate less N and P compounds, especially PO43−. Reservoir morphometric and location characteristics mainly influenced the grain size distribution of the sediments, indirectly affecting their chemical properties. The value of an angle between the floodplain reservoir axis and the river was proven to be a factor influencing the sediment texture [48,49,50,51], which is reflected in the results of our research: The bigger the angle, the coarser the sediments. The maximum depth of the reservoirs had a similar effect on the texture, in deeper water bodies the share of sand was higher. This translates into a negative correlation between nutrient content and max depth/angle.
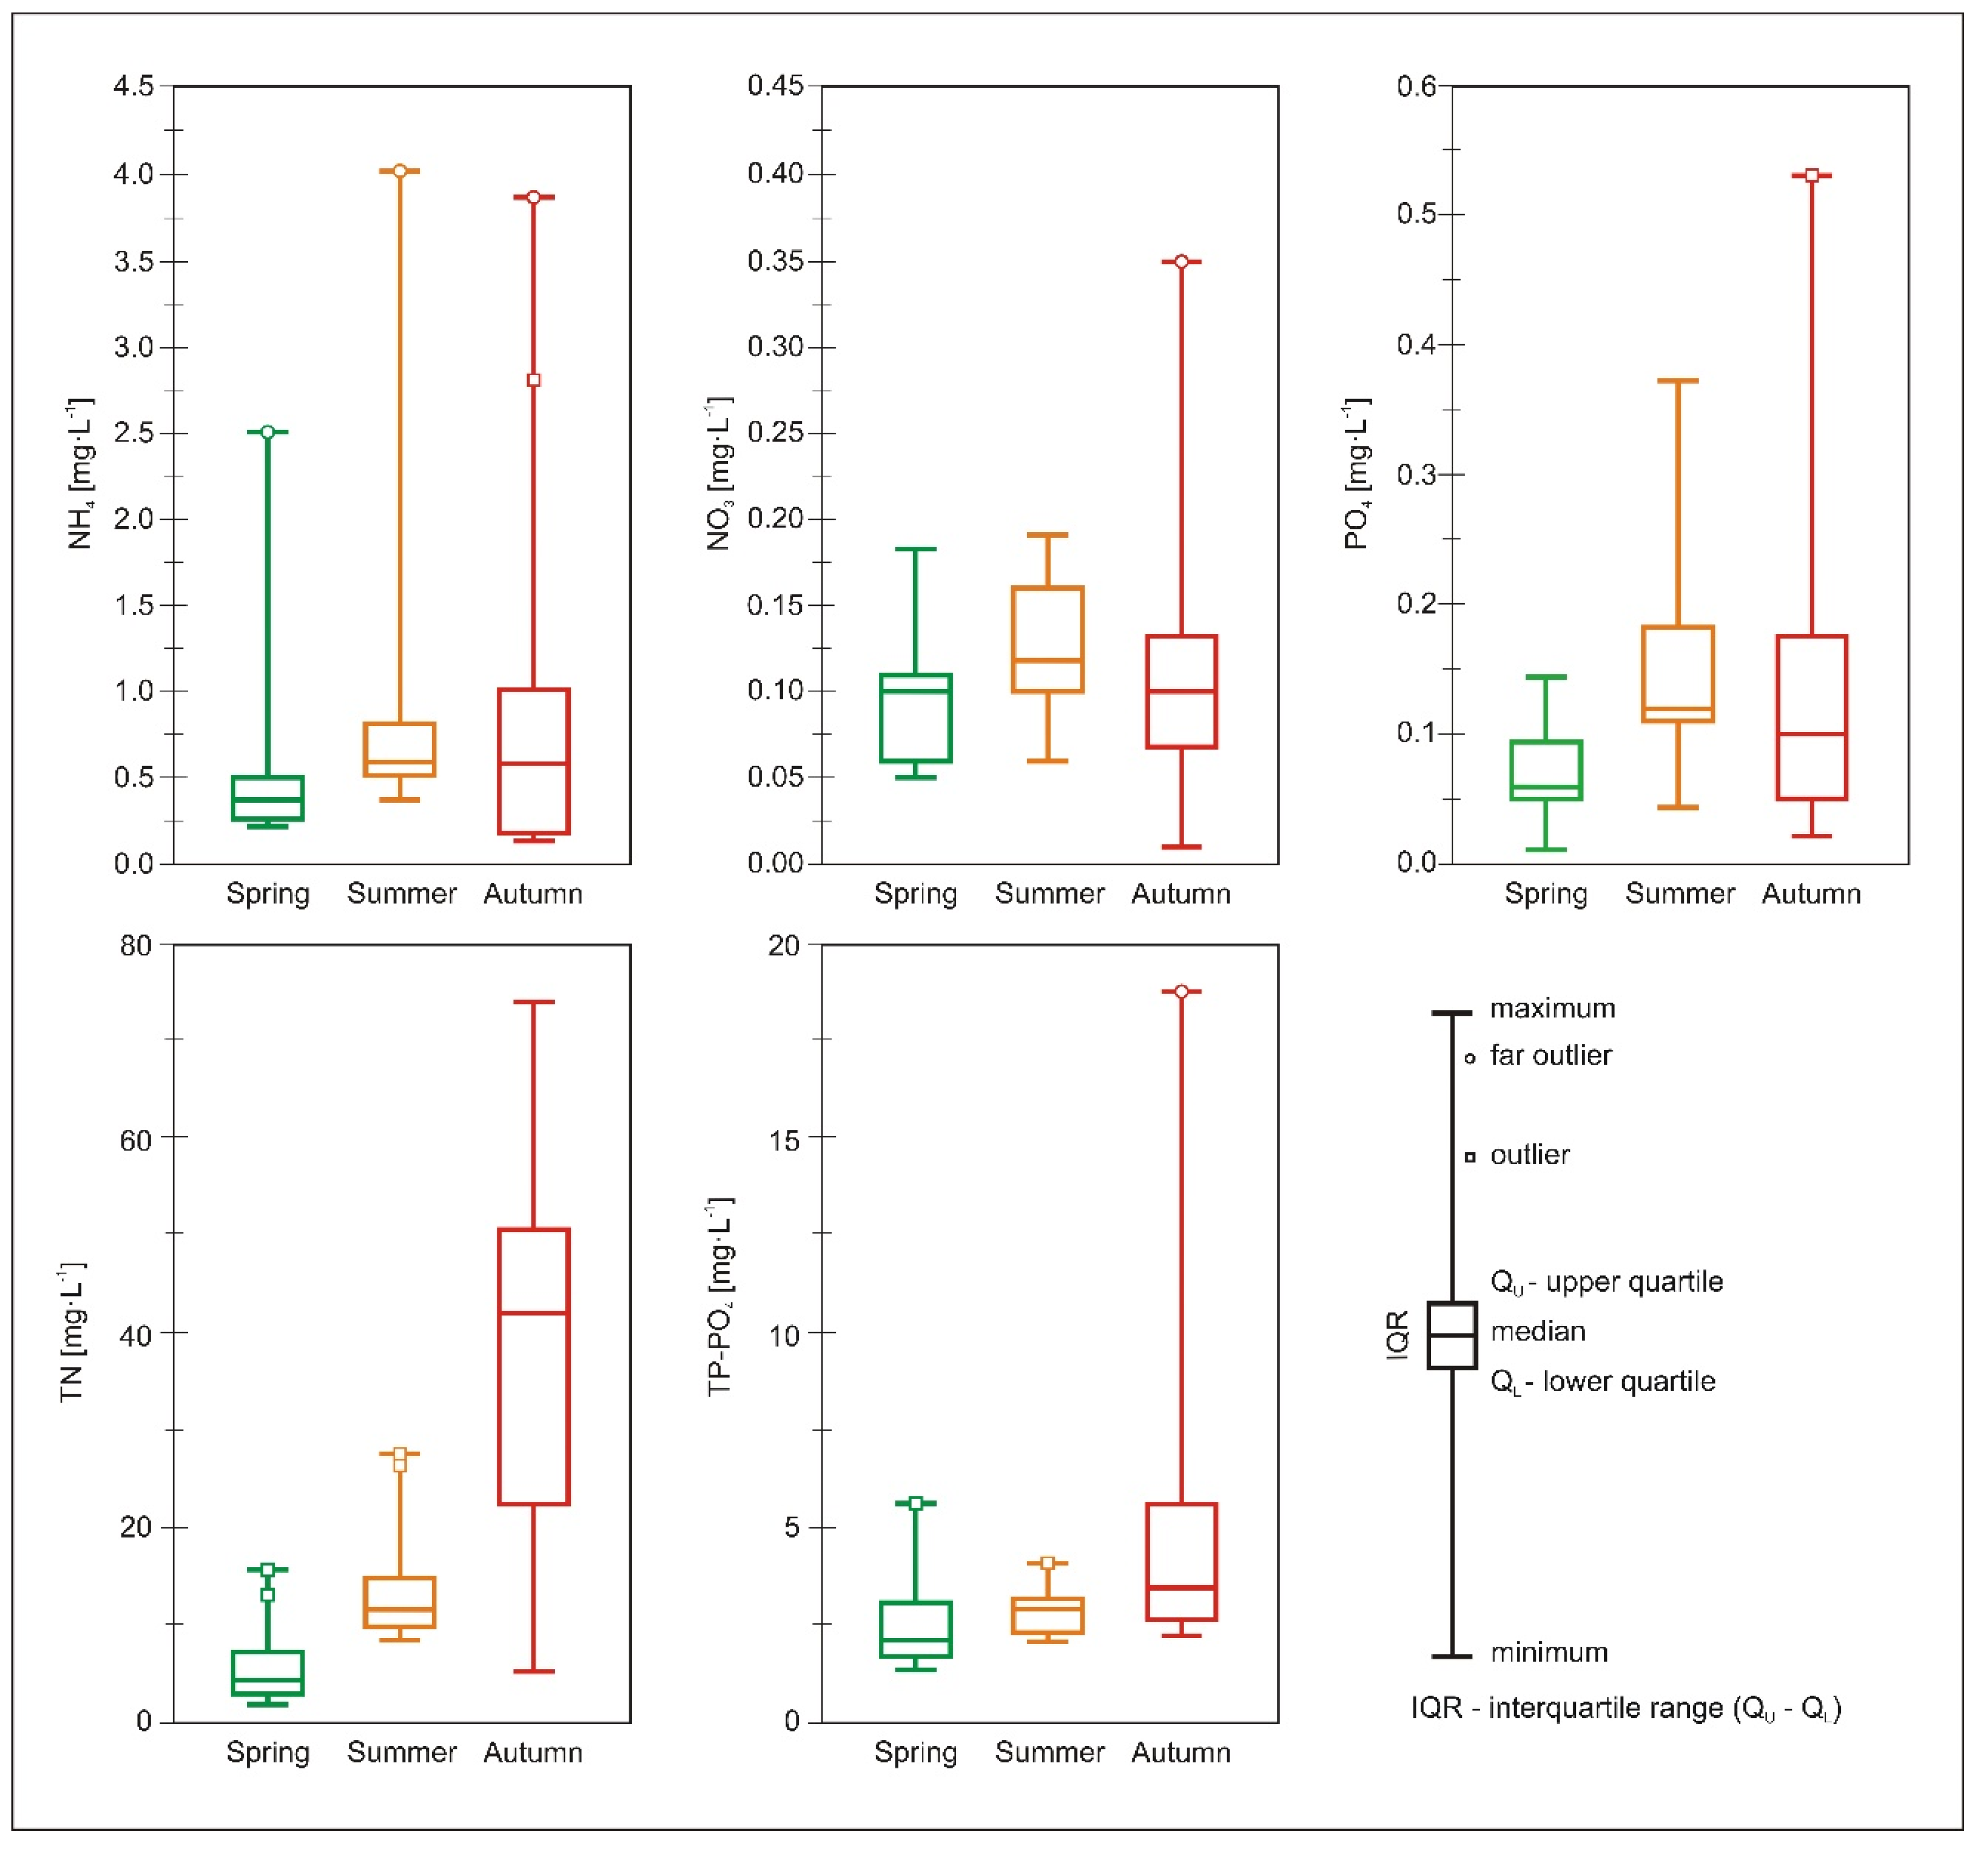
The water quality parameters and their seasonal changes in res. 1–10 should be analyzed through the prism of climate change. Between 2017 and spring 2019, the area of the studied small floodplain reservoirs decreased by an average of 37% (Table 3). In 2019, which had been the warmest year in Poland since the beginning of measurements, the adverse changes in the distribution of precipitation intensified the drying process. In June, as a result of heavy rainfall, the terraces were flooded by the waters carried by the Vistula. However, it did not reduce the rate of reservoir surface shrinkage. After inundation, the water level in the reservoirs quickly returned to the state from before the flood. Consequently, in the period between March and November 2019, the surface of the studied water bodies decreased by 62% on average, with some of them almost completely drying up (Figure 4).
In terms of water quality, similarly to sediment analysis, res. number 8 and 10 stood out (Table 4). The high N and P content in the water of res. number 10 could be linked to the texture of its fine-grained sediments. Moreover, it was one of the reservoirs closest to the river (about 200 m), which could also have had an impact on the water chemical composition. Consequently, the content of NO3− was significantly higher in res. number 10, than in res. number 1, 5 and 6. On the other hand, in the water of res. number 8 there was a notably high amount of NH4+, 2–11 times higher than in other reservoirs. A probable explanation is that this was the effect of a nearby chemical industrial sewage treatment plant of Grupa Azoty Puławy Fertilisers (nitrogen fertilizer factory).
In all investigated reservoirs the content of N and P compounds (NH4+, NO3−, PO43−, TN and TP) in water was high, indicative of high eutrophication. According to TSI describing trophic states of lakes and reservoirs: Oligotrophic (<40), mesotrophic (40–50), eutrophic (50–90) and hypereutrophic (>90), all investigated reservoirs were hypereutrophic [43,44]. The trophic state of the reservoirs is well illustrated by the algal bloom (Figure 5).
According to Polish [52] and European Union guidelines [53], water bodies would be described as “failing to achieve good ecological status” and water quality would be classified as “bad”. The analysis of Statistics Poland [54,55] data shows that in the years 2014–2018, the TN load transported by the Vistula river into the Baltic Sea increased by 18,000 tons per year. The high content of TN in small floodplain reservoirs evidences high biomass production. During high water, especially severe floods, nitrogen compounds are washed out from floodplain water bodies, polluting the river and consequently the sea [56]. Actions aimed at improving surface water quality should consider floodplain reservoirs as an important diffuse nutrient source. This is vital as Poland and other EU countries, despite various water protection measures: Good agricultural practices, erosion reduction, improvement of sewage quality, reduction of detergent usage, fail to achieve good surface water quality and reduce nutrient loads exported into the Baltic Sea [57,58,59], which was the aim of the European Union’s Water Framework Directive [53].
The concentration of most investigated water compounds (NH4+, TN and TP) increased during the growing season (Figure 6), which was caused by drought. The drying up of the reservoirs was a key factor in the seasonal changes in water quality. A significant loss of water led to a reduction in the area of the water bodies, which was confirmed by strong correlations between the percentage reduction in the surface of reservoirs and the increase in the levels of NH4+ (r = 0.793), TN (r = 0.744) and TP (r = 0.631) in the water during the year (the significance limit of a correlation coefficient based on Student’s t-test, r = 0.632, p = 0.05, n = 10). The problem of deteriorating water quality during droughts is not limited to small floodplain reservoirs, as it applied similarly to rivers and other water bodies [60,61,62,63].
There were, however, exceptions: NO3− and PO43− with the highest concentrations during summer (Figure 6). It could have been related to the flooding of the terraces in June—after the spring sampling and before the summer measurements. The Vistula is a heavily polluted river, which exports nearly half of the total phosphorus load into the Baltic Sea [33]. Moreover, in 2014–2018, the load of NO3− carried by the Vistula into the Baltic Sea increased by 8,000 tons per year [54,55]. Phosphates come primarily from insufficiently treated municipal and industrial wastewater, while highly soluble and mobile nitrate is transported to the river from agricultural areas. The summer increase in the content of PO43− and NO3− in the studied water bodies resulted from the exchange of water between the reservoirs and the river, which carried high amounts of phosphates and nitrates. This assumption is supported by significant correlations between the spring–summer change in PO43− and NO3− concentrations in the reservoirs and the reservoirs-river distance, r = −0.762 and r = −0.696, respectively (the significant correlation at p = 0.05, n = 10). The mean concentration of NO3− and PO43− in the water of investigated river section in the spring–summer period was 0.8 and 0.2 mg·L−1, respectively, which was more than in the water of reservoirs. Additionally, it should be noted that during periods of intense rainfall and high flows, amounts of nutrients carried by the river could be increased [64]. After the inundation of the terraces in early June, the highest increase in PO43− and NO3− concentrations was recorded in the reservoirs closest to the Vistula. When the terraces are flooded by the river, the reservoir–river water exchange occurs more intensively near the main riverbed. Along with an increasing distance from the river, the influence of flooding water, and thus the content of phosphates and nitrates deposited by the river, decrease [65]. The lower content of these elements in autumn indicates changes in their form. Floodplain lakes are considered effective tools in trapping phosphorus [66,67], therefore, excess PO43− from water might have been bound by sediments.
The contents of nutrients in water were positively correlated with each other (Table 5), only the content of TP did not show any relationship with other compounds. The nutrient correlations between the sediments and water were different (Table 6). The content of TP and PO43− in the sediments was strongly correlated with the content of NH4+ and NO3− in the water. The total organic carbon accumulated in the sediments also had a significant influence on the water chemical properties, it increased the content of most compounds, especially NO3− and PO43−. Furthermore, the sediment texture significantly influenced the content of nutrients in the water. In reservoirs with coarse-grained sediments, nutrient concentration in water was lower; considering the reservoirs of fine-grained sediments, especially with a high share of clay, more nutrients were noted in the water, especially NO3− and PO43−. In small floodplain water bodies, the sediment-area–water-volume ratio is high, which enhances the correlations between water and sediments. It was evident in the relationship between water nutrient content and sediments texture. Moreover, high temperature accelerates sorption of phosphate by sediments [24,68]. The year 2019 was the warmest in Poland since 1950 [38], which additionally affected PO43− water-sediment transformations.
4. Conclusions
Our research shows a strong and highly dynamic relationship between the river and the floodplain water bodies. Small floodplain reservoirs could play a role of sinks and sources of nutrients at the same time, depending on river water regime. On the one hand, during floods, PO43− and NO3− transported by the river enrich the waters of floodplain water bodies. There they undergo transformation processes, cleansing the river. On the other hand, in the present reality of climate change that involves an increase in the annual mean temperatures and the frequency of droughts, small reservoirs become a place of enhanced biomass production, accumulating NH4+, TP and TN. During floods, overflowing river waters wash nutrients accumulated in both water and sediment of reservoirs, increasing the load of NH4+, TP and TN. Since 2000, EU member countries have been trying to improve the quality of surface water and reduce nitrogen and phosphorus loads transported by rivers to the Baltic Sea. However, despite sustained efforts, the goal remains elusive. Therefore, better knowledge of the diffuse nutrient sources, i.e., small floodplain reservoirs and lakes, is crucial.
Author Contributions
Conceptualization, S.L. and J.G.-I.; Methodology, S.L. and J.G.-I.; Software, J.G.-I.; Validation, S.L., J.P. and H.O.; Formal Analysis, J.G.-I.; Investigation, J.G-I. and S.L.; Resources, H.S.; Data Curation, J.G.-I., J.P. and S.L.; Writing—Original Draft Preparation, J.G.-I.; Writing—Review & Editing, S.L. and J.P.; Visualization, J.G.-I., J.P. and H.O.; Supervision, S.L. and H.O.; Project Administration, H.S.; Funding Acquisition, H.S. All authors have read and agreed to the published version of the manuscript.
Funding
This research was funded by the University of Life Sciences in Lublin, Akademicka St. 13, 20-950 Lublin, Poland.
Conflicts of Interest
The authors declare no conflict of interest. The sponsors had no role in the design, execution, interpretation, or writing of the study.
References
- Hasler, A.D. Eutrophication of lakes by domestic drainage. Ecology 1947, 28, 383–395. [Google Scholar] [CrossRef]
- Jarvie, H.P.; Smith, D.R.; Norton, L.R.; Edwards, F.K.; Bowes, M.J.; King, S.M.; Scarlett, P.; Davies, S.; Dils, R.M.; Bachiller-Jareno, N. Phosphorus and nitrogen limitation and impairment of headwater streams relative to rivers in Great Britain: A national perspective on eutrophication. Sci. Total Environ. 2018, 621, 849–862. [Google Scholar] [CrossRef] [PubMed] [Green Version]
- Vollenweider, R. Advances in defining critical loading levels for phosphorus in lake eutrophication. Mem. Ist. Ital. Idrobiol. 1976, 33, 53–83. [Google Scholar]
- Weigelhofer, G.; Hein, T.; Bondar-Kunze, E. Phosphorus and nitrogen dynamics in riverine systems: Human impacts and management options. In Riverine Ecosystem Management. Aquatic Ecology Series; Schmutz, S., Sendzimir, J., Eds.; Springer: Cham, Switzerland, 2018; Volume 8. [Google Scholar] [CrossRef]
- Le Moal, M.; Gascuel-Odoux, C.; Ménesguen, A.; Souchon, Y.; Étrillard, C.; Levain, A.; Moatar, F.; Pannard, A.; Souchu, P.; Lefebvre, A.; et al. Eutrophication: A new wine in an old bottle? Sci. Total Environ. 2019, 651, 1–11. [Google Scholar] [CrossRef] [PubMed] [Green Version]
- Ligęza, S.; Wilk-Woźniak, E. The occurrence of a Euglena pascheri and Lepocinclis ovum bloom in an oxbow lake in southern Poland under extreme environmental conditions. Ecol. Ind. 2011, 11, 925–929. [Google Scholar] [CrossRef]
- Maliaka, V.; Faassen, E.J.; Smolders, A.J.; Lürling, M. The Impact of Warming and Nutrients on Algae Production and Microcystins in Seston from the Iconic Lake Lesser Prespa, Greece. Toxins 2018, 10, 144. [Google Scholar] [CrossRef] [Green Version]
- López-Doval, J.C.; Montagner, C.C.; Fernandes de Alburquerque, A.; Moschini-Carlos, V.; Umbuzeiro, G.; Pompêo, M. Nutrients, emerging pollutants and pesticides in a tropical urban reservoir: Spatial distributions and risk assessment. Sci. Tot Environ. 2017, 575, 1307–1324. [Google Scholar] [CrossRef] [Green Version]
- Xing, J.; Song, J.; Yuan, H.; Li, H.; Li, N.; Duan, L.; Kang, X.; Wang, Q. Fluxes, seasonal patterns and sources of various nutrient species (nitrogen, phosphorus and silicon) in atmospheric wet deposition and their ecological effects on Jiaozhou Bay, North China. Sci. Total Environ. 2018, 576, 617–627. [Google Scholar] [CrossRef]
- Morales-Marín, L.; Wheater, H.; Lindenschmidt, K.-E. Potential Changes of Annual-Averaged Nutrient Export in the South Saskatchewan River Basin under Climate and Land-Use Change Scenarios. Water 2018, 10, 1438. [Google Scholar] [CrossRef] [Green Version]
- Némery, J.; Gratiot, N.; Doan, P.T.K.; Duvert, C.; Alvarado-Villanueva, R.; Duwig, C. Carbon, nitrogen, phosphorus, and sediment sources and retention in a small eutrophic tropical reservoir. Aquat. Sci. 2016, 78, 171–189. [Google Scholar] [CrossRef]
- Ngatia, L.W.; Hsieh, Y.P.; Nemours, D.; Fu, R.; Taylor, R.W. Potential phosphorus eutrophication mitigation strategy: Biochar carbon composition, thermal stability and pH influence phosphorus sorption. Chemosphere 2017, 180, 201–211. [Google Scholar] [CrossRef] [PubMed] [Green Version]
- Ding, W.; He, P.; Zhang, J.; Liu, Y.; Xu, X.; Ullah, S.; Cui, Z.; Zhou, W. Optimizing rates and sources of nutrient input to mitigate nitrogen, phosphorus, and carbon losses from rice paddies. J. Clean. Prod. 2020, 256, 120603. [Google Scholar] [CrossRef]
- Farmer, A.M. Phosphate pollution: A global overview of the problem. In Phosphorus: Polluter and Resource of The Future—Removal and Recovery From Wastewater; Schaum, C., Ed.; IWA Publishing: London, UK, 2018; pp. 35–55. [Google Scholar] [CrossRef]
- Preisner, M.; Neverova-Dziopak, E.; Kowalewski, Z. Mitigation of eutrophication caused by wastewater discharge: A simulation-based approach. Ambio 2020. [Google Scholar] [CrossRef] [PubMed]
- Hopkins, K.G.; Noe, G.B.; Franco, F.; Pindilli, E.J.; Gordon, S.; Metes, M.J.; Claggett, P.R.; Gellis, A.C.; Hupp, C.R.; Hogan, D.M. A method to quantify and value floodplain sediment and nutrient retention ecosystem services. J. Environ. Manag. 2018, 220, 65–76. [Google Scholar] [CrossRef] [PubMed]
- Richardson, W.B.; Bartsch, L.A.; Bartsch, M.R.; Kiesling, R.; Lafrancois, B.M. Nitrogen cycling in large temperate floodplain rivers of contrasting nutrient regimes and management. River Res. Applic. 2019, 35, 529–539. [Google Scholar] [CrossRef] [Green Version]
- Downing, J.A.; Prairie, Y.T.; Cole, J.J.; Duarte, C.M.; Tranvik, L.J.; Striegl, R.G.; McDowell, W.H.; Kortelainen, P.; Caraco, N.F.; Melack, J.M.; et al. The global abundance and size distribution of lakes, ponds, and impoundments. Limnol. Oceanogr. 2006, 51, 2388–2397. [Google Scholar] [CrossRef] [Green Version]
- Weigelhofer, G.; Preiner, S.; Funk, A.; Bondar-Kunze, E.; Hein, T. The hydrochemical response of small and shallow floodplain water bodies to temporary surface water connections with the main river. Freshw. Biol. 2015, 60, 781–793. [Google Scholar] [CrossRef]
- Miranda, L.E.; Omer, A.R.; Killgore, K.J. Balancing lake ecological condition and agriculture irrigation needs in the Mississippi Alluvial Valley. Agric. Ecosyst. Environ. 2017, 246, 354–360. [Google Scholar] [CrossRef]
- Schilling, K.E.; Kult, K.; Wilke, K.; Streeter, M.; Vogelgesang, J. Nitrate reduction in a reconstructed floodplain oxbow fed by tile drainage. Ecol. Eng. 2017, 102, 98–107. [Google Scholar] [CrossRef] [Green Version]
- Herber, J.; Klotz, F.; Frommeyer, B.; Weis, S.; Straile, D.; Kolar, A.; Sikorski, J.; Egert, M.; Dannenmann, M.; Pester, M. A single Thaumarchaeon drives nitrification in deep oligotrophic Lake Constance. Environ. Microbiol. 2020, 22, 212–228. [Google Scholar] [CrossRef] [Green Version]
- Tonello, M.S.; Hebner, T.S.; Sterner, R.W.; Brovold, S.; Tiecher, T.; Bortoluzzi, E.C.; Merten, G.H. Geochemistry and mineralogy of southwestern Lake Superior sediments with an emphasis on phosphorus lability. J. Soils Sediments 2020, 20, 1060–1073. [Google Scholar] [CrossRef]
- Maberly, S.C.; Pitt, J.A.; Davies, P.S.; Carvalho, L. Nitrogen and phosphorus limitation and the management of small productive lakes. Inland Waters 2020, 10, 159–172. [Google Scholar] [CrossRef] [Green Version]
- Biswas, B.; Qi, F.; Biswas, J.K.; Wijayawardena, A.; Khan, M.A.I.; Naidu, R. The fate of chemical pollutants with soil properties and processes in the climate change paradigm—A review. Soil Syst. 2018, 2, 51. [Google Scholar] [CrossRef] [Green Version]
- Pletterbauer, F.; Melcher, A.; Graf, W. Climate change impacts in riverine ecosystems. In Riverine Ecosystem Management. Aquatic Ecology Series; Schmutz, S., Sendzimir, J., Eds.; Springer: Cham, Switzerland, 2018; Volume 8. [Google Scholar] [CrossRef]
- Stal, L.J. Nitrogen fixation in Cyanobacteria. Wiley Online Libr. 2015. [Google Scholar] [CrossRef]
- Norris, V. The use of buffer zones to protect water quality: A review. Water Resour. Manag. 1993, 7, 257–272. [Google Scholar] [CrossRef]
- Berta, C.; Tóthmérész, B.; Wojewódka, M.; Augustyniuk, O.; Korponai, J.; Bertalan-Balázs, B.; Nagy, A.S.; Grigorszky, I.; Gyulai, I. Community response of cladocera to trophic stress by biomanipulation in a shallow oxbow lake. Water 2019, 11, 929. [Google Scholar] [CrossRef] [Green Version]
- Havlíková, P.; Chalupová, D.; Chuman, T.; Šobr, M.; Janský, B. Long-term water and sediment quality of the Elbe River’s oxbow lake near the town of Poděbrady, the Czech Republic. Environ. Earth Sci. 2019, 78, 559. [Google Scholar] [CrossRef]
- Tóth, F.; Zsuga, K.; Kerepeczki, É.; Berzi-Nagy, L.; Körmöczi, L.; Lövei, G.L. Seasonal differences in taxonomic diversity of rotifer communities in a hungarian lowland oxbow lake exposed to aquaculture effluent. Water 2020, 12, 1300. [Google Scholar] [CrossRef]
- Wang, H.Z.; Liu, X.Q.; Wang, H.J. The Yangtze River Floodplain: Threats and rehabilitation. Am. Fish. Soc. Symp. 2016, 84, 263–291. [Google Scholar]
- HELCOM. Input of nutrients by the seven biggest rivers in the Baltic Sea region. In Baltic Sea Environmental Proceedings; Helsinki Commission: Helsinki, Finland, 2018; p. 161. [Google Scholar]
- Górniak, A. Spatial and temporal patterns of total organic carbon along the Vistula River course (Central Europe). J. Appl. Geochem. 2017, 87. [Google Scholar] [CrossRef]
- Babiński, Z. Anthropogenic transformation of the lower Vistula River Valley and its renaturisation in the aspect of hydrotechnical changes. In Geographic Documentation. Reconstruction and Forecast of Changes in The Environment in Geographical Investigations; Błażejczyk, K., Ed.; PAN IGiPZ: Warsaw, Poland, 2004; Volume 31, pp. 9–10. (In Polish) [Google Scholar]
- Falkowska, E.; Falkowski, T.; Tatur, A.; Kałmykow-Piwińska, A. Floodplain morphodynamics and distribution of traceelements in overbank deposits, Vistula River Valley Gorge near Solec nad Wisłą, Poland. Acta Geol. Pol. 2016, 66, 541–559. [Google Scholar] [CrossRef] [Green Version]
- Graczyk, D.; Pińskwar, I.; Choryński, A.; Szwed, M.; Kundzewicz, Z.W. Changes in air temperature in Poland. In Climate Changes and Their Impact on Selected Sectors in Poland; Kundzewicz, Z.W., Hov, Ø., Okruszko, T., Eds.; ISRL PAN: Poznań, Poland, 2017; pp. 47–60. [Google Scholar]
- IMWM-NRI. Climate Monitoring Bulletin of Poland. Year 2019. Institute of Meteorology and Water Management—National Research Institute, 2020, ISSN 2391-6362. Available online: https://klimat.imgw.pl/pl/biuletyn-monitoring/#2019/rok (accessed on 30 June 2020).
- Pińskwar, I.; Choryński, A.; Graczyk, D.; Szwed, M.; Kundzewicz, Z.W. Precipitation changes in Poland. In Climate Changes and Their Impact on Selected Sectors in Poland; Kundzewicz, Z.W., Hov, Ø., Okruszko, T., Eds.; ISRL PAN: Poznań, Poland, 2017; pp. 60–82. [Google Scholar]
- Kaznowska, E.; Hejduk, A.; Kempiński, C. The Vistula River low flows in Warsaw in the 21st century. Acta. Sci. Poll. Formatio Circumiectus 2018, 17, 29–38. [Google Scholar] [CrossRef]
- ISO 11277:2009(R2015). Soil Quality—Determination of Particle Size Distribution in Mineral Soil Material—Method by Sieving and Sedimentation; International Organization for Standardization: Geneve, Switzerland, 1998; p. 38. [Google Scholar]
- ISO 14235:1998. Soil Quality—Determination of Organic Carbon by Sulfochromic Oxidation; International Organization for Standardization: Geneve, Switzerland, 1998. [Google Scholar]
- Carlson, R. A trophic state index for lakes. Limnol. Oceanogr. 1977, 22, 361–369. [Google Scholar] [CrossRef] [Green Version]
- Carlson, R.; Simpson, J. A co-ordinator’s guide to volunteer lake monitoring methods. N. Am. Lake Manag. Soc. 1996, 96. [Google Scholar]
- Pearce, A.R.; Chambers, L.G.; Hasenmueller, E.A. Characterizing nutrient distributions and fluxes in a eutrophic reservoir, Midwestern United States. Sci. Total Environ. 2017, 581–582, 589–600. [Google Scholar] [CrossRef] [PubMed] [Green Version]
- Peng, C.; Shen, Y.; Wu, X.; Yuan, P.; Jiang, L.; Chen, S.; Ze, S.; Wang, X.; Song, X. Heavy metals, nitrogen, and phosphorus in sediments from the first drinking water reservoir supplied by Yangtze River in Shanghai, China: Spatial distribution characteristics and pollution risk assessment. Water Air Soil Pollut. 2020, 231, 298. [Google Scholar] [CrossRef]
- Rozpondek, K.; Rozpondek, R.; Pachura, P. Characteristics of spatial distribution of phosphorus and nitrogen in the bottom sediments of the water reservoir Poraj. J. Ecol. Eng. 2017, 18, 178–184. [Google Scholar] [CrossRef]
- Constantine, J.A.; Dunne, T.; Piégay, H.; Kondolf, G.M. Controls on the alluviation of oxbow lakes by bed-material load along the Sacramento River, California. Sedimentology 2010, 57, 389–407. [Google Scholar] [CrossRef]
- Dunne, T.; Constantine, J.A.; Singer, M. The role of sediment transport and sediment supply in the evolution of river channel and floodplain complexity. JGU 2010, 31, 155–170. [Google Scholar]
- Fisk, H.N. Fine Grained Alluvial Deposits and Their Effects on Mississippi River Activity; Mississippi River Commission: Vicksburg, MS, USA, 1947; Volume 1–2. [Google Scholar]
- Gmitrowicz-Iwan, J.; Ligęza, S.; Pranagal, J.; Kołodziej, B.; Smal, H. Can climate change transform non-toxic sediments into toxic soils? Sci. Total Environ. 2020, 747, 141201. [Google Scholar] [CrossRef]
- D.2019.2149. Regulation of the Minister of Marine Economy and Inland Navigation of 11 October 2019 on the Classification of Ecological Status, Ecological Potential and Chemical Status and the Method of Classifying the Status of Surface Water Bodies, as Well as Environmental Quality Standards for Priority Substances; FAO: Rome, Italy, 2019. [Google Scholar]
- Directive 2000/60/EC. Directive 2000/60/EC of the European Parliament and of the Council of 23 October 2000 establishing a framework for Community action in the field of water policy. Off. J. Eur. Commun. 2000, 22, 2000. [Google Scholar]
- Statistic Poland. Environment. Statistical Information and Elaborations; GUS: Warsaw, Poland, 2015. [Google Scholar]
- Statistic Poland. Environment; GUS: Warsaw, Poland, 2019. [Google Scholar]
- Lyubimova, T.; Lepikhin, A.; Parshakova, Y.; Tiunov, A. The risk of river pollution due to washout from contaminated floodplain water bodies during periods of high magnitude floods. J. Hydrol. 2016, 534, 579–589. [Google Scholar] [CrossRef]
- Kauranne, L.M.; Kemppainen, M. Urgent need for action in the Baltic Sea area. In Phosphorus in Agriculture: 100% Zero; Schnug, E., De Kok, L., Eds.; Springer: Dordrecht, The Netherlands, 2016. [Google Scholar]
- Knuuttila, S.; Räike, A.; Ekholm, P.; Kondratyev, S. Nutrient inputs into the Gulf of Finland: Trends and water protection targets. J. Marine Syst. 2016, 171, 54–64. [Google Scholar] [CrossRef]
- Räike, A.; Taskinen, A.; Knuuttila, S. Nutrient export from Finnish rivers into the Baltic Sea has not decreased despite water protection measures. Ambio 2020, 49, 460–474. [Google Scholar] [CrossRef] [PubMed] [Green Version]
- Ahmadi, B.; Ahmadalipour, A.; Moradkhani, H. Hydrological drought persistence and recovery over the CONUS: A multi-stage framework considering water quantity and quality. Water Res. 2019, 150, 97–110. [Google Scholar] [CrossRef] [PubMed]
- Havens, K.E.; Ji, G. Multiyear oscillations in depth affect water quality in Lake Apopka. Inland Waters 2018, 8, 1–9. [Google Scholar] [CrossRef]
- Li, T.; Li, S.; Liang, C.; Bush, R.T.; Xiong, L.; Jiang, Y. A comparative assessment of Australia’s Lower Lakes water quality under extreme drought and post-drought conditions using multivariate statistical techniques. J. Clean. Prod. 2018, 190, 1–11. [Google Scholar] [CrossRef]
- Tomaz, A.; Palma, P.; Fialho, S.; Lima, A.; Alvarenga, P.; Potes, M.; Salgado, R. Spatial and temporal dynamics of irrigation water quality under drought conditions in a large reservoir in Southern Portugal. Environ. Monit. Assess. 2020, 192, 93. [Google Scholar] [CrossRef]
- Talbot, C.J.; Bennett, E.M.; Cassell, K.; Hanes, D.M.; Minor, E.C.; Paerl, H.; Raymond, P.A.; Vargas, R.; Vidon, P.G.; Wollheim, W.; et al. The impact of flooding on aquatic ecosystem services. Biogeochemistry 2018, 141, 439–461. [Google Scholar] [CrossRef] [Green Version]
- Klaus, V.H.; Sintermann, J.; Kleinebecker, T.; Hölzel, N. Sedimentation-induced eutrophication in large river floodplains – An obstacle to restoration? Biol. Conserv. 2011, 144, 451–458. [Google Scholar] [CrossRef]
- Natho, S.; Tschikof, M.; Bondar-Kunze, E.; Hein, T. Modeling the effect of enhanced lateral connectivity on nutrient retention capacity in large river floodplains: How much connected floodplain do we need? Front. Environ. Sci. 2020, 8. [Google Scholar] [CrossRef]
- Stachelek, J.; Soranno, P.A. Does freshwater connectivity influence phosphorus retention in lakes? Limnol. Oceanogr. 2019, 64, 1586–1599. [Google Scholar] [CrossRef]
- Xie, F.; Dai, Y.; Zhu, Z.; Li, G.; Li, H.; He, Z.; Geng, S.; Wu, F. Adsorption of phosphate by sediments in a eutrophic lake: Isotherms, kinetics, thermodynamics and the influence of dissolved organic matter. Colloid. Surface. A 2019, 562, 16–25. [Google Scholar] [CrossRef]
Figure 1.
The water in the Vistula at the riverbank, summer.

Figure 2.
The study area, the Vistula River, Poland (1–10—studied reservoirs).

Figure 3.
A sediment sampling scheme; α—angle between reservoir axis and the riverbed; and southern (S), middle (M) and northern (N)—parts of reservoir.
Figure 3.
A sediment sampling scheme; α—angle between reservoir axis and the riverbed; and southern (S), middle (M) and northern (N)—parts of reservoir.
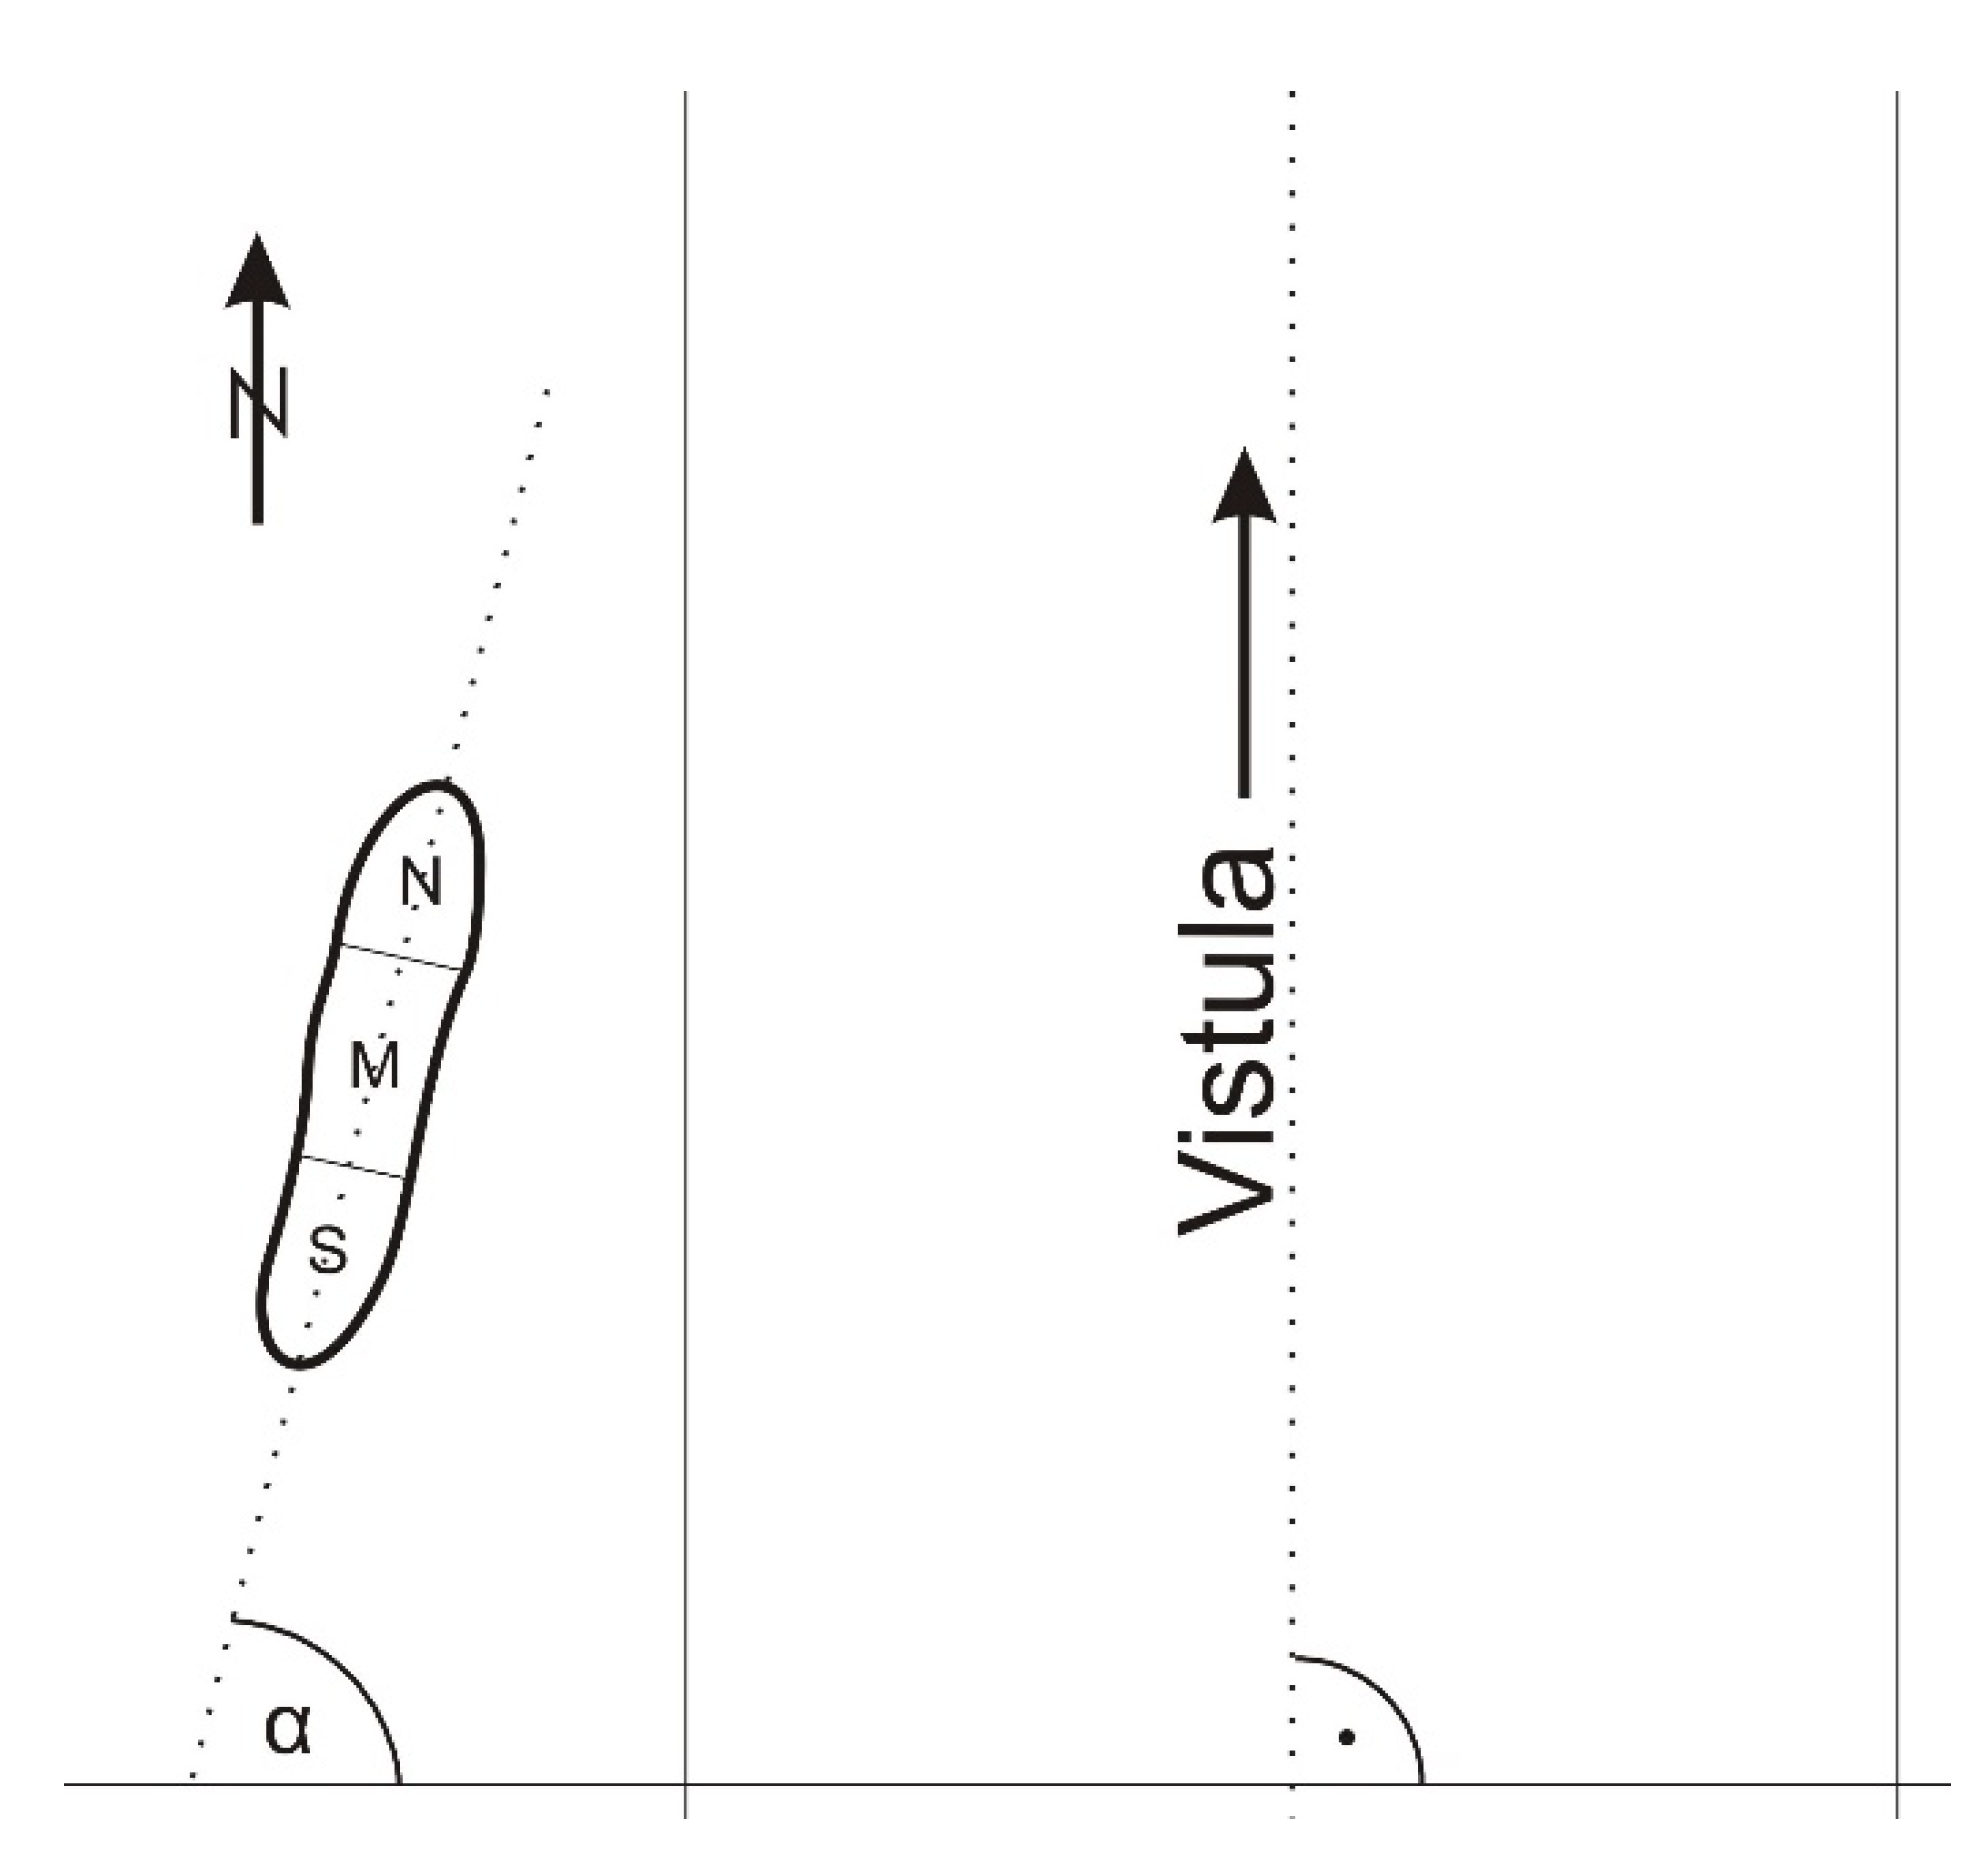
Figure 4.
Reservoir number 7 in spring (left) and autumn (right) 2019.

Figure 5.
Reservoir number 8, summer.

Figure 6.
Seasonal changes in water quality in small floodplain reservoirs.

Table 1.
Mean values of phosphorus and nitrogen compounds and organic carbon in sediments of reservoirs 1–10 and their parts S, M and N.
Table 1.
Mean values of phosphorus and nitrogen compounds and organic carbon in sediments of reservoirs 1–10 and their parts S, M and N.
| NH4+ (a) | NO3− (b) | PO43− | TN | TP (c) | TOC | C:N | |
|---|---|---|---|---|---|---|---|
| mg·kg−1 | g·kg−1 | ||||||
| Reservoir | |||||||
| 1 | 12.71 | 1.07 | 0.38 | 4.11 | 1.37 | 48.21 | 11.60 |
| 2 | 9.23 | 0.87 | 1.18 | 2.28 | 1.48 | 29.19 | 10.19 |
| 3 | 12.48 | 0.78 | 1.16 | 4.28 | 1.58 | 29.00 | 6.92 |
| 4 | 8.68 | 0.64 | 1.01 | 2.59 | 1.04 | 22.75 | 8.81 |
| 5 | 18.95 | 0.87 | 0.21 | 2.07 | 1.28 | 24.93 | 11.69 |
| 6 | 6.74 | 1.03 | 1.74 | 2.35 | 0.88 | 27.57 | 12.31 |
| 7 | 8.08 | 0.83 | 0.73 | 3.01 | 1.01 | 25.50 | 7.84 |
| 8 | 11.76 | 1.08 | 2.44 | 3.36 | 4.19 | 34.48 | 10.09 |
| 9 | 15.54 | 1.39 | 1.41 | 5.71 | 1.32 | 30.86 | 6.82 |
| 10 | 16.63 | 1.15 | 1.96 | 5.06 | 2.38 | 64.47 | 13.13 |
| mean | 12.08 | 0.97 | 1.22 | 3.48 | 1.65 | 33.70 | 9.94 |
| CV (%) | 50 | 44 | 58 | 66 | 69 | 38 | 37 |
| LSD | 15.907 | 1.309 | 1.528 | 5.644 | 2.232 | 57.273 | 1.110 |
| Part of Reservoir | |||||||
| S | 11.99 | 0.90 | 1.11 | 3.18 | 1.51 | 33.16 | 10.48 |
| M | 10.23 | 0.99 | 1.27 | 3.38 | 1.58 | 31.78 | 9.06 |
| N | 14.02 | 1.02 | 1.28 | 3.89 | 1.87 | 36.15 | 10.27 |
| mean | 12.08 | 0.97 | 1.22 | 3.48 | 1.65 | 33.70 | 9.94 |
| CV (%) | 16 | 7 | 8 | 11 | 12 | 7 | 8 |
| LSD | 6.680 | 0.494 | 0.925 | 2.315 | 1.312 | 23.798 | 4.140 |
(a) NH4+-N, (b) NO3--N, (c) TP in the form of PO43−.
Table 2.
Correlations of phosphorus and nitrogen compounds in sediments (the significance limit of a correlation coefficient based on Student’s t-test, r = 0.361, p = 0.05, n = 30).
Table 2.
Correlations of phosphorus and nitrogen compounds in sediments (the significance limit of a correlation coefficient based on Student’s t-test, r = 0.361, p = 0.05, n = 30).
| Parameter | NH4+ (a) | NO3− (b) | PO43− | TN | TP (c) |
|---|---|---|---|---|---|
| NH4+(a) | 1.000 | ||||
| NO3−(b) | 0.608 * | 1.000 | |||
| PO43− | 0.637 * | 0.755 * | 1.000 | ||
| TN | −0.093 | 0.286 | 0.270 | 1.000 | |
| TP(c) | 0.290 | 0.295 | 0.343 | 0.594 * | 1.000 |
| TOC | 0.375 * | 0.431 * | 0.580 * | 0.225 | 0.463 * |
| Sand | −0.358 | −0.432 * | −0.688 * | −0.293 | −0.327 |
| Silt | 0.351 | 0.423 * | 0.658 * | 0.386 * | 0.486 * |
| Clay | 0.342 | 0.412 * | 0.677 * | 0.166 | 0.121 |
| Length | −0.262 | 0.051 | −0.192 | −0.056 | −0.356 |
| Max. depth | −0.213 | −0.055 | −0.320 | −0.300 | −0.405 * |
| Distance from the river channel | 0.072 | 0.028 | −0.155 | −0.177 | −0.444 * |
| Area | −0.288 | −0.120 | −0.296 | −0.159 | −0.437 * |
| Angle | −0.447 * | −0.205 | −0.451 * | 0.044 | 0.040 |
* significant correlation at p = 0.05; (a) NH4+-N, (b) NO3--N, (c) TP in the form of PO43−.
Table 3.
Surface water area changes in the reservoirs.
| Number | Area | Change | |||
|---|---|---|---|---|---|
| 2017 | Spring 2019 | Autumn 2019 | 2017–Spring 2019 | Spring–Autumn 2019 | |
| m2 | m2 | m2 | % | % | |
| 1 | 1720 | 1548 | 746 | −10% | −52% |
| 2 | 3780 | 1003 | 409 | −73% | −59% |
| 3 | 480 | 436 | 68 | −9% | −84% |
| 4 | 5470 | 1081 | 320 | −80% | −70% |
| 5 | 5100 | 5058 | 3168 | −1% | −37% |
| 6 | 8000 | 6065 | 3020 | −24% | −50% |
| 7 | 9530 | 9458 | 4022 | −1% | −57% |
| 8 | 1350 | 803 | 134 | −41% | −83% |
| 9 | 2950 | 2036 | 1228 | −31% | −40% |
| 10 | 3860 | 103 | 15 | −97% | −85% |
Table 4.
Mean values of phosphorus and nitrogen compounds in water in reservoirs 1–10.
| NH4+ (a) | NO3− (b) | PO43− | TN | TP (c) | |
|---|---|---|---|---|---|
| mg·L−1 | |||||
| Reservoir | |||||
| 1 | 0.30 | 0.08 | 0.14 | 12.37 | 2.45 |
| 2 | 0.44 | 0.13 | 0.07 | 21.23 | 2.07 |
| 3 | 0.63 | 0.10 | 0.15 | 7.33 | 7.63 |
| 4 | 0.44 | 0.08 | 0.09 | 23.47 | 3.98 |
| 5 | 0.37 | 0.04 | 0.06 | 18.71 | 2.28 |
| 6 | 0.27 | 0.08 | 0.13 | 20.91 | 2.37 |
| 7 | 0.49 | 0.11 | 0.08 | 19.97 | 3.77 |
| 8 | 3.38 | 0.16 | 0.20 | 32.85 | 3.75 |
| 9 | 0.65 | 0.10 | 0.05 | 5.60 | 2.50 |
| 10 | 1.49 | 0.22 | 0.30 | 30.24 | 3.95 |
| mean | 0.85 | 0.11 | 0.13 | 19.27 | 3.45 |
| CV [%] | 113 | 45 | 60 | 46 | 60 |
| LSD | 1.407 | 0.137 | 0.309 | 59.205 | 8.983 |
(a) NH4+-N, (b) NO3--N, (c) TP in the form of PO43−.
Table 5.
Correlations in water (the significance limit of a correlation coefficient based on Student’s t-test, r = 0.361, p = 0.05, n = 30).
Table 5.
Correlations in water (the significance limit of a correlation coefficient based on Student’s t-test, r = 0.361, p = 0.05, n = 30).
| Parameter | Water | |||||
|---|---|---|---|---|---|---|
| NH4+ (a) | NO3− (b) | PO43− | TN | TP (c) | ||
| Water | NH4+(a) | 1.000 | ||||
| NO3−(b) | 0.626 * | 1.000 | ||||
| PO43− | 0.590 * | 0.686 * | 1.000 | |||
| TN | 0.440 * | 0.403 * | 0.415 * | 1.000 | ||
| TP(c) | 0.192 | 0.215 | 0.191 | 0.098 | 1.000 | |
* significant correlation at p = 0.05; (a) NH4+-N, (b) NO3--N, (c) TP in the form of PO43−.
Table 6.
Correlations between water and sediments (the significance limit of a correlation coefficient based on Student’s t-test, r = 0.632, p = 0.05, n = 10).
Table 6.
Correlations between water and sediments (the significance limit of a correlation coefficient based on Student’s t-test, r = 0.632, p = 0.05, n = 10).
| Parameter | Water | |||||
|---|---|---|---|---|---|---|
| NH4+ (a) | NO3− (b) | PO43− | TN | TP (c) | ||
| Sediments | NH4+(a) | 0.137 | 0.089 | 0.195 | −0.145 | −0.024 |
| NO3−(b) | 0.292 | 0.341 | 0.247 | −0.124 | −0.377 | |
| PO43− | 0.744 * | 0.722 * | 0.614 | 0.519 | 0.149 | |
| TN | 0.194 | 0.450 | 0.387 | −0.361 | 0.280 | |
| TP(c) | 0.980 * | 0.636 * | 0.616 | 0.578 | 0.165 | |
| TOC | 0.289 | 0.681 * | 0.816 * | 0.268 | −0.006 | |
| Sand | −0.089 | −0.647 * | −0.678 * | 0.066 | −0.440 | |
| Silt | 0.269 | 0.747 * | 0.805 * | 0.105 | 0.492 | |
| Clay | −0.088 | 0.521 | 0.524 | −0.229 | 0.369 | |
* significant correlation at p = 0.05; (a) NH4+-N, (b) NO3--N, (c) TP in the form of PO43−.
Publisher’s Note: MDPI stays neutral with regard to jurisdictional claims in published maps and institutional affiliations. |
© 2020 by the authors. Licensee MDPI, Basel, Switzerland. This article is an open access article distributed under the terms and conditions of the Creative Commons Attribution (CC BY) license (http://creativecommons.org/licenses/by/4.0/).
Share and Cite
MDPI and ACS Style
Gmitrowicz-Iwan, J.; Ligęza, S.; Pranagal, J.; Smal, H.; Olenderek, H. Small Floodplain Reservoirs in the Face of Climate Change—Sink or Source of Nutrients? Water 2020, 12, 3423. https://doi.org/10.3390/w12123423
AMA Style
Gmitrowicz-Iwan J, Ligęza S, Pranagal J, Smal H, Olenderek H. Small Floodplain Reservoirs in the Face of Climate Change—Sink or Source of Nutrients? Water. 2020; 12(12):3423. https://doi.org/10.3390/w12123423
Chicago/Turabian StyleGmitrowicz-Iwan, Joanna, Sławomir Ligęza, Jacek Pranagal, Halina Smal, and Heronim Olenderek. 2020. "Small Floodplain Reservoirs in the Face of Climate Change—Sink or Source of Nutrients?" Water 12, no. 12: 3423. https://doi.org/10.3390/w12123423
Note that from the first issue of 2016, this journal uses article numbers instead of page numbers. See further details here.