Hydrochemical Evolution of Groundwater in Dehui, China

Abstract
1. Introduction
2. Overview of the Study Area
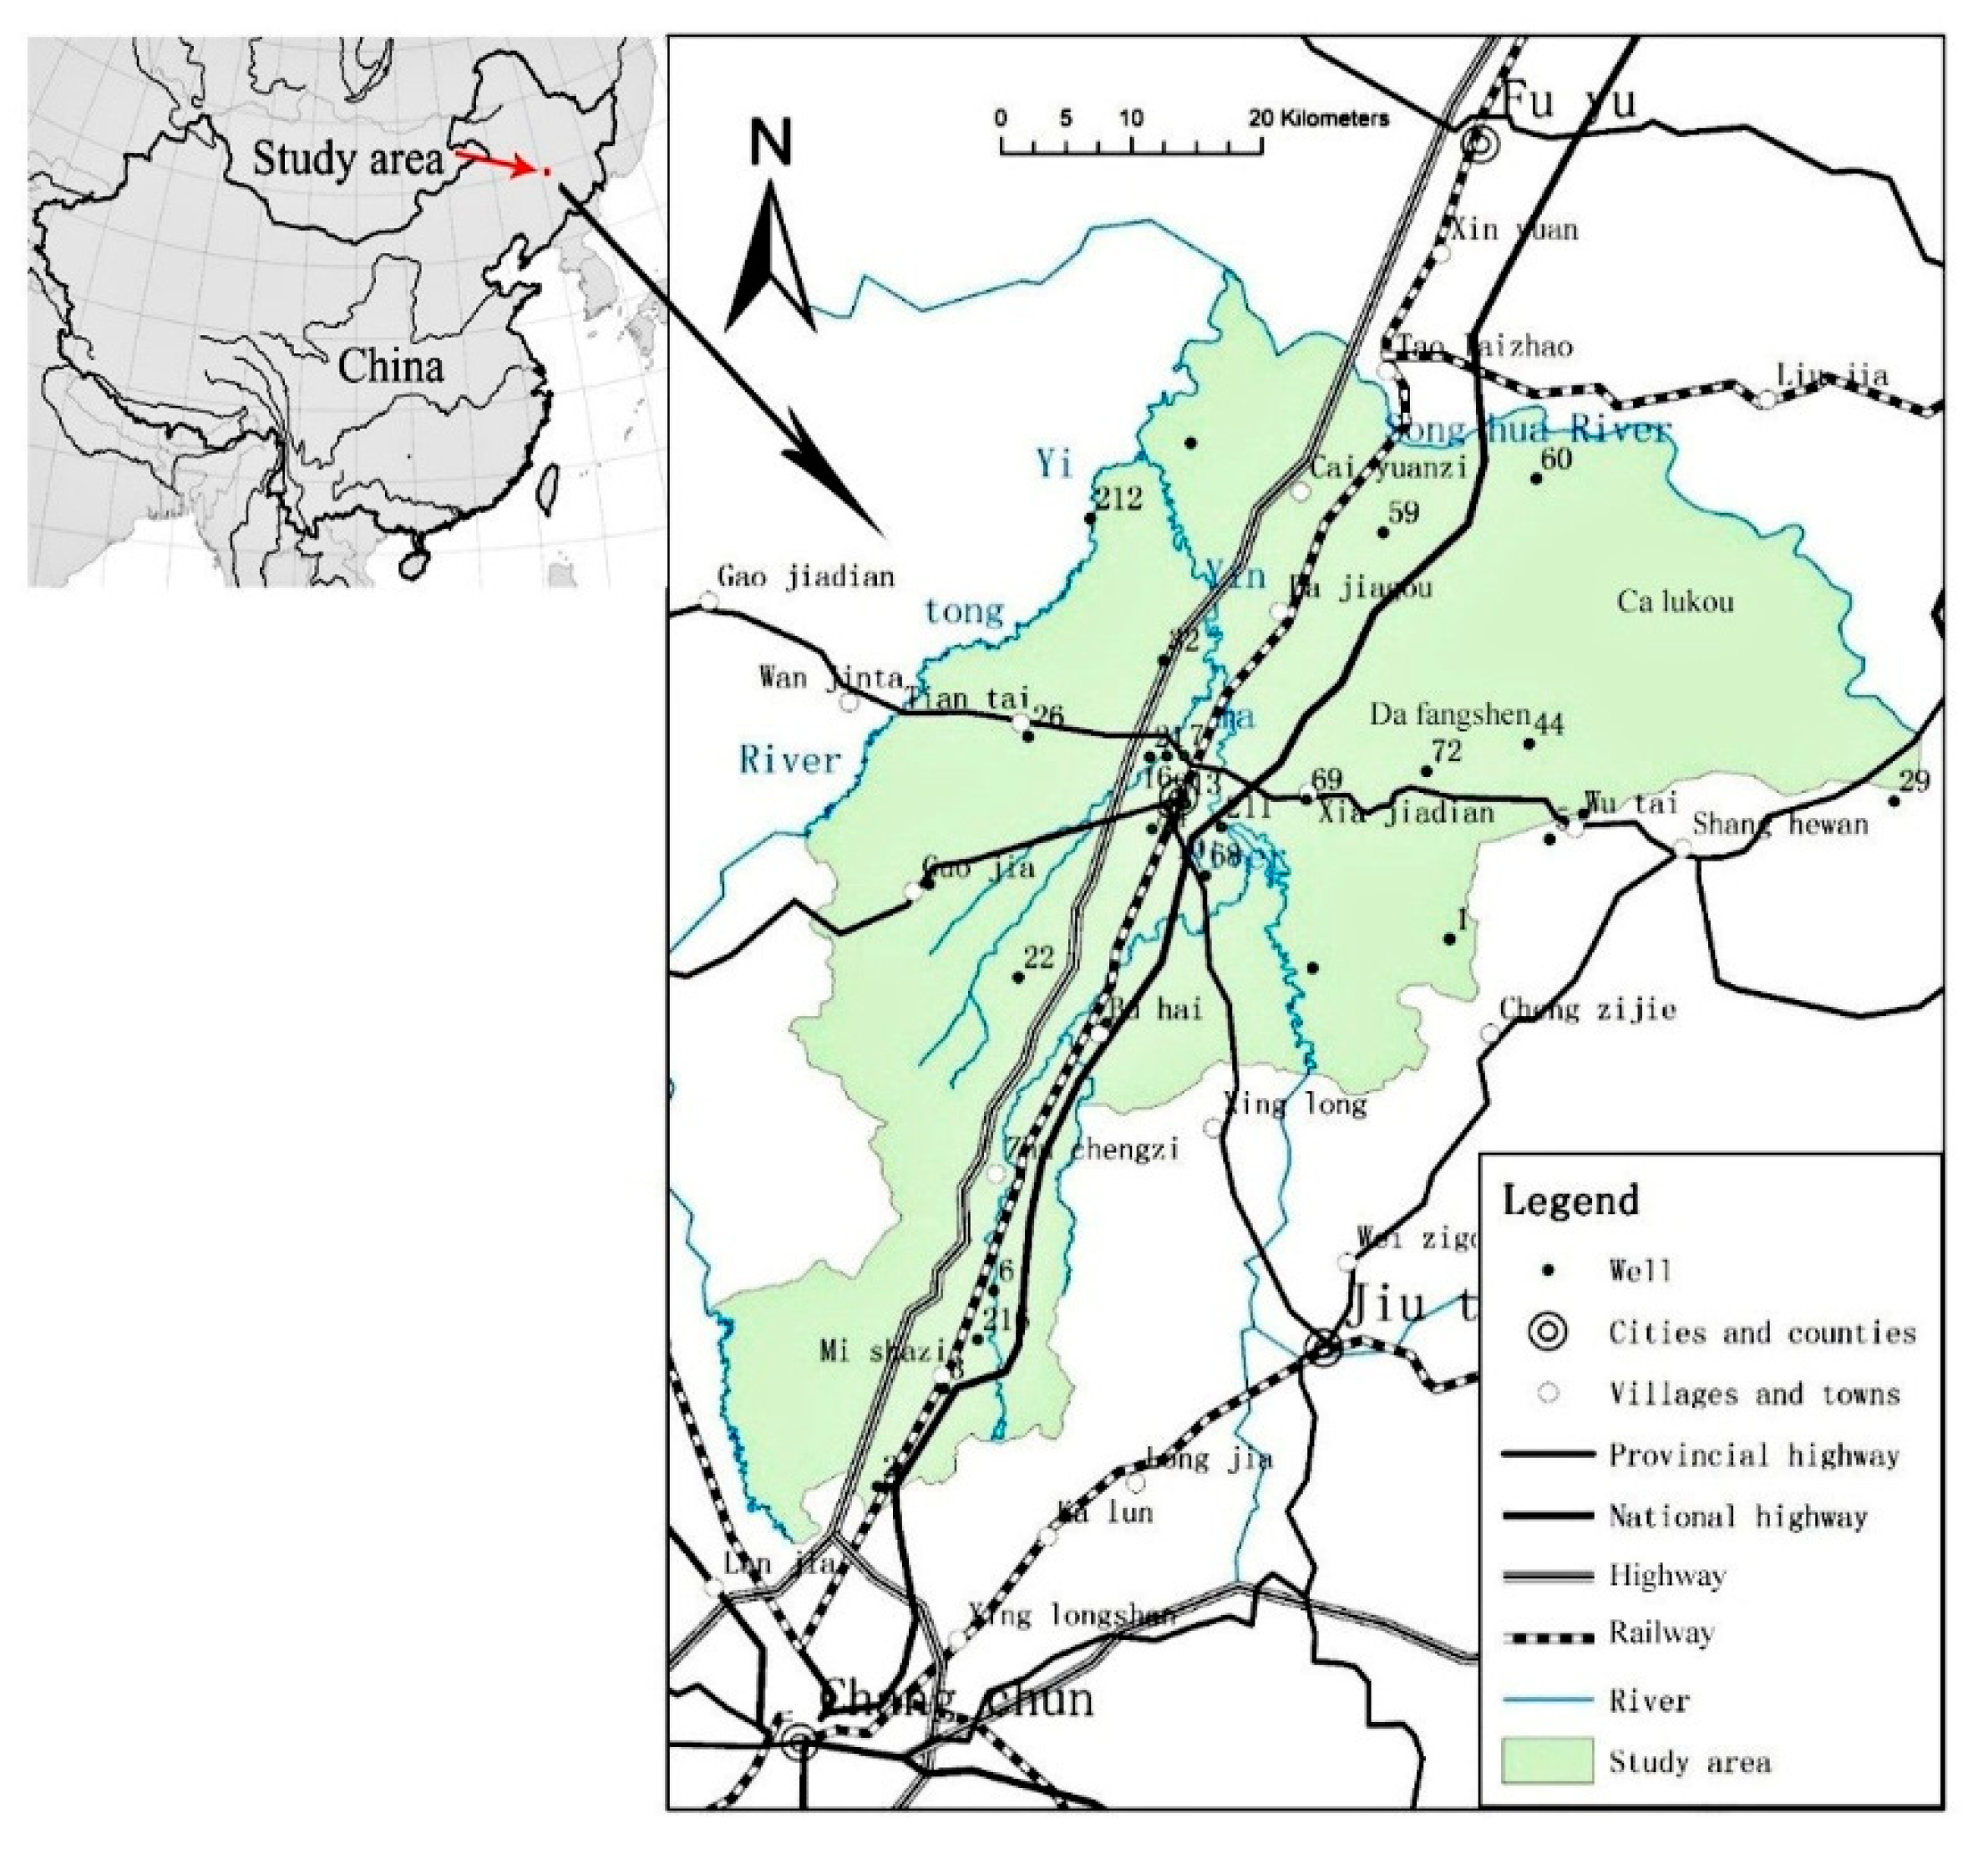
2.1. Study Area
2.2. Geology and Hydrogeology
2.2.1. Geology
2.2.2. Hydrogeology
- (1)
- Holocene modern river valley sand and gravel pore water are mainly distributed in the Second Songhua River and its tributary valleys; the aquifer medium is mainly sand and gravel alluvial layers with thickness ranging from 5 to 20 m. The groundwater level is relatively shallow and the water volume is abundant. The water inflow of a single well ranges from 500 to 3000 m3/day.
- (2)
- Pleistocene alluvial-diluvial pore water is mainly distributed in Wanbao Town, Buhai Town, and other areas. The aquifer is mainly a layer of medium and fine sand formed by alluvial and diluvial deposits, with a thickness of 2 to 4 m. The buried depth of the groundwater level is 2–5 m, and the water inflow of a single well is 100–500 m3/day.
- (3)
- Alluvial-proluvial pore water of the Middle Pleistocene is mainly distributed in tidal platforms; this aquifer is mainly composed of the alluvial-diluvial sand and gravel layer of the Middle Pleistocene, with a thickness of 10–30 m. The porosity and water yield are high (500–1000 m3/day).
- (4)
- Lower Pleistocene glacial water sand gravel pore aquifers are mainly scattered above the ancient denudation surface of the Cretaceous strata in the lower part of the tidal platforms. The thickness of the aquifer is small, only 1–3 m. The burial depth of the water level is generally greater than 5 m, and the water inflow of a single well varies from 100 to 1000 m3/day.
3. Materials and Methods
3.1. Materials
3.2. Methods
4. Results
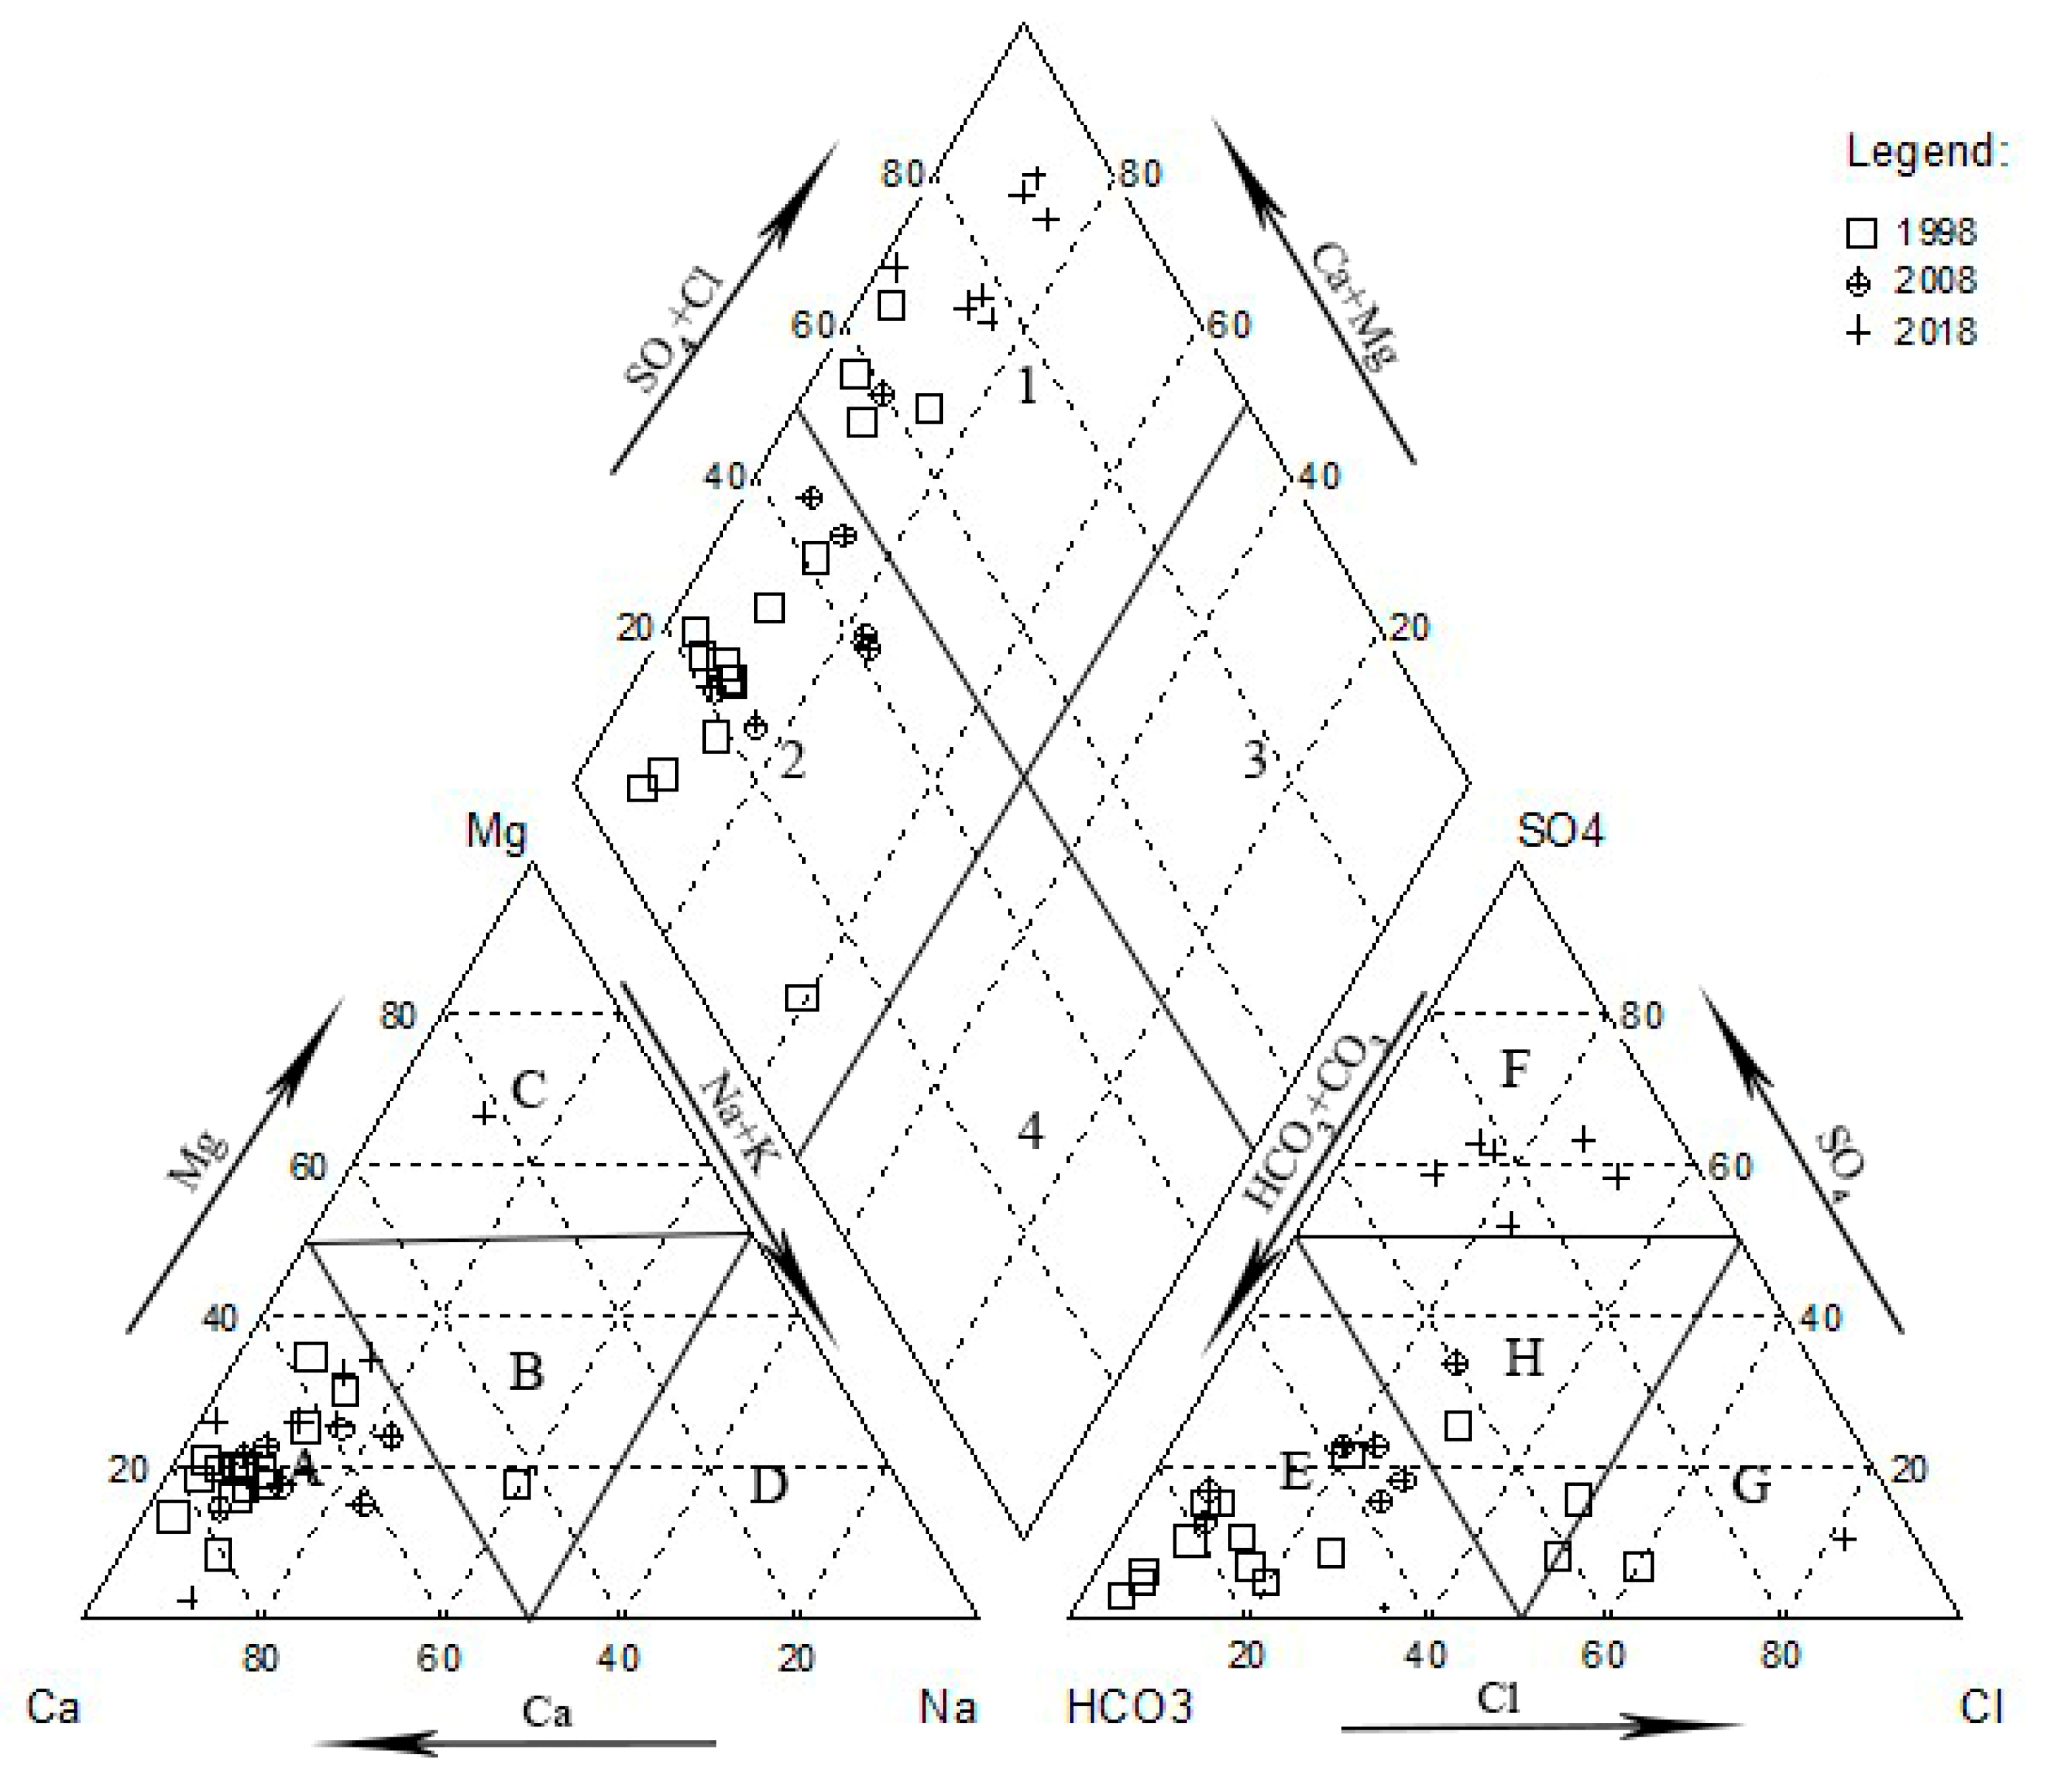
4.1. Hydrology-Chemical Analysis Results
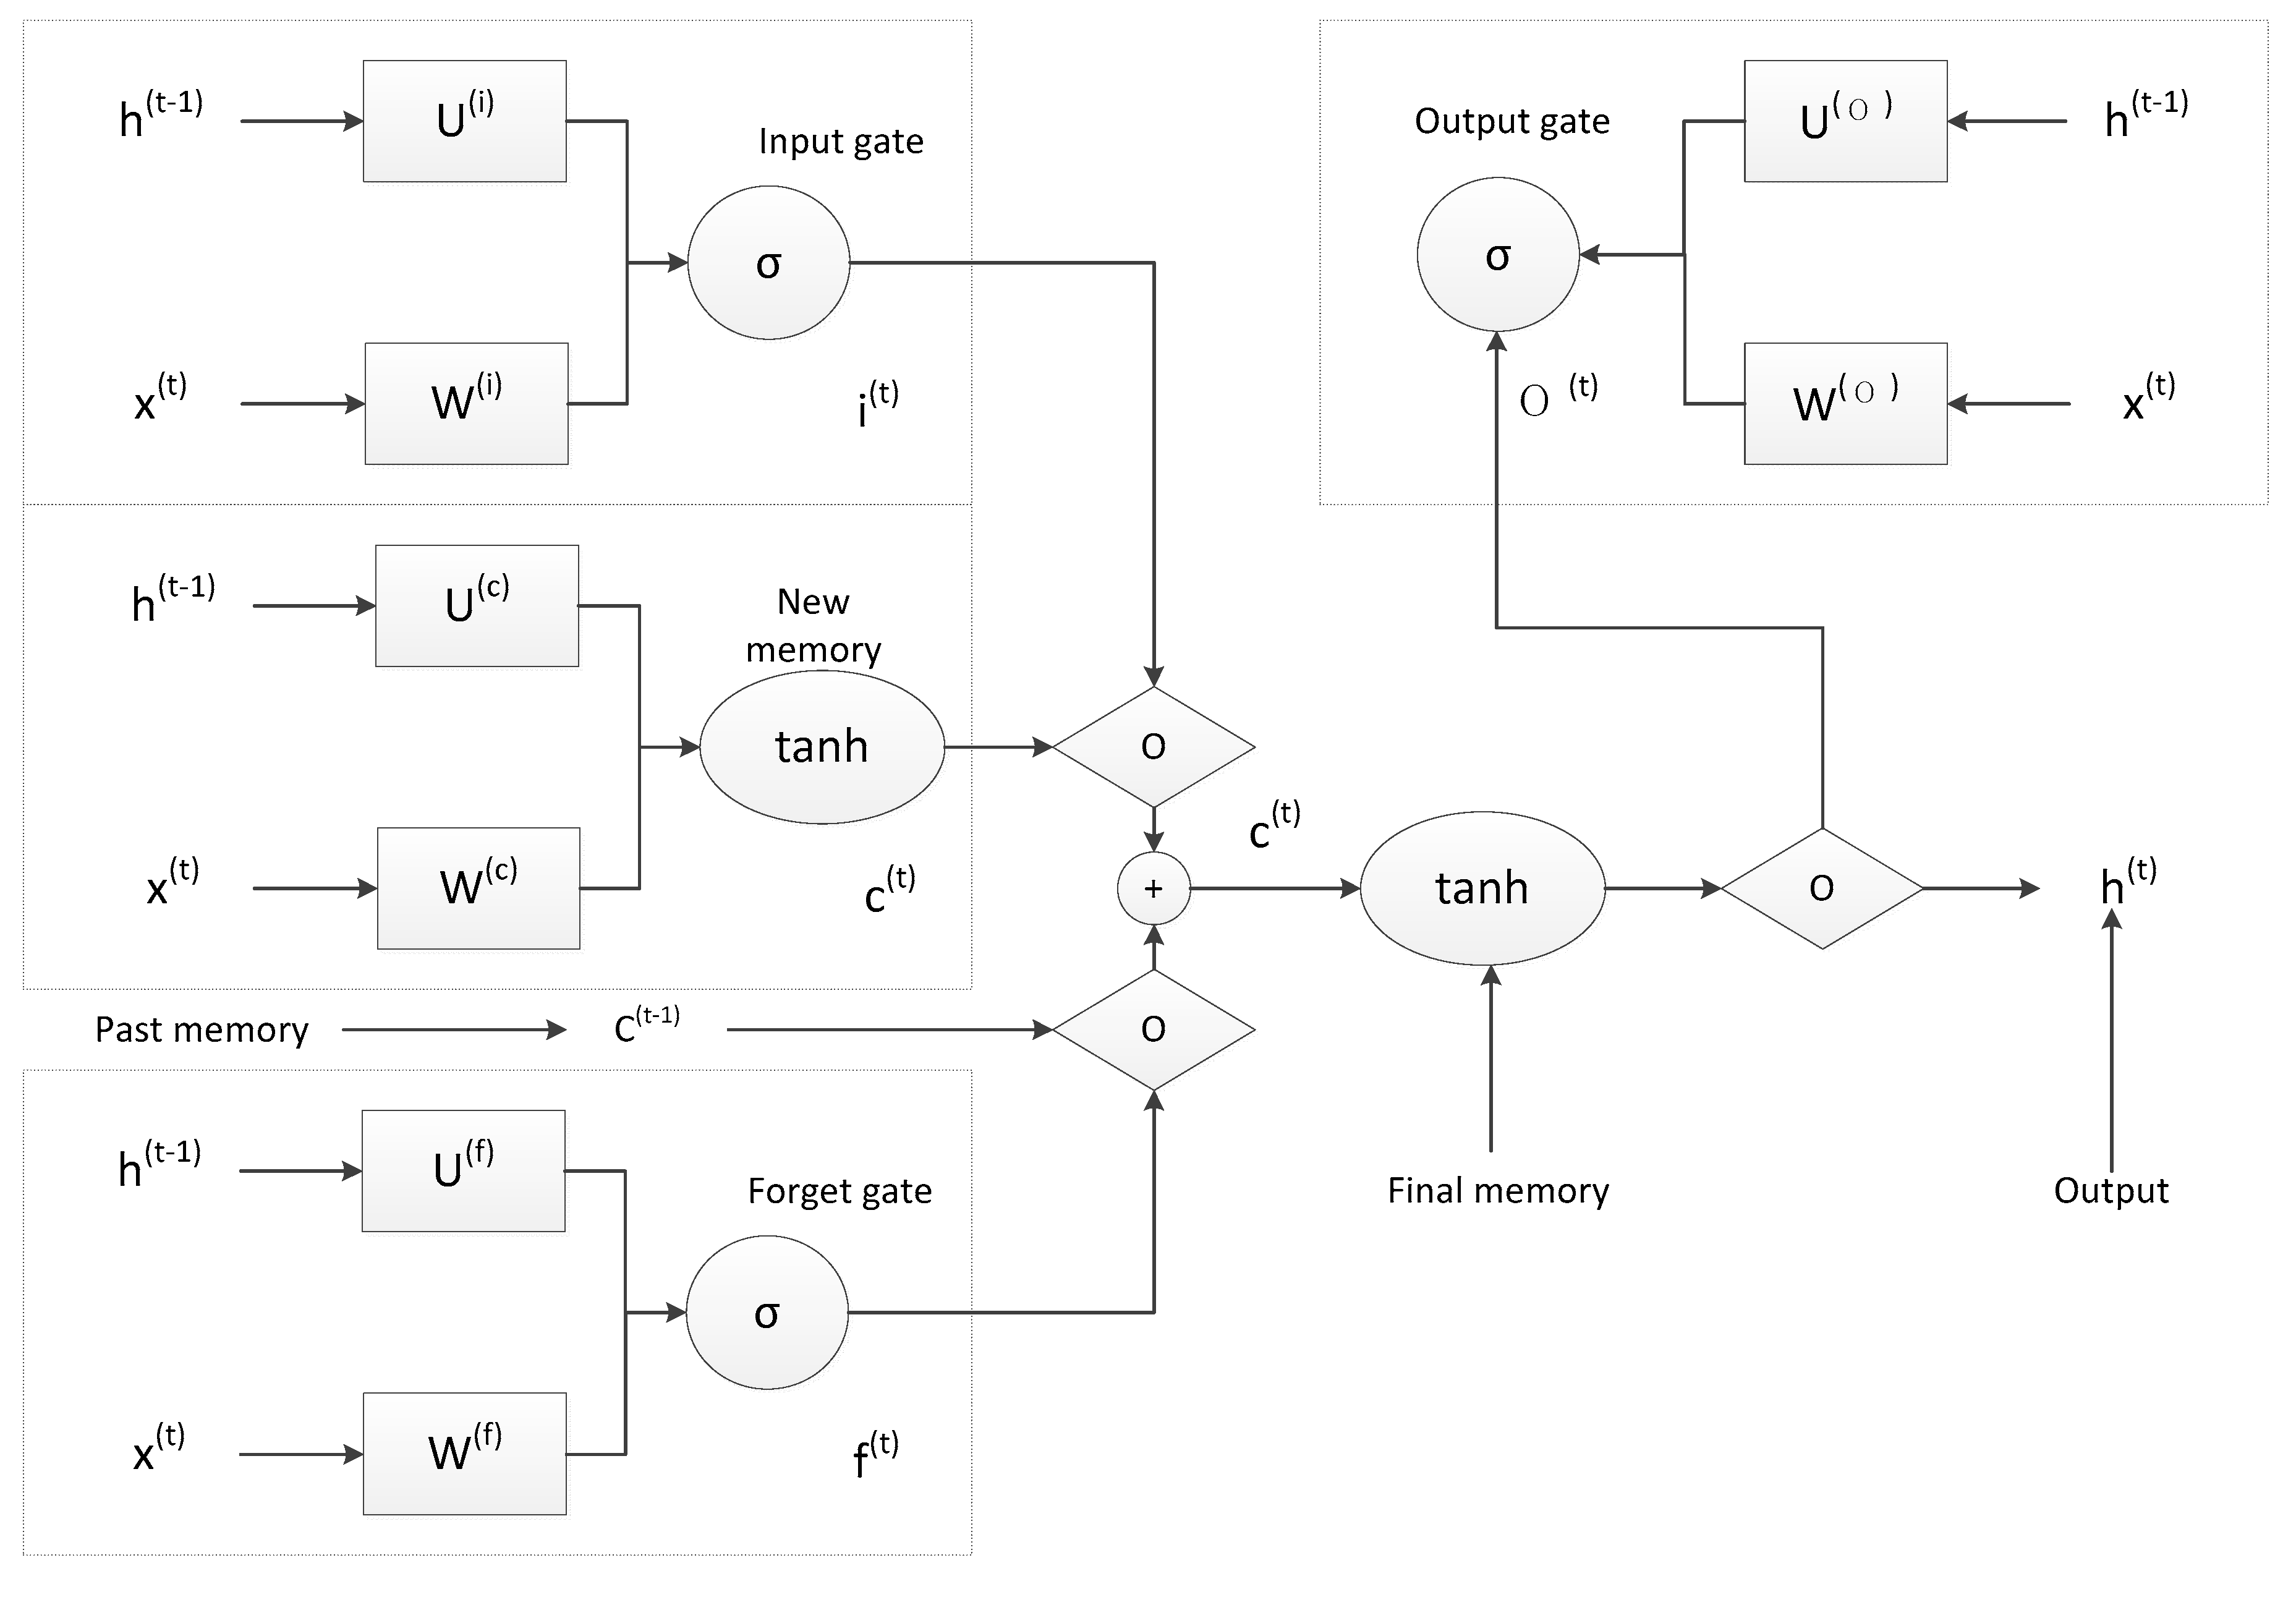
4.2. LSTM Prediction Results
5. Discussion
5.1. Causes of Major Ion Chemistry
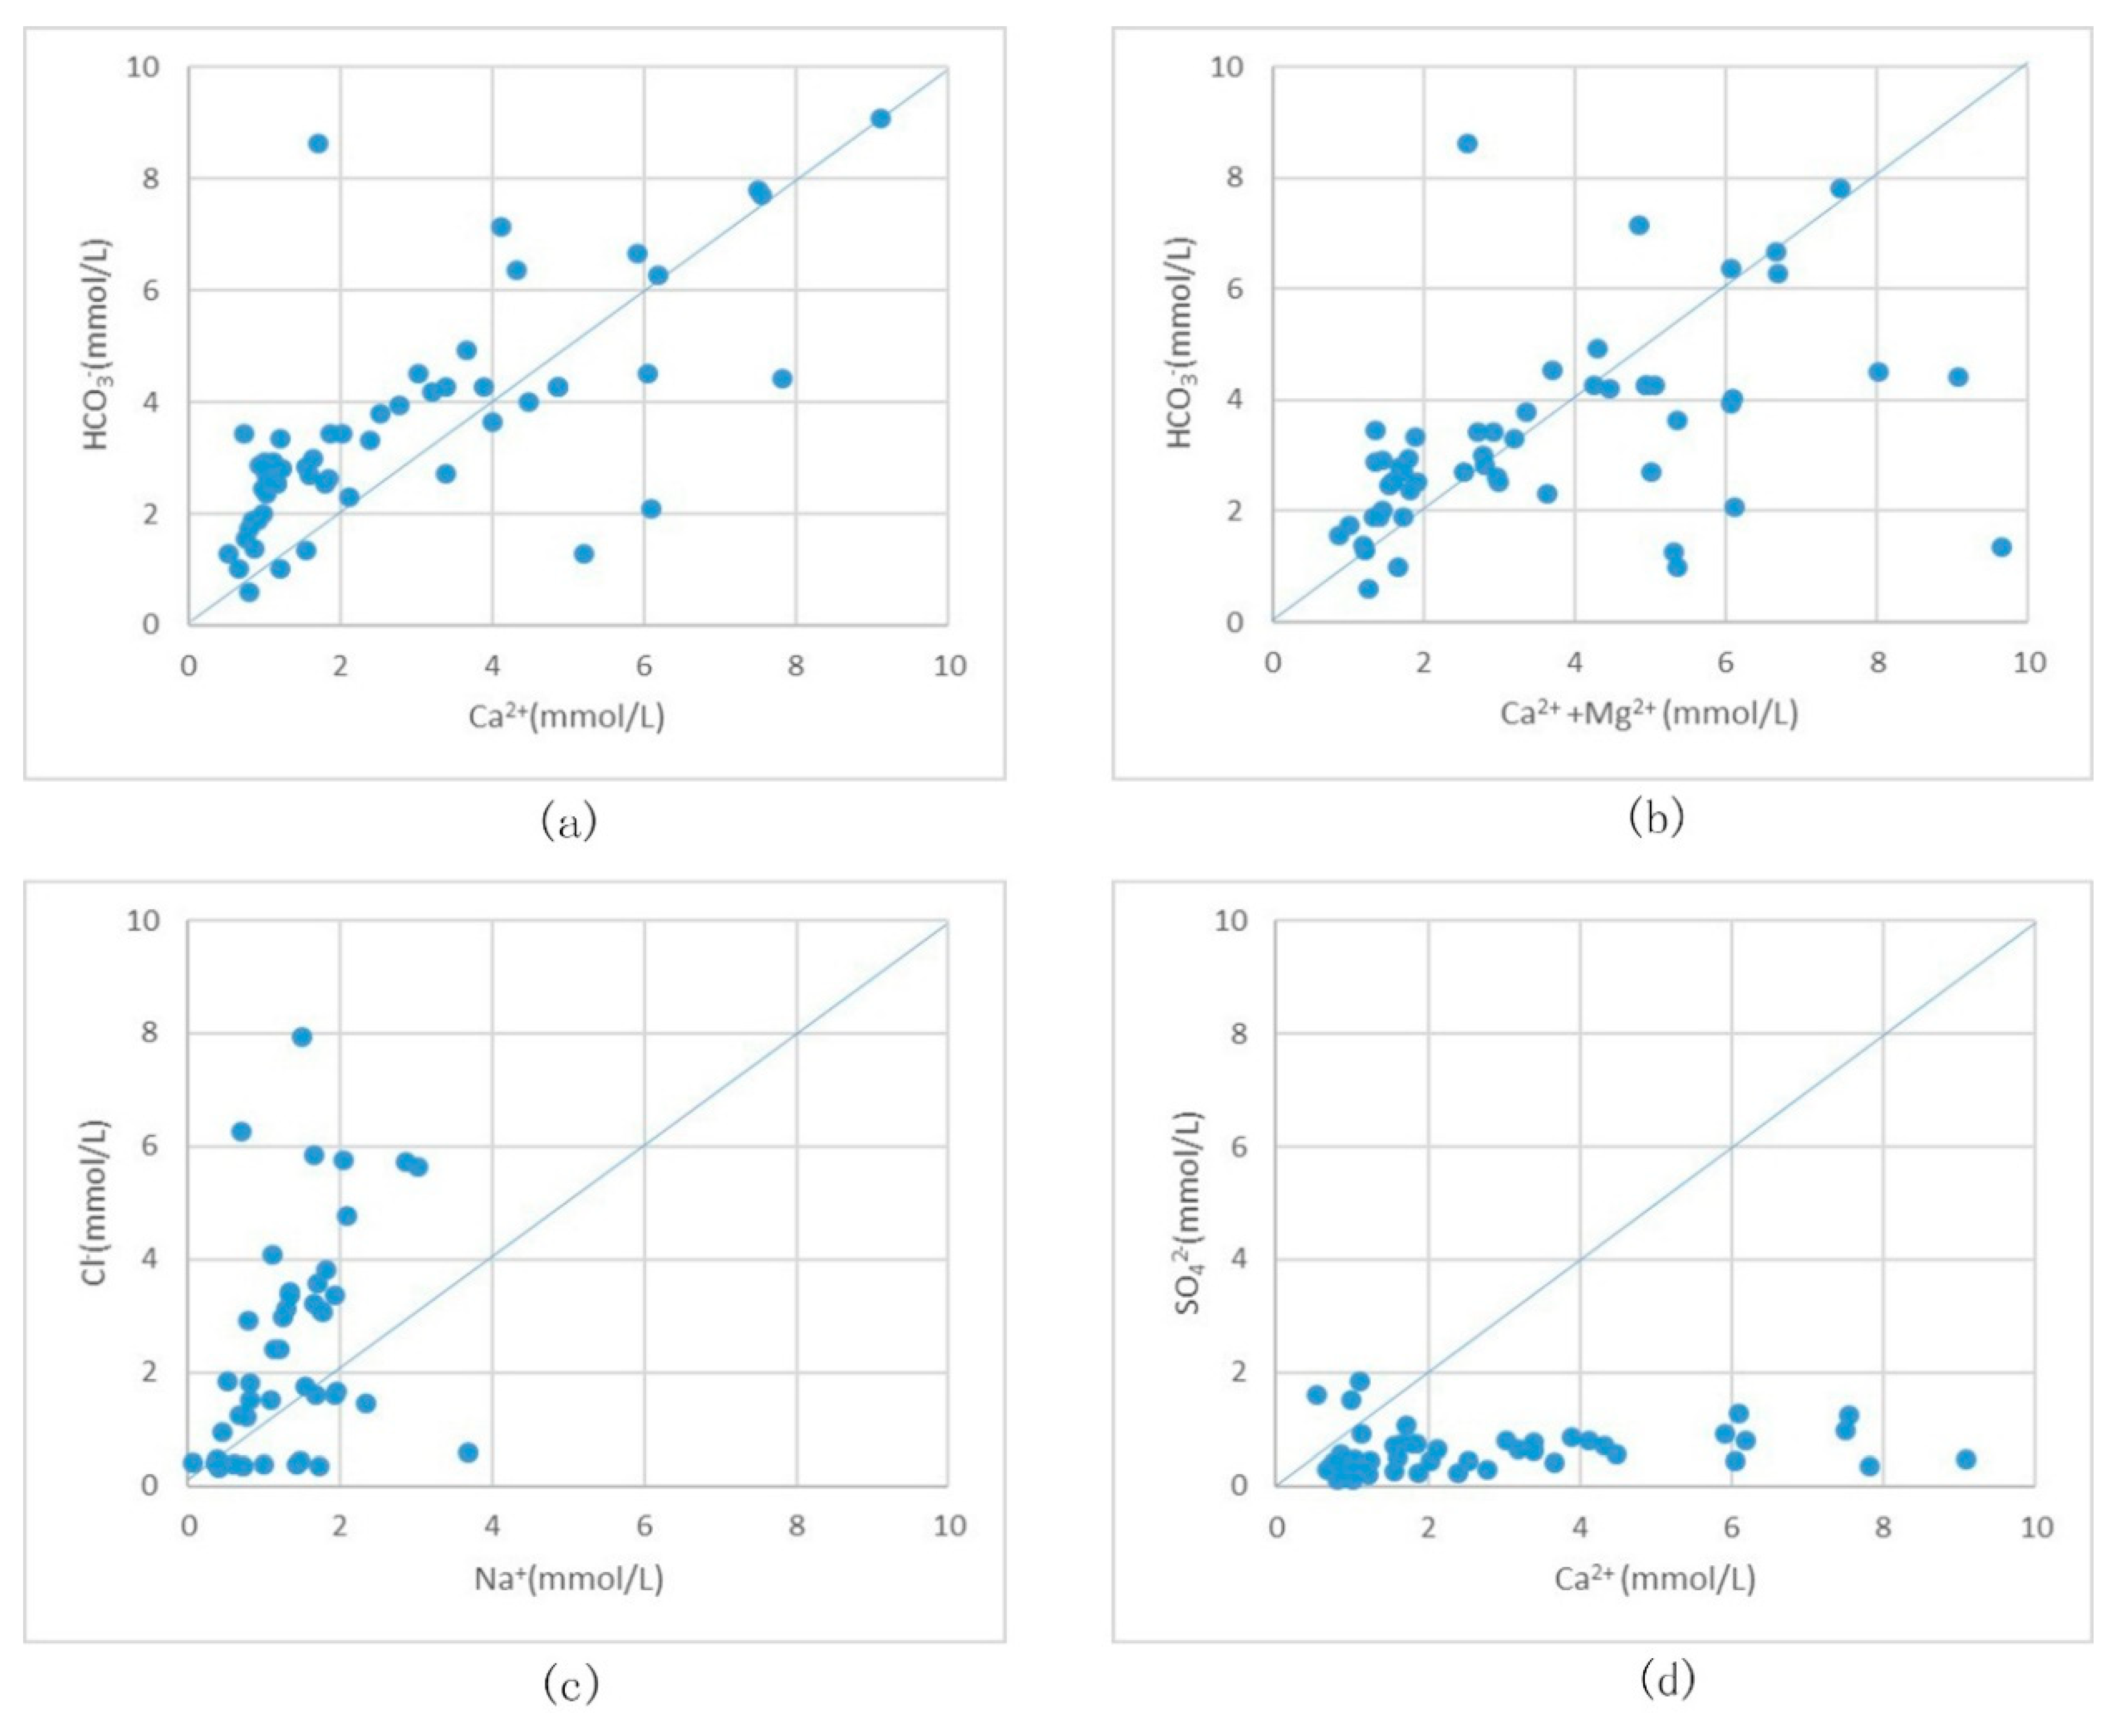
5.1.1. Analysis of Ion Source by Ion-Ratio Method
5.1.2. Groundwater Environment Analysis Ion Origin
- (1)
- Weathering and dissolution of silicate minerals in soil rocks including albite and anorthite. HCO3− is produced during the weathering process.
- (2)
- Generally, the CO2 partial pressure in soil voids is much higher than the Earth’s atmosphere, in the range of 102–104 Pa, which causes the CO2 and H2O in the soil to form H2CO3, which is unstable and is easily decomposed into HCO3−.
- (3)
- Organic matter is decomposed and oxidized; root plant respiration is another source of HCO3− in soil (O2 + CH2O = HCO3− + H+).
- (4)
- The CO2 in the atmosphere forms carbonic acid in the soil and then decomposes into HCO3− through rainwater dissolution.
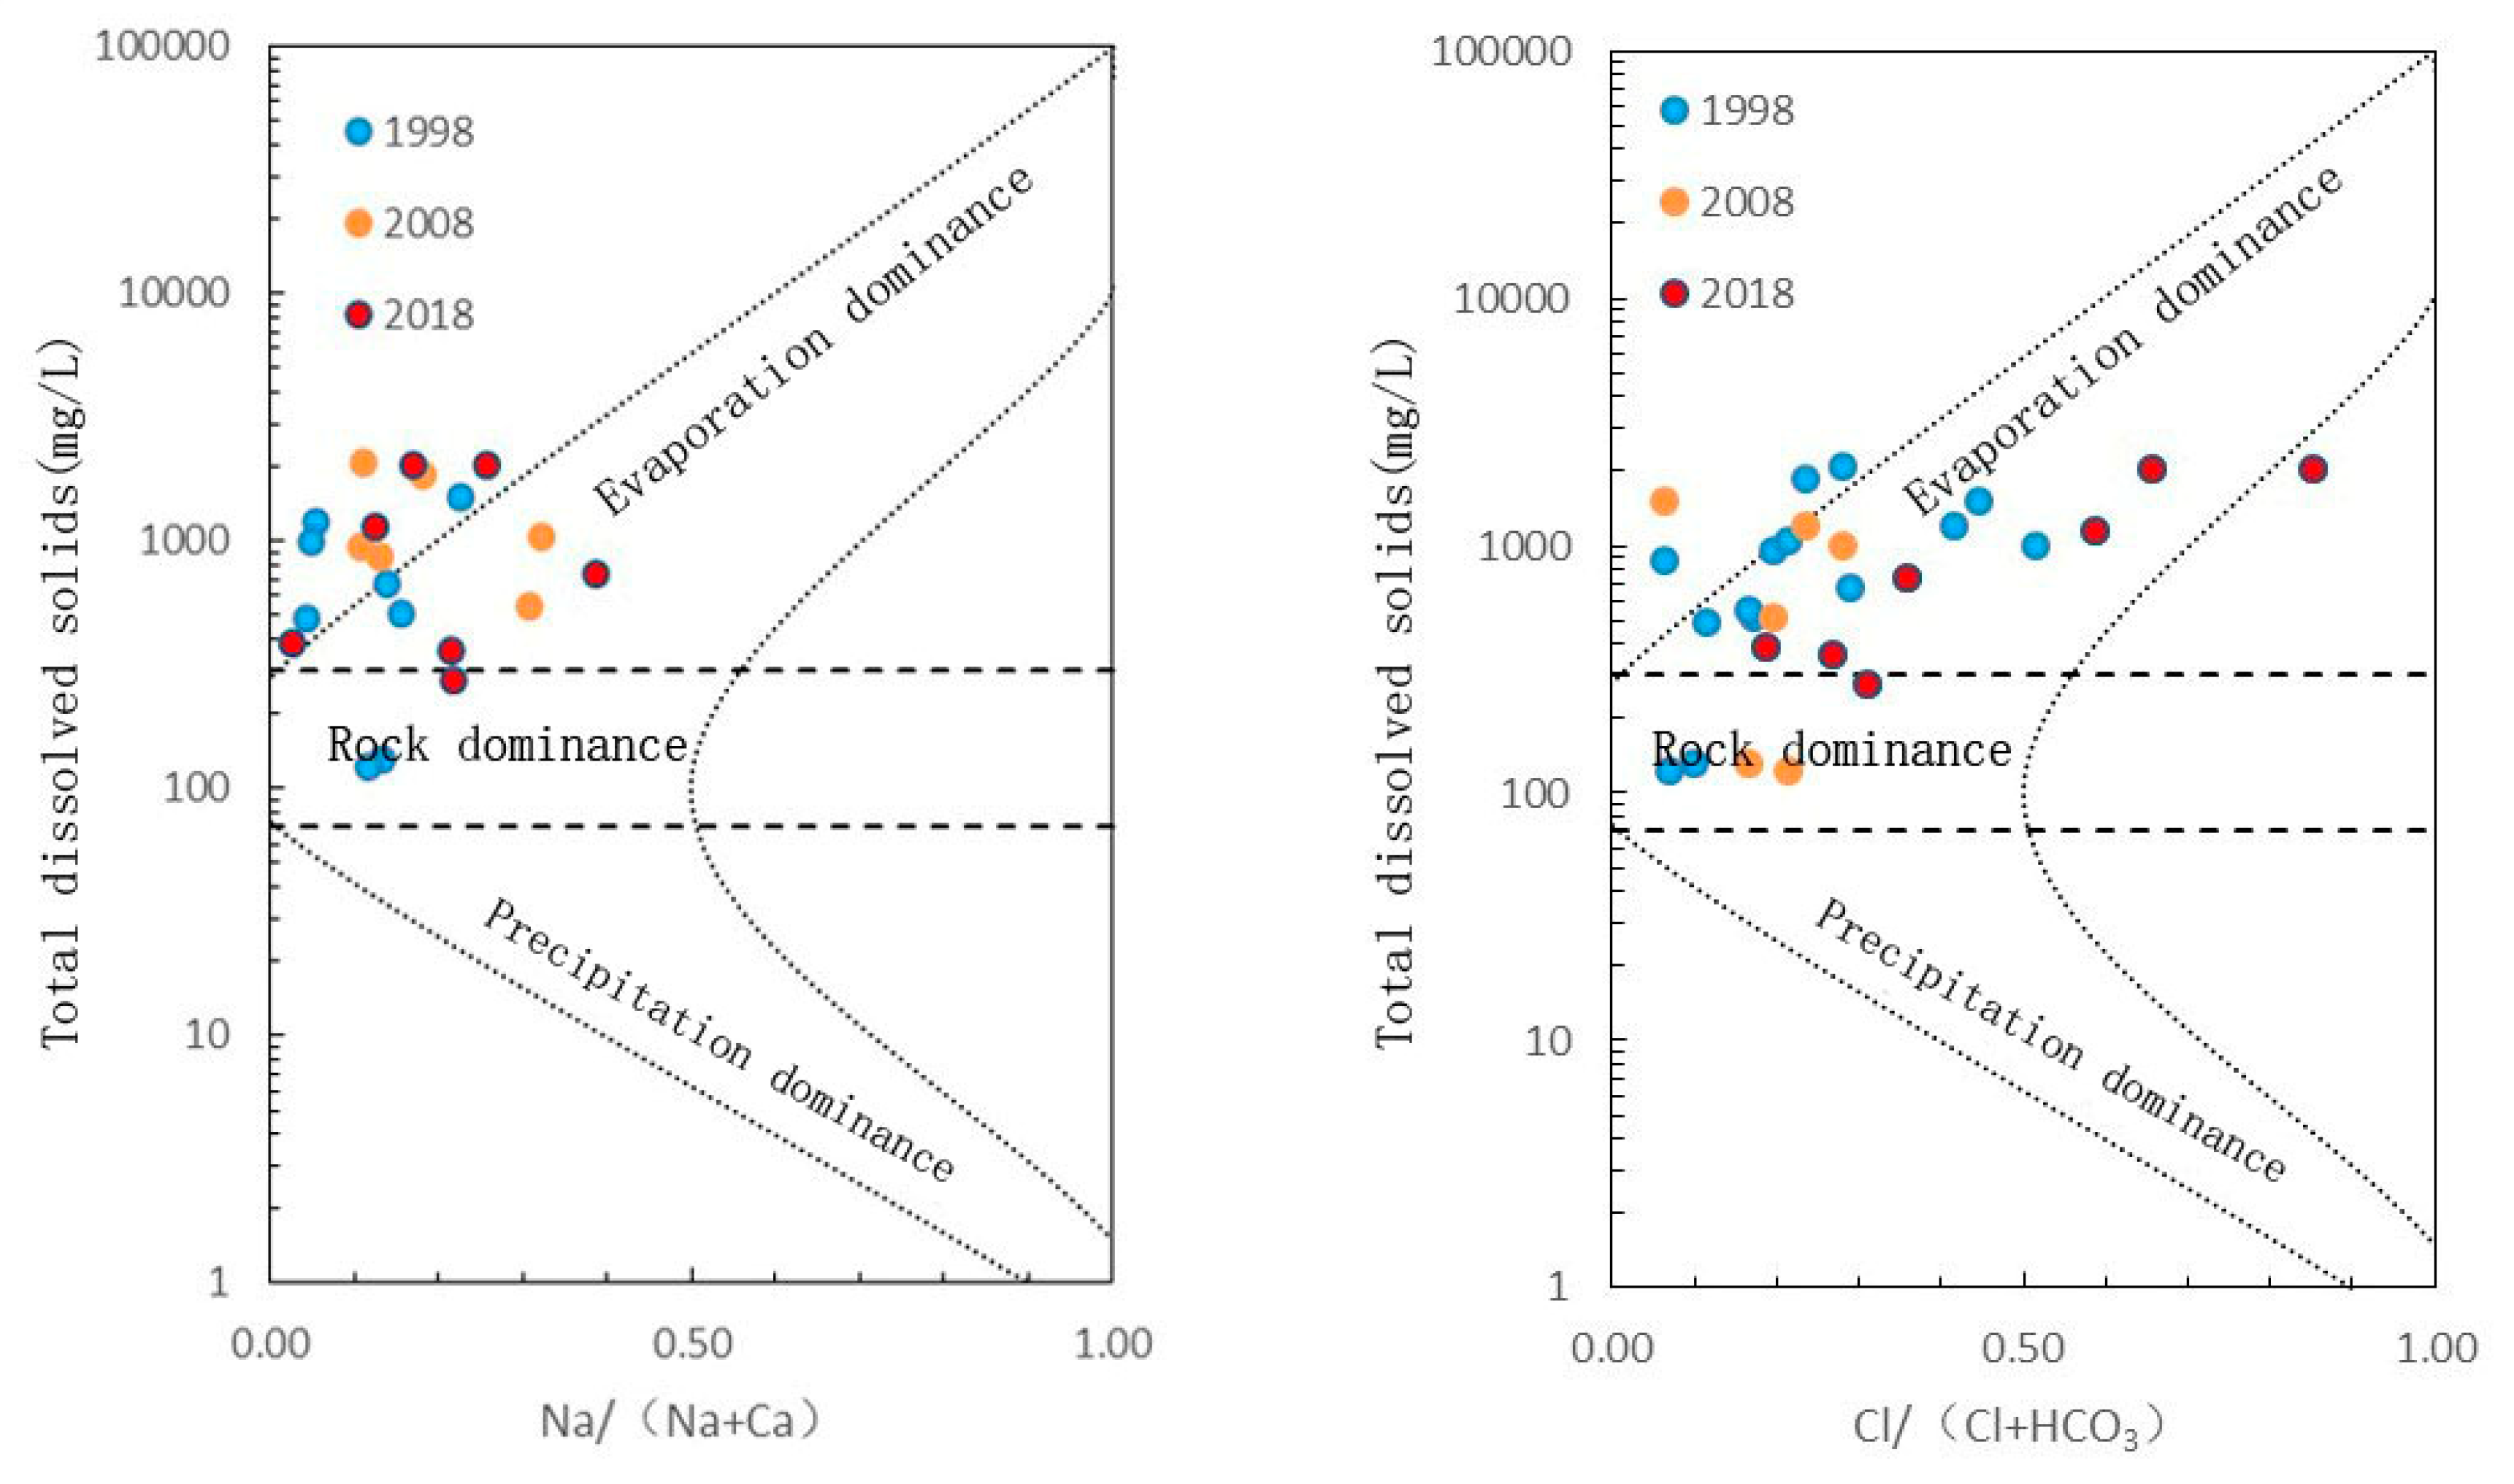
5.2. Hydrochemical Evolution and Influencing Factors
5.3. Groundwater Evolution Prediction
6. Conclusions
Author Contributions
Funding
Acknowledgments
Conflicts of Interest
References
- Delgado, C.; Pacheco, J.; Cabrera, A.; Batllori, E.; Orellana, R.; Bautista, F. Quality of groundwater for irrigation in tropical karst environment: The case of Yucatán, Mexico. Agric. Water Manag. 2010, 97, 1423–1433. [Google Scholar] [CrossRef]
- Helena, B.; Pardo, R.; Vega, M.; Barrado, E.; Fernández, J.M.; Luis Fernández, L. Temporal evolution of groundwater composition in an alluvial aquifer (Pisuerga River, Spain) by principal component analysis. Water Res. 2000, 34, 807–816. [Google Scholar] [CrossRef]
- Adams, S.; Titus, R.; Pietersen, K.; Tredoux, G.; Harris, C. Hydrochemical characteristics of aquifers near Sutherland in the Western Karoo, South Africa. J. Hydrol. 2001, 241, 91–103. [Google Scholar] [CrossRef]
- Celle-Jeanton, H.; Huneau, F.; Travi, Y.; Edmunds, W.M. Twenty years of groundwater evolution in the Triassic sandstone aquifer of Lorraine: Impacts on baseline water quality. Appl. Geochem. 2009, 24, 1198–1213. [Google Scholar] [CrossRef]
- Kuo, Y.M.; Liu, C.W.; Lin, K.H. Evaluation of the ability of an artificial neural network model to assess the variation of groundwater quality in an area of blackfoot disease in Taiwan. Water Res. 2004, 38, 148–158. [Google Scholar] [CrossRef] [PubMed]
- Ahmed, A.A.; Ali, M.H. Hydrochemical evolution and variation of groundwater and its environmental impact at Sohag, Egypt. Arab. J. Geosci. 2011, 4, 339–352. [Google Scholar] [CrossRef]
- Şen, Z. Standard ion index for groundwater quality evolution. Water Qual. Expo. Health 2011, 3, 193–202. [Google Scholar] [CrossRef]
- Rattray, G. Geochemical evolution of groundwater in the Mud Lake area, Eastern Idaho, USA. Environ. Earth Sci. 2015, 73, 8251–8269. [Google Scholar] [CrossRef]
- Kohlhepp, B.; Lehmann, R.; Seeber, P.; Küsel, K.; Trumbore, S.E.; Totsche, K.U. Aquifer configuration and geostructural links control the groundwater quality in thin-bedded carbonate–siliciclastic alternations of the Hainich CZE, central Germany. Hydrol. Earth Syst. Sci. 2017, 21, 6091–6116. [Google Scholar] [CrossRef]
- Ma, R.; Shi, J.; Liu, J.; Gui, C. Combined use of multivariate statistical analysis and hydrochemical analysis 417 for groundwater quality evolution: A case study in north chain plain. J. Earth Sci. 2014, 25, 587–597. [Google Scholar] [CrossRef]
- Edet, A. Seasonal and spatio-temporal patterns, evolution and quality of groundwater in Cross River State, Nigeria: Implications for groundwater management. Sustain. Water Resour. Manag. 2019, 5, 667–687. [Google Scholar] [CrossRef]
- Qian, F.; Changlai, X.; Da, L.; Liang, X.; Li, H.; Tian, H. Identification and spatial distribution of shallow groundwater pollution sources in Dehui City. Water Res. Hydropower Technol. 2018, 49, 111–117. [Google Scholar]
- Jingwei, L. Research on Groundwater Basic Environment in Dehui Area of Jilin Province. Master’s Thesis, Jilin University, Jilin, China, 2016. [Google Scholar]
- Xiuqiu, M. Development and utilization of groundwater and ecological environment protection. Urban Geogr. 2015, 22, 221. [Google Scholar]
- Zhonghua, L. (Ed.) Dehui City Water Supply Hydrogeological Survey Report; Dehui Statistics Bureau: Dehui, China, 2018. [Google Scholar]
- Zhongcheng, W. (Ed.) Jilin Province Groundwater Dynamic Data (1998–2018); Bureau of Hydrology and Water Resources of Jilin Province: Changchun, China, 2018. [Google Scholar]
- National Bureu Statistics of China. China Statistical Yearbook (1998–2018); China Statistics Press: Beijing, China, 2018. [Google Scholar]
- Piper, A.M. A graphic procedure in the geochemical interpretation of water-analyses. Am. Geophy. Union Trans. 1944, 25, 914–923. [Google Scholar] [CrossRef]
- Gibbs, J.R. Mechanisms controlling world water chemistry. Science 1970, 170, 1088–1090. [Google Scholar] [CrossRef]
- Subramani, T.; Rajmohan, N.; Elango, L. Groundwater geochemistry and identification of hydrogeochemical processes in a hard rock region, Southern India. Environ. Monit. Assess. 2010, 162, 123–137. [Google Scholar] [CrossRef]
- Zhang, F.; Zhangdong, J.; Jimin, Y.; Zhou, Y.; Zhoua, L. Hydrogeochemical processes between surface and groundwaters on the northeastern Chinese Loess Plateau: Implications for water chemistry and environmental evolutions in semi-arid regions. J. Geochem. Explor. 2015, 159, 115–128. [Google Scholar] [CrossRef]
- Nageswara Rao, P.V.; Appa Rao, S.; Subba Rao, N. Geochemical evolution of groundwater in the Western Delta region of River Godavari, Andhra Pradesh, India. Appl. Water Sci. 2017, 7, 1–10. [Google Scholar] [CrossRef]
- Elango, L.; Kannan, R.; Senthil, K.M. Major ion chemistry and identification of hydrogeochemical processes of ground water in a part of Kancheepuram district, Tamil Nadu, India. Environ. Geosci. 2009, 1, 157–166. [Google Scholar]
- Wu, J.; Sun, Z. Evaluation of shallow groundwater contamination and associated human health risk in an alluvial plain impacted by agricultural and industrial activities, mid-west China. Expo. Health 2016, 8, 311–329. [Google Scholar] [CrossRef]
- Wu, J.; Li, P.; Qian, H.; Duan, Z.; Zhang, X. Using correlation and multivariate statistical analysis to identify hydrogeochemical processes affecting the major ion chemistry of waters: A case study in Laoheba phosphorite mine in Sichuan, China. Arab. J. Geosci. 2014, 7, 3973–3982. [Google Scholar] [CrossRef]
- Stiff, H.A., Jr. The interpretation of chemical water analysis by means of patterns. J. Petrol. Technol. 1951, 3, 15–17. [Google Scholar] [CrossRef]
- Hui, Q.; Peiyue, L. Hydrochemical characteristics of groundwater in yinchuan plain and their control factors. Asian J. Chem. 2011, 23, 2927–2938. [Google Scholar]
- Fletcher, L.; Katkovnik, V.; Steffens, F.E.; Engelbrecht, A.P. Optimizing the number of hidden nodes of a feed forward artificial neural network. In Proceedings of the International Joint Conference on Neural Networks, Anchorage, AK, USA, 4–9 May 1998; pp. 1608–1612. [Google Scholar]
- Hochreiter, S.; Schmidhuber, J.A. Long short-term memory. Neural Comput. 1997, 9, 1735–1780. [Google Scholar] [CrossRef] [PubMed]


| Era Them | System | Series | Formation | Structure and Distribution Characteristics | Thickness (m) |
|---|---|---|---|---|---|
| Cenozoic | Q4 | Holocene | The upper part is gray-brown loam and silt interlayer, and the lower part is yellow sand and gravel. Widely distributed on floodplain sand. | 3~30 | |
| Upper Pleistocene | Gu Xiangtun | The upper part is earthy yellow loess, which is silty light loess. The lower part is the lacustrine muddy loam, loam and sand gravel layer. Mainly distributed in the edge of the high plains and valleys. | 20~40 | ||
| Lower Pleistocene | Bai Tushan | The lithology is gray-white gravel mixed with gray-green silty clay lens, with coarse top and fine bottom. The cross-bedding is developed in the upper sand layer, and the bottom is dominated by pebbles, and it is in angular unconformity contact with the lower bedrock, which is only exposed on the Dongqidaoquanzi ridge of Bian Gang Township. | 2~5 | ||
| Mesozoic | Cretaceous | Middle-lower series | Nen Jiang | The upper part is gray-black, gray-green and brown-red mudstone and sandstone interbedded layers. The lower part is black mudstone and oil shale, which are distributed in most parts of the western part of Dehui city and Dajiagou and Songhuajiang towns. | 200~600 |
| Yao Jia | It is exposed on the east steep ridge of Yaojia Station, with complete sections. There are exposed steep slopes and gullies in poplar, Dafangshen, Xiajiadian, Daqingzui and other villages. The lithology is mainly brown-red, dark purple silty mudstone and mudstone, with gray to grayish green mudstone, grayish white. Siltstone Calcareous siltstone. | 100 | |||
| Qing Shangkou | It is distributed in Yangshu Town, Dafangshen Town, and the southern part of Daqingzui Town, with some steep ridges directly exposed on the ground. The lithology is gray-white, dark blue, thin layered mudstone. | 40~65 | |||
| Quan Tou | Distributed in the Wutai Township area, exposed in the gullies, the lithology is mainly pig liver-colored, brown-red thick mudstone, the bottom of this layer is a gravelly coarse sand layer, and the sandstone is all argillaceous cement. | 300 | |||
| Deng Louku | The lithology is mainly sandstone, dark gray sandstone, mudstone, and purple sandstone. Visible in the deep part of the borehole on the bank of the Songhua River. | >1000 | |||
| Jurassic | Upper-middle series | Distributed in Banla Mountain, Chaoyang Township in the east. The exposed area is small and is the product of volcanic eruption. The lithology is Zhongxing Andesite, brown-red, with hard lithology and well-developed cracks |
| Unit | MAX | MIN | MEAN | |
|---|---|---|---|---|
| Ca2+ | mg/L | 364 | 21.64 | 108.36 |
| Mg2+ | mg/L | 219 | 0.2 | 38.97 |
| K+ | mg/L | 2.4 | 0.2 | 1.63 |
| Na+ | mg/L | 84.9 | 1.38 | 28.26 |
| Cl− | mg/L | 482 | 13.4 | 73.72 |
| SO42− | mg/L | 177 | 6.8 | 54.03 |
| HCO3− | mg/L | 554 | 36.6 | 210.03 |
| TDS (Total dissolved solids) | mg/L | 2254 | 206.2 | 703.23 |
| Ca2+ | Mg2+ | K+ | Na+ | Cl− | SO42− | HCO3− | TDS | |
|---|---|---|---|---|---|---|---|---|
| Ca2+ | 1 | |||||||
| Mg2+ | 0.2711 | 1 | ||||||
| K+ | −0.1325 | −0.0538 | 1 | |||||
| Na+ | 0.2867 | 0.1008 | 0.1388 | 1 | ||||
| Cl− | 0.5258 | 0.1853 | 0.0001 | 0.4198 | 1 | |||
| SO42− | 0.1681 | 0.2748 | 0.1306 | 0.1222 | 0.2007 | 1 | ||
| HCO3− | 0.7123 | −0.0320 | 0.0054 | 0.3680 | 0.4461 | 0.2907 | 1 | |
| TDS | 0.7536 | −0.1568 | 0.0222 | 0.2569 | 0.4395 | 0.1189 | 0.6505 | 1 |
| Ion | Years | Actual Measurement Data | Forecast Data | Absolute Error | Relative Error |
|---|---|---|---|---|---|
| Ca2+ | 2016 | 44.090 | 44.085 | −0.005 | −0.0113% |
| 32.870 | 32.876 | 0.006 | 0.0183% | ||
| 160.320 | 160.313 | −0.007 | −0.0044% | ||
| 189.180 | 189.179 | −0.001 | −0.0005% | ||
| 21.640 | 21.645 | 0.005 | 0.0231% | ||
| 2017 | 100.800 | 100.792 | −0.008 | −0.0075% | |
| 117.700 | 117.655 | −0.045 | −0.0380% | ||
| 135.900 | 135.896 | −0.004 | −0.0027% | ||
| 136.200 | 136.169 | −0.031 | −0.0230% | ||
| 130.300 | 130.297 | −0.003 | −0.0027% | ||
| 2018 | 48.500 | 48.493 | −0.007 | −0.0144% | |
| 45.500 | 45.503 | 0.003 | 0.0066% | ||
| 208.000 | 208.135 | 0.135 | 0.0649% | ||
| 204.000 | 204.096 | 0.096 | 0.0471% | ||
| 32.100 | 32.103 | 0.003 | 0.0093% | ||
| Mg2+ | 2016 | 19.44 | 19.443 | 0.003 | 0.0154% |
| 9.23 | 9.229 | −0.001 | −0.0108% | ||
| 32.08 | 32.083 | 0.003 | 0.0094% | ||
| 83.59 | 83.586 | −0.004 | −0.0048% | ||
| 16.52 | 16.527 | 0.007 | 0.0424% | ||
| 2017 | 20.60 | 20.592 | −0.008 | −0.0391% | |
| 22.00 | 22.017 | 0.017 | 0.0773% | ||
| 14.90 | 14.909 | 0.009 | 0.0600% | ||
| 10.70 | 10.695 | −0.005 | −0.0425% | ||
| 7.00 | 6.993 | −0.007 | −0.0994% | ||
| 2018 | 10.40 | 10.403 | 0.003 | 0.0288% | |
| 8.10 | 8.100 | 0.000 | 0.0000% | ||
| 2.81 | 2.810 | 0.000 | 0.0000% | ||
| 50.40 | 50.396 | −0.004 | −0.0079% | ||
| 11.40 | 11.403 | 0.003 | 0.0263% | ||
| K+ | 2016 | 0.37 | 0.369 | −0.001 | −0.2703% |
| 0.44 | 0.442 | 0.002 | 0.4545% | ||
| 0.59 | 0.587 | −0.003 | −0.5085% | ||
| 0.82 | 0.822 | 0.002 | 0.2439% | ||
| 1.39 | 1.393 | 0.003 | 0.2158% | ||
| 2017 | 0.50 | 0.498 | −0.002 | −0.3136% | |
| 0.40 | 0.402 | 0.002 | 0.4758% | ||
| 0.30 | 0.301 | 0.001 | 0.4386% | ||
| 0.30 | 0.299 | −0.001 | −0.3813% | ||
| 1.20 | 1.205 | 0.005 | 0.4011% | ||
| 2018 | 0.38 | 0.380 | 0.000 | 0.0000% | |
| 0.55 | 0.550 | 0.000 | 0.0000% | ||
| 0.85 | 0.850 | 0.000 | 0.0000% | ||
| 1.00 | 1.001 | 0.001 | 0.1000% | ||
| 1.14 | 1.140 | 0.000 | 0.0000% | ||
| Na+ | 2016 | 8.22 | 8.225 | 0.005 | 0.0608% |
| 11.65 | 11.658 | 0.008 | 0.0687% | ||
| 37.82 | 37.816 | −0.004 | −0.0106% | ||
| 38.09 | 38.088 | −0.002 | −0.0053% | ||
| 9.23 | 9.226 | −0.004 | −0.0433% | ||
| 2017 | 32.20 | 32.155 | −0.045 | −0.1411% | |
| 33.00 | 33.046 | 0.046 | 0.1387% | ||
| 31.60 | 31.636 | 0.036 | 0.1145% | ||
| 31.80 | 31.838 | 0.038 | 0.1185% | ||
| 32.00 | 31.988 | −0.012 | −0.0363% | ||
| 2018 | 1.38 | 1.381 | 0.001 | 0.0725% | |
| 12.40 | 12.403 | 0.003 | 0.0242% | ||
| 29.70 | 29.704 | 0.004 | 0.0135% | ||
| 42.20 | 42.198 | −0.002 | −0.0047% | ||
| 8.88 | 8.873 | −0.007 | −0.0788% | ||
| Cl− | 2016 | 14.90 | 14.902 | 0.002 | 0.0134% |
| 20.80 | 20.798 | −0.002 | −0.0096% | ||
| 114.00 | 114.002 | 0.002 | 0.0018% | ||
| 416.00 | 416.015 | 0.015 | 0.0036% | ||
| 10.90 | 10.903 | 0.003 | 0.0275% | ||
| 2017 | 34.90 | 34.896 | −0.004 | −0.0120% | |
| 55.50 | 55.474 | −0.026 | −0.0466% | ||
| 146.40 | 146.442 | 0.042 | 0.0289% | ||
| 209.60 | 209.552 | −0.048 | −0.0228% | ||
| 190.70 | 190.653 | −0.047 | −0.0248% | ||
| 2018 | 14.00 | 14.001 | 0.001 | 0.0071% | |
| 17.80 | 17.800 | 0.000 | 0.0000% | ||
| 111.00 | 111.013 | 0.013 | 0.0117% | ||
| 470.00 | 470.196 | 0.196 | 0.0417% | ||
| 16.40 | 16.400 | 0.000 | 0.0000% | ||
| SO42− | 2016 | 177.00 | 176.993 | −0.007 | −0.0040% |
| 13.20 | 13.225 | 0.025 | 0.1894% | ||
| 126.00 | 125.869 | −0.131 | −0.1040% | ||
| 26.30 | 26.287 | −0.013 | −0.0494% | ||
| 154.00 | 154.022 | 0.022 | 0.0143% | ||
| 2017 | 68.40 | 68.379 | −0.021 | −0.0302% | |
| 67.90 | 67.874 | −0.026 | −0.0378% | ||
| 79.00 | 78.992 | −0.008 | −0.0097% | ||
| 70.60 | 70.607 | 0.007 | 0.0093% | ||
| 76.70 | 76.746 | 0.046 | 0.0606% | ||
| 2018 | 94.30 | 94.308 | 0.008 | 0.0085% | |
| 94.30 | 94.308 | 0.008 | 0.0085% | ||
| 135.00 | 135.056 | 0.056 | 0.0415% | ||
| 28.40 | 28.402 | 0.002 | 0.0070% | ||
| 134.00 | 134.072 | 0.072 | 0.0537% | ||
| HCO3− | 2016 | 153.00 | 152.983 | −0.017 | −0.0111% |
| 77.90 | 77.900 | 0.000 | 0.0000% | ||
| 222.00 | 222.016 | 0.016 | 0.0072% | ||
| 299.00 | 298.893 | −0.107 | −0.0358% | ||
| 77.90 | 77.904 | 0.004 | 0.0051% | ||
| 2017 | 165.60 | 165.583 | −0.017 | −0.0102% | |
| 134.40 | 134.362 | −0.038 | −0.0286% | ||
| 168.00 | 167.990 | −0.010 | −0.0058% | ||
| 212.60 | 212.627 | 0.027 | 0.0127% | ||
| 224.30 | 224.262 | −0.038 | −0.0168% | ||
| 2018 | 61.00 | 61.025 | 0.025 | 0.0410% | |
| 48.80 | 48.806 | 0.006 | 0.0123% | ||
| 77.80 | 77.809 | 0.009 | 0.0116% | ||
| 80.80 | 80.810 | 0.010 | 0.0124% | ||
| 36.60 | 36.579 | −0.021 | −0.0574% |
| Ca2+ | Mg2+ | K+ | Na+ | Cl− | SO42− | HCO3− | |
|---|---|---|---|---|---|---|---|
| 62.31 | 19.08 | 0.42 | 10.13 | 43.07 | 103.74 | 112.55 | |
| 34.08 | 16.72 | 0.43 | 12.74 | 53.07 | 53.22 | 71.12 | |
| 2019 | 204.03 | 21.06 | 0.41 | 41.65 | 335.54 | 124.01 | 77.05 |
| 244.05 | 45.05 | 0.81 | 38.82 | 467.91 | 37.24 | 199.03 | |
| 27.14 | 11.09 | 1.23 | 10.13 | 43.55 | 26.63 | 61.17 | |
| 65.71 | 15.24 | 0.44 | 17.45 | 52.44 | 103.47 | 92.62 | |
| 48.12 | 47.13 | 0.46 | 13.92 | 143.01 | 74.11 | 97.13 | |
| 2020 | 237.77 | 24.12 | 0.35 | 45.33 | 419.04 | 113.04 | 90.53 |
| 224.93 | 38.45 | 0.76 | 60.32 | 515.08 | 33.16 | 140.61 | |
| 32.51 | 13.04 | 1.93 | 10.65 | 45.48 | 33.09 | 64.71 | |
| 55.65 | 18.85 | 0.43 | 17.22 | 59.01 | 99.34 | 86.12 | |
| 46.92 | 32.33 | 0.34 | 22.08 | 117.11 | 110 | 165.08 | |
| 2021 | 221.98 | 33.61 | 0.44 | 48.55 | 434.09 | 115.47 | 94.26 |
| 225.42 | 50.99 | 0.52 | 51.67 | 437.21 | 45 | 128.32 | |
| 47.72 | 12.73 | 1.53 | 15.96 | 75.5 | 38.58 | 77.23 |
Publisher’s Note: MDPI stays neutral with regard to jurisdictional claims in published maps and institutional affiliations. |
© 2020 by the authors. Licensee MDPI, Basel, Switzerland. This article is an open access article distributed under the terms and conditions of the Creative Commons Attribution (CC BY) license (http://creativecommons.org/licenses/by/4.0/).
Share and Cite
Wei, H.; Liang, X.; Liu, S.; Liu, M.; Xiao, C. Hydrochemical Evolution of Groundwater in Dehui, China. Water 2020, 12, 3378. https://doi.org/10.3390/w12123378
Wei H, Liang X, Liu S, Liu M, Xiao C. Hydrochemical Evolution of Groundwater in Dehui, China. Water. 2020; 12(12):3378. https://doi.org/10.3390/w12123378
Chicago/Turabian StyleWei, Hongyang, Xiujuan Liang, Shuhui Liu, Mingjun Liu, and Changlai Xiao. 2020. "Hydrochemical Evolution of Groundwater in Dehui, China" Water 12, no. 12: 3378. https://doi.org/10.3390/w12123378
APA StyleWei, H., Liang, X., Liu, S., Liu, M., & Xiao, C. (2020). Hydrochemical Evolution of Groundwater in Dehui, China. Water, 12(12), 3378. https://doi.org/10.3390/w12123378