Article

Trend Analysis of Nitrate Concentration in Rivers in Southern France

European Commission, Joint Research Centre (JRC), 21027 Ispra, Italy
*
Author to whom correspondence should be addressed.
Water 2020, 12(12), 3374; https://doi.org/10.3390/w12123374
Submission received: 5 November 2020 / Revised: 25 November 2020 / Accepted: 25 November 2020 / Published: 1 December 2020
(This article belongs to the Section Water Quality and Contamination)

Abstract

:
Excessive nutrients in rivers, lakes and aquifers are still threatening environmental health in Europe. Stringent regulations have led to progress in water quality, however hotspots with high nitrate concentrations still exist in Europe and understanding the impact of management on the nitrate concentrations and trends in these critical areas is still challenging. In this paper, we use the Exploration and Graphics for RivEr Trends (EGRET) statistical tool to eliminate the impact of flow variation, both short- and long-term, on nitrate concentration. We apply this tool to the south of France where water quality and quantity monitoring data is readily available. We compare the Mann–Kendall non-parametric approach to estimate trend and a methodology commonly used by Member States of the European Union when they report their progress in implementing the Nitrates Directive (referred to MSD approach hereafter). We showed that using the latter approach for the period 2008–2015 and the Mann–Kendall test leads to similar results in percentage of stations exhibiting trends, however with a significant disagreement on the stations exhibiting these trends. We further showed that when using flow-weighted nitrate concentrations instead of the simple mean nitrate concentration, the MSD approach results in a significant underestimation of the stations with an increasing trend. We also demonstrated that most of nitrate concentration time series are characterized by a bell-shaped curve with an increase of concentration from 1990 to mid-2000 and then a significant decreasing trend due to the implementation of management measures from mid-2000 to 2017. Most of the significant decreasing nitrate concentration trends are localized in Nitrate Vulnerable Zones that correspond to areas where strict nutrient management is required, highlighting the efficiency of the policy in place.

1. Introduction

Excessive nutrients in rivers and aquifers are still an environmental issue in Europe [1]. The European Environmental Agency (EEA) reports diffuse pollution as the second largest significant pressure on surface water resources after hydromorphological alteration, with agriculture the dominant source of diffuse pollution [1]. As early as 1991, the European Commission (EC) set the Nitrates Directive, a stringent regulation to control the emission of nitrate from agriculture [2]. The Directive aims at reducing pollution from nitrate coming from agriculture and preventing any further pollution. To achieve these objectives, Member States (MS) are required to identify waters affected by pollution or potentially affected if no action is taken, where pollution refers to waters where nitrate concentration is larger than 50 mg/L or could be so if no measures are taken, and water bodies affected by eutrophication or that could be so if no measures are taken. MS are required to designate Nitrate Vulnerable Zones (NVZ) which are the areas draining in the previously identified areas where good agricultural practices, for minimizing pollution from nitrate, have to be implemented. Member States may also choose to apply their Action Program throughout their territory. The Directive also requires MS to assess the effectiveness of the measures and report on their implementation every 4 years.
One key parameter of the successful implementation of the Directive is the evaluation of the trend of nitrate concentration both in surface and groundwater. The reported trends by Member States are usually calculated as the difference between the average nitrate concentrations of two consecutive reporting periods of four years (i.e., 2008–2011 and 2012–2015). This method will be referred to as the MSD approach hereafter. Based on these reported data, the European Commission estimated that 31% of all surface water monitoring stations (more than 33,000 stations were reported during the last exercise, 2012–2015) showed an improvement [3]. About 8% showed a strong improvement (a decrease of more than 5 mg NO3/L between the last two reporting periods). The European Environmental Agency (EEA), performing the Mann–Kendall non-parametric trend test [4], found that in Europe, nitrate concentration in surface waters decreased for more than 20% of the stations, attributing this decrease to the implementation of measures to control diffuse pollution and the increased efficiency of wastewater treatment collection and treatment in Europe [1]. Despite the fact that these two assessments by the EC and the EEA use different monitoring networks and cover a different period, these dissimilar results highlight the importance of the techniques used to calculate the trend. Many different methods have been developed for trend detection of water quality data based on parametric or non-parametric approaches [5]. Non-parametric methods have been used extensively due to the fewer assumptions, in particular that of the distribution of the data. Furthermore, the non-parametric approaches can handle missing data and are less sensitive to outliers [6].
Trend analysis is used to inform on the evolution in time of water quality, to verify whether waters are at risk to become polluted and to evaluate the effectiveness of management measures put in place to improve water quality. However, measured water quality data is the result of many interacting factors including climate, anthropogenic and background impacts, making the trend analysis interpretation rather difficult. Dupas et al. [7] pointed out that climate variability explains most of the observed nitrate concentration dynamics at the medium time scale (few years). Furthermore, short-term water quality data do not inform on the effectiveness of the implementation of measures, such as those required by the Nitrates Directive, due to the longer time scale of nutrient cycling and transport through the unsaturated and saturated zones [8,9]. There is a clear incongruity between the multi-decadal time scale of nitrate transport and that of the legislation timeframe of the Nitrates Directive (and Water Directives in general) for which reporting and assessment occur every four years [10]. In addition, it is difficult to separate in the measured concentrations the effects of both climate and catchment management [7]. Indeed, concentrations of nitrate fluctuate because of the measures put in place to control diffuse pollution but also because of other processes such as dilution or concentration due to the variation of the river flow [11]. Dupas et al. [12] show how long-term flow and its patterns could mask the effects of changing agricultural management.
Catchment hydrology is key, among other factors, in controlling transport of solutes from sources to streams [13]. Concentration–flow relationships have been widely used to identify sources and characterize pathways [14], and to interpolate solutes concentrations [15]. These solute–flow relationships have been categorized into three types, including transport-limited, where a solute concentration increases with flow, source-limited, where the solute decreases with flow, and chemostatic type, where solute concentration is not impacted by changes in flow [13]. However, nitrate–flow relationships can exhibit a mixed behavior with a concentrating pattern at low flow and diluting pattern at higher flow [14,16].
Changes in flow usually have a random component (short-term fluctuations) and could have a systematic component linked to longer-term changes such as climate change or other anthropogenic alterations (i.e., increased abstractions). It is important to note that systematic changes of flow due to climate change have been reported for Europe with a significant increase in annual discharge in northern Europe and decreasing trends in southern and eastern Europe [17]. Strong seasonal patterns were also observed, with a significant increase of winter streamflow [17] period, during which large stocks of nitrate are present in the soil and the soil is bare.
The random variability of flow needs to be removed before any trend analysis of solute concentrations [11], and this is particularly true when the trend focuses on short time series of solute concentration such as that used by the Nitrates Directive. However, removing the random part of the flow variation will not inform on the impact of systematic variation of flow on the solute concentrations and fluxes since they are affected both by watershed management and flow.
To understand the impacts of management measures implementation, it is of utmost importance to dispose of tools that allow the accurate quantification of nitrate concentrations and load trends and that apportion the trends to flow variation components (both random and systematic) and river basin component (management). Removing the random component of the water discharge is critical to identify the trend in a water quality time series. Further, removing the impact of the systematic variability of flow could inform on the effect of other factors, in particular watershed management, on the water quality trend.
The purpose of this paper is to estimate the trend of nitrate concentration in Southern France using different approaches. We use a recently modified statistical analysis approach combined with a high space and temporal resolution monitoring program in Southern France to generate time series of nitrate concentration where the random and systematic flow variations were removed. We then calculate the trends of nitrate concentration in rivers and apportion these trends to impacts due to watershed management and those due to long-term flow trend. The trend outcomes are compared to the trends estimated with the MSD approach, analyzing the potential policy impact of using different methodologies.

2. Materials and Methods
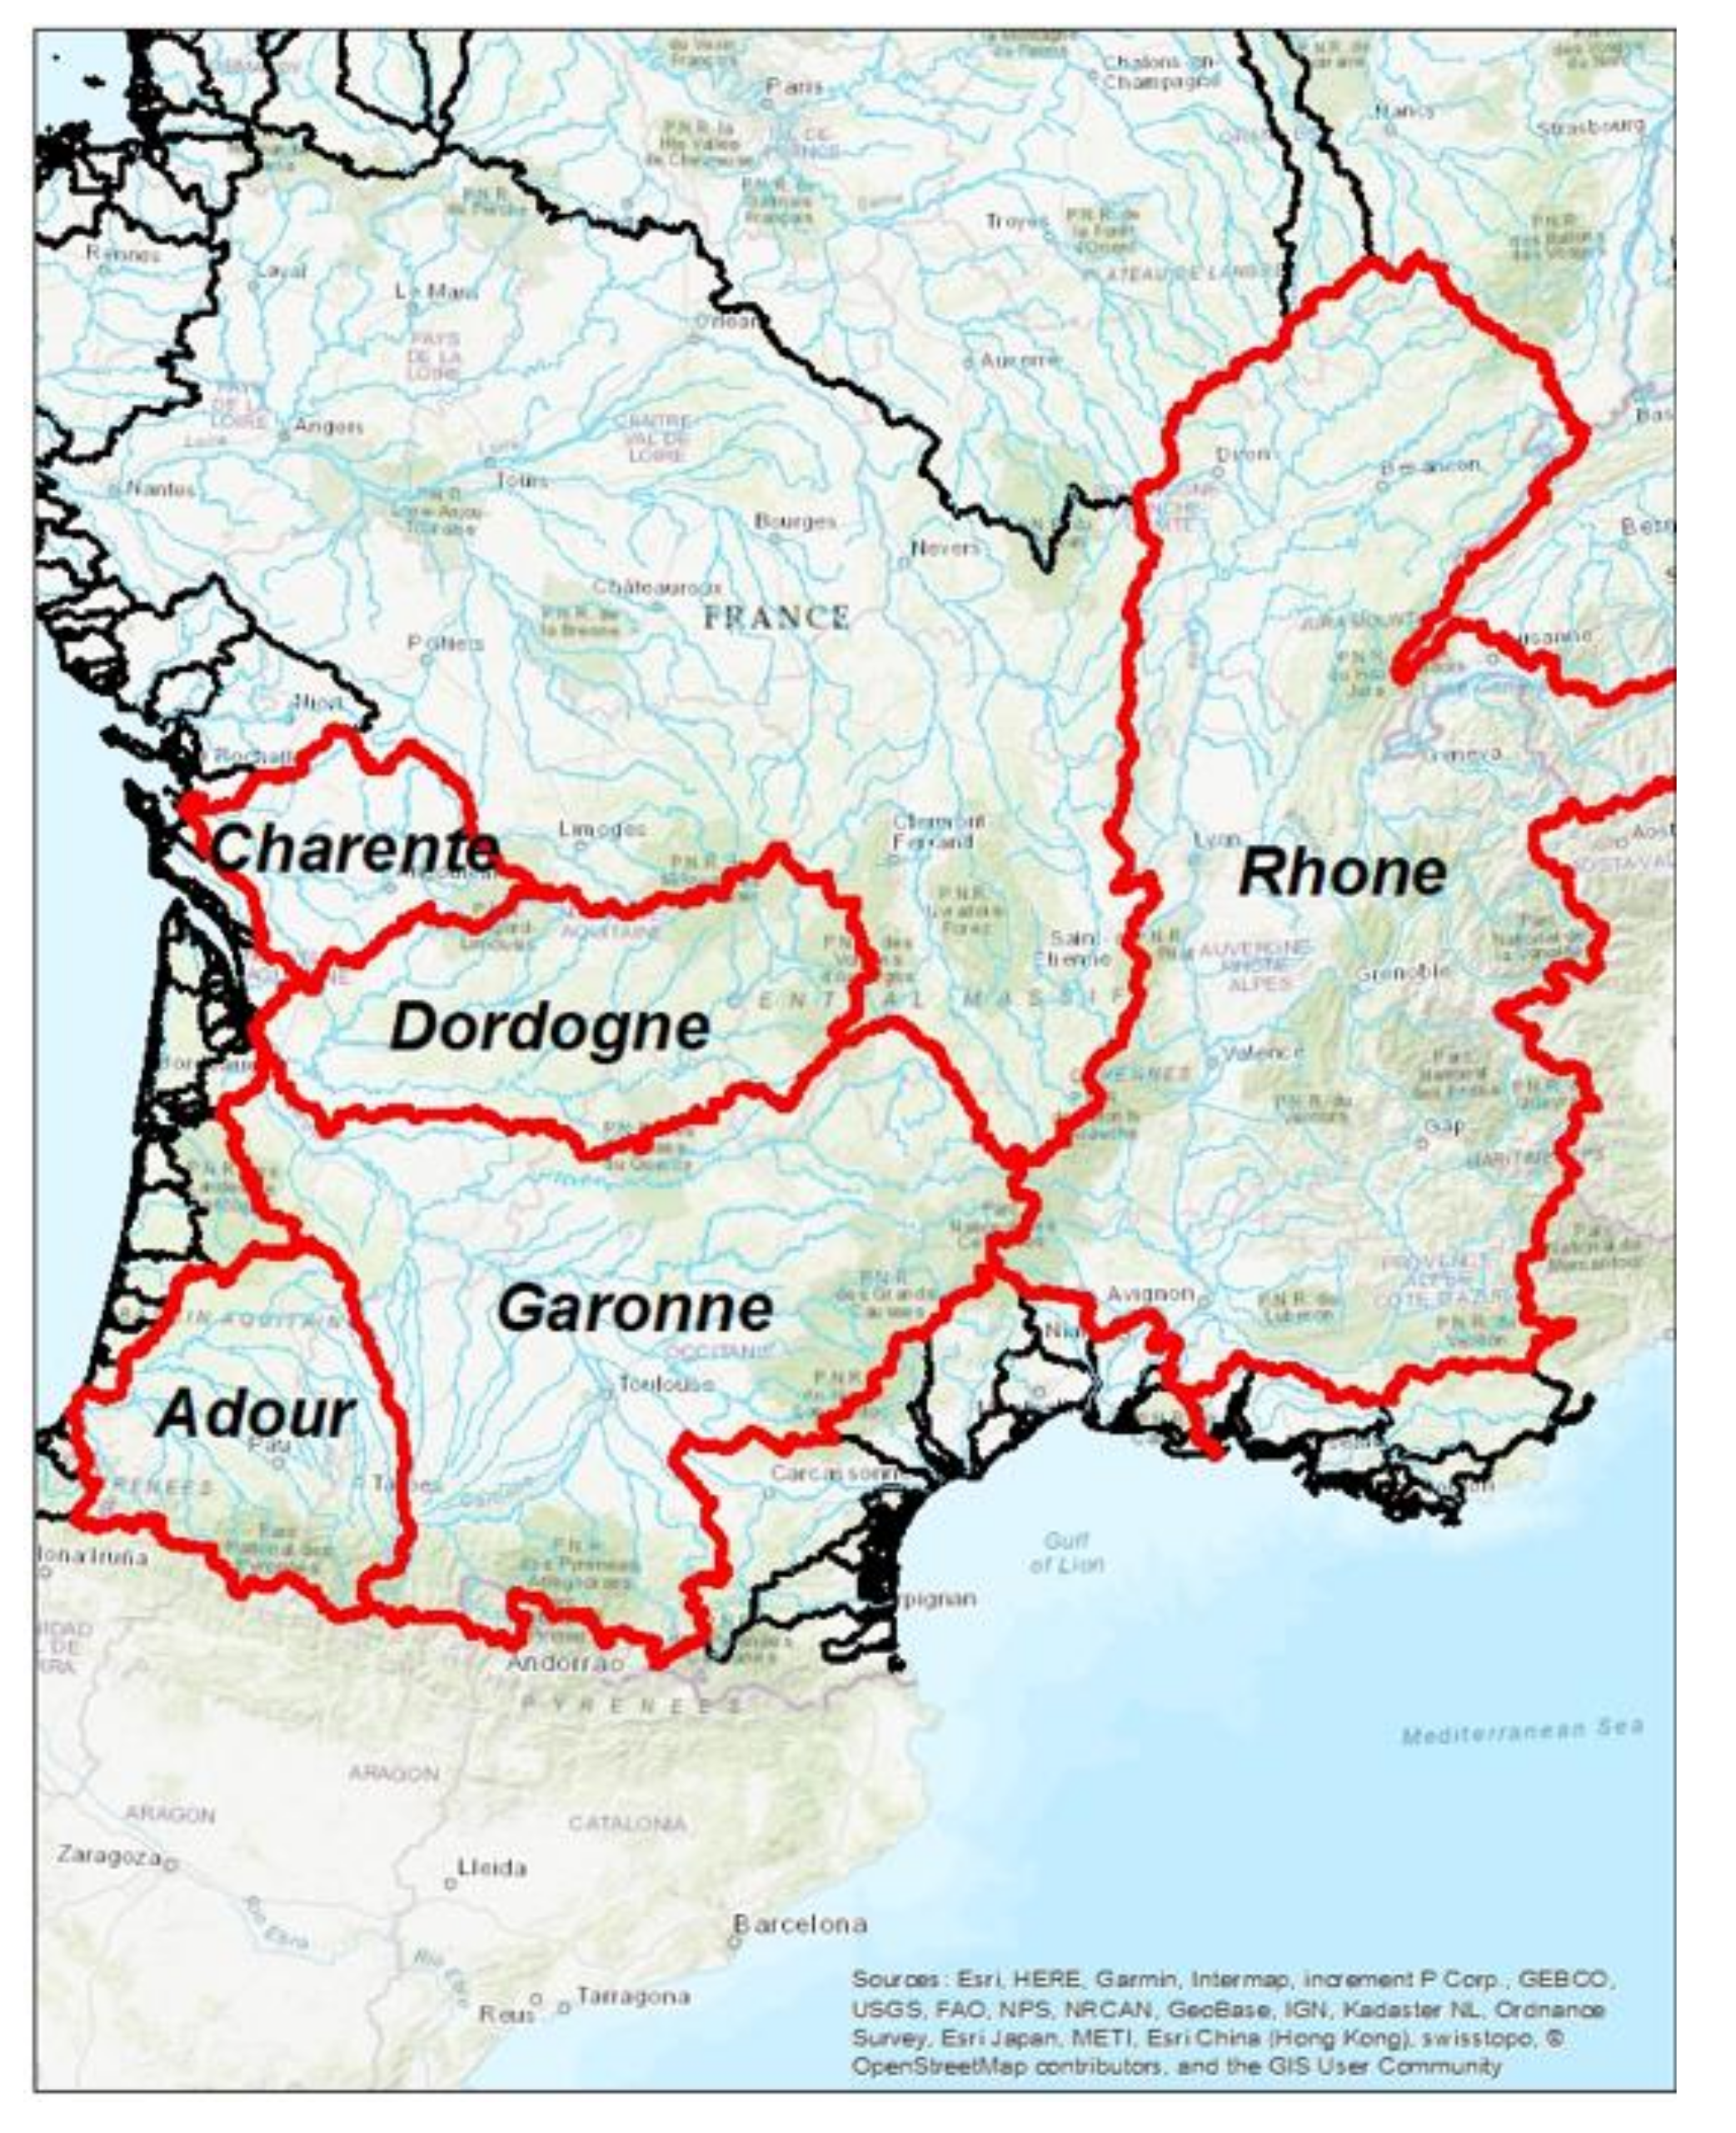
2.1. Study Area

The study focused on parts of the Rhone-Mediterranean-Corsica and the Adour-Garonne River Basins Districts (Figure 1), where long-term water quality data is readily available and easily accessible. The area covered in the analysis includes the following river basins: Adour, Garonne, Dordogne and Charente (all belonging to the Adour-Garonne River Basins District), and the Rhone (Figure 1), covering a surface area of about 204,000 km2, representing about 37% of the Metropolitan French area. These regions are quite different in terms of reported significant pressures and impacts on surface water bodies (Table 1).
The Adour-Garonne River Basin District surface area is mostly occupied by agriculture (60%) [18]. The Rhone-Mediterranean area is covered by 27% agriculture [19]. The Adour Garonne is significantly more impacted by nutrient pollution coming from agriculture, while the dominant pressure in the Rhone is hydromorphology, with only 21% of surface water bodies affected by nutrient pollution (Table 1). The major characteristics of the individual river basins are provided in Table 2.

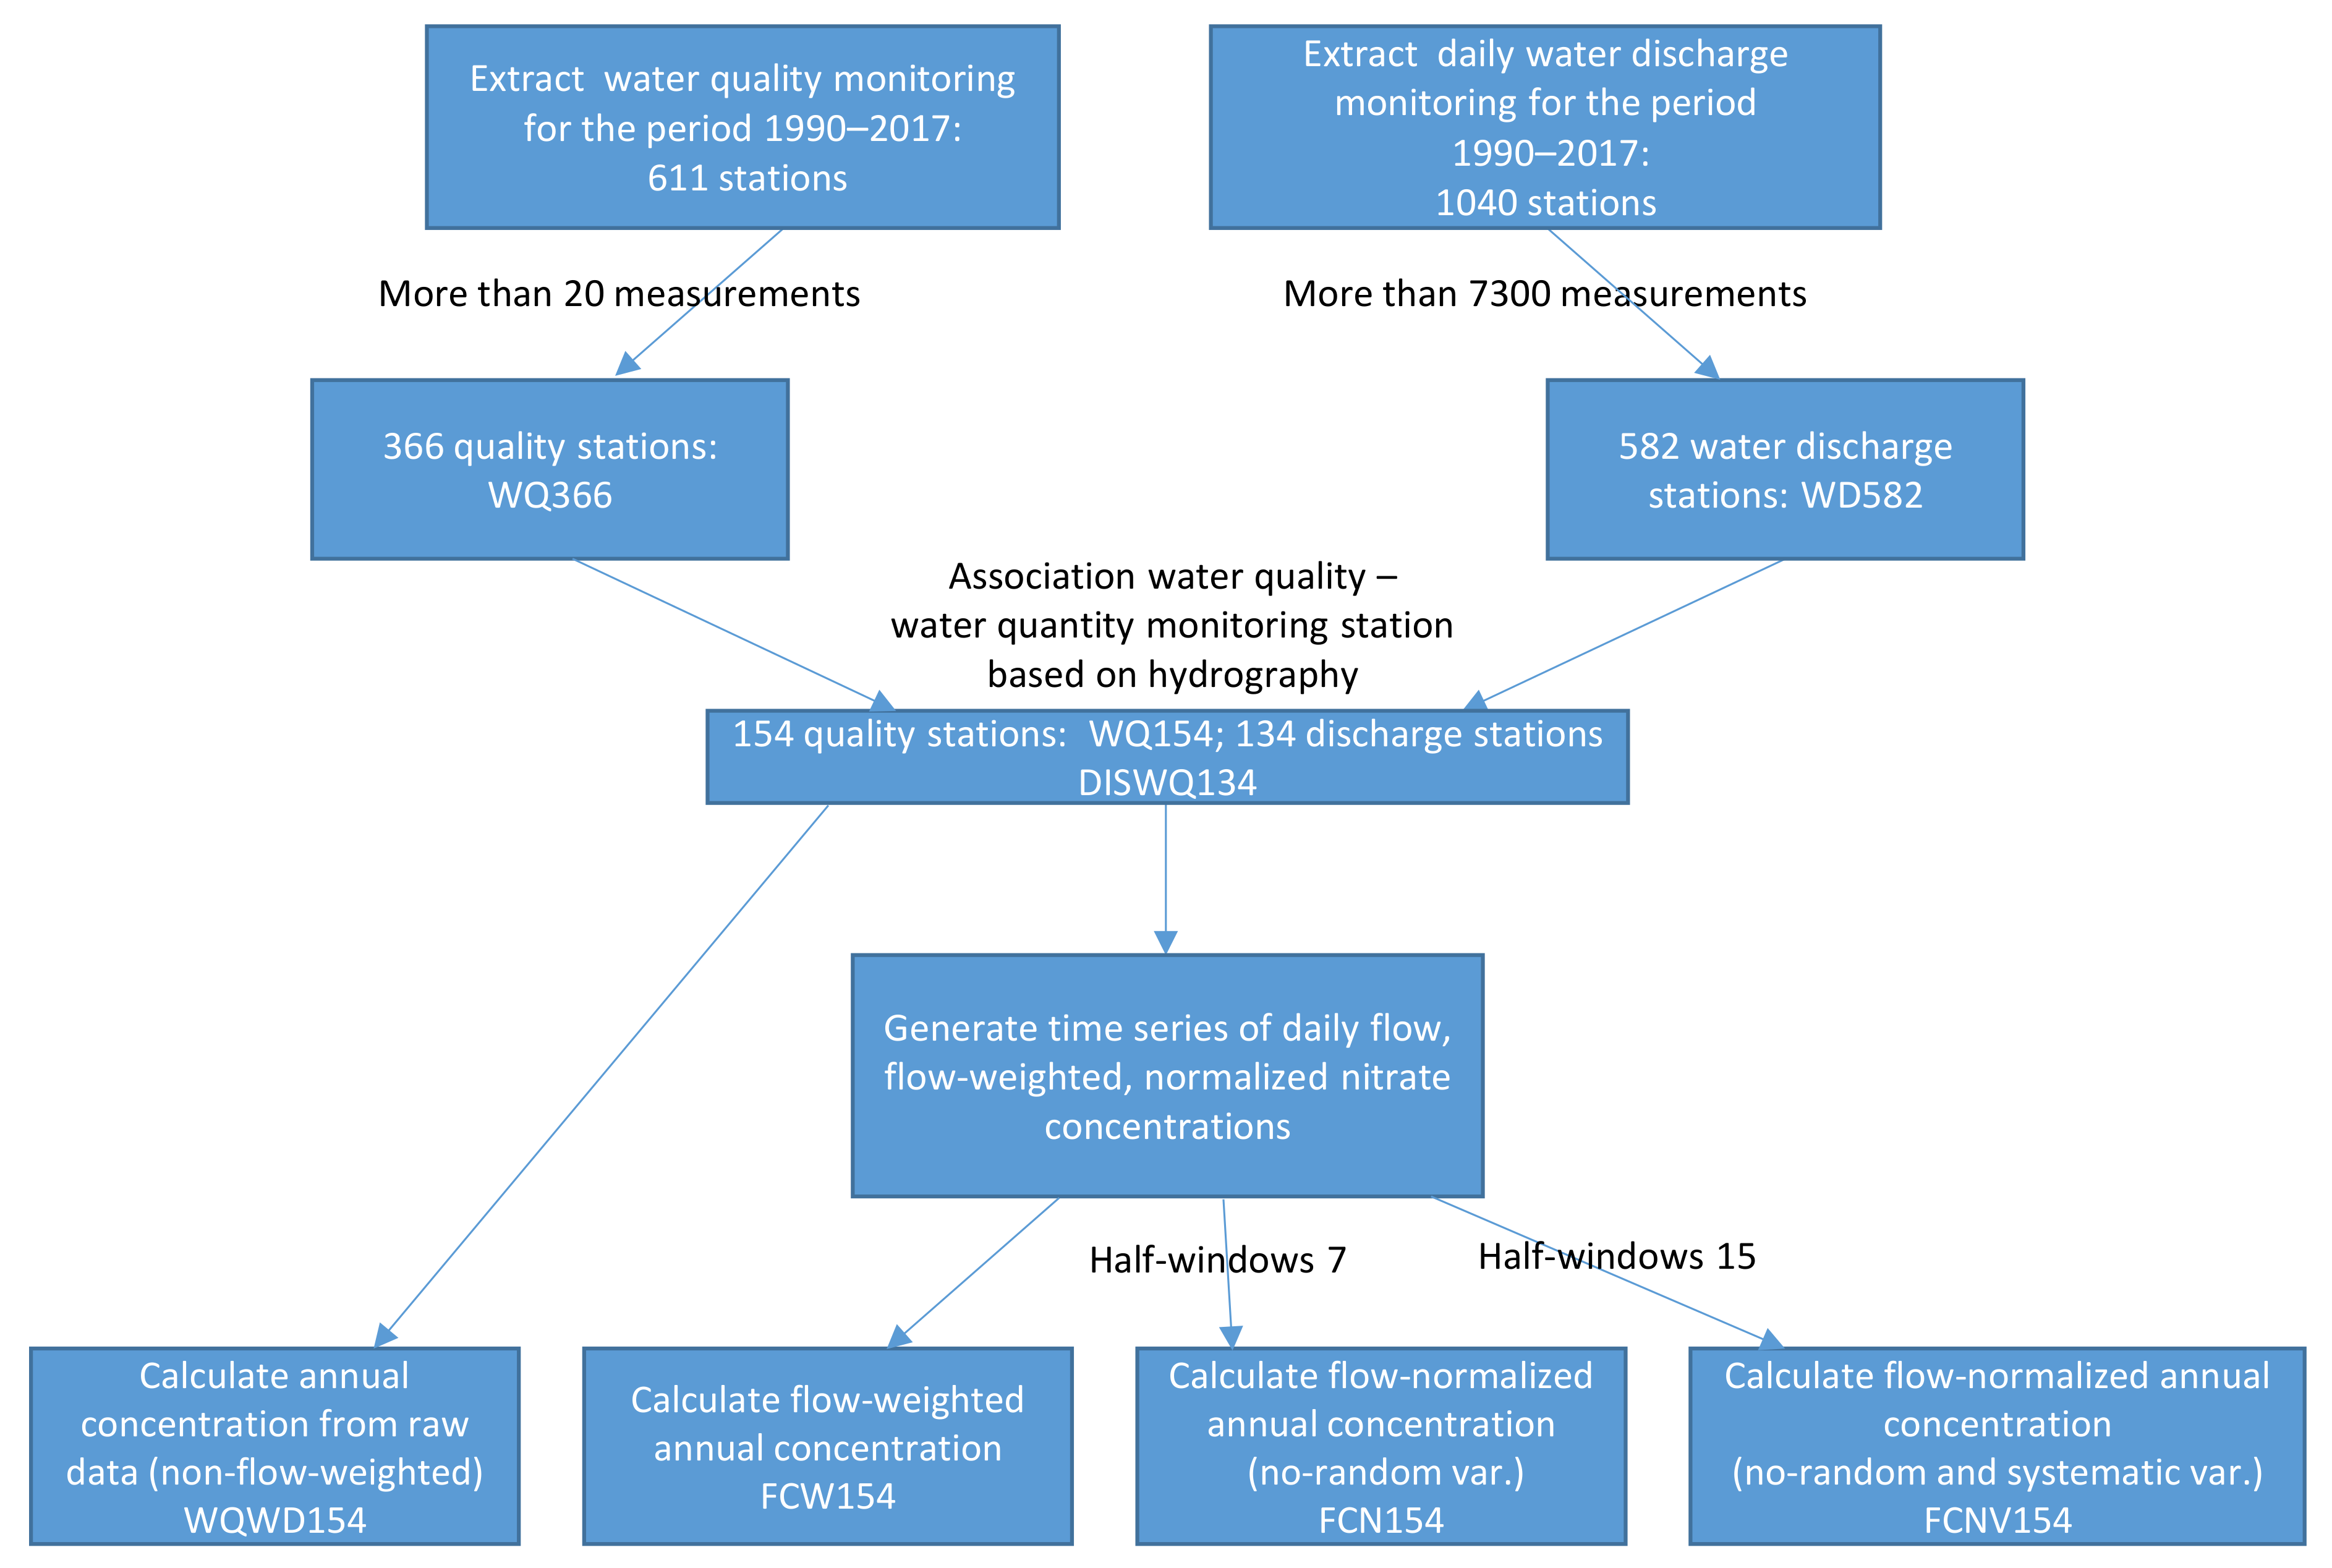
2.2. Water Quantity and Quality Monitoring Stations

The water quality datasets were retrieved from the water agencies web portals: SIE Adour-Garonne [18] and the Rhone Corsica Mediterranean Water Agency [19]. The original datasets included 611 water quality stations with discrete measurements, usually at a monthly scale. However, many gaps extending over several years were discovered in the datasets. A screening was performed selecting the stations with measurements of nitrates for at least 20 years spanning from 1990 until 2017, resulting in a subset of 366 stations (hereafter WQ366).
Daily water discharges for both river basin districts were retrieved from the central French water discharge repository HYDRO [22]. About 1040 stations were extracted. Only stations with at least 7300 measured daily discharge (corresponding to about 20 years) were kept, resulting in a subset of 582 stations (hereafter WD582). These stations were positioned on the stream network of HYDROSHEDS at 15 arc-seconds [23]. The correct positioning of the stations was done checking the drained area obtained from the HYDROSHEDS at 15 arc-seconds and that reported with the metadata of the water discharge monitoring stations obtained from HYDRO.
The water quality stations were also positioned on the HYDROSHEDS stream network at 15 arc-seconds [23]. A spatial join was performed between the water quality and quantity stations to determine, for each water quality station, the nearest water quantity station positioned on the same river stretch. All the associations were checked individually based on the water quality station metadata using information about the coordinates and the name of the monitored stream (the drained area was not available). The check consisted in ensuring that the associated water quality and quantity monitoring stations drained the same stream based on the stream name. This resulted in a subset of 154 monitoring pairs (water quality–water quantity) of monitoring stations. Since one water quantity station could be associated to more than one water quality station, the final subset includes 134 unique water-discharge monitoring stations (hereafter WD134) and 154 water quality monitoring stations (hereafter WQ154), with about 24,900 discrete measurements. Each selected water quality station had on average at least 8 measurements per year for at least 20 years. A summary of the approach used for the selection of the monitoring stations is shown in Figure 2.

2.3. Prediction of Nitrate Concentrations and Trend Analysis

Since the main objective of this work is to detect trends of nitrate concentration of long time series, we generated daily time series of nitrate concentrations for all the 154 water quality stations. Subsequently, we applied two different methods, i.e., the non-parametric Mann–Kendall [4] and the MSD, to calculate the trends.

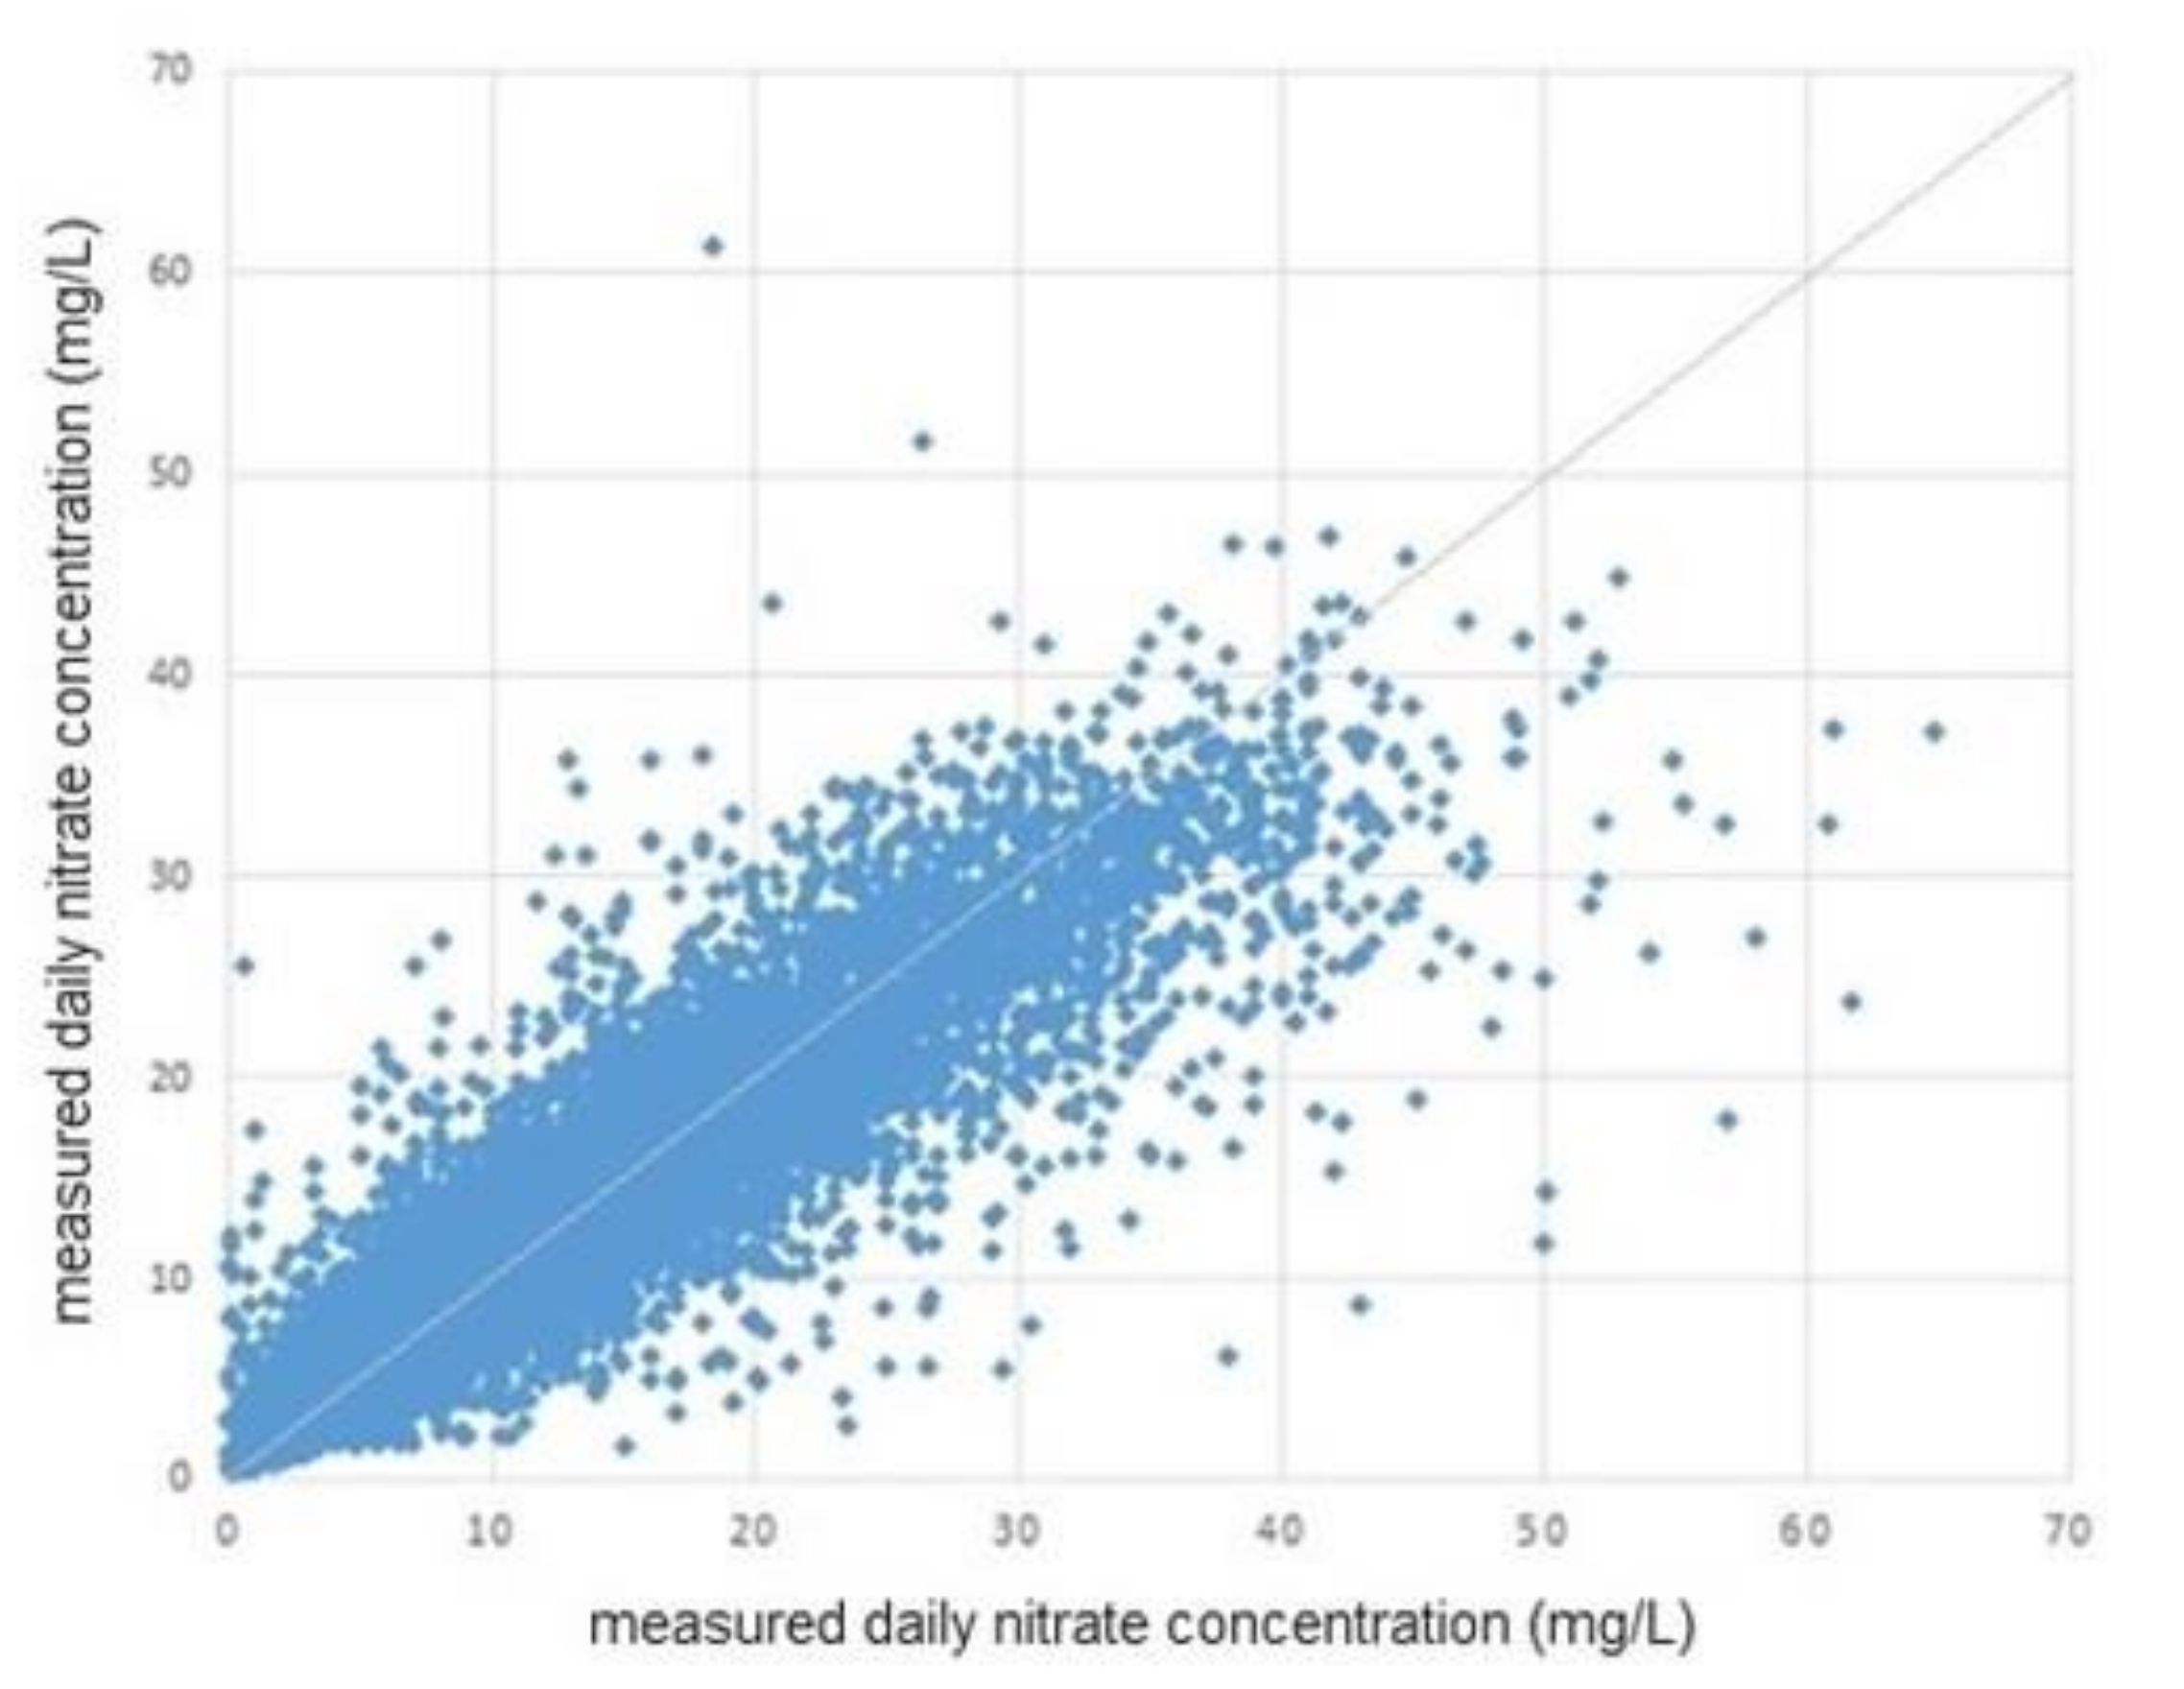
2.3.1. Estimation of Water Quality Time Series Data

The time series of daily nitrate concentrations were generated using the Weighted Regression on Time, Season and Discharge (WRTDS) model developed by (city, country) [15,24]. For any date, WRTDS generates an estimate of the log of the nitrate concentration using the flow measured for that day, as follows:
ln c =   β 0 +   β 1 t +   β 2 ln Q + β 3 sin 2 π t +   β 4 cos 2 π t + ε
where c is the estimated nitrate concentration (mg/L), Q is the measured daily discharge (m3/s), t is time (days), β0, β1, β2, β3 and β4 are calibration coefficients and ε is the unexplained residual. WRTDS looks for parameters that are valid for one single combination of flow and time, resulting in a unique regression function for each day. For each day, the equation is calibrated using observations that are similar in terms of time, season and discharge to that of the calibrated day. The more similar combinations are given higher weights in the regression and the less similar observations lower weights. For time, the measured concentration at a date close to that of the calibrated date will be given a higher weight. The weight used for each data point is calculated as the product of each of the following distance-based weights: time distance weight, seasonal distance weight and flow distance weight. For each distance, a tricube weight function [25] was formulated, as follows:
w = 1 d h 3 , if   d h 0 , if   d > h
where d is the distance (time, season, flow) and h is the half-window that defines the space beyond which an observation in no longer influencing the regressions [15]. The half-window was set to ½ year for season and 2 log cycles for discharge [11]. For time, the measured concentration at a date close to that of the calibration date will be given a higher weight.
The use of this procedure leads to generation of time series of daily flow-weighted nitrate concentration that are then aggregated at monthly and annual steps. It is required to have a complete time series of daily discharge to adequately perform the estimation of the daily nitrate concentrations.
The subsequent step of the procedure is to generate flow-normalized time series of nitrate concentration. Removing the impact of flow variation on the concentration is done by generating 2h + 1 regressions (Equation (1)) for a particular day with streamflow equal to the measured value of the day for the 2h + 1 years centered on the year of the observed discharge. The flow-normalized concentration, where the random variation (short-term climate variability) or systematic variation (long-term climate variability) has been removed, is calculated as the mean of the 2h + 1 estimations of the concentration.
The selection of the half-window controls the impact of random and systematic flow variations on concentration. Indeed shorter half-windows (h) will be used to remove short-term random variation, while if 2h + 1 is equal to the whole study period, then all non-stationarity is removed through flow normalization [11,26]. For our analysis, the half-window was set at 7 years to remove random variability of the flow, while a half-window of 15 years was used to remove any systematic trend (the longest flow and nitrate concentration time series does not exceed 31 years). The EGRET R version 3.0.2 package [24] that includes the WRTDS approach was used to perform all the analyses.
We first calculated the annual concentrations from raw data without using the flow as weight (WQWD154), then we calculated the flow-weighted annual concentrations (FCW154) and the flow-normalized annual concentrations, removing the random variation of flow (FCN154). Finally, we estimated the annual flow-normalized concentrations, removing the random and the systematic impact of flow changes on the concentration (FCNV154).

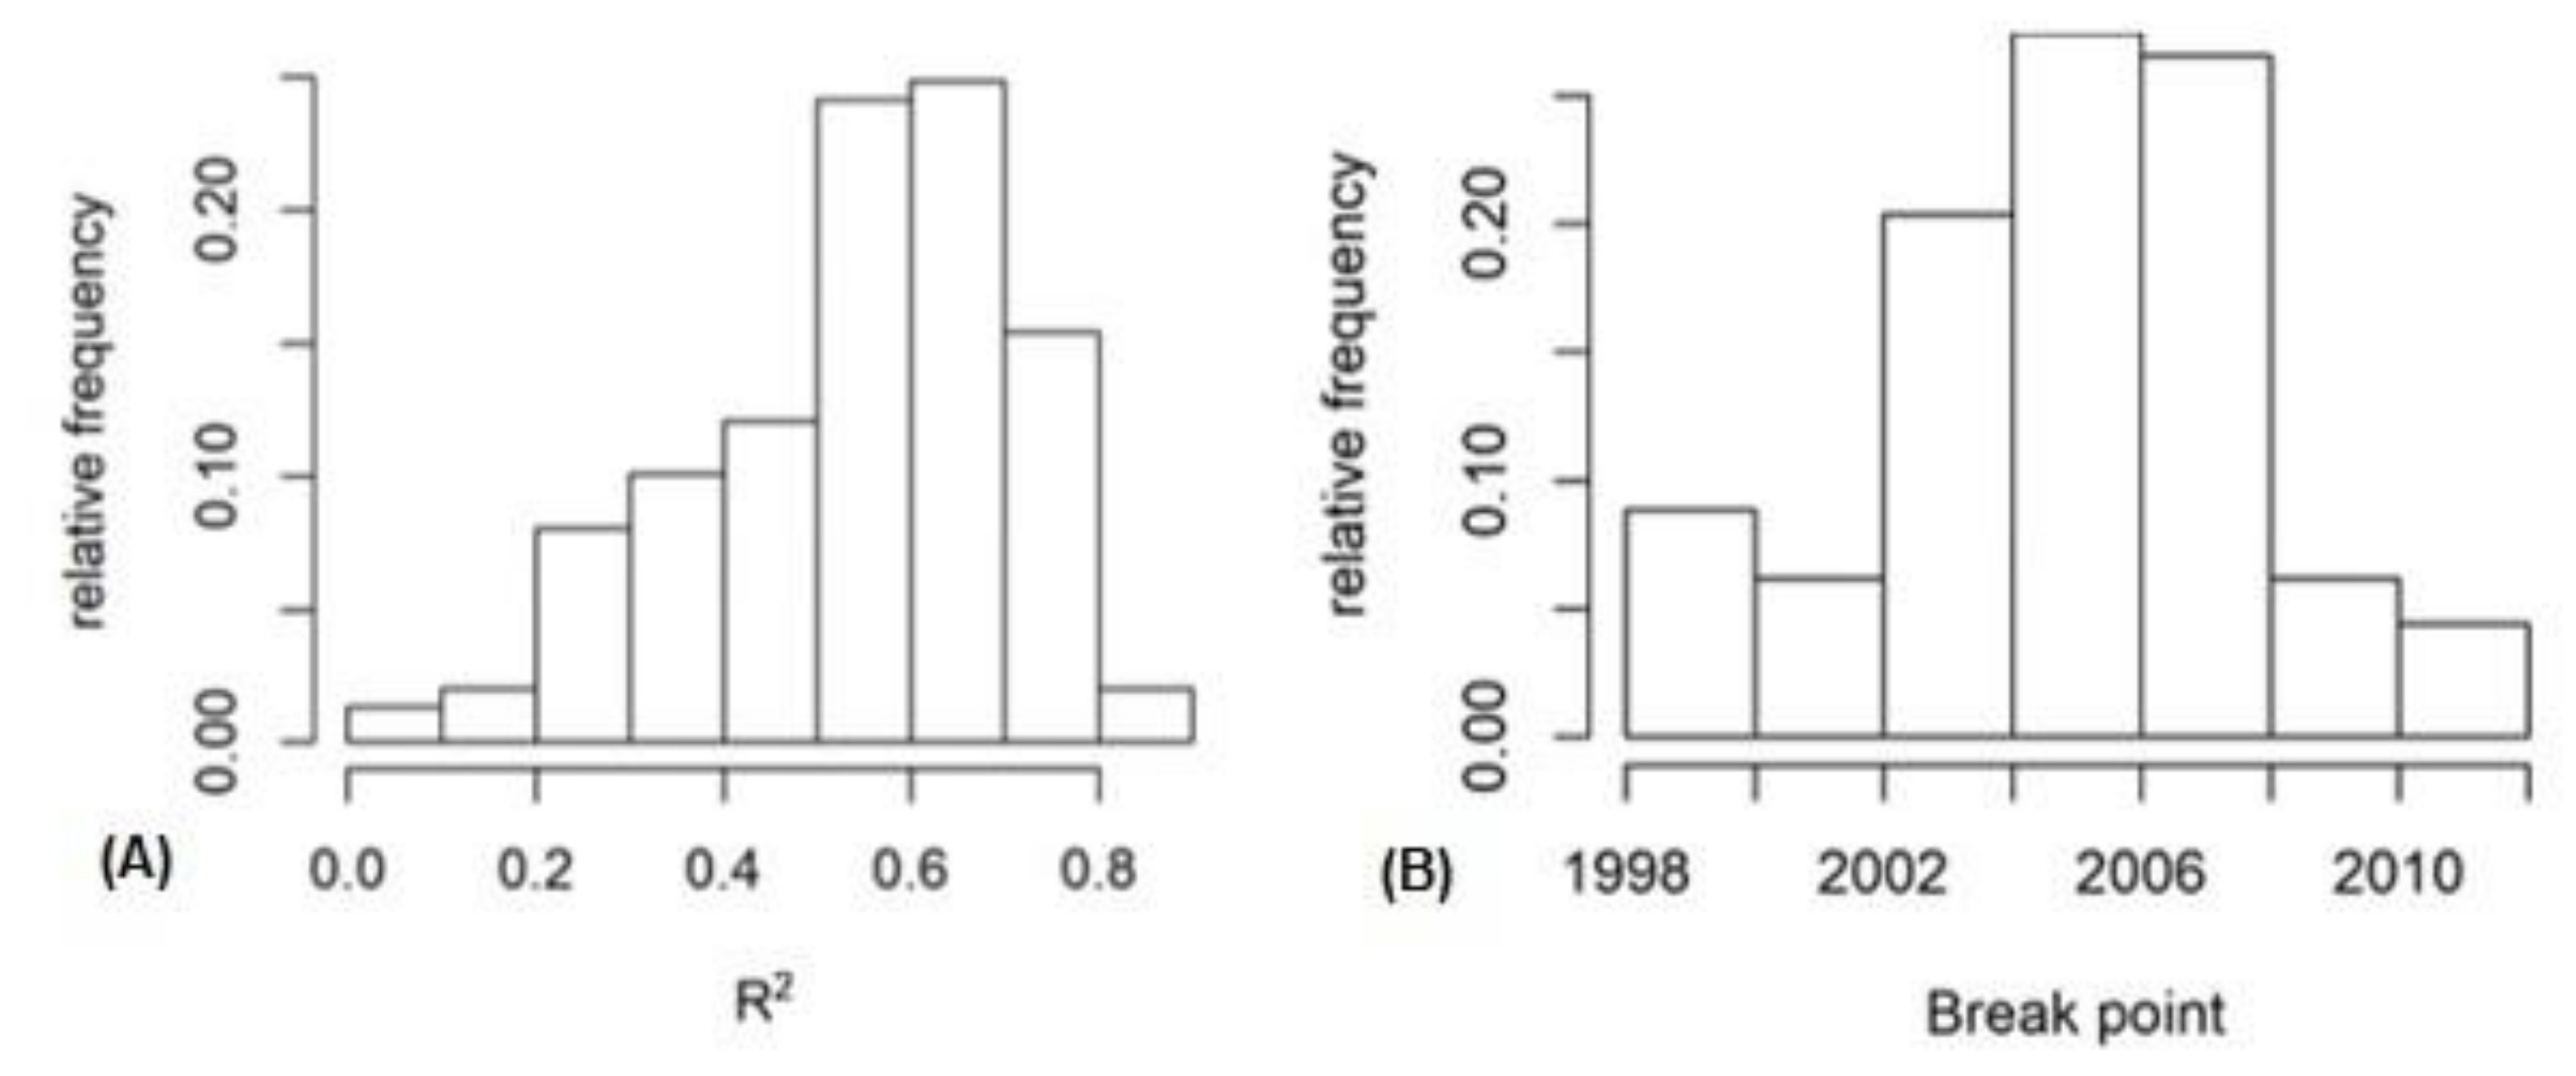
2.3.2. Trend Estimation

We used two different approaches to calculate the trends for the nitrate concentration. The first is an approach commonly used by Member States in the context of the Nitrates Directive (MSD approach). It consists in calculating the difference between the mean nitrate concentrations of two consecutive reporting periods, where each reporting period extends over 4 years. Some Member States use a flow-weighted concentration to determine the annual mean concentration for the reporting period, while other countries use a simple arithmetic mean. In the context of the Nitrates Directive, a positive trend is detected when the difference between the means of two consecutive reporting periods is larger than 1 mg/L (increasing trend). In addition, when the trend is larger than 5 mg/L, it is considered a highly increasing trend. A similar ranking is used for decreasing trends. The range –1 to 1 mg/L indicates the absence of a trend. Clearly, as the trend is calculated as the difference of two means, no statistical significance could be associated to it. We evaluated the trend for the most recent period by calculating the difference between the mean annual concentration for the periods 2012–2015 and 2008–2011.
In the second approach, the trends of nitrate concentration were analyzed using the non-parametric Mann–Kendall test [4]. This test is used to detect monotonic trends. It does not assume any underlying distribution of the data and can handle missing data. A trend analysis was also performed for water discharge. Water discharge was analyzed for both seasonal (monthly) and annual trends. The monthly and annual trends were analyzed using the functions kendallSeasonalTrendTest and kendallTrendTest of the Envstats R package version 2.4.0, respectively [27]. The seasonal trend was performed using the mean monthly measured water discharge. The annual test was performed on the mean, maximum and minimum flow discharge in order to detect changes in the flow distribution. Similarly, trends for the annual nitrate concentrations were analyzed using the Mann–Kendall test. The flow-weighted, flow-normalized (half-windows of 7 and 15 years) and raw concentrations were used to perform the tests. All trends for the Mann–Kendall test were detected at the 0.05 significance level. The Pettitt test [28] was finally used to determine the potential existence of a breakpoint in the slope of the time series (inflection point) of annual flow-weighted nitrate concentrations.

3. Results

3.1. Estimated Daily Flow-Weighted Nitrate Concentration Trends Using the WQ154 Dataset

The WRTDS prediction of the daily flow-weighted concentration (Equation (1)) versus the measured daily concentration for the 24,900 entry points is shown in Figure 3. The WRTDS model was extremely accurate in predicting the daily concentrations. The coefficient of determination (R2) is 0.87, the Nash-Sutcliffe [29] coefficient is 0.86 and the bias is less than 0.1%. There is a slight positive correlation between the residuals and the measured values, however, this is expected since, as mentioned by Hirsch et al. [15], as with any regression methods, WRTDS tends to regress to the mean and the estimates exhibit less variability than the observations.
The model performed extremely well for all stations together but also on each individual station. The histogram of the coefficient of determination between the measured and calculated concentrations for all individual stations is displayed in Figure 4A. More than 80% of the stations have a coefficient of determination larger than 0.4 and more than 70% of the stations have a coefficient of determination larger than 0.5. Similar results were also obtained when using the Nash-Sutcliffe coefficient of efficiency.

3.2. Annual Nitrate Concentration Trends Using the WQ366 Dataset (Raw Data)

A trend analysis of the entire nitrate dataset (366 stations) was performed using the Mann–Kendall test. The maximum, minimum and mean annual concentrations were calculated for each station using the raw data (no flow adjustment). The results are reported in Table 3 and compared with those obtained using the method of the MSD, also estimated using the raw data. The majority of the stations (more than 70%) do not exhibit any trend for the annual maximum concentration (Table 3). About 64% of the stations exhibit no trend for the mean annual concentration.
The results of Table 3 indicate that the Mann–Kendall and the Nitrates Directive (using the mean annual concentration) approaches led to similar outcomes. However, Figure 5 shows that the results are not spatially compatible. In fact, out of the 73 stations for which the MSD method predicted a decreasing trend, only 16 exhibited a decreasing trend according to the Mann–Kendall test, and 7 exhibited an increasing trend when using the Mann–Kendall test. Out of the 230 stations for which the Directive’s method predicted no trend, 88 exhibited a significant trend according to the Mann–Kendall test. Out of the 63 stations with increasing trend when using the MSD approach, only 18 stations exhibited an increasing trend (4 exhibited a significant decreasing trend). Even though the results globally seem to be coherent between the Mann–Kendall test and the Directive’s approach when using the raw data, they disagree on the stations with significant trends, and the overall similarity of the MSD method with respect to the Mann–Kendall approach is around 33%. The differences in the trend evaluation are particularly marked in the river basins of the Garonne and Dordogne (Figure 5).

3.3. Annual Nitrate Concentration Trends Using WQ154

A similar trend analysis was performed using the subset of water quality stations associated to a water discharge station (154 monitoring stations). The trend analysis was performed for the period 1990–2017 for the mean nitrate concentration calculated using the raw concentration dataset (WQ154), the flow-weighted concentration (FCW154) and the flow-normalized concentration (FCN154, removal of the random fluctuation of the flow). The results of the Mann–Kendall annual trend analysis are given in Table 4. The results of the Mann–Kendall test for WQ154 dataset were similar to those obtained when using the entire water quality dataset (366), indicating that the subset of 154 water quality monitoring stations is representative of the entire dataset. The results using the three different time series of concentrations are rather different when using the raw data, the flow-weighted and flow-normalized concentrations (no random variation). Indeed, when using the raw data, most of the stations show no significant trend (61%). On the other hand, the trend analyses of the flow-weighted and flow-normalized concentrations show that most of the stations exhibit a trend (either increasing or decreasing). When we use the estimated flow-weighted concentration instead of the raw concentration, the results indicated a marked increase of stations with a decreasing trend. When using the flow-normalized concentration (removal of random variation), stations with an increasing trend (44%) become dominant. It is important to note the significantly different results between the tests using the annual raw mean concentration and flow-weighted and normalized concentrations, giving a very different policy message concerning trends. Indeed, when using the raw data, stations with no significant trend are dominant, showing a limited water quality degradation. When using the flow-normalized concentrations (removal of the random variation of flow), then the stations with an increasing trend are dominant, indicating an overall degradation of water quality for the period 1990–2017.
To evaluate the performance of the trend calculation using the MSD approach, two different tests were performed. The first one consisted in comparing the results of the MSD method with the Mann–Kendall test using the same time period (2008–2015). The second test consisted in using the MSD approach not only with the raw data but also with the flow-weighted and flow-normalized concentration (half-period of 7 years). The results are given in Table 5 and Table 6 for the Mann–Kendall and MSD approaches, respectively.
Clearly, when applying the Mann–Kendall test on a very short time period (8 years) using the raw concentration for the period 2008–2015, the large inter-annual variation of the concentrations results in most of the stations not exhibiting any trend (Table 5). When using the flow-weighted concentrations, the number of stations with trends increases. When using the flow-normalized concentrations, then most of the stations exhibit a decreasing trend (70%). The results of the MSD method are similar to those obtained when using the Mann–Kendall test based on the flow-weighted concentrations. However, the accuracy is 53% (percentage of stations with the same trend detected by the Mann–Kendall and the MSD tests).
When applying the MSD method to calculate trends (Table 6) using the different time series (flow-weighed and flow-normalized concentrations), then most of the stations exhibit no trend. The number of stations with no trend varies from 67% when using the raw data to 82% when using the flow-normalized concentration. The number of stations with increasing trend drops from 11% when using the raw data to 1% when using the flow-normalized concentration. These results illustrate the importance of the water quality datasets and the way the mean concentration is calculated and their impacts on the final outcome of the trend analysis when using the Directive’s approach. Indeed, when using the raw concentration, as is usually done, we observed an overestimation of stations with trends when compared to the trend obtained with the flow-normalized concentration (removal of the impact of random variation of the flow on the nitrate concentration). When using the flow-normalized concentration, more than 80% of the stations did not exhibit a trend.
The different results presented in Table 5 and Table 6 illustrate the importance of the length of the time series on the Mann–Kendall trend outcome. When using short-term time series, the random fluctuation of the flow results in the majority of the stations not exhibiting any trend. When removing the random variation, the Mann–Kendall approach identifies more stations exhibiting a trend when using short-term data (Table 5), while when using longer time series, the Mann–Kendall categorizes most of the stations as exhibiting a trend (Table 6). This clearly indicates that even though water quality has improved between 2008 and 2015, overall, there is a significant water quality decrease of the whole period (1990–2017). This shows that the trend of the time series is not monotonic.
Consequently, the Pettitt test [28] was applied to detect the presence of a breakpoint. It was decided to use the test on the slope of the time series of the nitrate concentration rather than on the actual concentration since we are looking for a change in the trend (change of direction). The Mann–Kendall test was applied on the time series before and after the breakpoint (when present).
The Pettitt test was performed on datasets of flow-normalized concentrations with removal of all random variations, FCN154. About 75% of the stations were characterized by a change of slope of the time series of nitrate concentration (p < 0.05). For the large majority of the stations, the breakpoint occurs between 2002 and 2008 (Figure 4B). Most of the breakpoints fall in the period during which the gross nitrogen surplus decreases in France (Figure S1, Supplementary Material). The Mann–Kendall test was applied before and after the breakpoint (when significant), and the results are summarized in Table 7. The dominant class of change in trends (44% of the stations) consists of stations that are characterized by bell-shaped time series with an increasing trend before the breakpoint and then a decreasing trend (Table 7).
These results are compatible with the results presented in Table 5 when using the Mann–Kendall test only for the period 2008–2015. Indeed, about 70% of the stations have a decreasing trend after the breakpoint. It is noteworthy that only 16% of the stations exhibited a decreasing trend all throughout the study period, and 6% of the stations are characterized by an increasing trend throughout the period. About 58% of the stations are characterized by an increasing trend before the breakpoint and this number reduces to 13% after the breakpoint. The large number of stations with an increasing trend, when performing the Mann–Kendall over the whole period and considering the analysis of the breakpoint, shows that many stations are improving since years 2005–2008, but the concentrations still remain high when compared to the concentrations of the early 1990s.

3.4. Impact of Flow and Management on Nitrate Trends

The data was then analyzed removing the systematic trend of flow setting the half-window to 15 years, FCNV154. The trend analysis for the period 1990–2017 is shown in Table 8. When removing the impact of the systematic impact of flow change, any remaining trend in the nitrate concentration time series is due to management, where management represents the impact of anthropogenic activities on nitrate concentration. Management includes all measures aiming at reducing point and diffuse inputs of nitrate in the streams and range from upgrading wastewater treatment plants’ efficiency to best agricultural practices. We estimate that about 54% of the stations exhibit a significant increasing trend due to management (after removal of all random and systematic flow components). The results show that management in the studied area leads to a water quality degradation from 1990 in about 54% of the stations. About 38% of the stations show a decreasing trend due to implementation of measures. The trend analysis using the raw data shows a completely different picture, with only 26% of the station exhibiting an increasing trend.
Management has the largest impact on the change of nitrate concentration in the long-term. Indeed, it is the major factor responsible for the decrease or increase of nitrate concentration (Figure 6A). Management is the major source of change in nitrate concentration for 78% of the stations, while flow is dominant in 22% of the stations. Management and flow have antagonistic effects for 56% of the stations and synergistic effects for 44% of the stations.
There is a high correlation between the overall change in nitrate concentration and the change of concentration due to management (R2 = 0.8), while the correlation with flow is insignificant (R2 = 0.1). The flow tends to decrease the nitrate concentration for 65% of the stations, however with a small magnitude. Most of the impact of flow on the nitrate concentration is between –1 and +1 mg/Lf, while management induces changes ranging between –6 and +7 mg/L.
The same analysis of trend apportionment was performed on the nitrate concentration after the breakpoint. Flow and management had antagonistic effects for 54% of the stations, and flow had a dominant impact for 52% of the stations (Figure 6B). This reduction of the impact of management after the breakpoint is an indication of the significant impact of the management on water quality. Thus, measurements after the breakpoint already partially integrate the past impact of management and flow becomes more dominant in controlling the impact of the change of nitrate concentration.

4. Discussion

Our analysis has shown the impacts of different methods of calculating trends and the time series used, as well as the reason for discrepancy between the various methodologies. An example of the discrepancy is shown in Figure 7A. The mean concentration from raw data exhibits large inter-annual variations that are smoothed when using a flow-weighted concentration. Removing the random variability (flow-normalized concentration FCN154, red line) further smooths the times series of concentration. When analyzing the data, the normalized concentration with no random variability exhibits an increasing trend throughout the study period, while the MSD approach results in a sharp decreasing trend between the reporting periods 2008–2011 and 2012–2015 (more than 10 mg/L). This large decrease is purely due to the effect of random variability of the flow on the nitrate concentration. Looking at the data after 2015 clearly shows that according to the MSD method, an increasing trend for the period 2016–2018 will occur, which is consistent with the Mann–Kendall result. Similar conclusions can be drawn for the other reporting periods, where large fluctuations of the trends over time are observed (Figure 7A). In particular, it can be noted the lack of consistent trends overtime when using the MSD approach.
The same station was used to illustrate the effect of removing long-term trend of flow (FCN154, h = 15 years) and the results are displayed in Figure 7B. It is shown that when removing all variation (random and systematic), the nitrate concentration increased by 9.8 mg/L over a period of 25 years. When removing only the random variation, then the increase is 6.9 mg/L. For this station, the management and flow variations have an antagonistic effect, where the management is responsible for an increase of the nitrate concentration of 9.8 mg/L while the flow reduces the nitrate concentrations by 2.9 mg/L (resulting in an overall increase of 6.9 mg/L). Indeed, for that period (2012–2015), two high discharge years were observed in 2013 and 2014, and the increased flow had a dilution effect on the nitrate concentration. This phenomenon was detected for 65% of the stations, where flow results in a decreasing of the nitrate concentration due to the dilution effect.
The behavior of nitrate concentration over seasons and flow ranges with the removal of random and systematic variations was investigated by plotting the expected concentration over time calculated by WRTDS (Figure 8) for the station 5,167,000. This plot is obtained by calculating for each day the concentration (Equation (1)) using the flow of that particular day for every year of the available time series (there are 27 flow values for a particular day of the year).
It can clearly be seen that the nitrate concentration is decreasing between the two periods 1990–1995 and 2010–2015 for the higher flows (above the 95th percentile), while it is significantly increasing for all the other flows, and in particular, for the low flows. It is also interesting to note that for the period 1990–1995, for any particular day, the expected nitrate concentration increases with flow, while for the later period (2010–2015), the expected concentration decreases when flow increases. This indicates a shift of behavior from source-limited (dilution behavior) to transport-limited.
The overall estimated change in nitrate concentration (using the flow-weighted concentrations) is shown in Figure S2 (Supplementary Material), along with the Nitrate Vulnerable Zones (NVZ). The change is obtained using the concentration in 2017 minus the concentration in 1991 (year of adoption of the Nitrates Directive). About 30% of the stations have a decrease of the nitrate concentration by more than 1 mg/L and 27% of the stations have an increase in the nitrate concentration. About 43% of the stations have an absolute change (decrease or increase) in the nitrate concentration by less than 1 mg/L.
We estimated that 76% of the stations with a decreasing concentration are located inside NVZ areas, clearly highlighting the impact of management on the nitrate concentrations (Figure S2, Supplementary Material). The designation of NVZ areas has an impact on the trend of nitrate concentration and the adoption of the Directive in 1991, and some other local management measures clearly led to a reduction of the concentration, with management explaining 82% of this large decrease of the concentrations (Figure S3, Supplementary Material). Indeed, the amount of mineral nitrogen fertilizer (sales) was 147,000 tons, 158,000 tons and 143,000 tons in years 2000, 2010 and 2017 for the Aquitaine region (administrative region covering partly the Adour-Garonne). For the region Rhone-Alpes, the mineral nitrogen fertilizer sales were 76,000 tons, 68,000 tons and 72,000 tons [30] in 2000, 2010 and 2017, respectively. For both regions, the peak sales were around 2000, followed by a decrease. For both regions, we also observed a decrease in the number of animals (cattle, pigs, sheep and goats from 2000 to 2016), indicating a decrease in manure production. The nitrogen pressure has been reduced; however, some points still exhibit an increasing nitrogen nitrate concentration trend in the Aquitaine region. The lag time could partially explain this increase (the observed increase is due to past practices). In addition, it must be noted that during this period of 30 years, there is a shift of farm structure, with a large increase in the size of farms and a decrease in the number of small farms, indicating an intensification of agriculture. There were also some important changes in land use in the Aquitaine region from 2000, and in particular, a significant decrease of permanent pasture (14%) that is the second largest land use after the cereal cultivation, and an increase of temporary pasture by 25% [31]. The ploughing of permanent pasture leads to the flush of large amounts of nitrate due to an increased mineralization of soil organic matter [32] and could explain the increase of the concentration in some spots.
Major increases of nitrate concentration due to management are still observed in the NVZ areas. The largest impact of management on nitrate concentration is observed for the station 5,167,000 represented in Figure 7. Management led to an increase of the concentration by more than 9 mg/L, counterbalanced by flow that reduced the concentration by 3 mg/L. However, it must be noted that at all concentrations after removal of the random trend, nitrate concentrations in rivers remained below the limit of 50 mg/L.
Over the 27-year period, flow had a limited impact of the nitrate change (Figure S4, Supplementary Material). This is expected due to the lack of long-term trend in the flow. Most of the impacts of flow on nitrate concentration are observed on the short term (random variation). Indeed, when performing a Mann–Kendall analysis for the entire set of flow stations (dataset WD582) to detect trends of the annual mean, maximum and minimum water discharge, we found that about 95% of the stations had no trend for the mean annual discharge (Figure S4, Supplementary Material). This number decreased to 82% for both the annual maximum and minimum flow, respectively. Most of the stations with decreasing trend for the maximum flow are concentrated in the upper Rhone and the Adour. The trend analysis for minimum flow identified 9% of the stations exhibiting a decreasing trend and 9% exhibiting an increasing trend, while for the maximum annual flow, most of the stations with a significant trend are characterized by a decreasing trend. However, we found that seasonal trends are present for almost all water quantity monitoring stations, consequently impacting the calculation of the concentrations.
These trends of nitrate concentration are significant indicators for freshwater quality; however, fluxes of nitrates are also important factors affecting the quality of the receiving lakes and coastal waters. We selected the most downstream stations with nitrate measurements and water discharge data for the Garonne and Rhone Rivers, and we estimated the nitrate fluxes using the flow-normalized data, removing random and also systematic variations.
For the Garonne with no random fluctuation of flow, we see an increase of the flux from 1991 to 2009, then a large decrease of the flux (more than 80,000 tons of nitrate over a period of 10 years) (Figure 9). When removing the impact of flow, we see a decrease of the load from 1991 to 2017 by about 30,000 tons due to management. For the Garonne, we see a significant decrease to the nitrate load to the sea due to the implementation of measures. Overall, we see a decrease close to 25% of the load of nitrate to the Atlantic due to management. This is mostly due to the decrease of the nitrate concentration from 10.5 mg/L in 1990 to a value of 8 mg/L in 2017. For the Rhone, we did not find any significant difference in the fluxes from 1990 to 2017 (after removal of the systematic variation). Overall, management and flow had little impact on nitrate fluxes discharged to the Mediterranean Sea (Figure 10). These results are coherent with the data given in Table 1 that reports that 21% of the water bodies are affected by diffuse pollution, while this number is around 55% for the Adour-Garonne [1].

5. Conclusions

We used the Mann–Kendall approach for the 1990–2017 period on the annual time series of nitrate concentrations using different averaging approaches. When using the mean annual concentration obtained from the raw data, about 61% of the stations exhibited no significant trend, while 26% were characterized by an increasing trend. Using the mean annual concentration obtained from the flow-weighted and flow-normalized concentrations reduced the number of non-significant trends to 31% and 22%, respectively. When using the time series of annual concentration obtained using the normalization approach, it resulted in 44% of the stations exhibiting an increasing trend. Similar tests were also performed on a shorter time series (2008–2015) to cover exactly two reporting cycles of the Nitrates Directive. Using the time series based on the raw concentration data, about 93% of the stations did not exhibit any significant trend. This clearly shows that over a short period, the random component of the flow mixes the nitrate concentration signal. Using the flow-weighted and flow-normalized concentration reduced the number of stations with no significant trend and significantly increased the number of stations with a decreasing trend. These two batteries of trend test showed that in the long term, there was a decrease of the water quality characterized by an increase of nitrate concentration for the 1990–2017 time period. However, for the past eight years, the majority of stations exhibited a decreasing concentration. This indicates that there is a break in the time series of nitrate concentration. This was confirmed using the Pettitt test, showing that 44% of the stations had a bell-shaped curve characterized by an increase of the nitrate concentration from 1990 to the 2002–2008 period, and then a significant decrease of the nitrate concentration for the subsequent years. However, despite this decrease, the nitrate concentrations of the last years of the time series still remain higher than the concentration of the beginning of the time series. We compared the performance of the Mann–Kendall test with the approach used by many Member States to report trends to the Commission. The two approaches gave different results, both in terms of the number of stations with trend but also the stations that were characterized by a trend.
We also showed that removing the impact of random variation and systematic variation of flow on the nitrate concentration informs on the impact of management on water quality. This approach gave results coherent with those provided by Member States in their River Basin management plans. Indeed, our results confirmed that the Rhone River Basin is less impacted by diffuse pollution (here, nitrate concentrations and fluxes) than the Garonne River Basin, where we estimated a decrease of the nitrate load entering the Atlantic Sea by 25%.
We therefore recommend using a Mann–Kendall test based on flow-normalized concentration to capture the trends of nitrate concentration in stream for two consecutive reporting periods as a complement to the MSD method. We showed that removing all random and systematic variations of flow can inform on the efficiency of watershed management measures on water quality when performing a trend analysis. This approach can only be applied with an appropriate design of water quantity and quality monitoring stations that can consequently be used not only to quantify the actual chemical status of a river, but also to evaluate the effects of the implementation of mitigation measures [33]. In addition to a well-designed monitoring network, we have shown the need to use longer time series to remove not only the random variability of flow but also the long-term variability, to be able to apportion the trend between the impact of management and that of flow on water quality.

Supplementary Materials

The following are available online at https://www.mdpi.com/2073-4441/12/12/3374/s1, Figure S1: Gross nitrogen surplus for France for the period 2000–2018 (Eurostat). Figure S2: Predicted change in NO3 concentration (mg/L) for the period 1991–2017 using the flow-weighted concentration. Figure S3: Predicted change in NO3 concentration (mg/L) due to management for the period 1991–2017 as predicted by WRTDS (removal of the random and systematic flow variations). Figure S4: Predicted change in NO3 concentration (mg/L) due to flow for the period 1991–2017 (difference between the total absolute change and the change due to management).

Author Contributions

Conceptualization, investigation, methodology, formal analysis, draft preparation, review, and editing by F.B. and A.M. All authors have read and agreed to the published version of the manuscript.

Funding

This research received no external funding.

Conflicts of Interest

The authors declare no conflict of interest.

References

  1. EEA European Environment Agency’s home page — European Environment Agency. Available online: https://www.eea.europa.eu/ (accessed on 1 September 2019).
  2. EC Council of the European Communities CEC, 1991. Council Directive 91/676/EEC Concerning the Protection of Waters against Pollution Caused by Nitrates from Agricultural Sources. Off. J. L 375. 1991. Available online: https://eur-lex.europa.eu/legal-content/EN/ALL/?uri=celex%3A31991L0676 (accessed on 1 September 2019).
  3. EC Report from the Commission to the Council and the European Parliament on the Implementation of Nitrates Directive Concerning the Protection of Waters against Pollution Caused by Nitrates from Agricultural Sources (Period 2012–2015). SWD (2018) 246 Final. EC Europa Eu. 2018. Available online: https://ec.europa.eu/environment/water/water-nitrates/pdf/nitrates_directive_implementation_report.pdf (accessed on 1 September 2019).
  4. Hirsch, R.M.; Slack, J.R.; Smith, R.A. Techniques of trend analysis for monthly water quality data. Water Resour. Res. 1982, 18, 107–121. [Google Scholar] [CrossRef] [Green Version]
  5. Helsel, D.R.; Hirsch, R.M. Geological Survey (Techniques of Water-Resources Investigations of the United States Geological Survey, Book 4, Hydrologic Analysis and Interpretation Chapter A3). In Statistical Methods in Water Resources U.S; OMS US EPA; USGS Publications Warehouse : Reston, VA, USA, 2002. Available online: https://pubs.er.usgs.gov/publication/twri04A3 (accessed on 1 September 2019).
  6. Esterby, S.R. Review of methods for the detection and estimation of trends with emphasis on water quality applications. Hydrol. Process. 1996, 10, 127–149. [Google Scholar] [CrossRef]
  7. Dupas, R.; Minaudo, C.; Gruau, G.; Ruiz, L.; Gascuel-Odoux, C. Multidecadal Trajectory of Riverine Nitrogen and Phosphorus Dynamics in Rural Catchments. Water Resour. Res. 2018, 54, 5327–5340. [Google Scholar] [CrossRef]
  8. Bouraoui, F.; Grizzetti, B. Modelling mitigation options to reduce diffuse nitrogen water pollution from agriculture. Sci. Total. Environ. 2014, 1267–1277. [Google Scholar] [CrossRef] [PubMed]
  9. Casal, L.; Durand, P.; Akkal-Corfini, N.; Benhamou, C.; Laurent, F.; Salmon-Monviola, J.; Ferrant, S.; Probst, A.; Probst, J.-L.; Vertès, F. Reduction of stream nitrate concentrations by land management in contrasted landscapes. Nutr. Cycl. Agroecosystems 2019, 114, 1–17. [Google Scholar] [CrossRef] [Green Version]
  10. Vero, S.; Basu, N.B.; Van Meter, K.J.; Richards, K.G.; Mellander, P.-E.; Healy, M.G.; Fenton, O. Review: The environmental status and implications of the nitrate time lag in Europe and North America. Hydrogeol. J. 2017, 26, 7–22. [Google Scholar] [CrossRef]
  11. Murphy, J.C.; Sprague, L.A. Water-quality trends in US rivers: Exploring effects from streamflow trends and changes in watershed management. Sci. Total. Environ. 2019, 656, 645–658. [Google Scholar] [CrossRef] [PubMed]
  12. Dupas, R.; Jomaa, S.; Musolff, A.; Borchardt, D.; Rode, M. Disentangling the influence of hydroclimatic patterns and agricultural management on river nitrate dynamics from sub-hourly to decadal time scales. Sci. Total. Environ. 2016, 571, 791–800. [Google Scholar] [CrossRef] [PubMed]
  13. Koenig, L.E.; Shattuck, M.D.; Snyder, L.E.; Potter, J.; McDowell, W.H. Deconstructing the Effects of Flow on DOC, Nitrate, and Major Ion Interactions Using a High-Frequency Aquatic Sensor Network. Water Resour. Res. 2017, 53, 10655–10673. [Google Scholar] [CrossRef]
  14. Moatar, F.; Abbott, B.W.; Minaudo, C.; Curie, F.; Pinay, G. Elemental properties, hydrology, and biology interact to shape concentration-discharge curves for carbon, nutrients, sediment, and major ions. Water Resour. Res. 2017, 53, 1270–1287. [Google Scholar] [CrossRef]
  15. Hirsch, R.M.; Moyer, D.L.; Archfield, S.A. Weighted Regressions on Time, Discharge, and Season (WRTDS), with an Application to Chesapeake Bay River Inputs1. JAWRA J. Am. Water Resour. Assoc. 2010, 46, 857–880. [Google Scholar] [CrossRef] [PubMed]
  16. Raymond, S.; Moatar, F.; Meybeck, M.; Bustillo, V. Choosing methods for estimating dissolved and particulate riverine fluxes from monthly sampling. Hydrol. Sci. J. 2013, 58, 1326–1339. [Google Scholar] [CrossRef]
  17. Stahl, K.; Hisdal, H.; Hannaford, J.; Tallaksen, L.M.; Van Lanen, H.A.J.; Sauquet, E.; DeMuth, S.; Fendekova, M.; Jódar, J. Streamflow trends in Europe: Evidence from a dataset of near-natural catchments. Hydrol. Earth Syst. Sci. 2010, 14, 2367–2382. [Google Scholar] [CrossRef] [Green Version]
  18. Agence de L’eau Adour-Garonne Water Quality Datasets. Available online: http://www.eau-adour-garonne.fr/fr/index.html (accessed on 1 September 2019).
  19. Agence de L’eau Rhône Méditerranée Corse Water Quality Datasets. Available online: https://www.eaurmc.fr/ (accessed on 1 September 2019).
  20. French Ministry of Environment. Bilan de la Mise en Oeuvre de la Directive Nitrates en France (données 2012–2015). Available online: https://www.eaufrance.fr/publications/bilan-de-la-mise-en-oeuvre-de-la-directive-nitrates-en-france-donnees-2012–2015 (accessed on 1 September 2019).
  21. Tockner, K.; Uehlinger, U.; Robinson, C.T. Rivers of Europe; Elsevier Ltd.: Amsterdam, The Netherlands, 2009; ISBN 9780123694492. [Google Scholar]
  22. EAUFRANCE HYDRO. Water Quantity Datasets. Available online: http://hydro.eaufrance.fr/ (accessed on 1 September 2019).
  23. Lehner, B.; Verdin, K.; Jarvis, A. New Global Hydrography Derived from Spaceborne Elevation Data. Eos 2008, 89, 93–94. [Google Scholar] [CrossRef]
  24. Hirsch, R.; De Cicco, L.; Watkins, D.; Carr, L.; Murphy, J. EGRET: Exploration and Graphics for RivEr Trends, Version 3.0.2. Available online: https://cran.r-project.org/package=EGRET (accessed on 5 May 2020).
  25. Tukey, J.W. Exploratory Data Analysis; Addison-Wesley: Reading, MA, USA, 1977. [Google Scholar]
  26. Choquette, A.; Hirsch, R.; Murphy, J.; Johnson, L.; Confesor, R. Tracking changes in nutrient delivery to western Lake Erie: Approaches to compensate for variability and trends in streamflow. J. Great Lakes Res. 2019, 45, 21–39. [Google Scholar] [CrossRef]
  27. Millard, S.P. EnvStats, an R Package for Environmental Statistics. Encyclopedia of Environmetrics 2013, 2. [Google Scholar] [CrossRef]
  28. Pettitt, A.N. A Non-Parametric Approach to the Change-Point Problem. J. R. Stat. Soc. Ser. C Applied Stat. 1979, 28, 126. [Google Scholar] [CrossRef]
  29. Nash, J.; Sutcliffe, J. River flow forecasting through conceptual models part I — A discussion of principles. J. Hydrol. 1970, 10, 282–290. [Google Scholar] [CrossRef]
  30. UNIFA French Regional Fertilisers Statistics. Available online: https://www.unifa.fr/ (accessed on 1 September 2019).
  31. Agreste Agreste, la Statistique Agricole. Available online: https://agreste.agriculture.gouv.fr/agreste-web/ (accessed on 1 September 2019).
  32. Whitmore, A.P.; Bradbury, N.; Johnson, P. Potential contribution of ploughed grassland to nitrate leaching. Agric. Ecosyst. Environ. 1992, 39, 221–233. [Google Scholar] [CrossRef]
  33. Van Geer, F.C.; Kronvang, B.; Broers, H.P. High-resolution monitoring of nutrients in groundwater and surface waters: Process understanding, quantification of loads and concentrations, and management applications. Hydrol. Earth Syst. Sci. 2016, 20, 3619–3629. [Google Scholar] [CrossRef] [Green Version]
Figure 1. Study area including the Rhone, Charente, Dordogne, Garonne and Adour river basins.
Water 12 03374 g001
Figure 2. Flow chart of the generation of the various time series of nitrate concentrations.
Water 12 03374 g002
Figure 3. Measured versus predicted flow-weighted daily concentrations using the WRTDS methodology considering all stations together for the period 1990–2017.
Water 12 03374 g003
Figure 4. (A) The histogram of relative frequency of the coefficient of determination R2 for the 154 water quality monitoring stations. (B) The histogram (relative frequency) of the breakpoint for the studied 154 water quality monitoring stations, using flow-normalized concentrations with removal of all random variations.
Water 12 03374 g004
Figure 5. Trend analysis of the mean annual nitrate concentration using the Mann–Kendall (A) and the Nitrates Directive (B) approaches for the entire water quality dataset using the raw data.
Water 12 03374 g005
Figure 6. Impact of flow and management on the variation of the nitrate concentrations for the period 1990–2017 (A). Impact of flow and management on the variation of the nitrate concentrations after the breakpoint (B).
Water 12 03374 g006
Figure 7. (A) The red line is the estimated nitrate concentration (flow-normalized, for random variation of flow (fn_conc_7years)) for station 5,167,000, along with the average values calculated for all reporting periods (every four years, starting from 1991, rep1_conc). (B) The red line is the estimated nitrate concentration (flow-normalized, with no random and systematic variations (fn_conc_15years)) for station 5,167,000, along with the predicted calculated average nitrate concentrations for the last two reporting periods (rep5, 2008–2011 and rep6, 2012–2015) (B). In both (A) and (B): the black dotted line represents the annual concentration obtained as a simple mean of the measured concentration (raw_conc, WQWD154), and the blue line is the mean nitrate concentration obtained using a flow-weighted concentration (flow_conc, FCW154).
Water 12 03374 g007
Figure 8. Contour plot of the expected nitrate concentration (flow-normalized) for the 1990–1995 (A) and 2010–2015 periods (B). The higher and lower black line represent the 95th and 5th percentiles of flow.
Water 12 03374 g008
Figure 9. Predicted change in nitrate fluxes for the 1990–2017 period with no random (A) and no systematic (B) variations for the Garonne River.
Water 12 03374 g009
Figure 10. Predicted change in nitrate fluxes for the 1990–2017 period with no random (A) and no systematic (B) variations for the Rhone River.
Water 12 03374 g010
Table 1. Surface water bodies’ major pressures and impacts, as reported in the River Basin Management plans of the Rhone-Mediterranean-Corsica and the Adour-Garonne River Basin Districts, and for all of France [1].
Pressure/ImpactRhoneAdour-GaronneFrance
Pressure (%)Diffuse284838
Hydromorphology622242
Point sources273030
Impact (%)Nutrient pollution215533
Table 2. Characteristics of the studied river basins (retrieved from French Ministry of Environment [20] and Tockner et al., [21]).
AdourCharenteDordogneGaronneRhone
Catchment area (103 km2)16.99.523.956.290.5
Mean altitude (m)415102359478699
Mean annual flow m3/s350493806301700
Arable land (%)39.568.646.634.430.1
Population (106 inhabitant)1.10.514.18.9
Nitrate Vulnerable Zone area (%)5792135021
Table 3. Trend analysis of annual maximum, minimum and mean nitrate concentrations using the Mann–Kendall (columns 2–4) and Nitrates Directive methods (column 5) with the WQ366 dataset (raw data).
TrendMann–KendallMSD Approach
Annual Maximum ConcentrationAnnual Minimum ConcentrationAnnual Mean ConcentrationAnnual Mean Concentration
Decreasing trend (%)12171620
No significant trend (%)70686463
Increasing trend (%)18152017
Table 4. Mann–Kendall trend analysis of annual nitrate concentration using raw WQ154, flow-adjusted FCW154 and FCN154 flow-normalized concentrations (random variation of flow removed) using the Mann–Kendall test for the period 1990–2017 (28 years) along with the calculated MSD (reporting periods 2012–2015 and 2008–2011) trend calculated using the raw concentration (conc.).
TrendMann–Kendall TestMSD Trend
WQ154
(Raw Conc.)
FCW154
(Flow-Weighted Conc.)
FCN154
(Flow-Normalized Conc.)
FCW154
(Raw Conc.)
Decreasing trend (%)13343419
No significant trend (%)61312267
Increasing trend (%)26354414
Table 5. Trend analysis of annual nitrate concentration using raw, flow-weighted and flow-normalized concentrations using the Mann–Kendall trend test for the period 2008–2015 (8 years) along with the calculated MSD trend using the raw concentration (conc.).
TrendMann–Kendall TestMSD Trend
WQ154
(Raw Conc.)
FCW154
(Flow-Weighted Conc.)
FCN154
(Flow-Normalized Conc.)
FCW154
(Raw Conc.)
Decreasing trend (%)6307019
No significant trend (%)93662067
Increasing trend (%)141014
Table 6. Trend analysis of annual nitrate concentration using raw, flow-weighted and flow-normalized concentrations (conc.) using the MSD trend test (period 2008–2011 and 2012–2015) per class of trend of the Nitrates Directive.
TrendWQ154
(Raw Conc.)
FCW154 (Flow-Weighted Conc.)FCN154 (Flow-Normalized Conc.)
Highly decreasing trend (%)3016
Decreasing trend (%)16181
No significant trend (%) 678082
Increasing trend (%)1121
Highly increasing trend (%)300
Table 7. Characteristics of the trend before and after breakpoint.
Station (%)Trend Before BreakpointTrend After Breakpoint
11
82
3
6
443
8
10
4
16
1 non-significant trend; 2 increasing trend; 3 decreasing trend.
Table 8. Trend analysis of annual nitrate concentration using raw and flow-normalized concentrations using the Mann–Kendall trend test for the period 1990–2017 after removal of random and systematic variation due to flow variability.
TrendWQWD154
(Raw Concentration)
FCN154 (Flow-Normalized Concentration, Removing Random Variation of Flow)FCNV154 (Flow-Normalized Concentration Removing Random and Systematic Variations of Flow)
Decreasing trend (%)133438
No significant trend (%)61228
Increasing trend (%)264454
Publisher’s Note: MDPI stays neutral with regard to jurisdictional claims in published maps and institutional affiliations.

