Event-Based Time Distribution Patterns, Return Levels, and Their Trends of Extreme Precipitation across Indus Basin
Abstract
:1. Introduction
2. Materials and Methods
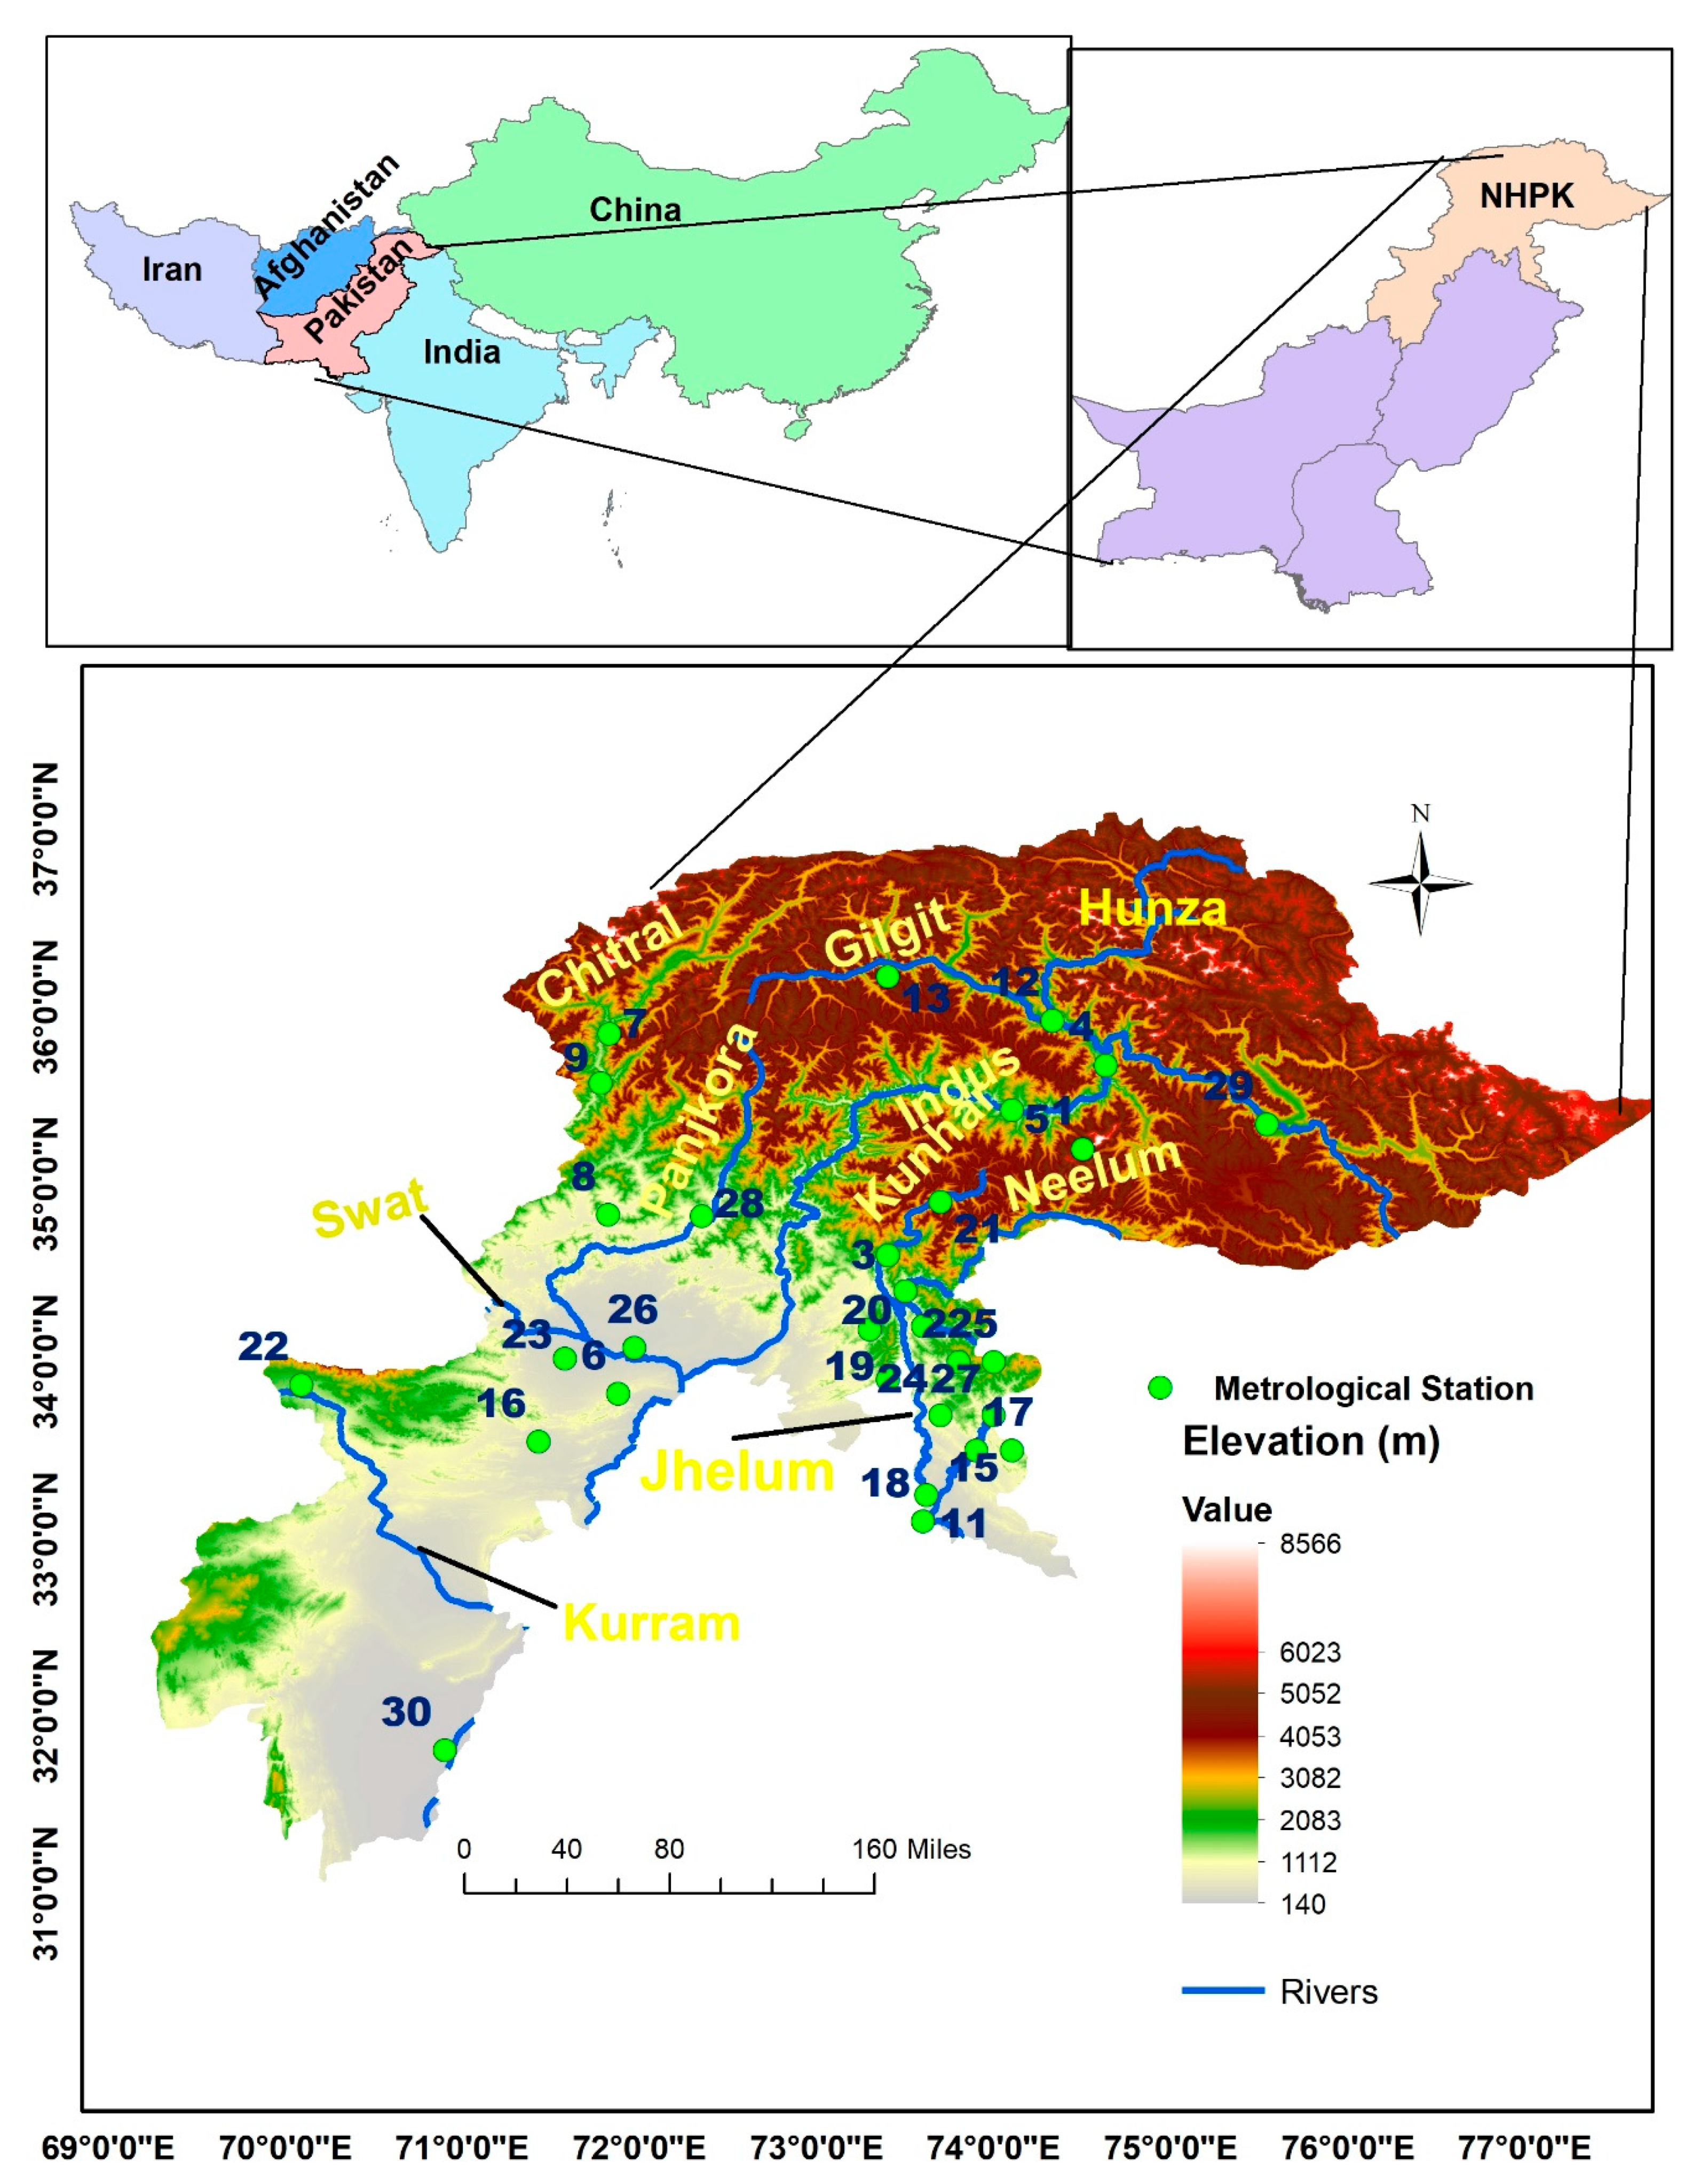
2.1. Study Area and Datasets
2.1.1. Study Area
2.1.2. Datasets and Quality Control
2.2. Selection of Precipitation Indices
2.3. Trend Analysis and Index Calculation
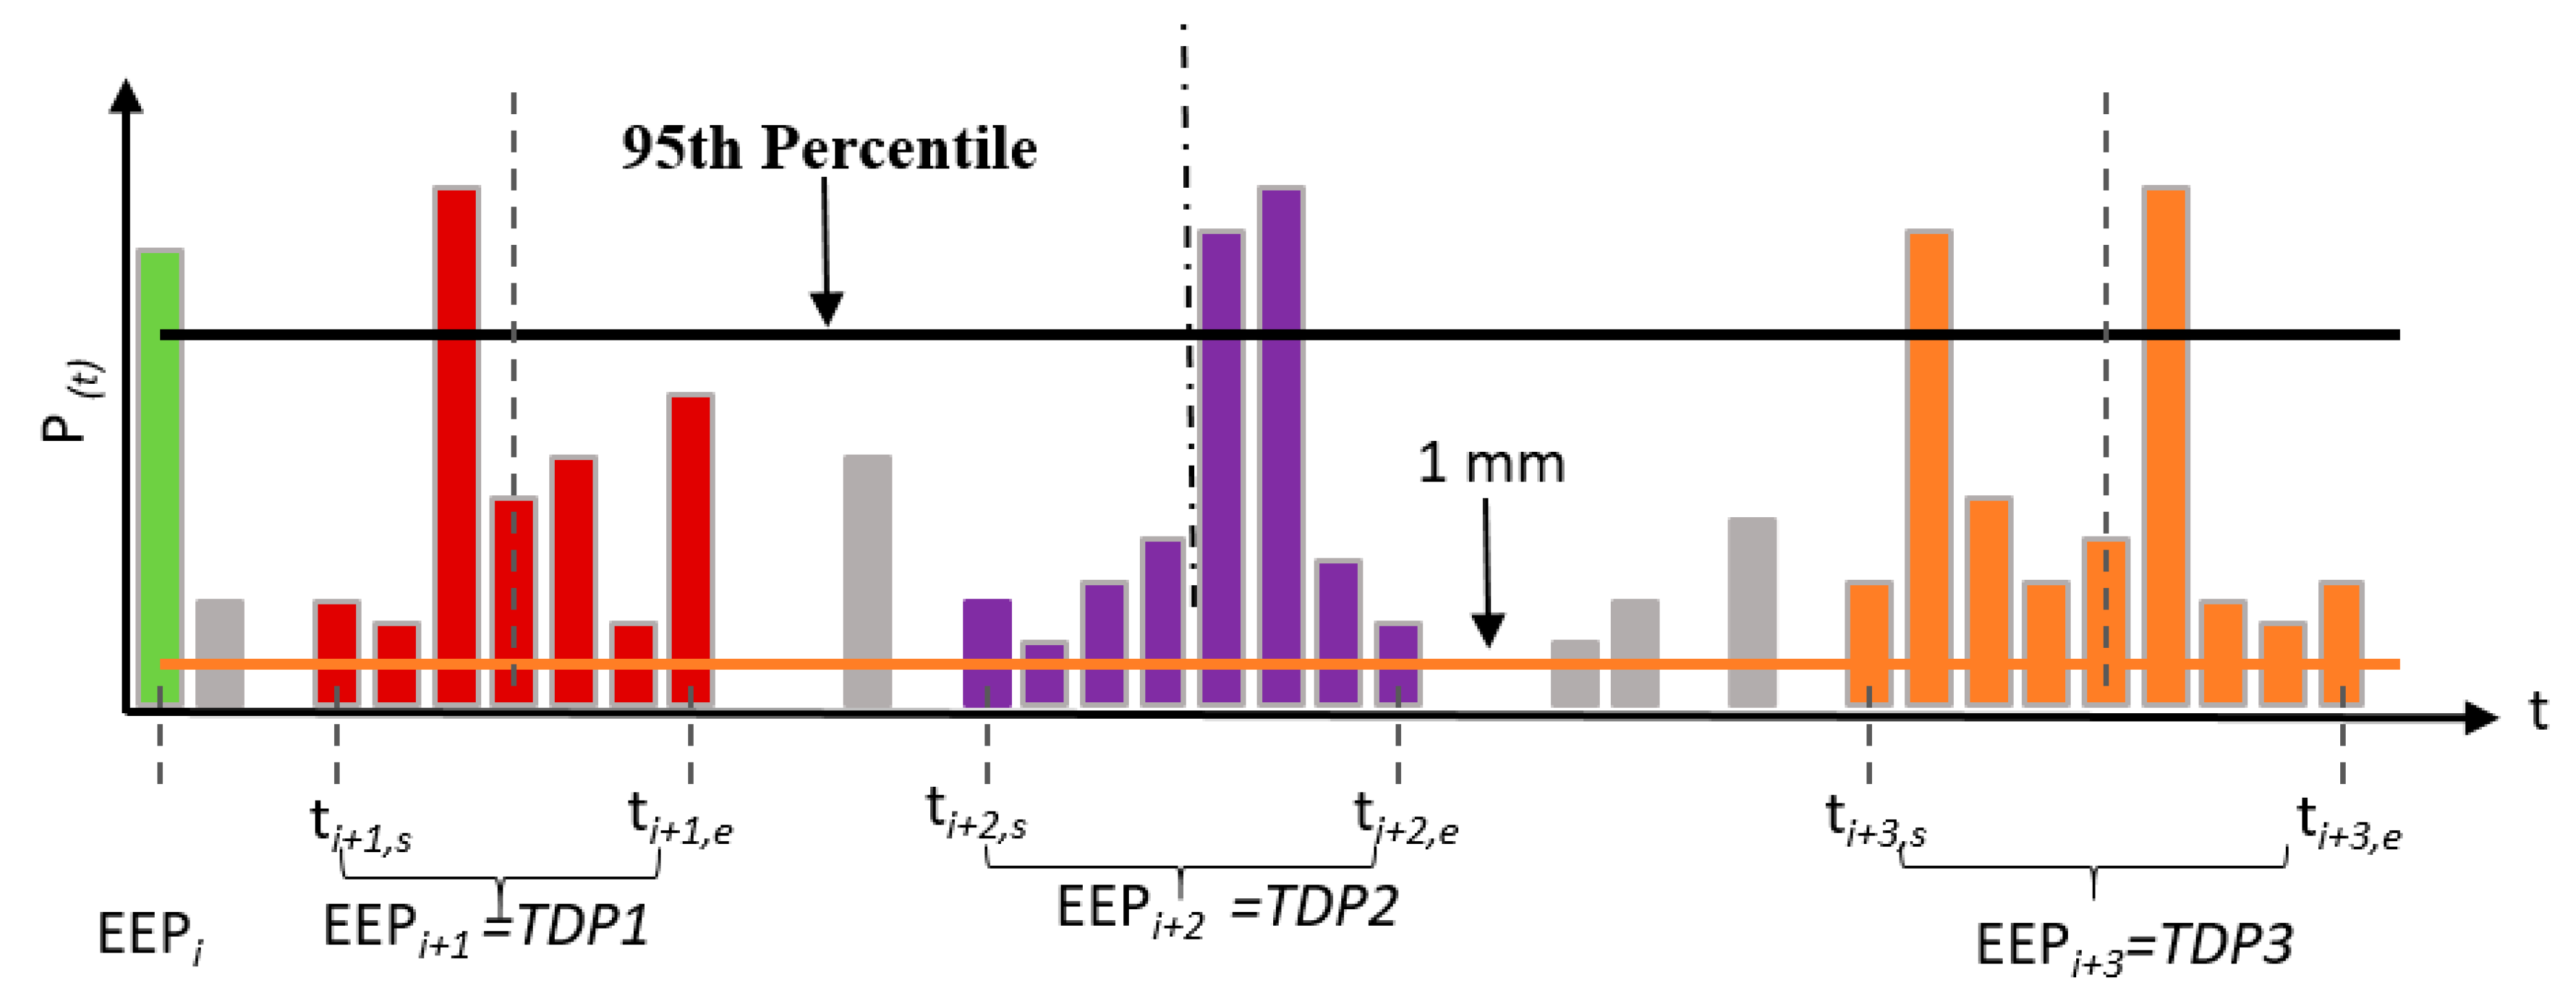
2.4. Definition of EEP
2.5. Time Distribution Pattern (TDP)
- TDP1: for an event duration, all DPEs for an EEP are dispersed in the first half.
- TDP2: for an event duration, all DPEs for a multi-day EEP are fallen in the second half.
- TDP3: for an event duration, few of the DPEs during an EEP are fallen in the first half, and few in the second half.
2.6. Return Levels Estimation of EEP
3. Results
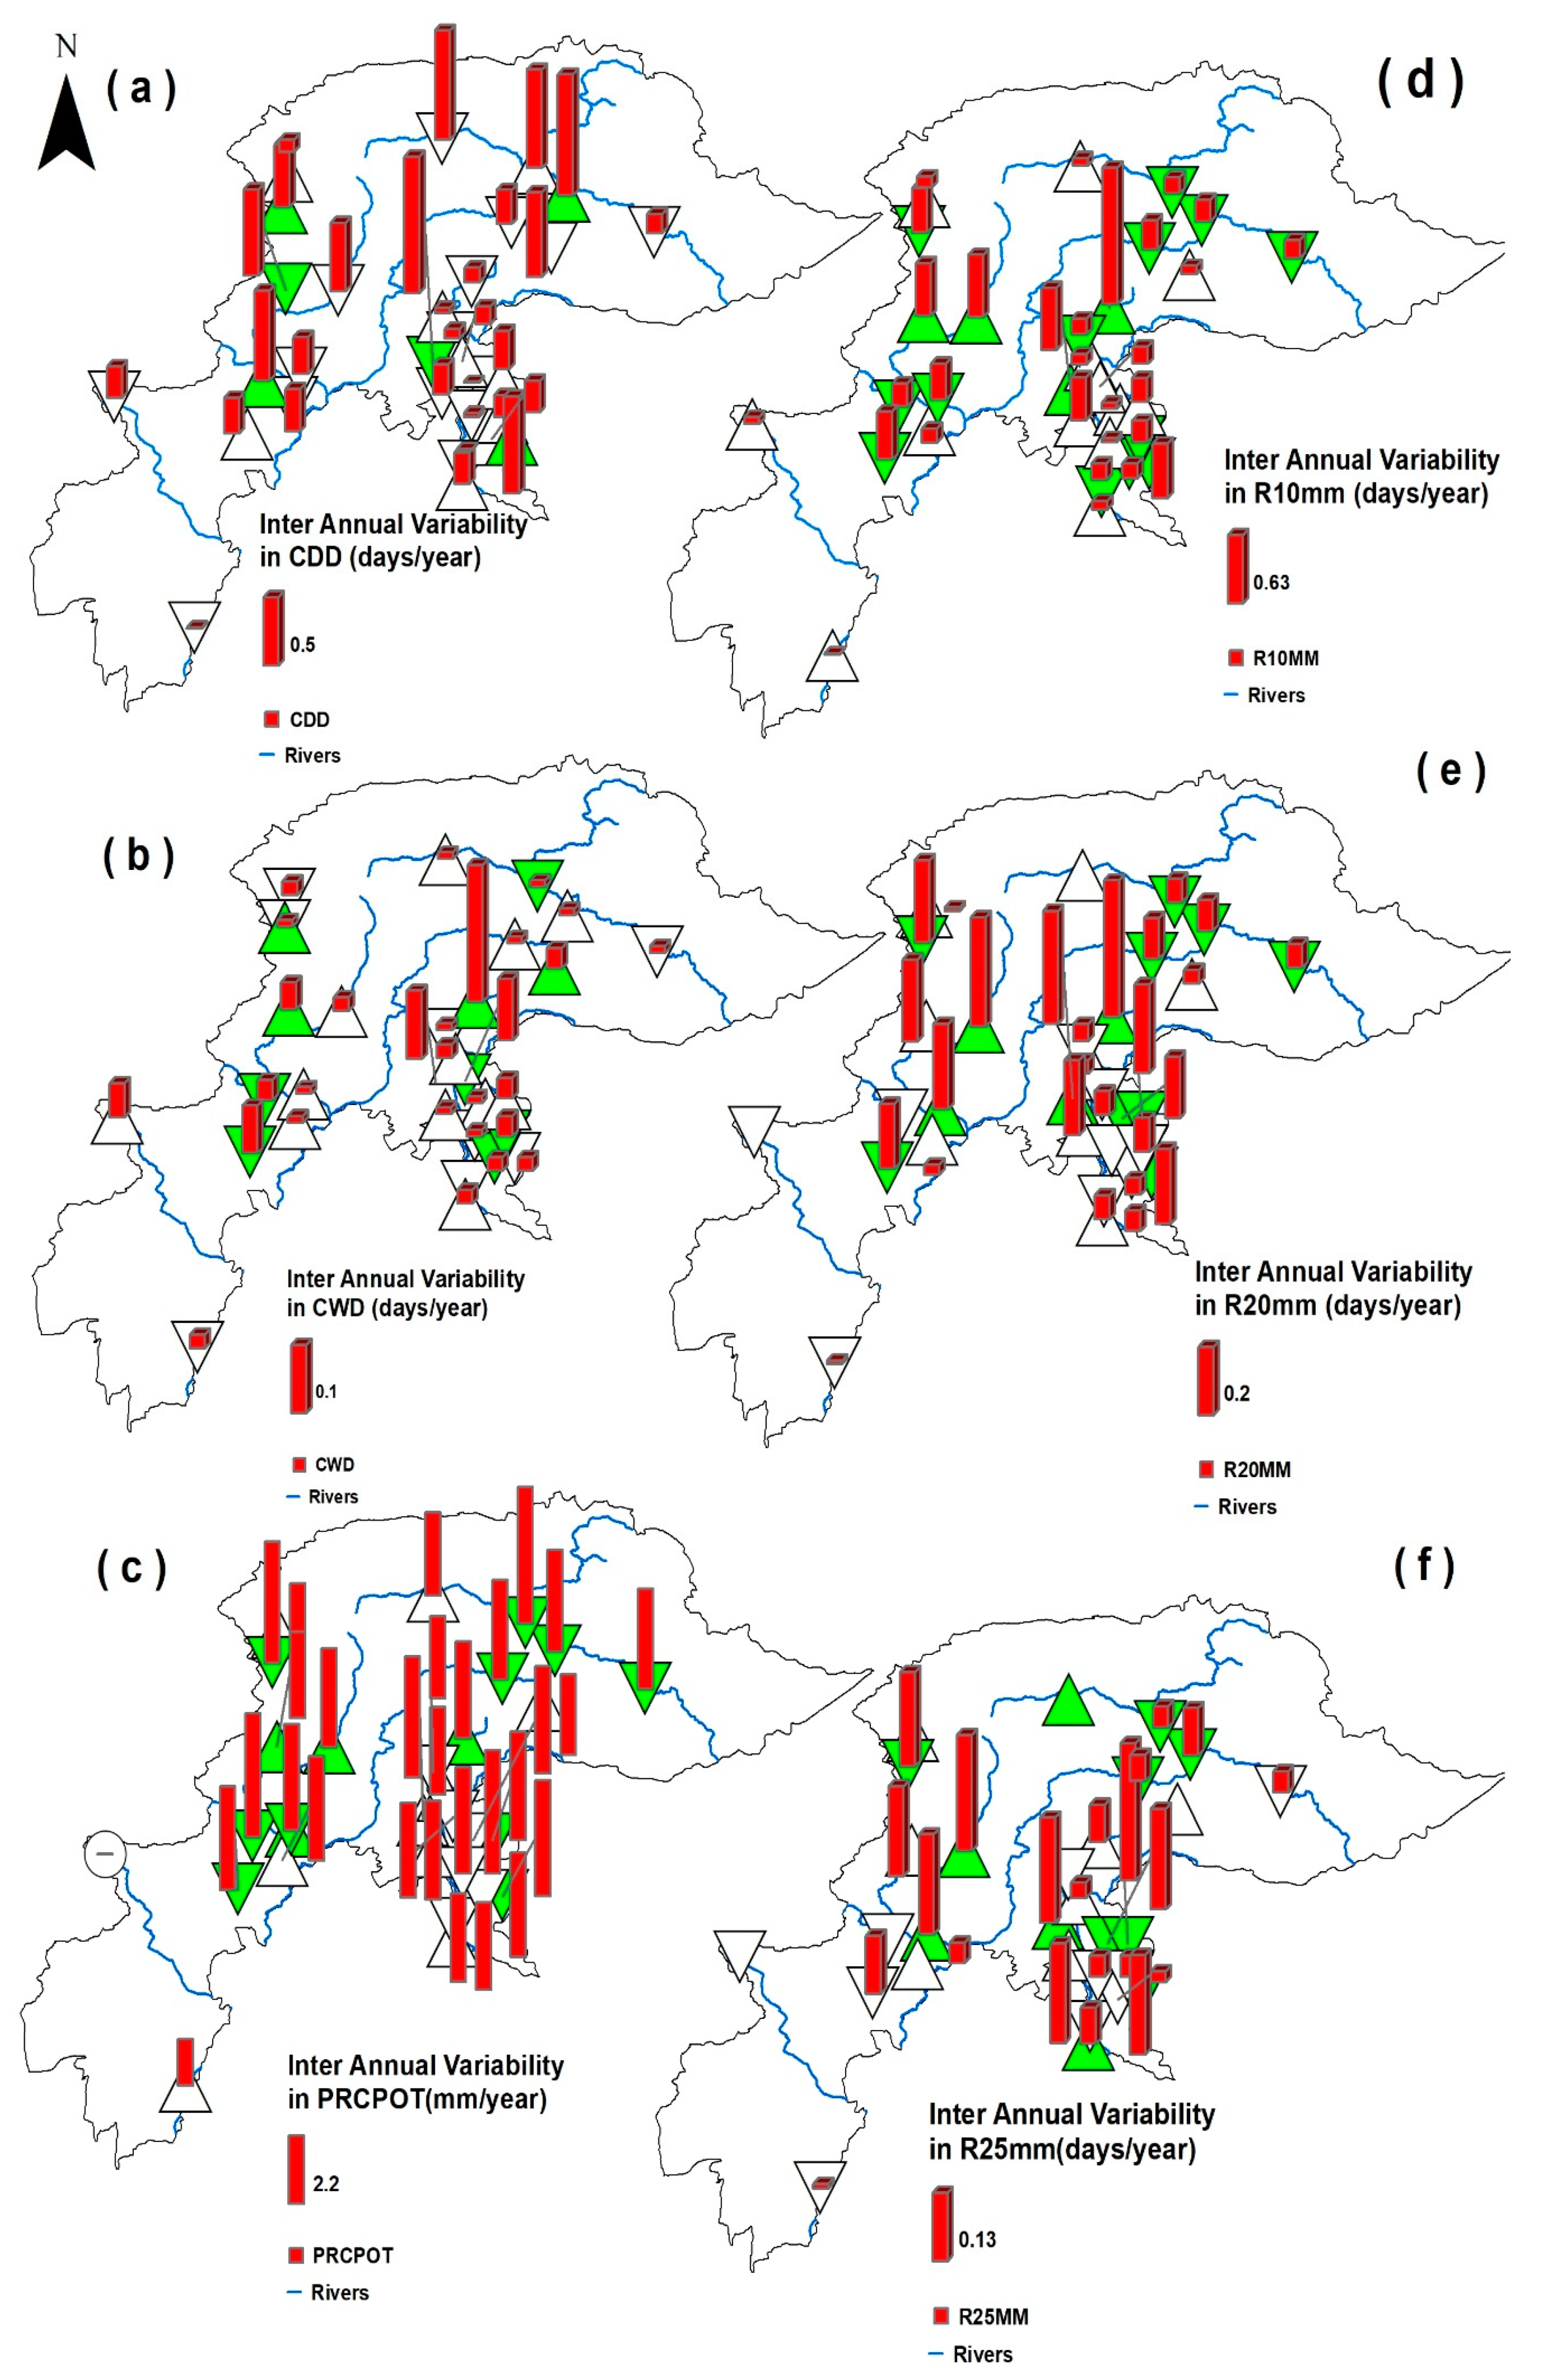
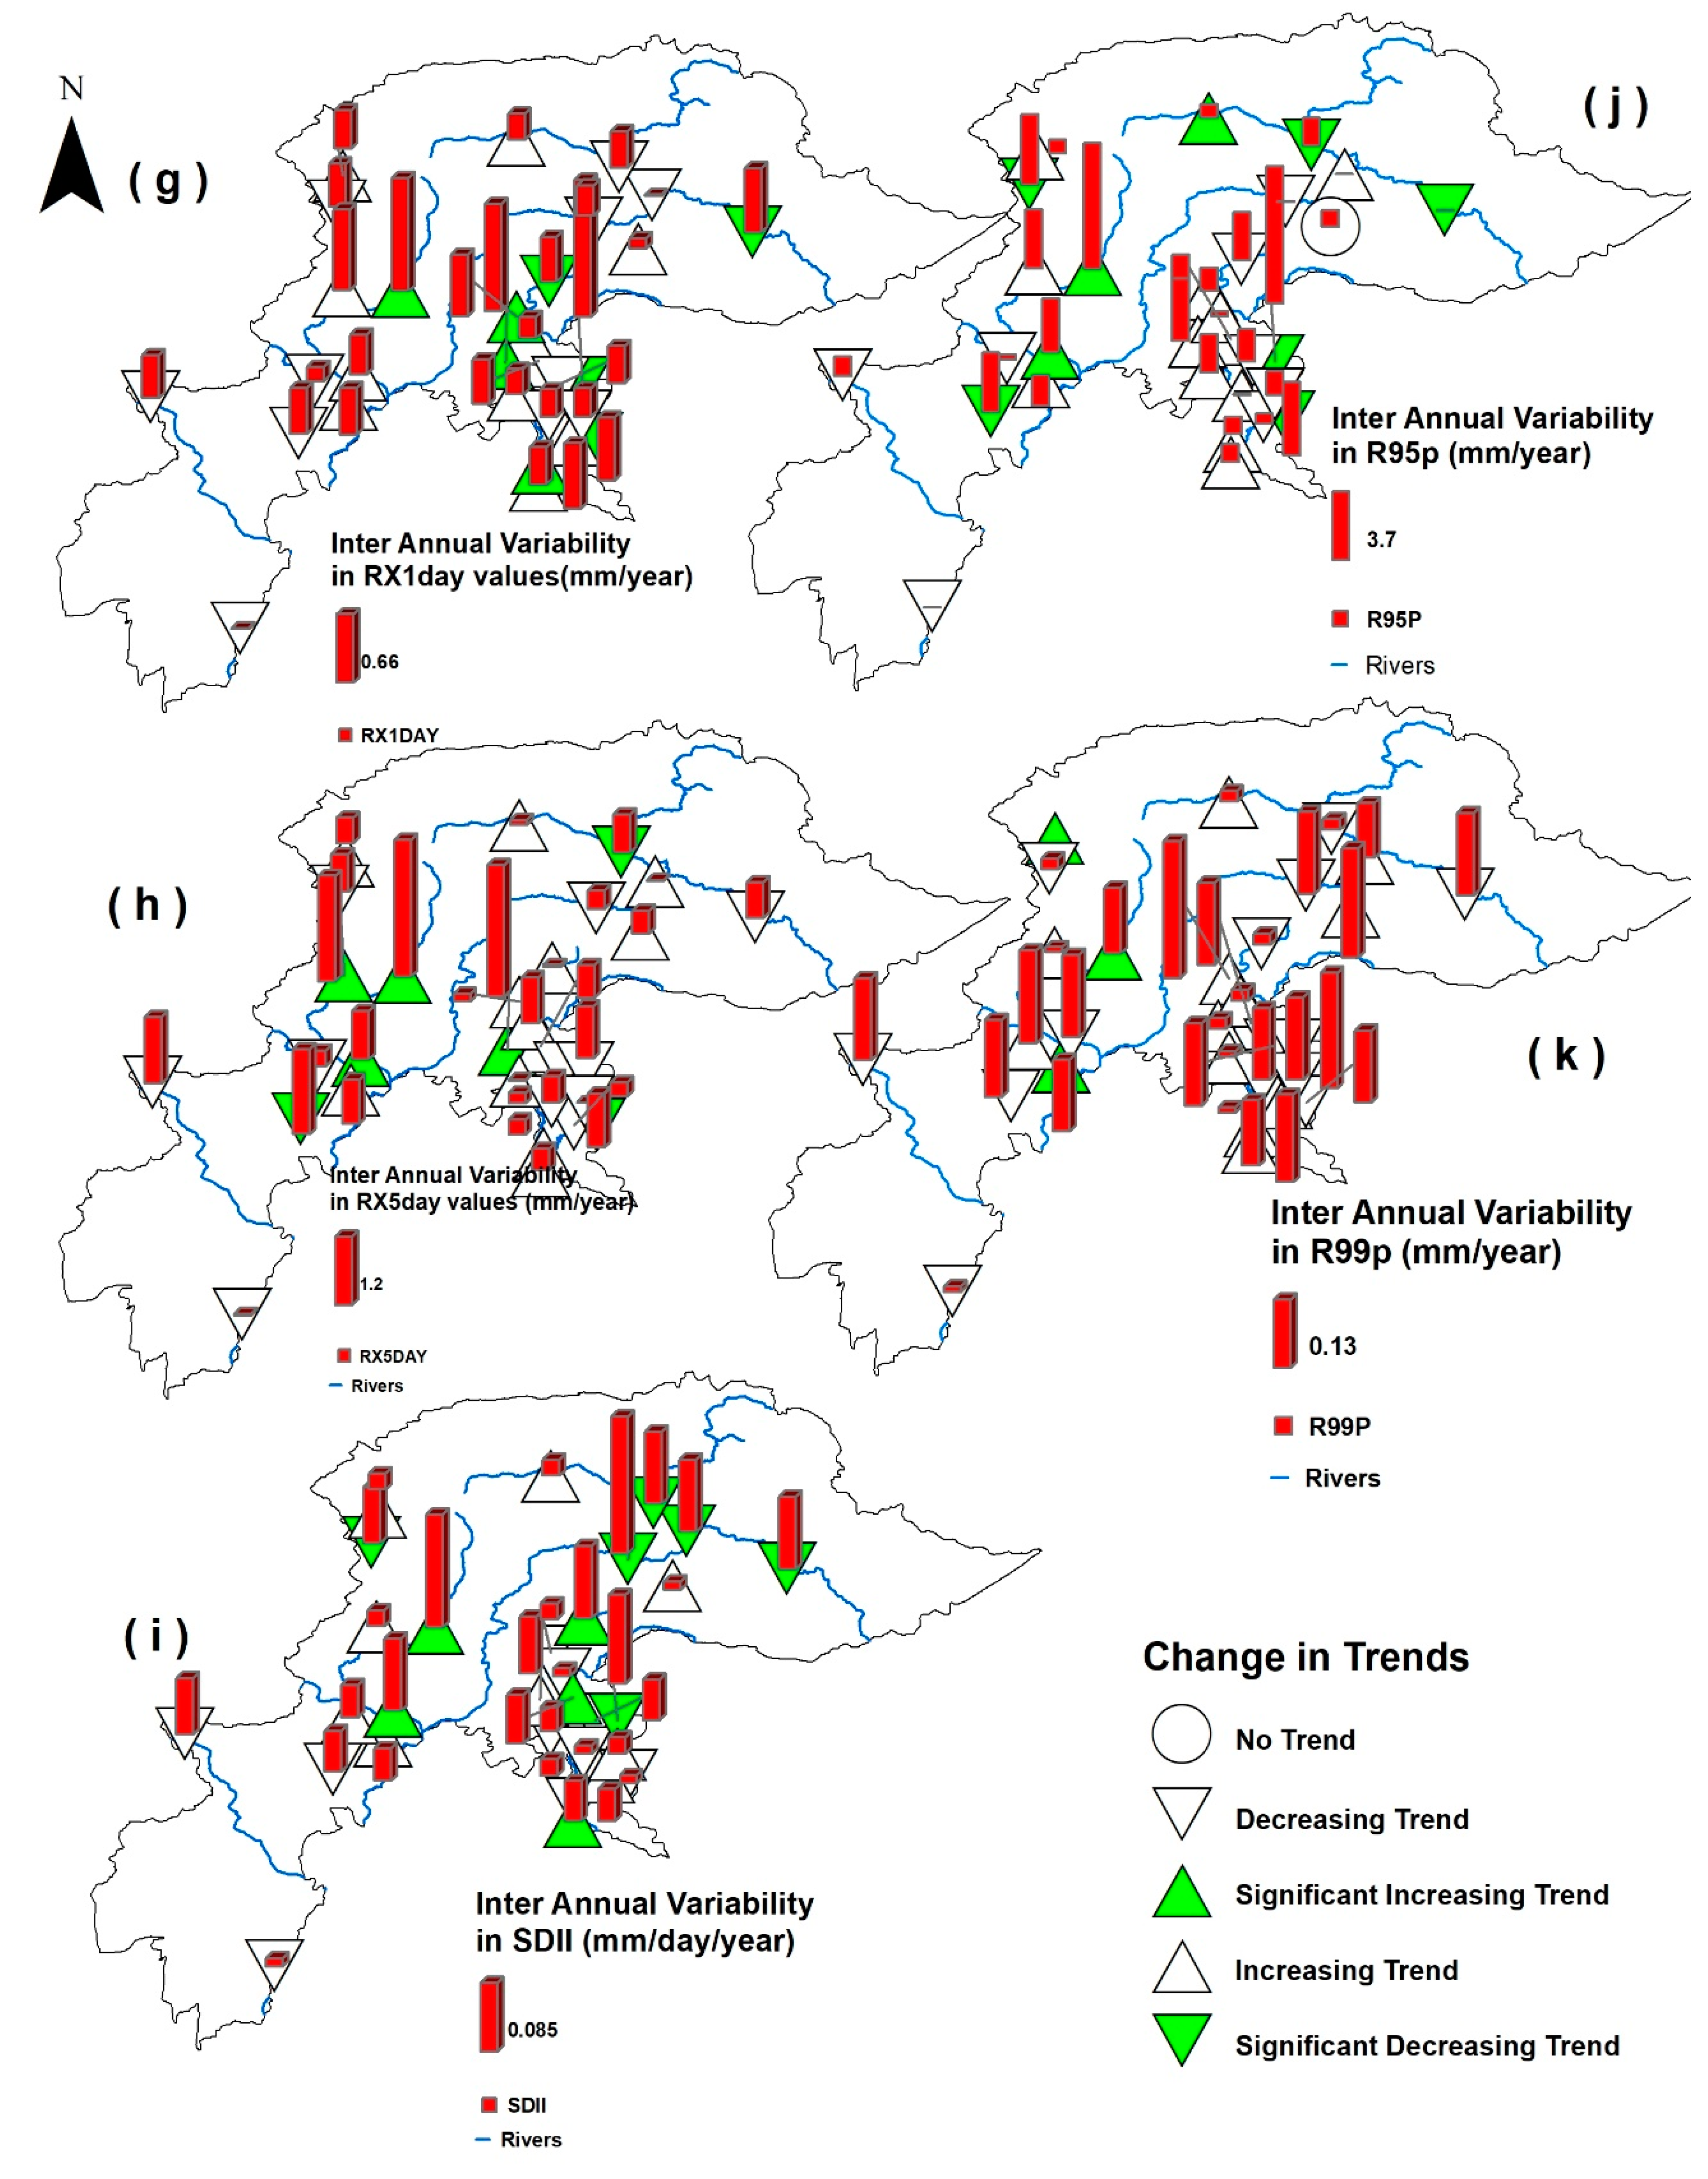
3.1. Change in Annual Precipitation Extreme Indices
Spatio-Temporal Patterns of Extreme Precipitation Indices
3.2. Supremacy of Different EEP Patterns
3.3. Long-Term Mean Characteristics
3.4. Spatio-Temporal Configurations of EEPs Trends
3.5. Return Levels of EEP
4. Discussion
4.1. Significance of Extreme Precipitation Indices
4.2. Rationality of the EEP Concept
4.3. Review of EEP Characteristics and Variations
4.4. Significances for Water Resources and Hydrology
5. Conclusions
- In general, NHPK portrayed heterogeneous trends of precipitation indices with significant trends (positive values between (1.2–0) and negative (−4.4–0)) along the Swat, Panjkora and Jhelum Rivers periphery.
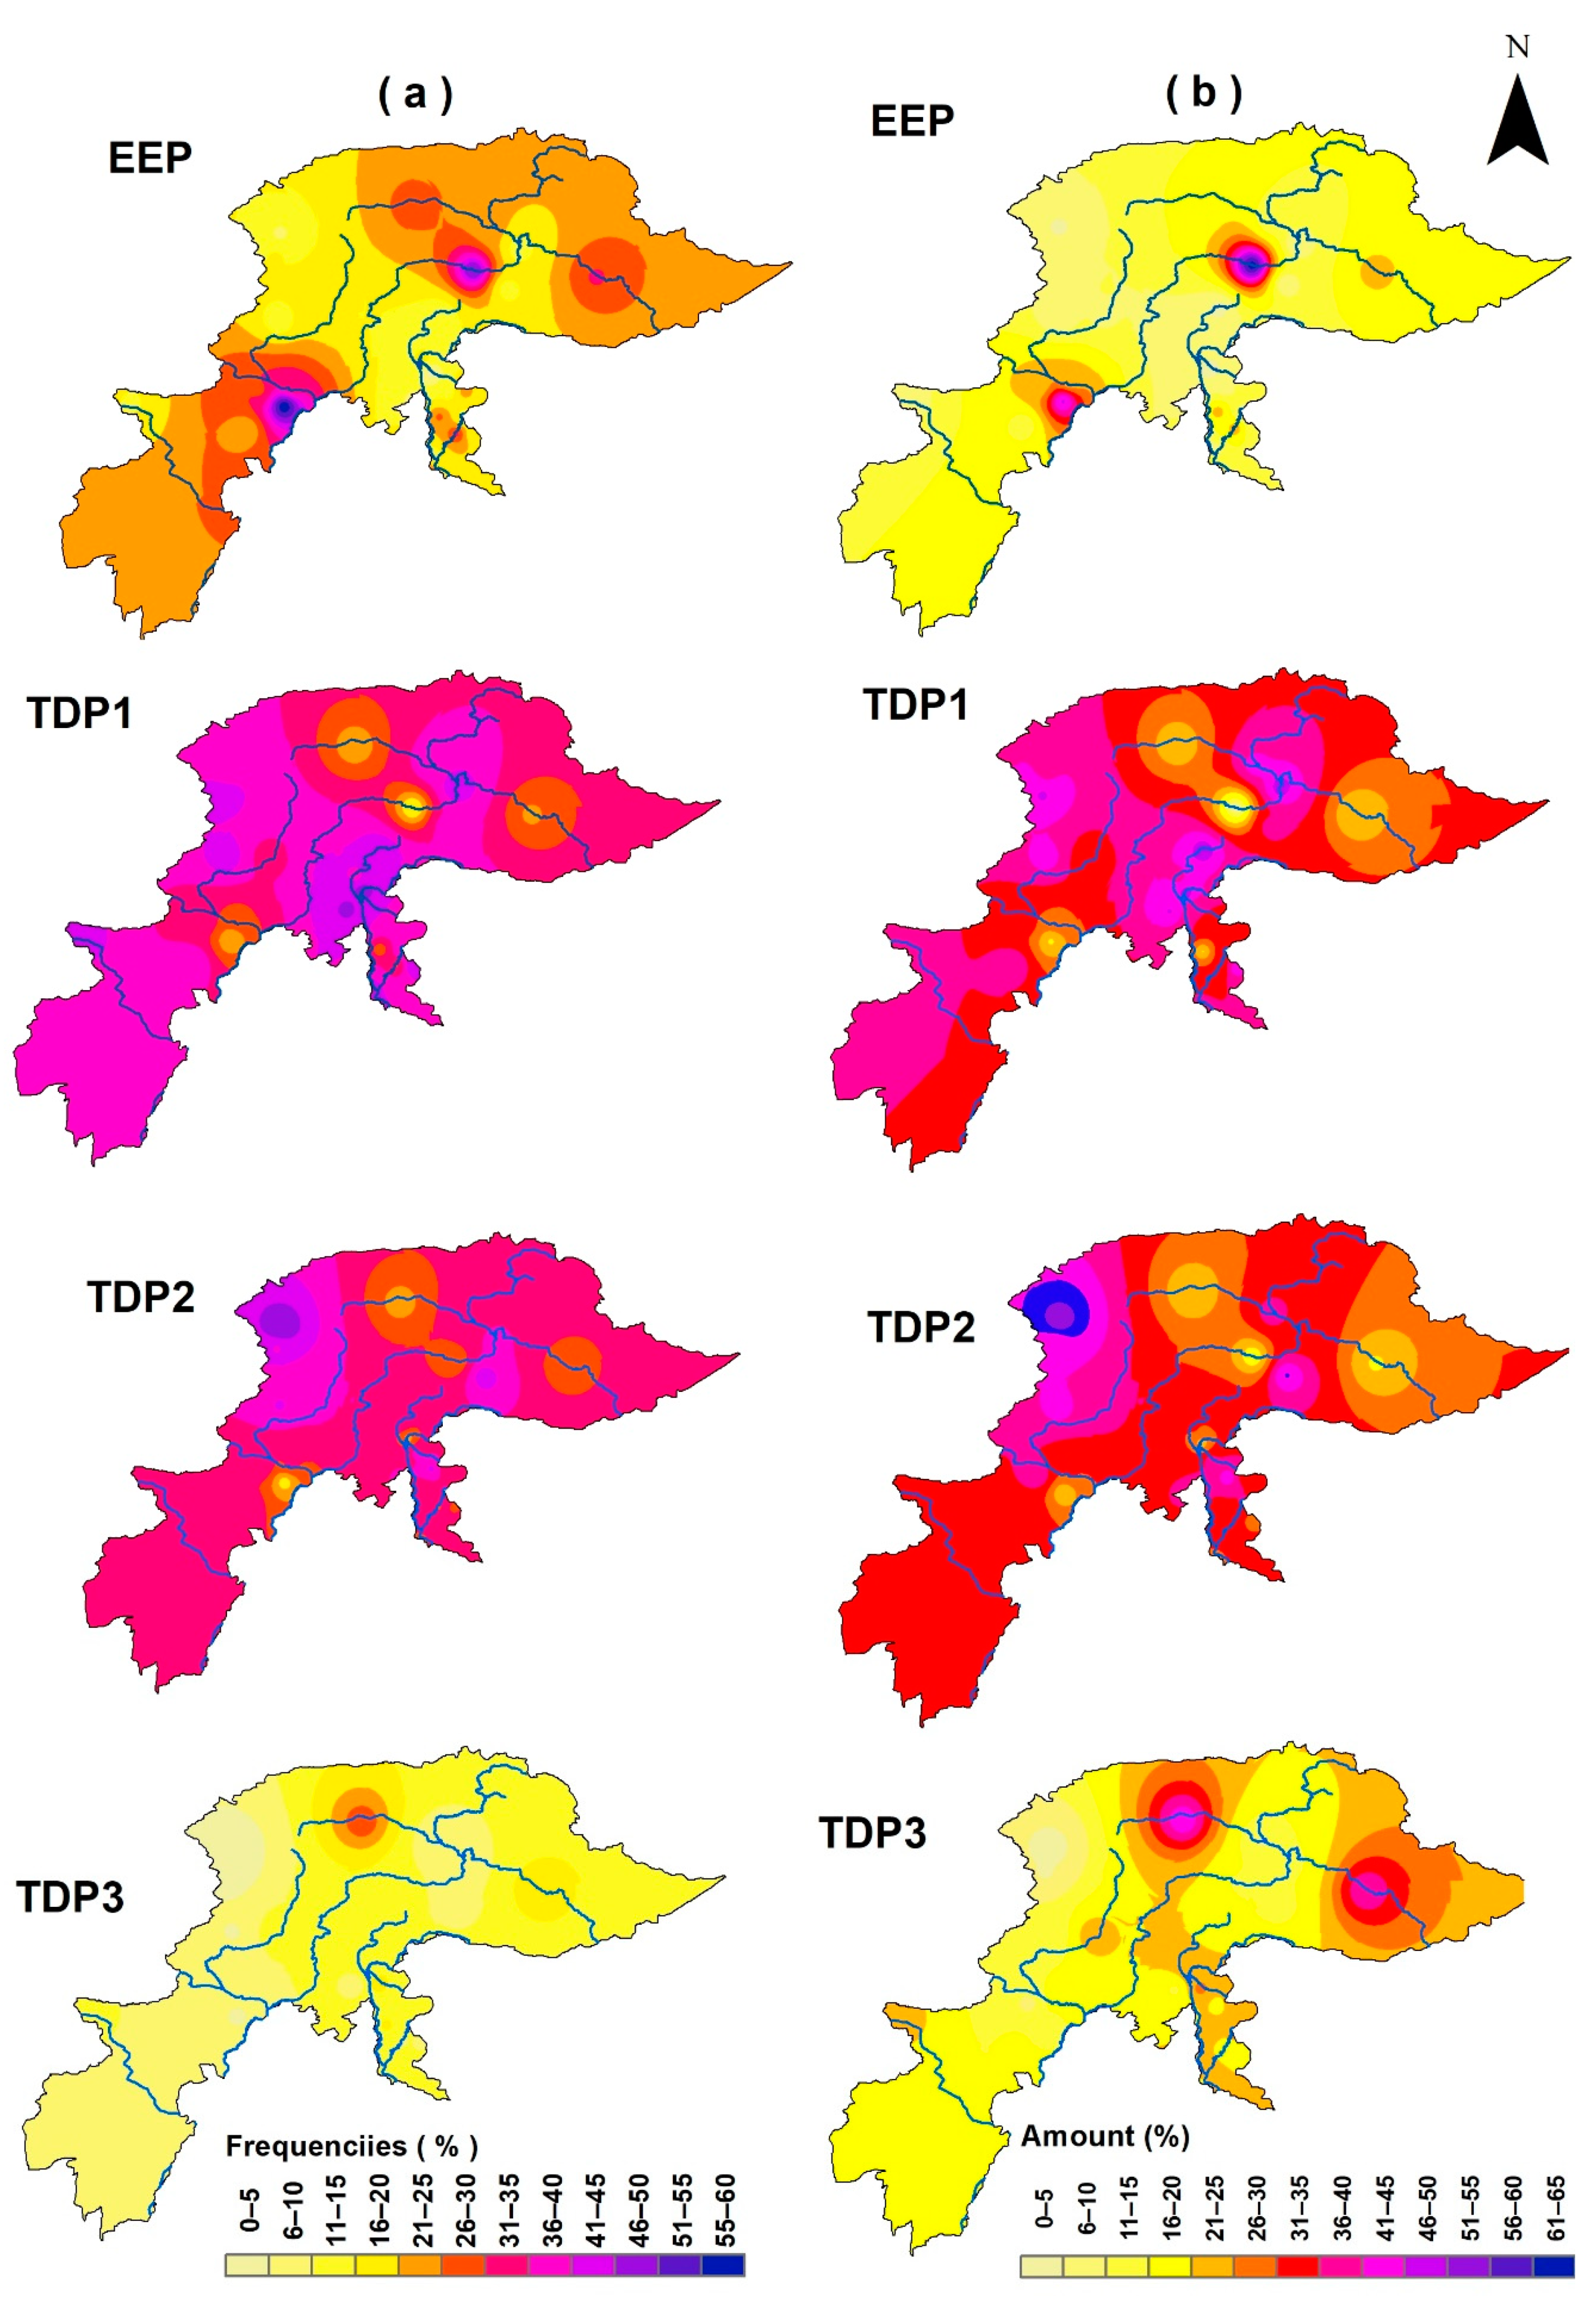
- The precipitation data establish the EEP concept that the patterns of precipitation amounts (EEP 1.8–61.7%, TDP1 7.4–48%, TDP2 16.7–54%, TDP3 2.4–43.4%) are approximately similar to those of frequency percentages (EEP 3.5–59%, TDP1 15–48%, TDP2 18–50.4%, TDP3 1.6–28.2%) in general, displaying that total frequency overall consistent with total precipitation amount.
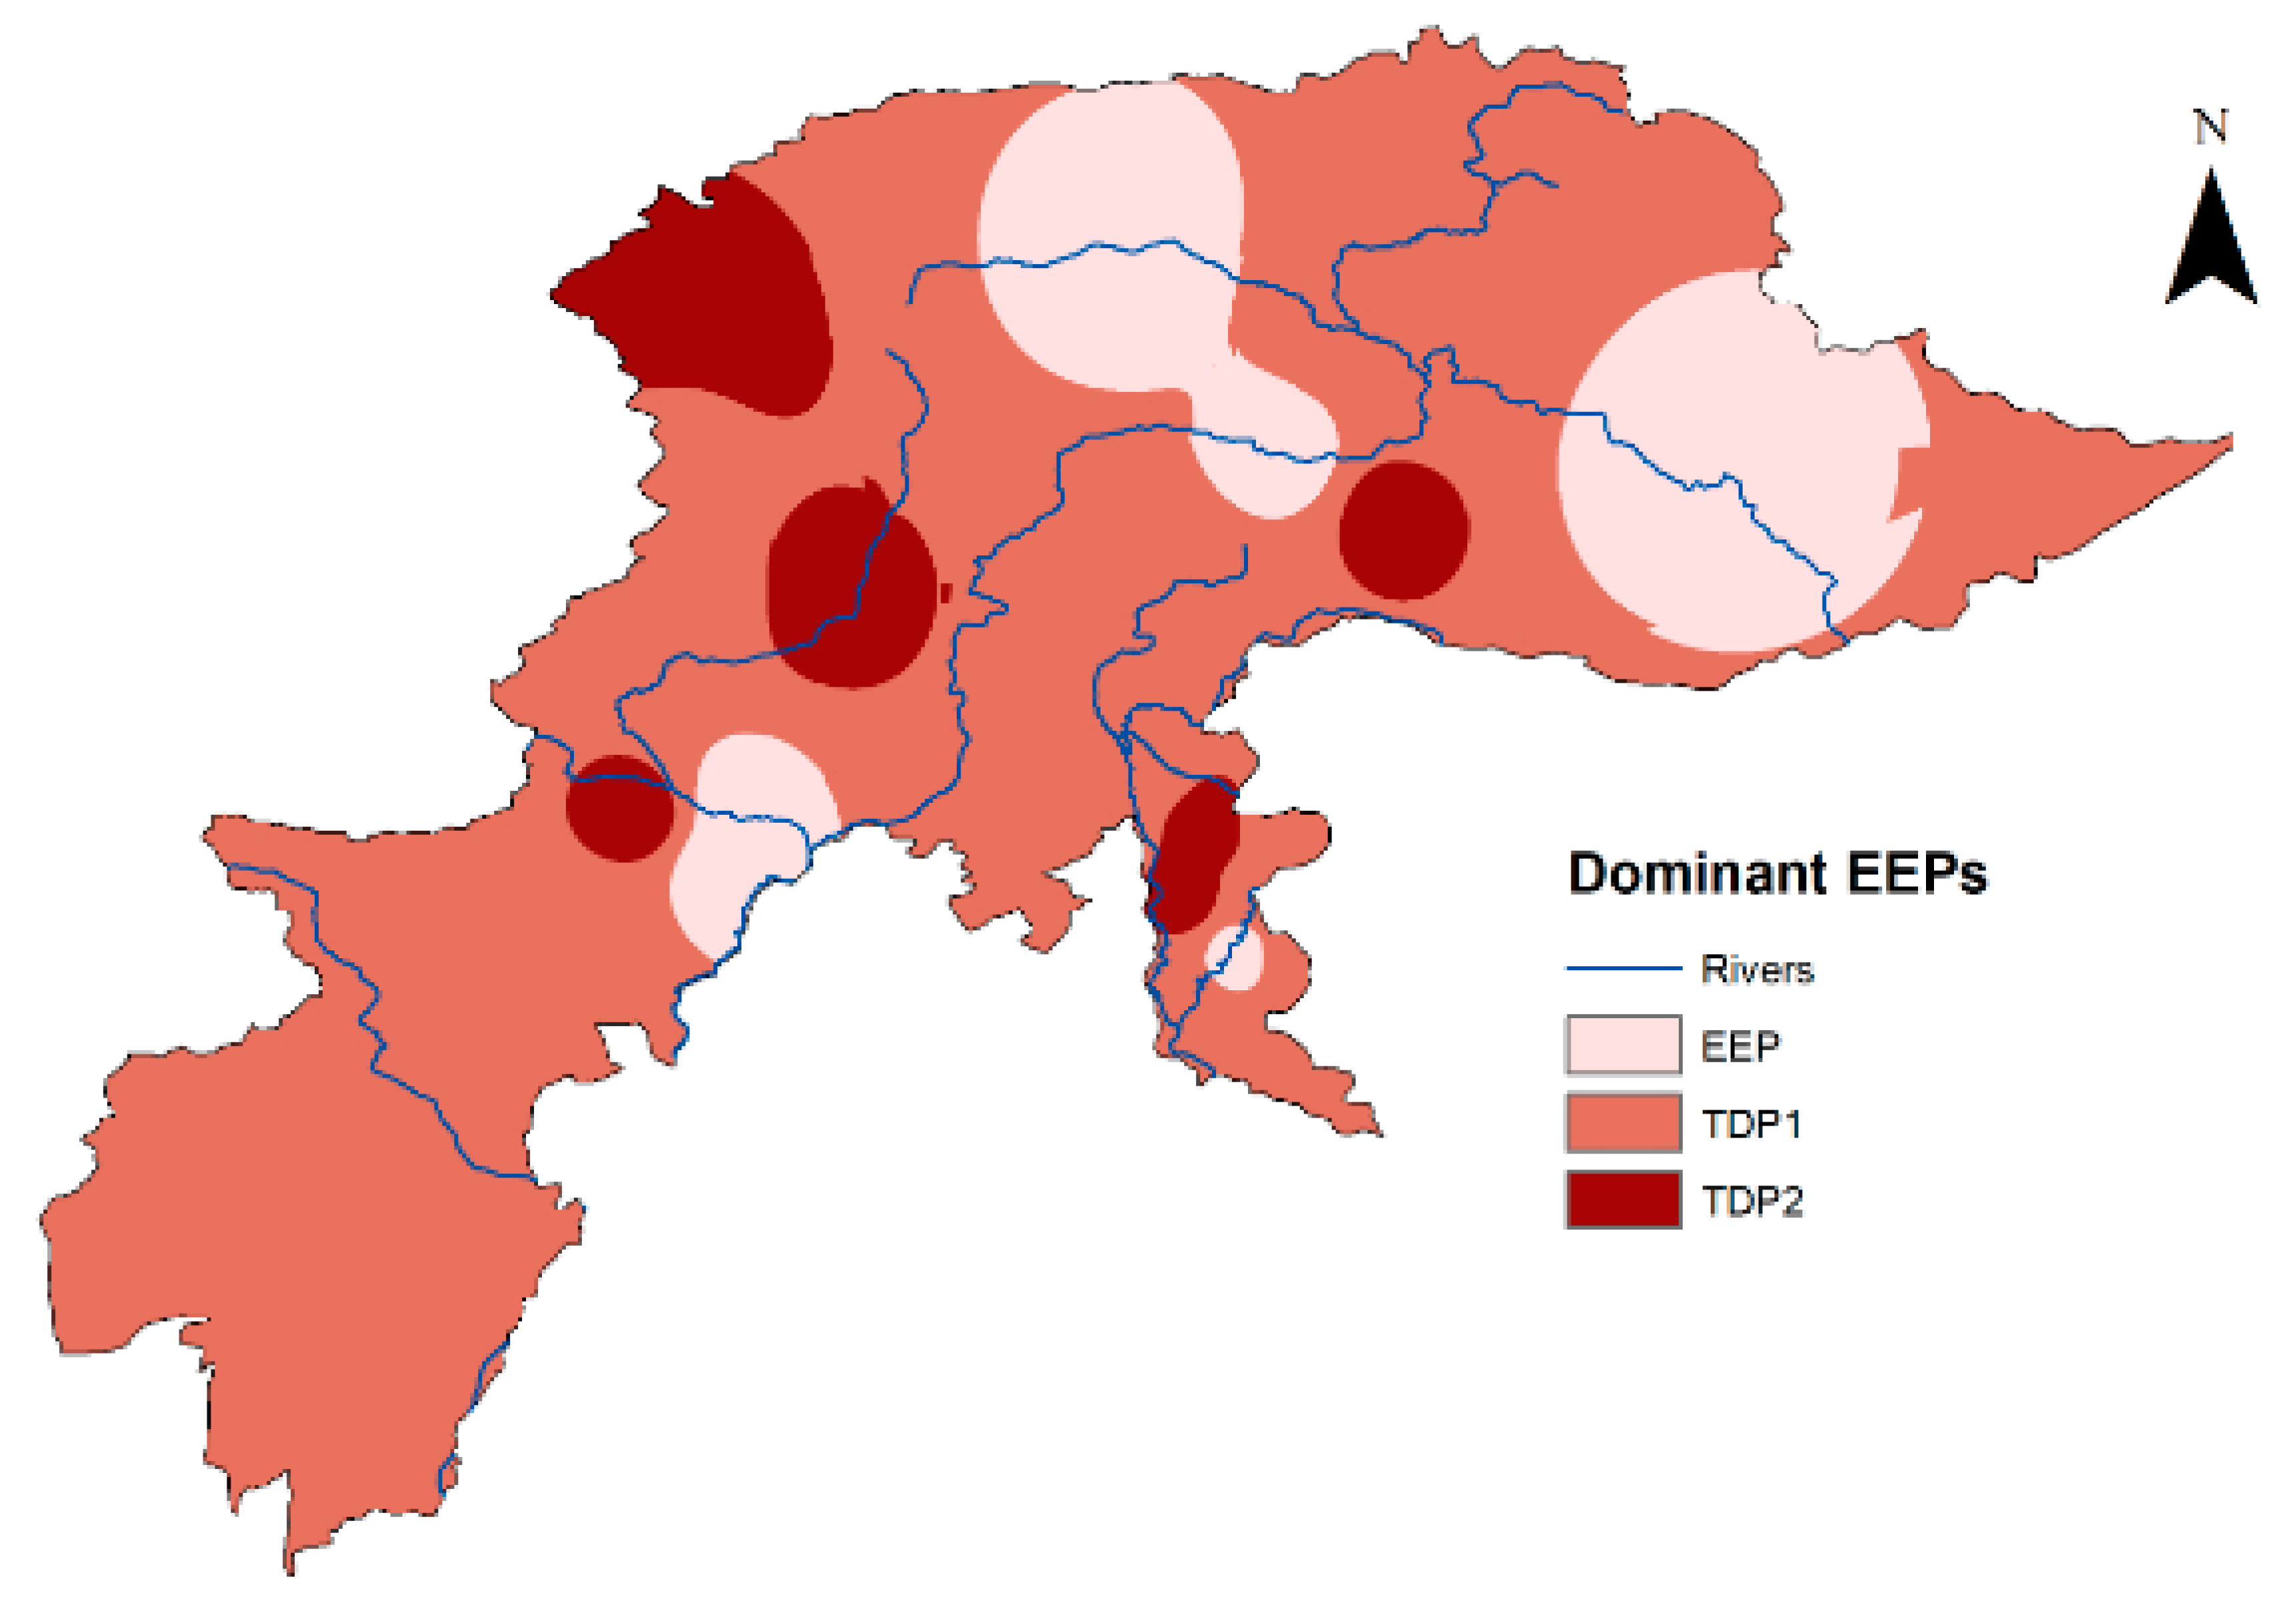
- Certainly, TDP1 is dominant over a maximum area of NHPK except in some parts of the northeast (uppermost parts of Indus basin), northwest (upper and lower part of Gilgit River) and at the conflux of SWAT and Indus Rivers, where 1-day EEP prevails.
- Comparatively, the event amount (160–320 mm), concentration ratio (0.8–1) and event duration (4–7 days) of TDP3 are generally dominant than the other three EEPs across the NHPK.
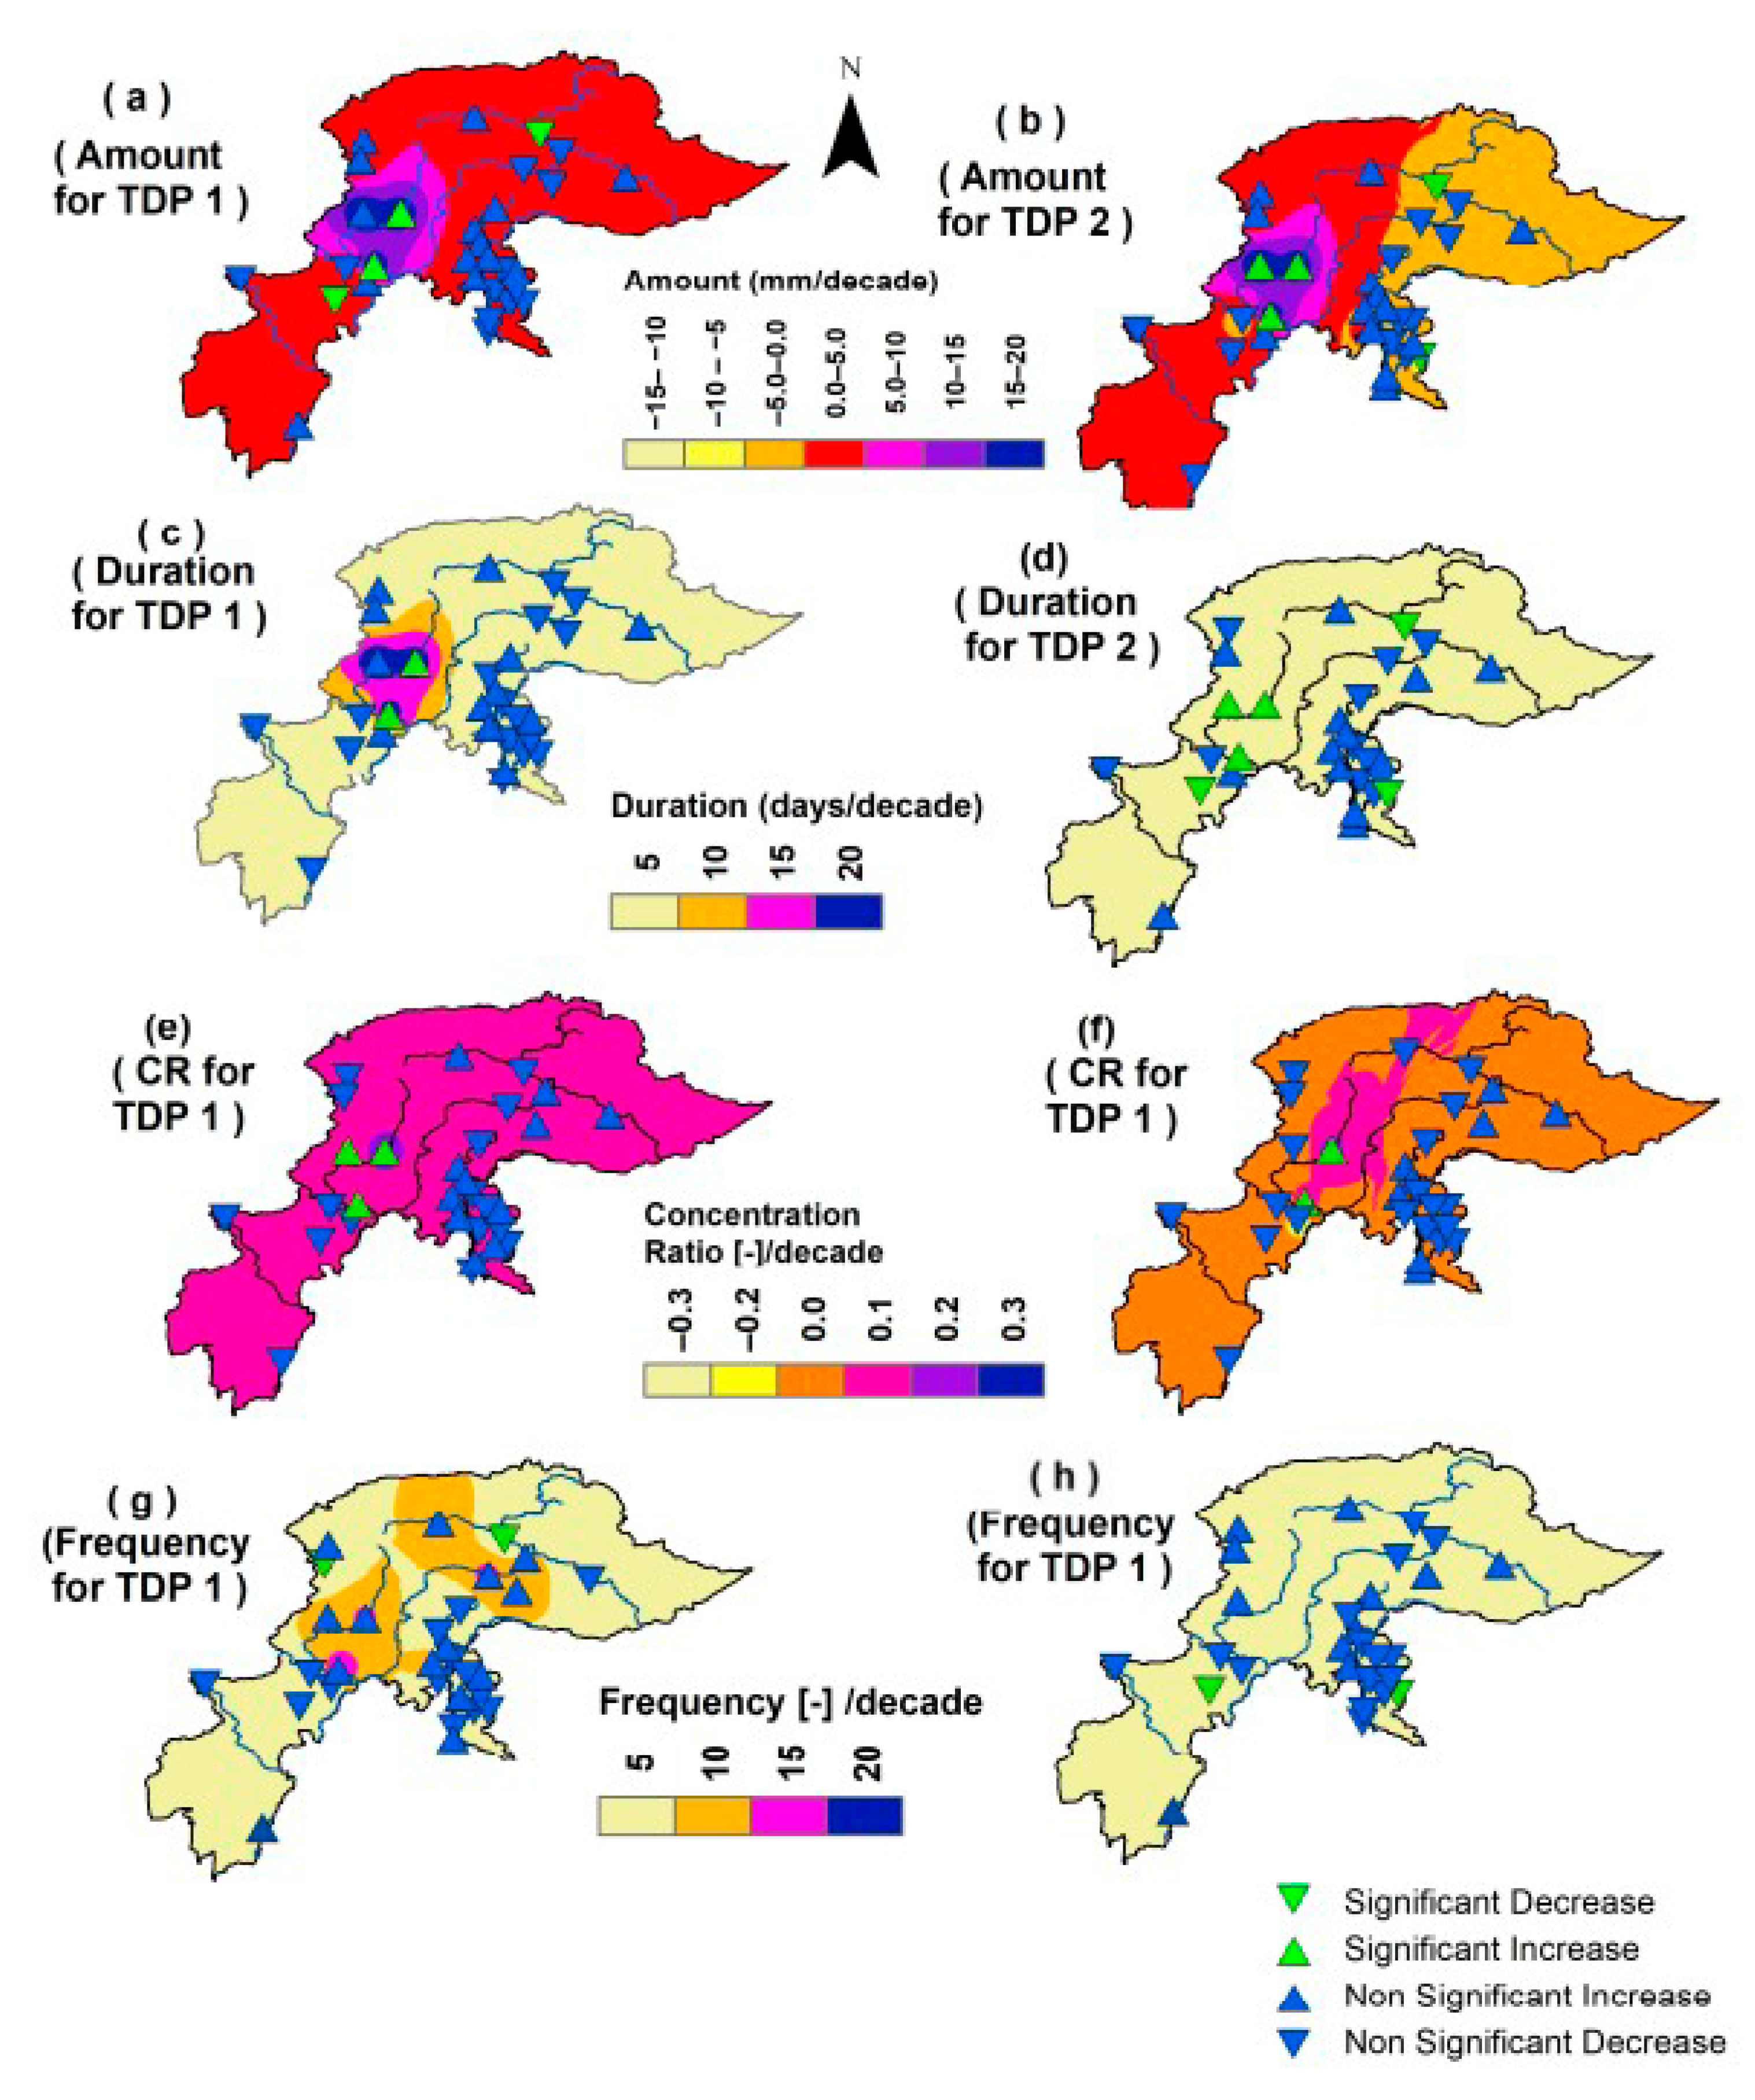
- Moreover, heterogeneous trends in four indicators (amount, duration, concentration ratio and frequency) of TDP1 and TDP2 have been detected, with overall dominant TDP1 trends over the NHPK than those of TDP2. Furthermore, concurrently significant trends of TDP1 are broadly observed than those of TDP2.
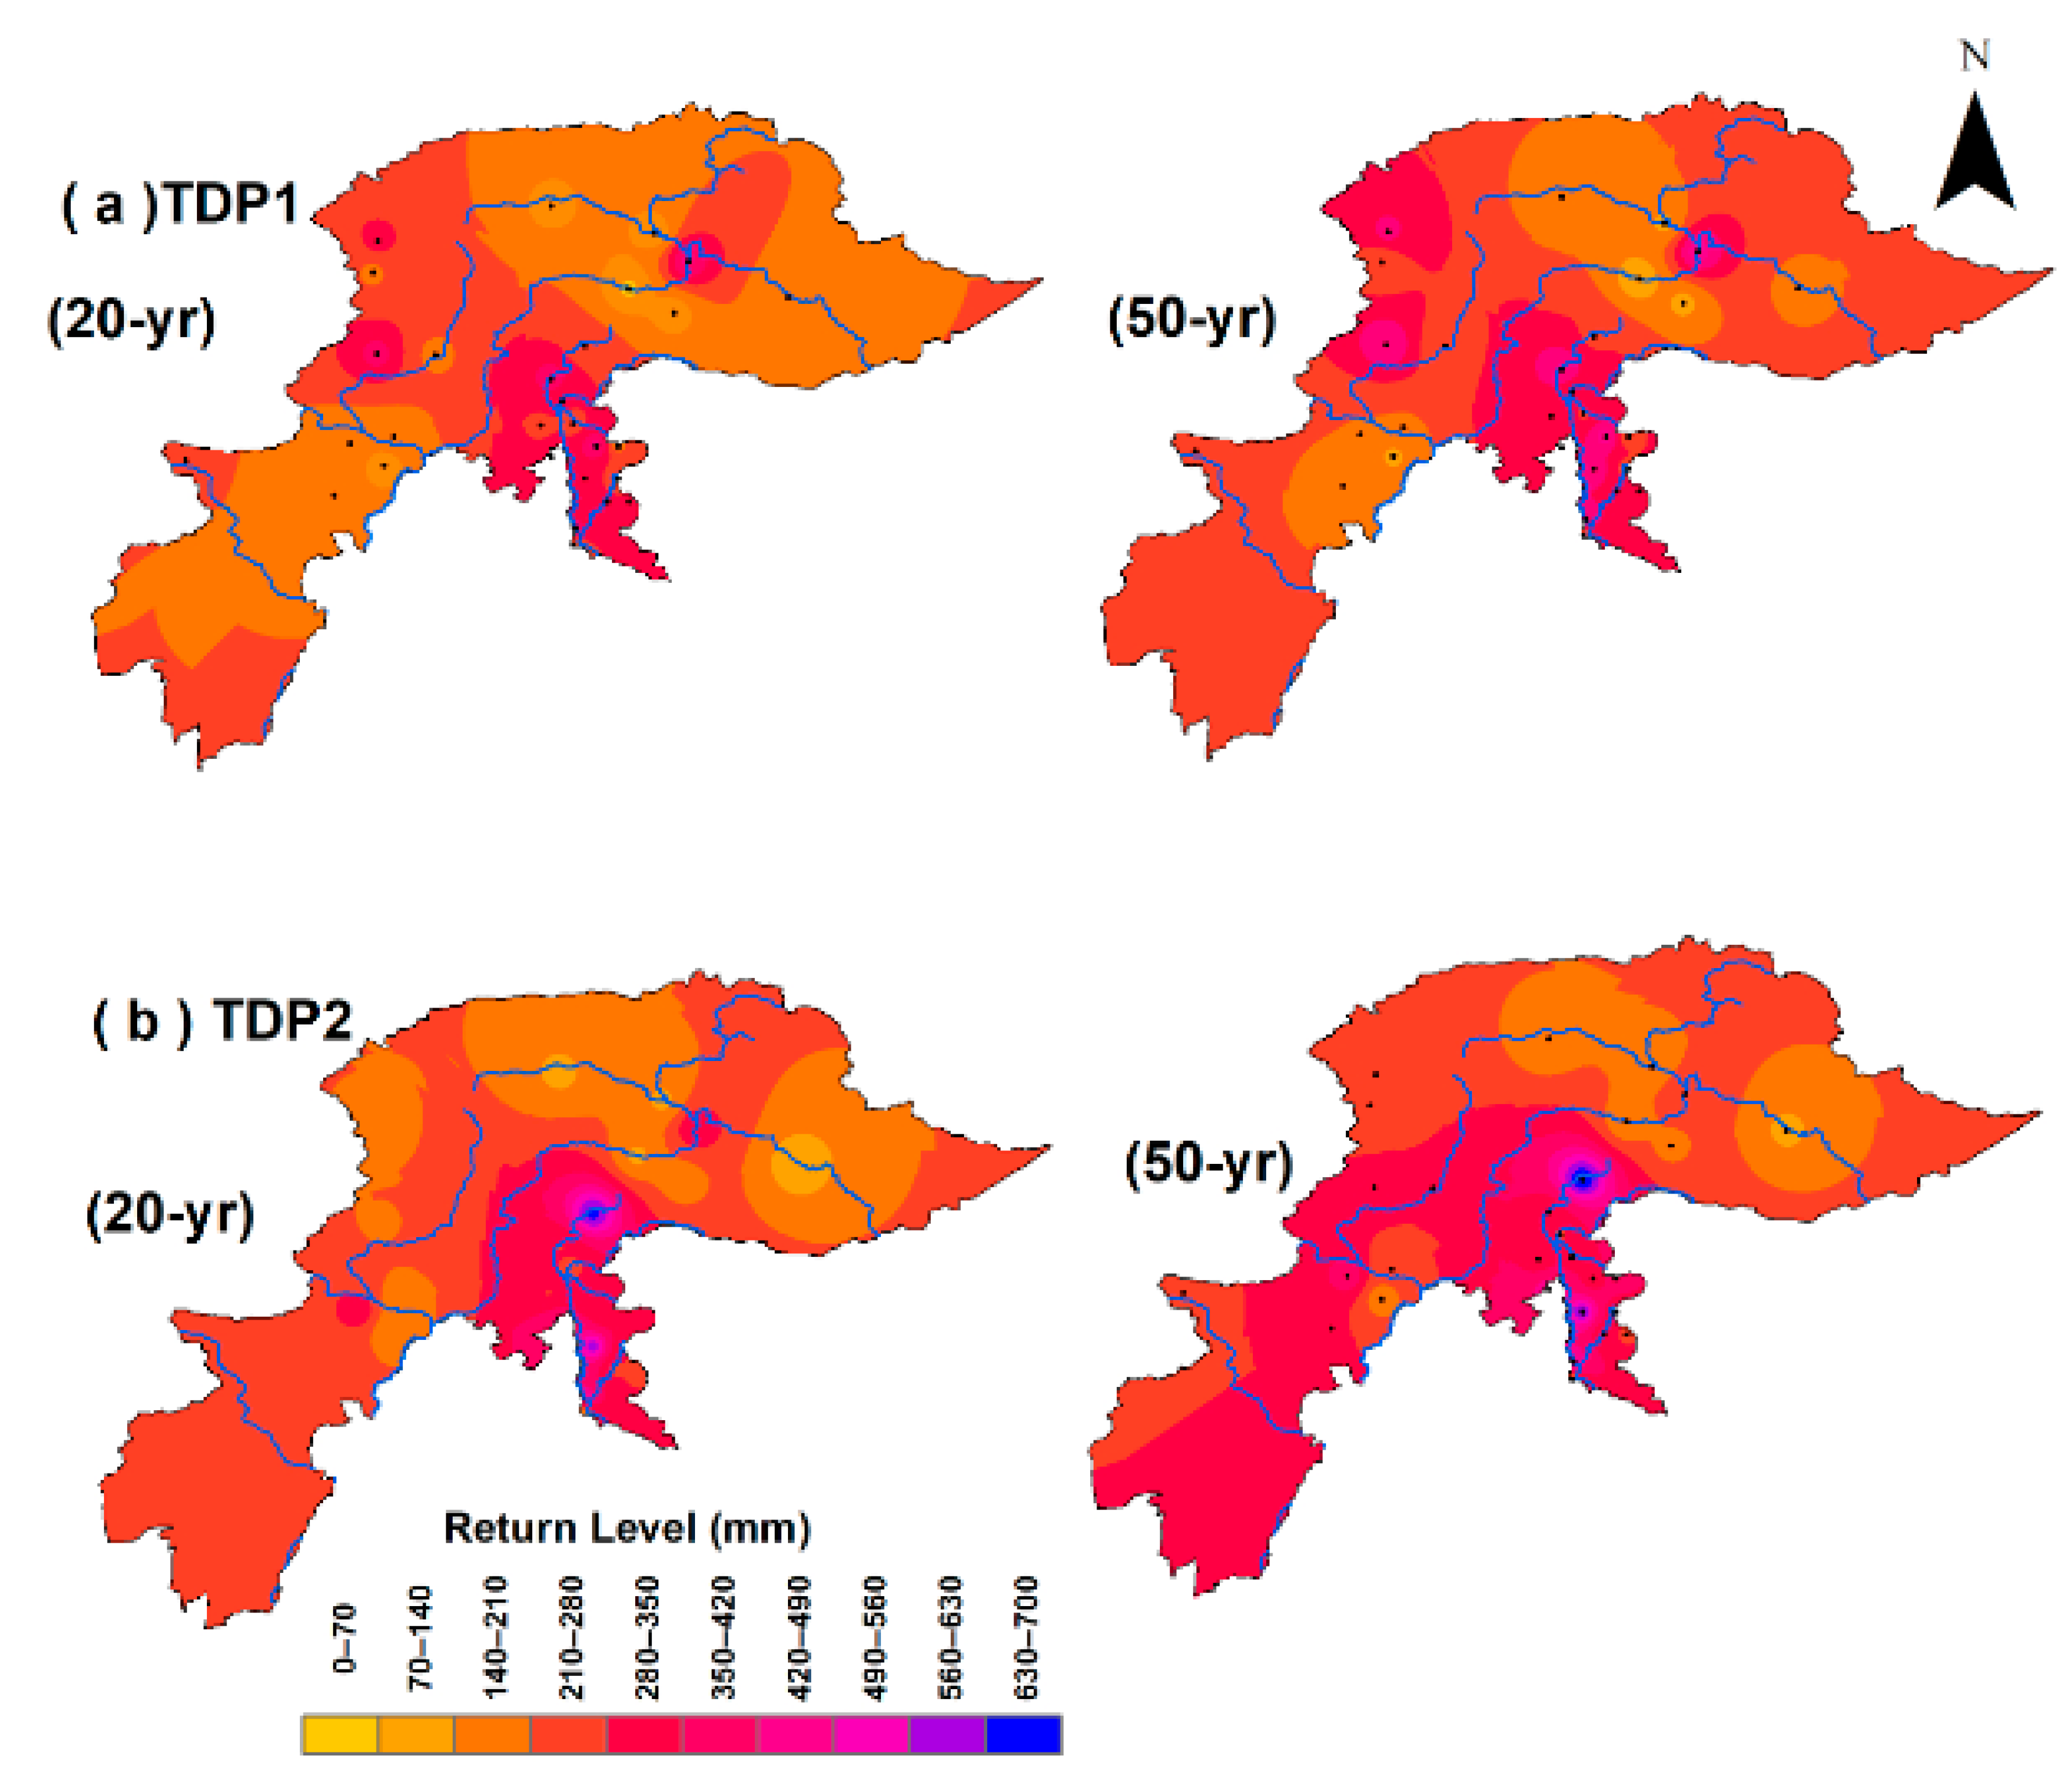
- For return level, the 20 and 50-year return levels of TDP1 show maximum values (210–350 mm) in the Chitral, Panjkora and Jhelum River basins whilst TDP2 presents maximum values (up to 700 mm) of return level in the eastern part of the NHPK for 20-year, and eastern and southwest for 50-year, respectively.
Supplementary Materials
Author Contributions
Funding
Conflicts of Interest
Appendix A
| Station No. | Name | Longitude | Latitude |
|---|---|---|---|
| 1 | ASTORE | 74.50 | 35.20 |
| 2 | Bagh | 73.80 | 34.00 |
| 3 | B-KOT | 73.40 | 34.60 |
| 4 | BUNJI | 74.63 | 35.67 |
| 5 | CHILAS | 74.10 | 35.42 |
| 6 | CHERAT | 71.88 | 33.82 |
| 7 | CHITAL | 71.83 | 35.85 |
| 8 | DIR | 71.82 | 34.83 |
| 9 | DROSH | 71.78 | 35.57 |
| 10 | G-DOPATA | 73.60 | 34.20 |
| 11 | G-KHAN | 73.62 | 33.25 |
| 12 | GILGIT | 74.33 | 35.92 |
| 13 | GUPIS | 73.40 | 36.17 |
| 14 | KAKUL | 73.30 | 34.18 |
| 15 | KHANDAR | 74.10 | 33.50 |
| 16 | KOHAT | 71.43 | 33.55 |
| 17 | KOTLI | 73.90 | 33.50 |
| 18 | MANGLA | 73.60 | 33.10 |
| 19 | MURREE | 73.40 | 33.90 |
| 20 | M-ABAD | 73.50 | 34.40 |
| 21 | NARAN | 73.70 | 34.90 |
| 22 | P-CHINAR | 70.09 | 33.87 |
| 23 | PESHWAR | 71.58 | 34.02 |
| 24 | PLANDRI | 73.70 | 33.70 |
| 25 | R-KOT | 74.00 | 34.00 |
| 26 | R-PUR | 71.97 | 34.08 |
| 27 | S-KOKATA | 74.00 | 33.70 |
| 28 | S-SHARIF | 72.35 | 34.82 |
| 29 | SKARDU | 75.54 | 35.34 |
| 30 | D.I.Khan | 70.90 | 31.81 |
References
- IPCC. Climate Change 2014: Synthesis Report; IPCC: Geneva, Switzerland, 2014; p. 151. [Google Scholar]
- Donat, M.G.; Lowry, A.L.; Alexander, L.V.; O’Gorman, P.A.; Maher, N. Addendum: More extreme precipitation in the world’s dry and wet regions. Nat. Clim. Chang. 2017, 7, 154–158. [Google Scholar] [CrossRef] [Green Version]
- Fischer, E.M.; Knutti, R. Observed heavy precipitation increase confirms theory and early models. Nat. Clim. Chang. 2016, 6, 986–991. [Google Scholar] [CrossRef]
- Prein, A.F.; Rasmussen, R.M.; Ikeda, K.; Liu, C.; Clark, M.P.; Holland, G.J. The future intensification of hourly precipitation extremes. Nat. Clim. Chang. 2017, 7, 48–52. [Google Scholar] [CrossRef]
- Donat, M.G.; Lowry, A.L.; Alexander, L.V. More extreme precipitation in the world’s dry and wet regions. Nat. Clim. Chang. 2016, 6, 508–513. [Google Scholar] [CrossRef]
- Wang, G.; Wang, D.; Trenberth, K.; Erfanian, A.; Yu, M.; Bosilovich, M.G.; Parr, D.T. The peak structure and future changes of the relationships between extreme precipitation and temperature. Nat. Clim. Chang. 2017, 7, 268–274. [Google Scholar] [CrossRef]
- Kendon, E.J.; Roberts, N.M.; Fowler, H.J.; Roberts, M.J.; Chan, S.C.; Senior, C.A. Heavier summer downpours with climate change revealed by weather forecast resolution model. Nat. Clim. Chang. 2014, 4, 570–576. [Google Scholar] [CrossRef] [Green Version]
- Capello, M.; Cutroneo, L.; Ferretti, G.; Gallino, S.; Canepa, G. Changes in the physical characteristics of the water column at the mouth of a torrent during an extreme rainfall event. J. Hydrol. 2016, 541, 146–157. [Google Scholar] [CrossRef]
- Zhang, X.; Zwiers, F.; Li, G.; Wan, H.; Cannon, A.J. Complexity in estimating past and future extreme short-duration rainfall. Nat. Geosci. 2017, 10, 255–259. [Google Scholar] [CrossRef]
- Easterling, D.R.; Evans, J.L.; Groisman, P.Y.; Karl, T.R.; Kunkel, K.E.; Ambenje, P. Observed Variability and Trends in Extreme Climate Events: A Brief Review*. Bull. Am. Meteorol. Soc. 2000, 81, 417–425. [Google Scholar] [CrossRef] [Green Version]
- Hundecha, Y.; Bárdossy, A. Trends in daily precipitation and temperature extremes across western Germany in the second half of the 20th century. Int. J. Clim. 2005, 25, 1189–1202. [Google Scholar] [CrossRef]
- Alexander, L.V.; Zhang, X.; Peterson, T.C.; Caesar, J.; Gleason, B.; Tank, A.M.G.K.; Haylock, M.; Collins, D.; Trewin, B.; Rahimzadeh, F.; et al. Global observed changes in daily climate extremes of temperature and precipitation. J. Geophys. Res. Space Phys. 2006, 111, 05109. [Google Scholar] [CrossRef] [Green Version]
- Moberg, A.; Jones, P.D.; Lister, D.; Walther, A.; Brunet, M.; Jacobeit, J.; Alexander, L.V.; Della-Marta, P.M.; Luterbacher, J.; Yiou, P.; et al. Indices for daily temperature and precipitation extremes in Europe analyzed for the period 1901–2000. J. Geophys. Res. Space Phys. 2006, 111, D22. [Google Scholar] [CrossRef] [Green Version]
- Ramos, M.C.; Martínez-Casasnovas, J.A. Trends in Precipitation Concentration and Extremes in the Mediterranean Penedès-Anoia Region, Ne Spain. Clim. Chang. 2006, 74, 457–474. [Google Scholar] [CrossRef]
- Bartholy, J.; Pongracz, R. Regional analysis of extreme temperature and precipitation indices for the Carpathian Basin from 1946 to 2001. Glob. Planet. Chang. 2007, 57, 83–95. [Google Scholar] [CrossRef]
- Choi, G.; Collins, D.; Ren, G.; Trewin, B.; Baldi, M.; Fukuda, Y.; Afzaal, M.; Pianmana, T.; Gomboluudev, P.; Huong, P.T.T.; et al. Changes in means and extreme events of temperature and precipitation in the Asia-Pacific Network region, 1955–2007. Int. J. Clim. 2009, 29, 1906–1925. [Google Scholar] [CrossRef]
- Costa, A.C.; Soares, A. Trends in extreme precipitation indices derived from a daily rainfall database for the South of Portugal. Int. J. Climatol. 2009, 29, 1956–1975. [Google Scholar] [CrossRef]
- Kioutsioukis, I.; Melas, D.; Zerefos, C. Statistical assessment of changes in climate extremes over Greece (1955–2002). Int. J. Climatol. 2010, 30, 1723–1737. [Google Scholar] [CrossRef]
- López-Moreno, J.I.; Serrano, S.M.V.; Angulo-Martínez, M.; Beguería, S.; El Kenawy, A.M. Trends in daily precipitation on the northeastern Iberian Peninsula, 1955–2006. Int. J. Climatol. 2010, 30, 1026–1041. [Google Scholar] [CrossRef] [Green Version]
- Fan, X.; Wang, Q.; Wang, M. Changes in temperature and precipitation extremes during 1959–2008 in Shanxi, China. Theor. Appl. Climatol. 2012, 109, 283–303. [Google Scholar] [CrossRef]
- WAPDA. Lower Indus Report, Physical Resources-Groundwater; WAPDA: Lahore, Pakistan, 1965. [Google Scholar]
- Ahmad, I.; Zhang, F.; Tayyab, M.; Anjum, M.N.; Zaman, M.; Liu, J.; Farid, H.U.; Saddique, Q. Spatiotemporal analysis of precipitation variability in annual, seasonal and extreme values over upper Indus River basin. Atmos. Res. 2018, 213, 346–360. [Google Scholar] [CrossRef]
- Hasson, S.U.; Böhner, J.; Lucarini, V. Prevailing climatic trends and runoff response from Hindukush–Karakoram–Himalaya, upper Indus Basin. Earth Syst. Dyn. 2017, 8, 337–355. [Google Scholar] [CrossRef] [Green Version]
- Tank, A.M.G.K.; Peterson, T.C.; Quadir, D.A.; Dorji, S.; Zou, X.; Tang, H.; Santhosh, K.; Joshi, U.R.; Jaswal, A.K.; Kolli, R.K.; et al. Changes in daily temperature and precipitation extremes in central and south Asia. J. Geophys. Res. Space Phys. 2006, 111, 16105. [Google Scholar] [CrossRef]
- White, R.H.; Battisti, D.S.; Skok, G. Tracking precipitation events in time and space in gridded observational data. Geophys. Res. Lett. 2017, 44, 8637–8646. [Google Scholar] [CrossRef]
- Wu, X.; Guo, S.; Yin, J.; Yang, G.; Zhong, Y.; Liu, D. On the event-based extreme precipitation across China: Time distribution patterns, trends, and return levels. J. Hydrol. 2018, 562, 305–317. [Google Scholar] [CrossRef]
- Xu, W.; Zipser, E.J.; Chen, Y.-L.; Liu, C.; Liou, Y.-C.; Lee, W.-C.; Jou, B.J.-D. An Orography-Associated Extreme Rainfall Event during TiMREX: Initiation, Storm Evolution, and Maintenance. Mon. Weather. Rev. 2012, 140, 2555–2574. [Google Scholar] [CrossRef] [Green Version]
- Hitchens, N.M.; Brooks, H.E.; Schumacher, R.S. Spatial and Temporal Characteristics of Heavy Hourly Rainfall in the United States. Mon. Weather. Rev. 2013, 141, 4564–4575. [Google Scholar] [CrossRef]
- Wentz, F.; Ricciardulli, L.; Hilburn, K. Science CM-, 2007 U. How much more rain will global warming bring? Science (80-) 2007, 317, 233–235. [Google Scholar] [CrossRef]
- Min, S.-K.; Zhang, X.; Zwiers, F.W.; Hegerl, G.C. Human contribution to more-intense precipitation extremes. Nature 2011, 470, 378–381. [Google Scholar] [CrossRef]
- Vittal, H.; Karmakar, S.; Ghosh, S. Diametric changes in trends and patterns of extreme rainfall over India from pre-1950 to post-1950. Geophys. Res. Lett. 2013, 40, 3253–3258. [Google Scholar] [CrossRef]
- Ma, S.; Zhou, T.; Dai, A.; Han, Z. Observed Changes in the Distributions of Daily Precipitation Frequency and Amount over China from 1960 to 2013. J. Clim. 2015, 28, 6960–6978. [Google Scholar] [CrossRef]
- Xiao, C.; Wu, P.; Zhang, L.; Song, L. Robust increase in extreme summer rainfall intensity during the past four decades observed in China. Sci. Rep. 2016, 6, 38506. [Google Scholar] [CrossRef] [PubMed] [Green Version]
- Hamidreza, M.; Hasan, A.; Mohammad, J.; Mohammadreza, B.; Salajegheh, A. Study of the Temporal Distribution Pattern of Rainfall Effect on Runoff and Sediment Generation Using Rain Simulator (Case Study: Alvand Basin). 2010. Available online: https://www.researchgate.net/publication/267713351 (accessed on 7 August 2018).
- Lu, E.; Zhao, W.; Zou, X.; Ye, D.; Zhao, C.; Zhang, Q. Temporal–Spatial Monitoring of an Extreme Precipitation Event: Determining Simultaneously the Time Period It Lasts and the Geographic Region It Affects. J. Clim. 2017, 30, 6123–6132. [Google Scholar] [CrossRef]
- Wang, W.-C.; Gong, W.; Wei, H.; Wang, W.-C.; Gong, W.; Wei, H. A Regional Model Simulation of the 1991 Severe Precipitation Event over the Yangtze–Huai River Valley. Part I: Precipitation and Circulation Statistics. J. Clim. 2000, 13, 74–92. [Google Scholar] [CrossRef]
- Tao, S. Severe Floods in the Yangtze and Huaihe River Basins in the Mei-yu Period, 1991; World Scientific Publishing Co.: Singapore, 1993; p. 46. [Google Scholar]
- Lu, E.; Ding, Y. Analysis of summer monsoon activity during the 1991 excessively torrential rain over the Changjiang-Huaihe River valley. J. Appl. Meteor. 1997, 8, 316–324. [Google Scholar]
- Lu, E.; Zhao, W.; Gong, L.; Chen, H.; Wang, H.; Li, X.; Song, J.; Tu, J.; Higgins, R.W.; Halpert, M.S. Determining starting time and duration of extreme precipitation events based on intensity. Clim. Res. 2015, 63, 31–41. [Google Scholar] [CrossRef]
- She, D.; Shao, Q.; Xia, J.; Taylor, J.A.; Zhang, Y.; Zhang, L.; Zhang, X.; Zou, L. Investigating the variation and non-stationarity in precipitation extremes based on the concept of event-based extreme precipitation. J. Hydrol. 2015, 530, 785–798. [Google Scholar] [CrossRef]
- Goswami, B.N.; Venugopal, V.; Sengupta, D.; Madhusoodanan, M.S.; Xavier, P.K. Increasing Trend of Extreme Rain Events Over India in a Warming Environment. Science 2006, 314, 1442–1445. [Google Scholar] [CrossRef] [Green Version]
- You, Q.; Kang, S.; Aguilar, E.; Pepin, N.; Flügel, W.-A.; Yan, Y.; Xu, Y.; Zhang, Y.; Huang, J. Changes in daily climate extremes in China and their connection to the large scale atmospheric circulation during 1961–2003. Clim. Dyn. 2011, 36, 2399–2417. [Google Scholar] [CrossRef]
- Madsen, H.; Lawrence, D.; Lang, M.; Martinkova, M.; Kjeldsen, T.R. Review of trend analysis and climate change projections of extreme precipitation and floods in Europe. J. Hydrol. 2014, 519, 3634–3650. [Google Scholar] [CrossRef] [Green Version]
- Ghassabi, Z.; Kamali, G.A.; Meshkatee, A.H.; Hajam, S.; Javaheri, N.; Meshkati, A. Time distribution of heavy rainfall events in south west of Iran. J. Atmos. Solar-Terr. Phys. 2016, 145, 53–60. [Google Scholar] [CrossRef]
- Zhao, Z.; Leung, L.; Qian, Y. Characteristics of Diurnal Variations of Rainfall in China for the Recent Years. 2005. Available online: https://www.osti.gov/biblio/876958 (accessed on 7 August 2018).
- Huffman, G.J.; Bolvin, D.T.; Nelkin, E.J.; Wolff, D.B.; Adler, R.F.; Gu, G.; Hong, Y.; Bowman, K.P.; Stocker, E.F. The TRMM Multisatellite Precipitation Analysis (TMPA): Quasi-Global, Multiyear, Combined-Sensor Precipitation Estimates at Fine Scales. J. Hydrometeorol. 2007, 8, 38–55. [Google Scholar] [CrossRef]
- Bonta, J.V. Development and Utility of Huff Curves for Disaggregating Precipitation Amounts. Appl. Eng. Agric. 2004, 20, 641–653. [Google Scholar] [CrossRef]
- Trier, S.B.; Davis, C.A.; Carbone, R.E. Mechanisms Governing the Persistence and Diurnal Cycle of a Heavy Rainfall Corridor. J. Atmos. Sci. 2014, 71, 4102–4126. [Google Scholar] [CrossRef]
- Zuluaga, M.D.; Houze, R.A. Extreme Convection of the Near-Equatorial Americas, Africa, and Adjoining Oceans as seen by TRMM. Mon. Weather. Rev. 2015, 143, 298–316. [Google Scholar] [CrossRef] [Green Version]
- Wu, X.; Guo, S.; Liu, D.; Hong, X.; Liu, Z.; Liu, P.; Chen, H. Characterization of rainstorm modes along the upper mainstream of Yangtze River during 2003–2016. Int. J. Clim. 2018, 38, 1976–1988. [Google Scholar] [CrossRef]
- Hu, H.; Duan, Y.; Wang, Y.; Zhang, X. Diurnal Cycle of Rainfall Associated with Landfalling Tropical Cyclones in China from Rain Gauge Observations. J. Appl. Meteorol. Climatol. 2017, 56, 2595–2605. [Google Scholar] [CrossRef]
- Chen, Z.; Yin, L.; Chen, X.; Wei, S.; Zhu, Z. Research on the characteristics of urban rainstorm pattern in the humid area of Southern China: A case study of Guangzhou City. Int. J. Climatol. 2015, 35, 4370–4386. [Google Scholar] [CrossRef]
- Yao, C.; Yang, S.; Qian, W.; Lin, Z.; Wen, M. Regional summer precipitation events in Asia and their changes in the past decades. J. Geophys. Res. Space Phys. 2008, 113, 17107. [Google Scholar] [CrossRef] [Green Version]
- Hartmann, H.; Buchanan, H. Trends in Extreme Precipitation Events in the Indus River Basin and Flooding in Pakistan. Atmos.-Ocean 2013, 52, 77–91. [Google Scholar] [CrossRef]
- Wolf, A.T.; Natharius, J.A.; Danielson, J.J.; Ward, B.S.; Pender, J.K. International River Basins of the World. Int. J. Water Resour. Dev. 1999, 15, 387–427. [Google Scholar] [CrossRef]
- Jain, K.S.; Agarwal, P.K.; Singh, V.P. Hydrology and Water Resources of India; Springer Science & Business Media: Dordrecht, The Netherlands, 2007; Volume 57. [Google Scholar]
- Immerzeel, W.; Bierkens, M. Asia’s water balance. Nat. Geosci. 2012, 5, 841–842. Available online: https://scholar.google.co.uk/scholar?hl=en&as_sdt=0%2C5&q=Immerzeel%2C+W.W.%2C+Bierkens%2C+M.F.P.%2C+2012.+Asia%27s+water+balance.+Nat.+Geosci.+5%2C+841–842&btnG= (accessed on 7 August 2018). [CrossRef]
- Khalid, S.; Qasim, M.; Farhan, D. Hydro-meteorological characteristics of Indus River Basin at extreme north of Pakistan. J. Earth Sci. Clim. Chang. 2013, 5, 170. [Google Scholar] [CrossRef]
- Hasson, S.U.; Lucarini, V.; Khan, M.R.; Petitta, M.; Bolch, T.; Gioli, G. Early 21st century snow cover state over the western river basins of the Indus River system. Hydrol. Earth Syst. Sci. 2014, 18, 4077–4100. [Google Scholar] [CrossRef] [Green Version]
- Lutz, A.; Immerzeel, W.W.; Kraaijenbrink, P.D.A.; Shrestha, A.B.; Bierkens, M.F.P. Climate Change Impacts on the Upper Indus Hydrology: Sources, Shifts and Extremes. PLoS ONE 2016, 11, e0165630. [Google Scholar] [CrossRef] [PubMed] [Green Version]
- Houze, R.A.; Rasmussen, K.L.; Medina, S.; Brodzik, S.R.; Romatschke, U. Anomalous Atmospheric Events Leading to the Summer 2010 Floods in Pakistan. Bull. Am. Meteorol. Soc. 2011, 92, 291–298. [Google Scholar] [CrossRef]
- Dahri, Z.H.; Ludwig, F.; Moors, E.; Ahmad, B.; Khan, A.; Kabat, P. An appraisal of precipitation distribution in the high-altitude catchments of the Indus basin. Sci. Total Environ. 2016, 548–549, 289–306. [Google Scholar] [CrossRef] [PubMed] [Green Version]
- FAO. Food and Agriculture Organization of the United Nations. In FAO Statistical Yearbook (2012); FAO: Rome, Italy, 2012. [Google Scholar]
- Latif, Y.; YaoMing, M.; Yaseen, M. Spatial analysis of precipitation time series over the Upper Indus Basin. Theor. Appl. Clim. 2018, 131, 761–775. [Google Scholar] [CrossRef] [Green Version]
- Zhang, X.; Yang, F. RClimDex (1.0) User Manual; Climate Research Branch Environment: Downsview, ON, Canada, 2004; Available online: http://about-c3s-dr.eu/pages/workshop_tools/RClimDexUserManual.pdf (accessed on 7 August 2018).
- Mei, C.; Liu, J.; Chen, M.-T.; Wang, H.; Li, M.; Yu, Y. Multi-decadal spatial and temporal changes of extreme precipitation patterns in northern China (Jing-Jin-Ji district, 1960–2013). Quat. Int. 2018, 476, 1–13. [Google Scholar] [CrossRef]
- Zhang, X.; Alexander, L.V.; Hegerl, G.C.; Jones, P.; Tank, A.K.; Peterson, T.C.; Trewin, B.; Zwiers, F.W. Indices for monitoring changes in extremes based on daily temperature and precipitation data. Wiley Interdiscip. Rev. Clim. Chang. 2011, 2, 851–870. [Google Scholar] [CrossRef]
- Gao, T.; Xie, L. Spatiotemporal changes in precipitation extremes over Yangtze River basin, China, considering the rainfall shift in the late 1970s. Glob. Planet. Chang. 2016, 147, 106–124. [Google Scholar] [CrossRef]
- Limsakul, A.; Singhruck, P. Long-term trends and variability of total and extreme precipitation in Thailand. Atmos. Res. 2016, 169, 301–317. [Google Scholar] [CrossRef]
- Croitoru, A.-E.; Piticar, A.; Burada, D.C. Changes in precipitation extremes in Romania. Quat. Int. 2016, 415, 325–335. [Google Scholar] [CrossRef]
- Sun, W.; Mu, X.; Song, X.; Wu, D.; Cheng, A.; Qiu, B. Changes in extreme temperature and precipitation events in the Loess Plateau (China) during 1960–2013 under global warming. Atmos. Res. 2016, 168, 33–48. [Google Scholar] [CrossRef]
- Tian, J.; Liu, J.; Wang, J.; Li, C.; Nie, H.; Yu, F. Trend analysis of temperature and precipitation extremes in major grain producing area of China. Int. J. Clim. 2017, 37, 672–687. [Google Scholar] [CrossRef]
- AlSarmi, S.H.; Washington, R. Changes in climate extremes in the Arabian Peninsula: Analysis of daily data. Int. J. Clim. 2013, 34, 1329–1345. [Google Scholar] [CrossRef]
- Croitoru, A.-E.; Chiotoroiu, B.-C.; Todorova, V.I.; Torică, V. Changes in precipitation extremes on the Black Sea Western Coast. Glob. Planet. Chang. 2013, 102, 10–19. [Google Scholar] [CrossRef]
- Shi, H.; Li, T.; Wei, J.; Fu, W.; Wang, G. Spatial and temporal characteristics of precipitation over the Three-River Headwaters region during 1961–2014. J. Hydrol. Reg. Stud. 2016, 6, 52–65. [Google Scholar] [CrossRef] [Green Version]
- Mann, H.B. Nonparametric Tests Against Trend. Econometrica 1945, 13, 245. [Google Scholar] [CrossRef]
- Kendall, M. Rank Correlation Measures. Charles Griffin. 1975. Available online: https://scholar.google.co.jp/scholar?q=Kendall%2C+M.+G.+1975.+Rank+Correlation+Measures.+Charles+Griffin%2C+London.&btnG=&hl=en&as_sdt=0%2C5 (accessed on 24 June 2017).
- Von Storch, H. Spatial patterns: EOFs and CCA. In Analysis of Climate Variability; Springer: Berlin/Heidelberg, Germany, 1995. [Google Scholar]
- Oueslati, B.; Camberlin, P.; Zoungrana, J.; Roucou, P.; Diallo, S. Variability and trends of wet season temperature in the Sudano-Sahelian zone and relationships with precipitation. Clim. Dyn. 2017, 50, 1067–1090. [Google Scholar] [CrossRef]
- Guo, X.; Wu, Z.; He, H.; Du, H.; Wang, L.; Yang, Y.; Zhao, W. Variations in the start, end, and length of extreme precipitation period across China. Int. J. Clim. 2018, 38, 2423–2434. [Google Scholar] [CrossRef]
- Gemmer, M.; Fischer, T.; Jiang, T.; Su, B.; Liu, L.L.; Gemmer, M. Trends in Precipitation Extremes in the Zhujiang River Basin, South China. J. Clim. 2011, 24, 750–761. [Google Scholar] [CrossRef]
- Lenderink, G.; Van Meijgaard, E. Increase in hourly precipitation extremes beyond expectations from temperature changes. Nat. Geosci. 2008, 1, 511–514. [Google Scholar] [CrossRef]
- Lieting, C.; Renguang, W. Interannual and decadal variations of snow cover over Qinghai-Xizang Plateau and their relationships to summer monsoon rainfall in China. Adv. Atmos. Sci. 2000, 17, 18–30. [Google Scholar] [CrossRef]
- Wu, X.; Wang, Z.; Zhou, X.; Lai, C.; Lin, W.; Chen, X. Observed changes in precipitation extremes across 11 basins in China during 1961–2013. Int. J. Clim. 2015, 36, 2866–2885. [Google Scholar] [CrossRef]
- Keifer, C.D.; Chu, H. Synthetic Storm Pattern for Drainage Design. 1957. Available online: http://cedb.asce.org/CEDBsearch/record.jsp?dockey=0010917 (accessed on 13 August 2018).
- Yen, B.; Chow, V. Design hyetographs for small drainage structures. J. Hydraul. Div. 1980. Available online: https://trid.trb.org/view/154722 (accessed on 13 August 2018).
- Huff, F. Time distributions of heavy rainstorms in Illinois. Circular. 1990. Available online: https://www.ideals.illinois.edu/bitstream/handle/2142/94492/ISWSC-173.pdf?sequence=1 (accessed on 13 August 2018).
- Zhang, X.C.; Norton, L.D.; Hickman, M. Rain Pattern and Soil Moisture Content Effects on Atrazine and Metolachlor Losses in Runoff. J. Environ. Qual. 1997, 26, 1539–1547. [Google Scholar] [CrossRef]
- Azli, M.; Rao, A.R. Development of Huff curves for Peninsular Malaysia. J. Hydrol. 2010, 388, 77–84. [Google Scholar] [CrossRef]
- Amin, M.T.; Rizwan, M.; Alazba, A.A. A best-fit probability distribution for the estimation of rainfall in northern regions of Pakistan. Open Life Sci. 2016, 11, 432–440. [Google Scholar] [CrossRef]
- Cunnane, C. A particular comparison of annual maxima and partial duration series methods of flood frequency prediction. J. Hydrol. 1973, 18, 257–271. [Google Scholar] [CrossRef]
- Stedinger, J.R.; Lu, L.-H. Appraisal of regional and index flood quantile estimators. Stoch. Environ. Res. Risk Assess. 1995, 9, 49–75. [Google Scholar] [CrossRef]
- Coles, S. An Introduction to Statistical Modeling of Extreme Values; Springer: Berlin/Heidelberg, Germany, 2001. [Google Scholar]
- Katz, R.; Parlange, M. Resources PN-A in water, 2002 undefined. Statistics of extremes in hydrology. Adv. Water Resour. 2002, 25, 1287–1304. [Google Scholar] [CrossRef] [Green Version]
- Abida, H.; Ellouze, M. Hydrology and Earth System Sciences Discussions. Eur. Geosci. Union. 2007. Available online: https://hal.archives-ouvertes.fr/hal-00298830 (accessed on 7 August 2018).
- Feng, S.; Nadarajah, S.; Hu, Q. Modeling Annual Extreme Precipitation in China Using the Generalized Extreme Value Distribution. J. Meteorol. Soc. Jpn. 2007, 85, 599–613. [Google Scholar] [CrossRef] [Green Version]
- Yang, T.; Shao, Q.; Hao, Z.; Chen, X.; Zhang, Z.; Xu, C.-Y.; Sun, L. Regional frequency analysis and spatio-temporal pattern characterization of rainfall extremes in the Pearl River Basin, China. J. Hydrol. 2010, 380, 386–405. [Google Scholar] [CrossRef]
- Villarini, G.; Smith, J.A.; Baeck, M.L.; Vitolo, R.; Stephenson, D.B.; Krajewski, W.F. On the frequency of heavy rainfall for the Midwest of the United States. J. Hydrol. 2011, 400, 103–120. [Google Scholar] [CrossRef]
- Zakaria, Z.A.; Shabri, A.; Ahmad, U.N. Regional Frequency Analysis of Extreme Rainfalls in the West Coast of Peninsular Malaysia using Partial L-Moments. Water Resour. Manag. 2012, 26, 4417–4433. [Google Scholar] [CrossRef]
- She, D.; Xia, J.; Song, J.; Du, H.; Chen, J.; Wan, L. Spatio-temporal variation and statistical characteristic of extreme dry spell in Yellow River Basin, China. Theor. Appl. Clim. 2013, 112, 201–213. [Google Scholar] [CrossRef]
- Madsen, H.; Pearson, C.P.; Rosbjerg, D. Comparison of annual maximum series and partial duration series methods for modeling extreme hydrologic events: 2. Regional modeling. Water Resour. Res. 1997, 33, 759–769. [Google Scholar] [CrossRef]
- Madsen, H.; Rasmussen, P.F.; Rosbjerg, D. Comparison of annual maximum series and partial duration series methods for modeling extreme hydrologic events: 1. At-site modeling. Water Resour. Res. 1997, 33, 747–757. [Google Scholar] [CrossRef]
- Pickands, J. Statistical Inference Using Extreme Order Statistics on JSTOR. Ann. Stat. 1975, 3, 119–131. [Google Scholar]
- Yilmaz, A.G.; Imteaz, M.A.; Perera, B.J.C. Investigation of non-stationarity of extreme rainfalls and spatial variability of rainfall intensity-frequency-duration relationships: A case study of Victoria, Australia. Int. J. Clim. 2017, 37, 430–442. [Google Scholar] [CrossRef]
- Marra, F.; Morin, E.; Peleg, N.; Mei, Y.; Anagnostou, E.N. Intensity–duration–frequency curves from remote sensing rainfall estimates: Comparing satellite and weather radar over the eastern Mediterranean. Hydrol. Earth Syst. Sci. 2017, 21, 2389–2404. [Google Scholar] [CrossRef] [Green Version]
- Lang, M.; Ouarda, T.; Bobée, B. Towards operational guidelines for over-threshold modeling. J. Hydrol. 1999, 225, 103–117. [Google Scholar] [CrossRef]
- Pasarić, Z.; Cindrić, K. Generalised Pareto distribution: Impact of rounding on parameter estimation. Theor. Appl. Clim. 2019, 136, 417–427. [Google Scholar] [CrossRef]
- Xia, J.; Du, H.; Zeng, S.; She, D.; Zhang, Y.; Yan, Z.; Ye, Y. Temporal and spatial variations and statistical models of extreme runoff in Huaihe River Basin during 1956–2010. J. Geogr. Sci. 2012, 22, 1045–1060. [Google Scholar] [CrossRef]
- Li, Z.; Li, C.; Xu, Z.; Zhou, X. Frequency analysis of precipitation extremes in Heihe River basin based on generalized Pareto distribution. Stoch. Environ. Res. Risk Assess. 2014, 28, 1709–1721. [Google Scholar] [CrossRef]
- Hosseinzadehtalaei, P.; Tabari, H.; Willems, P. Climate change impact on short-duration extreme precipitation and intensity–duration–frequency curves over Europe. J. Hydrol. 2020, 590, 125249. [Google Scholar] [CrossRef]
- Langousis, A.; Mamalakis, A.; Puliga, M.; Deidda, R. Threshold detection for the generalized Pareto distribution: Review of representative methods and application to the NOAA NCDC daily rainfall database. Water Resour. Res. 2016, 52, 2659–2681. [Google Scholar] [CrossRef] [Green Version]
- Hosking, J. L-Moments: Analysis and Estimation of Distributions Using Linear Combinations of Order Statistics on JSTOR. J. R. Stat. Soc. Ser. B. 1990, 52, 105–124. [Google Scholar] [CrossRef]
- Hosking, J.; Wallis, J. Regional Frequency Analysis: An Approach Based on L-Moments. UK. 1997. Available online: https://books.google.com/books?hl=en&lr=&id=gurAnfB4nvUC&oi=fnd&pg=PP1&ots=7Tb-5zt9I-&sig=yhUtpDvIF5MViWg8_ugP_MAJ0lI (accessed on 7 August 2018).
- Martins, E.S.; Stedinger, J.R. Generalized Maximum Likelihood Pareto-Poisson estimators for partial duration series. Water Resour. Res. 2001, 37, 2551–2557. [Google Scholar] [CrossRef] [Green Version]
- Hosking, J.R.; Wallis, J.R. Parameter and Quantile Estimation for the Generalized Pareto Distribution. Technometrics 1987, 29, 339–349. [Google Scholar] [CrossRef]
- Efron, B. Bootstrap Methods: Another Look at the Jackknife. Ann. Stat. 1979, 7, 1–26. [Google Scholar] [CrossRef]
- Kim, T.-J.; Schnitzlein, W.M.; McAloose, D.; Pessier, A.P.; Tripathy, D.N. Characterization of an avianpox virus isolated from an Andean condor (Vultur gryphus). Vet. Microbiol. 2003, 96, 237–246. [Google Scholar] [CrossRef] [PubMed]
- Griffiths, M.L.; Bradley, R.S. Variations of Twentieth-Century Temperature and Precipitation Extreme Indicators in the Northeast United States. J. Clim. 2007, 20, 5401–5417. [Google Scholar] [CrossRef]
- Naidu, C.; Raju, A.D.; Satyanarayana, G.; Kumar, P.V.; Chiranjeevi, G.; Suchitra, P. An observational evidence of decrease in Indian summer monsoon rainfall in the recent three decades of global warming era. Glob. Planet. Chang. 2015, 127, 91–102. [Google Scholar] [CrossRef]
- Hasson, S.U.; Pascale, S.; Lucarini, V.; Böhner, J. Seasonal cycle of precipitation over major river basins in South and Southeast Asia: A review of the CMIP5 climate models data for present climate and future climate projections. Atmos. Res. 2016, 180, 42–63. [Google Scholar] [CrossRef] [Green Version]
- Hasson, S.U.; Lucarini, V.; Pascale, S.; Böhner, J. Seasonality of the hydrological cycle in major South and Southeast Asian river basins as simulated by PCMDI/CMIP3 experiments. Earth Syst. Dyn. 2014, 5, 67–87. [Google Scholar] [CrossRef] [Green Version]
- Soncini, A.; Bocchiola, D.; Confortola, G.; Bianchi, A.; Rosso, R.; Mayer, C.; Lambrecht, A.; Palazzi, E.; Smiraglia, C.; Diolaiuti, G. Future Hydrological Regimes in the Upper Indus Basin: A Case Study from a High-Altitude Glacierized Catchment. J. Hydrometeorol. 2015, 16, 306–326. [Google Scholar] [CrossRef] [Green Version]
- Rajbhandari, R.; Shrestha, A.B.; Kulkarni, A.; Patwardhan, S.K.; Bajracharya, S.R. Projected changes in climate over the Indus river basin using a high resolution regional climate model (PRECIS). Clim. Dyn. 2014, 44, 339–357. [Google Scholar] [CrossRef] [Green Version]
- Garee, K.; Chen, X.; Bao, A.; Wang, Y.; Meng, F. Hydrological Modeling of the Upper Indus Basin: A Case Study from a High-Altitude Glacierized Catchment Hunza. Water 2017, 9, 17. [Google Scholar] [CrossRef]
- Dunkerley, D. Effects of rainfall intensity fluctuations on infiltration and runoff: Rainfall simulation on dryland soils, Fowlers Gap, Australia. Hydrol. Process. 2012, 26, 2211–2224. [Google Scholar] [CrossRef]
- Wilkinson, G.E. Rainfall Characteristics and Soil Erosion in the Rainforest Area of Western Nigeria. Exp. Agric. 1975, 11, 247–255. [Google Scholar] [CrossRef]
- De Groeve, T.; Kugler, Z.; Brakenridge, G. Near real time flood alerting for the global disaster alert and coordination system. Proc. ISCRAM 2007, 2007, 33–39. [Google Scholar]
- Jabeen, S.; Ashfaq, M.; Baig, A. Linear program modeling for determining the value of irrigation water. J. Agric. Soc. 2006, 2, 101–105. [Google Scholar]
- Ben Daoud, A.; Sauquet, E.; Bontron, G.; Obled, C.; Lang, M. Daily quantitative precipitation forecasts based on the analogue method: Improvements and application to a French large river basin. Atmos. Res. 2016, 169, 147–159. [Google Scholar] [CrossRef] [Green Version]

| Index | Name | Definition | Unit |
|---|---|---|---|
| CDD | Consecutive dry days | Maximum number of consecutive days with RR * < 1 mm | days |
| CWD | Consecutive wet days | Maximum number of consecutive days with RR ≥ 1 mm | days |
| PRCPOT | Annual total wet-day precipitation | Annual total precipitation in wet days, RR ≥ 1 mm | mm |
| R10mm | Number of heavy precipitation days | Annual count of days with RR ≥ 10 mm | days |
| R20mm | Number of very heavy precipitation days | Annual count of days with RR ≥ 20 mm | days |
| R25mm | Number of extremely heavy precipitation days | Annual count of days with RR ≥ 25 mm | days |
| R95p | Very wet days | Annual total precipitation when RR > 95th percentile | mm |
| R99p | Extremely wet days | Annual total precipitation when RR > 99th percentile | mm |
| RX1day | Max 1-day precipitation amount | Monthly maximum 1-day precipitation | mm |
| RX5day | Max 5-day precipitation amount | Monthly maximum consecutive 5-day precipitation | mm |
| SDII | Simple daily intensity index | Annual total precipitation divided by the number of wet days (RR ≥ 1 mm) in a year | mm/day |
| Index | Regional Trends | Positive Trend | Negative Trend | Stationary Trend | ||||
|---|---|---|---|---|---|---|---|---|
| Total | SS | NS | Total | SS | NS | Total | ||
| Fixed Thresholds Indices | ||||||||
| R10m | 0.02 | 10 | 4 | 6 | 20 | 13 | 7 | 0 |
| R20m | 0.01 | 12 | 4 | 8 | 18 | 9 | 9 | 0 |
| R25m | 0 | 12 | 5 | 7 | 17 | 7 | 10 | 1 |
| CDD | −0.01 | 13 | 4 | 9 | 17 | 2 | 15 | 0 |
| CWD | 0.01 | 16 | 4 | 12 | 14 | 6 | 8 | 0 |
| PRCPOT | −0.67 | 13 | 4 | 9 | 16 | 10 | 6 | 0 |
| Station related threshold indices | ||||||||
| R95p | 0.02 | 15 | 3 | 12 | 14 | 6 | 8 | 1 |
| R99p | −0.01 | 16 | 3 | 13 | 14 | 0 | 14 | 0 |
| Non-Threshold Indices | ||||||||
| RX1day | 0.04 | 16 | 4 | 12 | 14 | 3 | 11 | 0 |
| RX5day | 0.12 | 15 | 4 | 11 | 14 | 3 | 11 | 1 |
| SDII | −0.01 | 14 | 5 | 9 | 16 | 6 | 10 | 0 |
| Station No. | Station | % Frequencies | % Volume | ||||||
|---|---|---|---|---|---|---|---|---|---|
| EEP | TDP1 | TDP2 | TDP3 | EEP | TDP1 | TDP2 | TDP3 | ||
| 1 | ASTORE | 12.5 | 36.7 | 43 | 7.8 | 6.7 | 36 | 45.2 | 12 |
| 2 | BAGH | 12 | 35.5 | 41 | 11.4 | 7.5 | 30.7 | 43.6 | 18.2 |
| 3 | B-KOT | 11.9 | 39 | 34.6 | 14.5 | 6.2 | 39.3 | 30.4 | 24.1 |
| 4 | BUNJI | 12 | 44.4 | 36.1 | 7.5 | 5.9 | 47.3 | 33.3 | 13.6 |
| 5 | CHILAS | 50 | 15 | 25 | 10 | 61.7 | 7.4 | 16.7 | 14.1 |
| 6 | CHERAT | 58 | 20 | 18 | 4 | 45.5 | 19.6 | 21.1 | 13.8 |
| 7 | CHITAL | 9.4 | 38.6 | 50.4 | 1.6 | 4.3 | 39.2 | 54.1 | 2.4 |
| 8 | DIR | 11.6 | 43.4 | 40.3 | 4.7 | 5.8 | 42.3 | 41.9 | 10.1 |
| 9 | DROSH | 15.2 | 42.8 | 39.9 | 2.2 | 9.2 | 45.4 | 40.8 | 4.7 |
| 10 | G-DOPATA | 3.6 | 42.9 | 35.7 | 17.9 | 1.6 | 35.3 | 36.3 | 26.8 |
| 11 | G-KHAN | 11.5 | 41 | 33.3 | 14.2 | 6.4 | 33.2 | 35.1 | 25.3 |
| 12 | GILGIT | 21 | 38.7 | 34.5 | 5.9 | 11.4 | 41.8 | 37.2 | 9.6 |
| 13 | GUPIS | 27.3 | 21.8 | 22.7 | 28.2 | 15.5 | 20.9 | 20.1 | 43.5 |
| 14 | KAKUL | 15 | 46.4 | 32.1 | 6.4 | 10 | 45.3 | 31.2 | 13.4 |
| 15 | KHANDAR | 16.7 | 44.8 | 29.3 | 9.2 | 10.4 | 43.3 | 27.7 | 18.5 |
| 16 | KOHAT | 21.3 | 39.7 | 31.9 | 7.1 | 12 | 38.5 | 33.9 | 15.7 |
| 17 | KOTLI | 30.9 | 29.8 | 29.8 | 9.6 | 23 | 30 | 30 | 16.9 |
| 18 | MANGLA | 20.6 | 41.8 | 27.3 | 10.3 | 16.4 | 38.8 | 25.6 | 19.1 |
| 19 | MURREE | 7.5 | 45.1 | 36.8 | 10.5 | 4 | 40.1 | 39.8 | 16.1 |
| 20 | M-ABAD | 16.8 | 47.9 | 23.4 | 12 | 7.4 | 47 | 23.1 | 22.6 |
| 21 | NARAN | 10.7 | 44.3 | 30.5 | 14.5 | 3.5 | 48 | 32.2 | 16.3 |
| 22 | P-CHINAR | 14.6 | 41.6 | 32.1 | 11.7 | 8.5 | 39 | 30.5 | 22 |
| 23 | PESHWAR | 29.1 | 31.8 | 33.8 | 5.3 | 21.6 | 31.4 | 38 | 8.9 |
| 24 | PLANDRI | 25.9 | 26.9 | 31.5 | 15.7 | 22.3 | 19.9 | 34.6 | 23.2 |
| 25 | R-KOT | 21.9 | 35.1 | 32.5 | 10.5 | 12.4 | 31.1 | 33.5 | 22.9 |
| 26 | R-PUR | 31 | 28.2 | 31 | 9.9 | 20.8 | 29.3 | 30.3 | 19.7 |
| 27 | S-KOKATA | 11.8 | 39.6 | 36.1 | 12.4 | 7.8 | 34.2 | 35.9 | 22.2 |
| 28 | S-SHARIF | 18 | 32.3 | 36.1 | 13.5 | 9.3 | 30 | 37.1 | 23.5 |
| 29 | SKARDU | 30.5 | 24.2 | 27.3 | 18 | 21.2 | 20.3 | 19.5 | 39 |
| 30 | DI Khan | 21 | 35 | 32 | 12 | 21 | 32 | 31 | 16 |
| Stations | CHITAL | KOHAT | P-CHINAR | SKARDU |
|---|---|---|---|---|
| TDP1 RL (mm) | 320 | 162 | 221 | 155 |
| TDP2 RL (mm) | 205 | 260 | 230 | 101 |
| Daily Extreme Precipitation (mm) | 160 | 140 | 195 | 88.3 |
Publisher’s Note: MDPI stays neutral with regard to jurisdictional claims in published maps and institutional affiliations. |
© 2020 by the authors. Licensee MDPI, Basel, Switzerland. This article is an open access article distributed under the terms and conditions of the Creative Commons Attribution (CC BY) license (http://creativecommons.org/licenses/by/4.0/).
Share and Cite
Zaman, M.; Ahmad, I.; Usman, M.; Saifullah, M.; Anjum, M.N.; Khan, M.I.; Uzair Qamar, M. Event-Based Time Distribution Patterns, Return Levels, and Their Trends of Extreme Precipitation across Indus Basin. Water 2020, 12, 3373. https://doi.org/10.3390/w12123373
Zaman M, Ahmad I, Usman M, Saifullah M, Anjum MN, Khan MI, Uzair Qamar M. Event-Based Time Distribution Patterns, Return Levels, and Their Trends of Extreme Precipitation across Indus Basin. Water. 2020; 12(12):3373. https://doi.org/10.3390/w12123373
Chicago/Turabian StyleZaman, Muhammad, Ijaz Ahmad, Muhammad Usman, Muhammad Saifullah, Muhammad Naveed Anjum, Muhammad Imran Khan, and Muhammad Uzair Qamar. 2020. "Event-Based Time Distribution Patterns, Return Levels, and Their Trends of Extreme Precipitation across Indus Basin" Water 12, no. 12: 3373. https://doi.org/10.3390/w12123373
APA StyleZaman, M., Ahmad, I., Usman, M., Saifullah, M., Anjum, M. N., Khan, M. I., & Uzair Qamar, M. (2020). Event-Based Time Distribution Patterns, Return Levels, and Their Trends of Extreme Precipitation across Indus Basin. Water, 12(12), 3373. https://doi.org/10.3390/w12123373


