Article

Hydrodynamic Cross-Scale Archaeology at a Roman River Harbour

1
Leichtweiß-Institute, Technische Universität Braunschweig, Beethovenstraße 51a, 38106 Braunschweig, Germany
2
LVR-Archaeological Park Xanten/LVR-Römer Museum, Bahnhofstraße 46-50, 46509 Xanten, Germany
3
LVR-Amt für Bodendenkmalpflege im Rheinland, Endenicher Straße 133, 53115 Bonn, Germany
*
Author to whom correspondence should be addressed.
Water 2020, 12(12), 3365; https://doi.org/10.3390/w12123365
Submission received: 15 September 2020 / Revised: 19 November 2020 / Accepted: 25 November 2020 / Published: 30 November 2020
(This article belongs to the Section Hydraulics and Hydrodynamics)

Abstract

:
Trans-disciplinary research methods and data from archaeology, geology, hydrology, and hydraulic engineering are successfully merged to reevaluate hydrodynamic effects of Roman hydraulic structures at a Rhine river harbour. The archaeological site Colonia Ulpia Traiana, is characterized by its exceptional preservation, providing ample research data on its river harbour. Constructed by the Romans, the berthing area is lined by a wooden quay-wall. Setting this harbour apart is its up-stream tip, which is fitted with a unique hydraulic structure with unknown purpose. Structure related hydrodynamic impacts on the historic Rhine regime are examined by introducing a novel cross-scale multi model approach, consisting of three steps: (i) Scaled physical experiments are performed to investigate the roughness influence of the wooden quay on a local scale. (ii) A numerical representation of the physical experiments is done in Delft3D, validating a linear loss term to accurately capture the roughness influence on the velocity distribution. (iii) A mid-scale Rhine river model of the area is generated that approximates the historic river bathymetry through morphological evolution. The quay-wall is implemented in parametric form and induces a substantial velocity reduction throughout the harbour. The unique structure exhibits hydromechanic properties mimicking present day current-deflection walls, potentially rendering it their primal prototype.

1. Introduction

Hydraulic engineering of harbours can be traced back to ancient civilisation such as the Greeks constructing the ports of Pylos (Lat: 36.935 793; Long: 21.687 064) and Methone (Lat: 40.467 450; Long: 22.583 650) as early as 600 BC or the Romans constructing a port at the Tiber estuary near Centumcellae (Lat: 41.780 032; Long: 12.262 886) 700 years later [1,2]. From the initial usage of natural bays as berthing areas and the reinforcement of riverbanks and beaches using kid bindings to wooden jetties, the Romans progressed to the accomplished construction of seaports inventing the opus caementicium (roman concrete) for underwater usage and sinking stone filled barges in place as foundations [3,4].
Part of the Roman empire, the Colonia Ulpia Traiana (CUT) and its predecessors are situated directly northwest of the medieval and modern town of Xanten in North Rhine-Westphalia, Germany, close to the Rhine river in proximity to the Dutch border. In the second and third century AD it was one of the only two coloniae in the province of Germania Inferior and the second largest city after Colonia Claudia Ara Agrippinensum, today’s Cologne [5,6].
The oldest structures date between 10 to 20 AD [7]. Between 98 to 106 AD [8] the settlement was elevated to the status of a Colonia by the Roman Emperor Trajan and called CUT. It became a city after the Mediterranean model with a chess board street system, city walls and large public buildings such as the forum, capitolium, temples and baths [9,10,11,12,13,14,15,16,17,18].
The Roman harbour is located in front of the northeastern city wall. From early Roman times until the fourth century, the Rhine river flowed past the wall in a curve, very close to the northern part of the wall [7,19]. Between 1934 and 1993 several excavations took place in this area [18,19,20,21,22] providing evidence of a rich harbour culture whose functioning and layout are still associated with several unknowns. Archaeological research unearthed parts of a wooden quay wall along the northern city wall lining the former Rhine bank. A length of 45 m is documented, while the absolute length remains unknown [23]. A value running anywhere between 200 m to 230 m can be assumed as plausible. The wooden quay, of which only the southern most part has been excavated, is the oldest part of the harbour of the CUT. The end of the quay is roughly triangular, consisting of three layers of stacked oaken beams ending in an approximately 50 cm wide tip.
The quay wall consists of five oak boards stacked laterally along the river approximately 40 cm to 50 cm wide each, supported by vertically rammed oaken posts at their ends. The substructure was further reinforced by oaken and pine posts 30 cm in diameter up to 6 m long, rammed into the sand of the riverbank 1.4 m apart. Transverse beams and four column drums were inserted to give additional stability. The substructure was backfilled with earth and rubble and the surface covered with gravel. In Figure 1a sketch of the excavated structures is presented, showing the wooden structures in brown color and additional pillars made of stone. The quay-wall with its rammed poles described can be seen on the right side. The tip is located at the bottom-right corner. The photographies in Figure 2a,b show details of the river-oriented quay-wall. The upper edge of the quay-wall reaches 16.45 m to 16.55 m above sea level, whilst the lower edge reaches down to 15.13 m above Sea Level indicating water levels during the active period of the quay wall [20].
Two different characteristics of the wooden structures are expected to affect the flow significantly. The first one is a constant loss alongside the quay wall due to the supporting vertical pillars, the second expected effect is an alteration of the hydrodynamic patterns due to the projecting structure at the upstream edge of the findings. Both elements are examined using partly different methods to understand the underlying physics. In the following a short introduction on the concepts based on current literature is given.
Roughness elements on walls induce turbulence in the flow, through vortices developing at the backside of a structure [24], where the exact hydrodynamic structure depends on the geometric constraints and spacing of the elements. This effect is studied on a small scale regarding surface roughness but analogous flow patterns evolving can also be observed on a larger scale. The comparability in this context depends on features of the surface and the flow, characterized by the Reynolds number, alike. Stepped spillways for example show, that in structural niches back flowing vortices can develop dependent on the dimensions and the slope of the spillway, adding to a boundary layer and causing energy dissipation [25]. On a different scale, eddies are also a common feature of groyne fields, where the area in between two groynes is characterized by back flowing velocity components, such as shown in experimental investigations in [26]. As [27] points out the patterns evolving in channels characterized by large roughness such as rockfilled ones are similar to the ones in stepped spillways with a low slope. The large dominant recirculation pattern evolving lead to a well correlated friction factor in a series of experimental set-ups. A similar flow structure can hence be expected to be caused by the vertical piles of the roman harbour remains necessitating an analysis of its influence on the hydrodynamic regime.
The construction of the CUT quay with its triangular shape at the end appears to be quite unique, as no similar structure has been unearthed so far. Constructed on the cut bank of the mainstream of the former Rhine river course with the largest water depth and highest current velocities it might very well be one of the earliest current deflection walls ever constructed to induce a quiescent docking area along the quay-wall [28]. However, earliest mentions of current deflection structures for influencing berthing area related current fields date back only a couple of decades and by no means millennia [29,30,31,32,33]. The hydrodynamic effect of the excavated triangular structure has to be investigated, as it presents a potential hydraulic novelty, with regard to the fact that no similar structure has been found until now from the Roman or any other period. Furthermore, the overall nautical conditions near the quay-wall river harbour are unknown at the moment but are of interest to historic ship builders and archaeologists, as well as for comparisons with modern day harbour concepts.
The intellectual and cultural heritage of the Roman empire arguably form the corner stones of modern civilization across the western hemisphere, with their impressive infrastructural and scientific achievements visible today across its former region of influence and beyond. Reproducing the physical conditions prevailing naturally and induced by technical solutions via contemporary tools usually not employed in historic contexts addresses possible intentions of roman engineers and sheds light on their understanding of hydrodynamic processes and thereby adds to understanding this antique high culture. The achievements in the field of hydraulic engineering obtained without the elaborated tools existing today may remind us of the value of human creativity being a main driver of technological progress, while at the same time showcasing the power of modern tool within a trans-disciplinary project.
The objectives of this study are fourfold:
  • To investigate the hydraulic effects such as local energy loss for the specific structural design of the flow parallel quay wall
  • To find an adequate representation of the quay-wall’s effect in a numeric model
  • To develop a possible historic river bathymetry, employing the data of archaeological and geologic origin with the physics based sedimentation processes
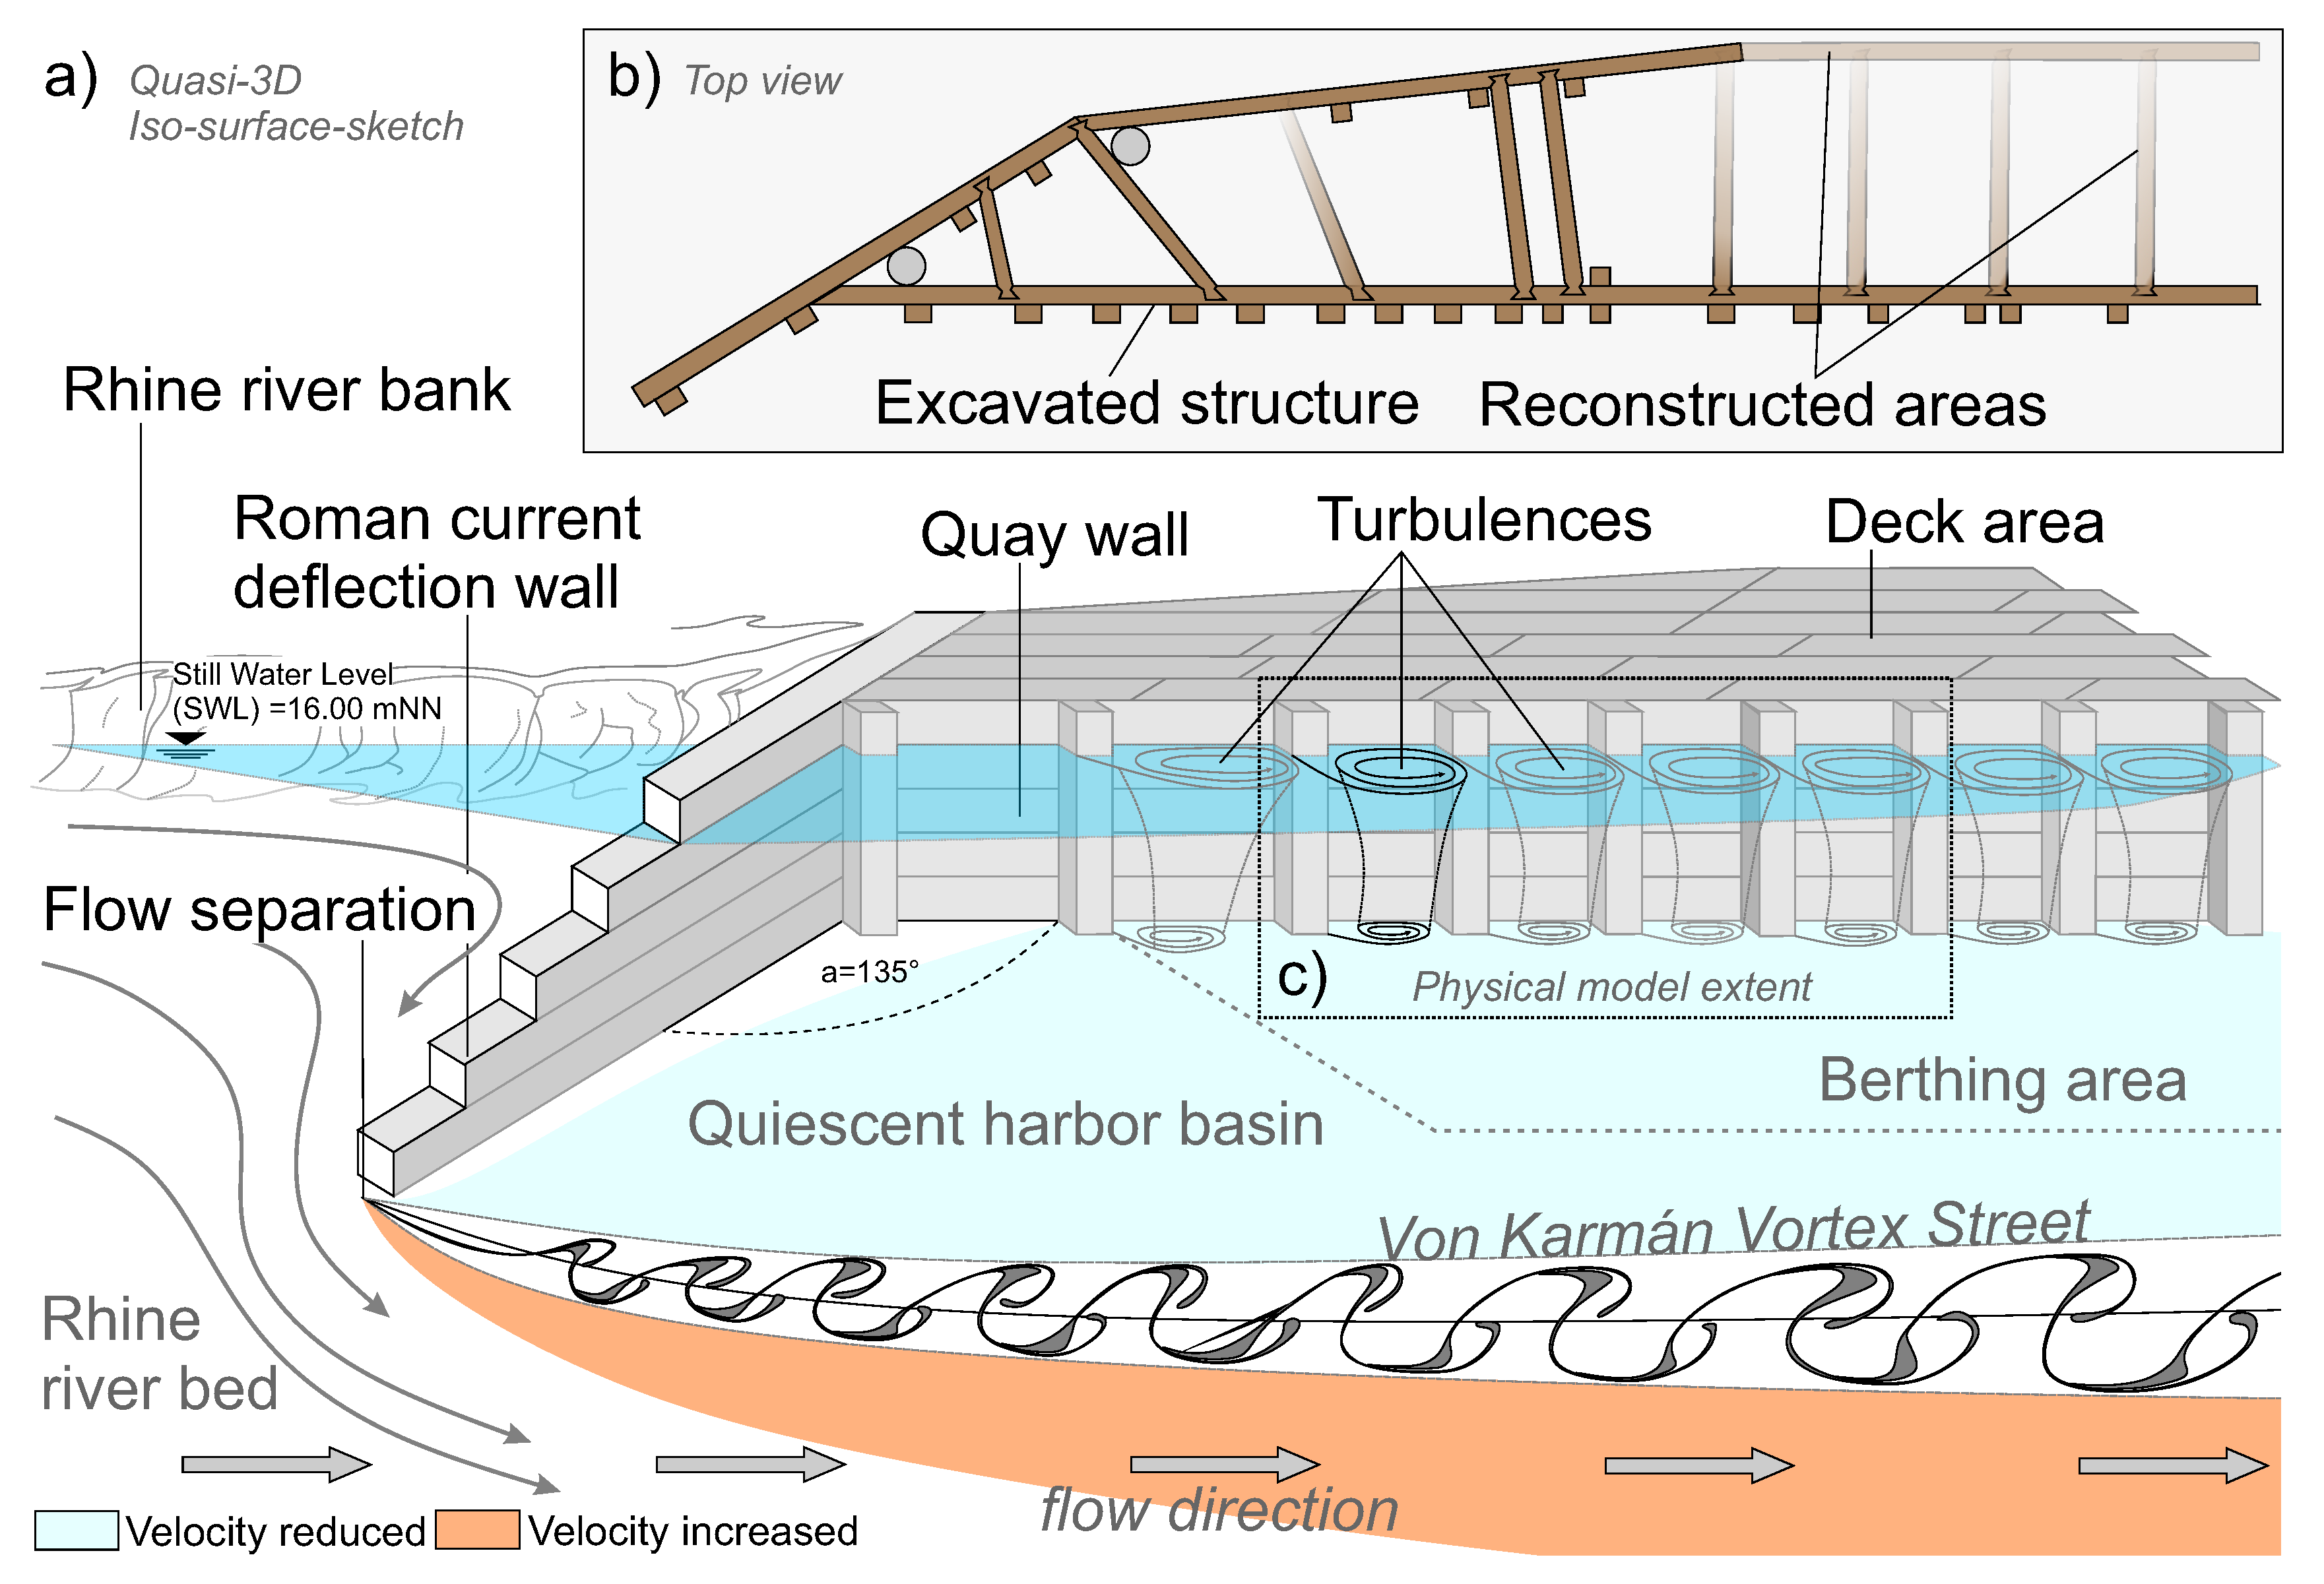
  • To examine the local effect of the possible current deflection wall under a realistic hydrodynamic global regime
The study is structured as follows: Data, equipment and methods used are given in Section 2. In Section 3 results are presented. Findings are discussed in Section 4 with conclusions drawn in Section 5.

2. Data and Methods

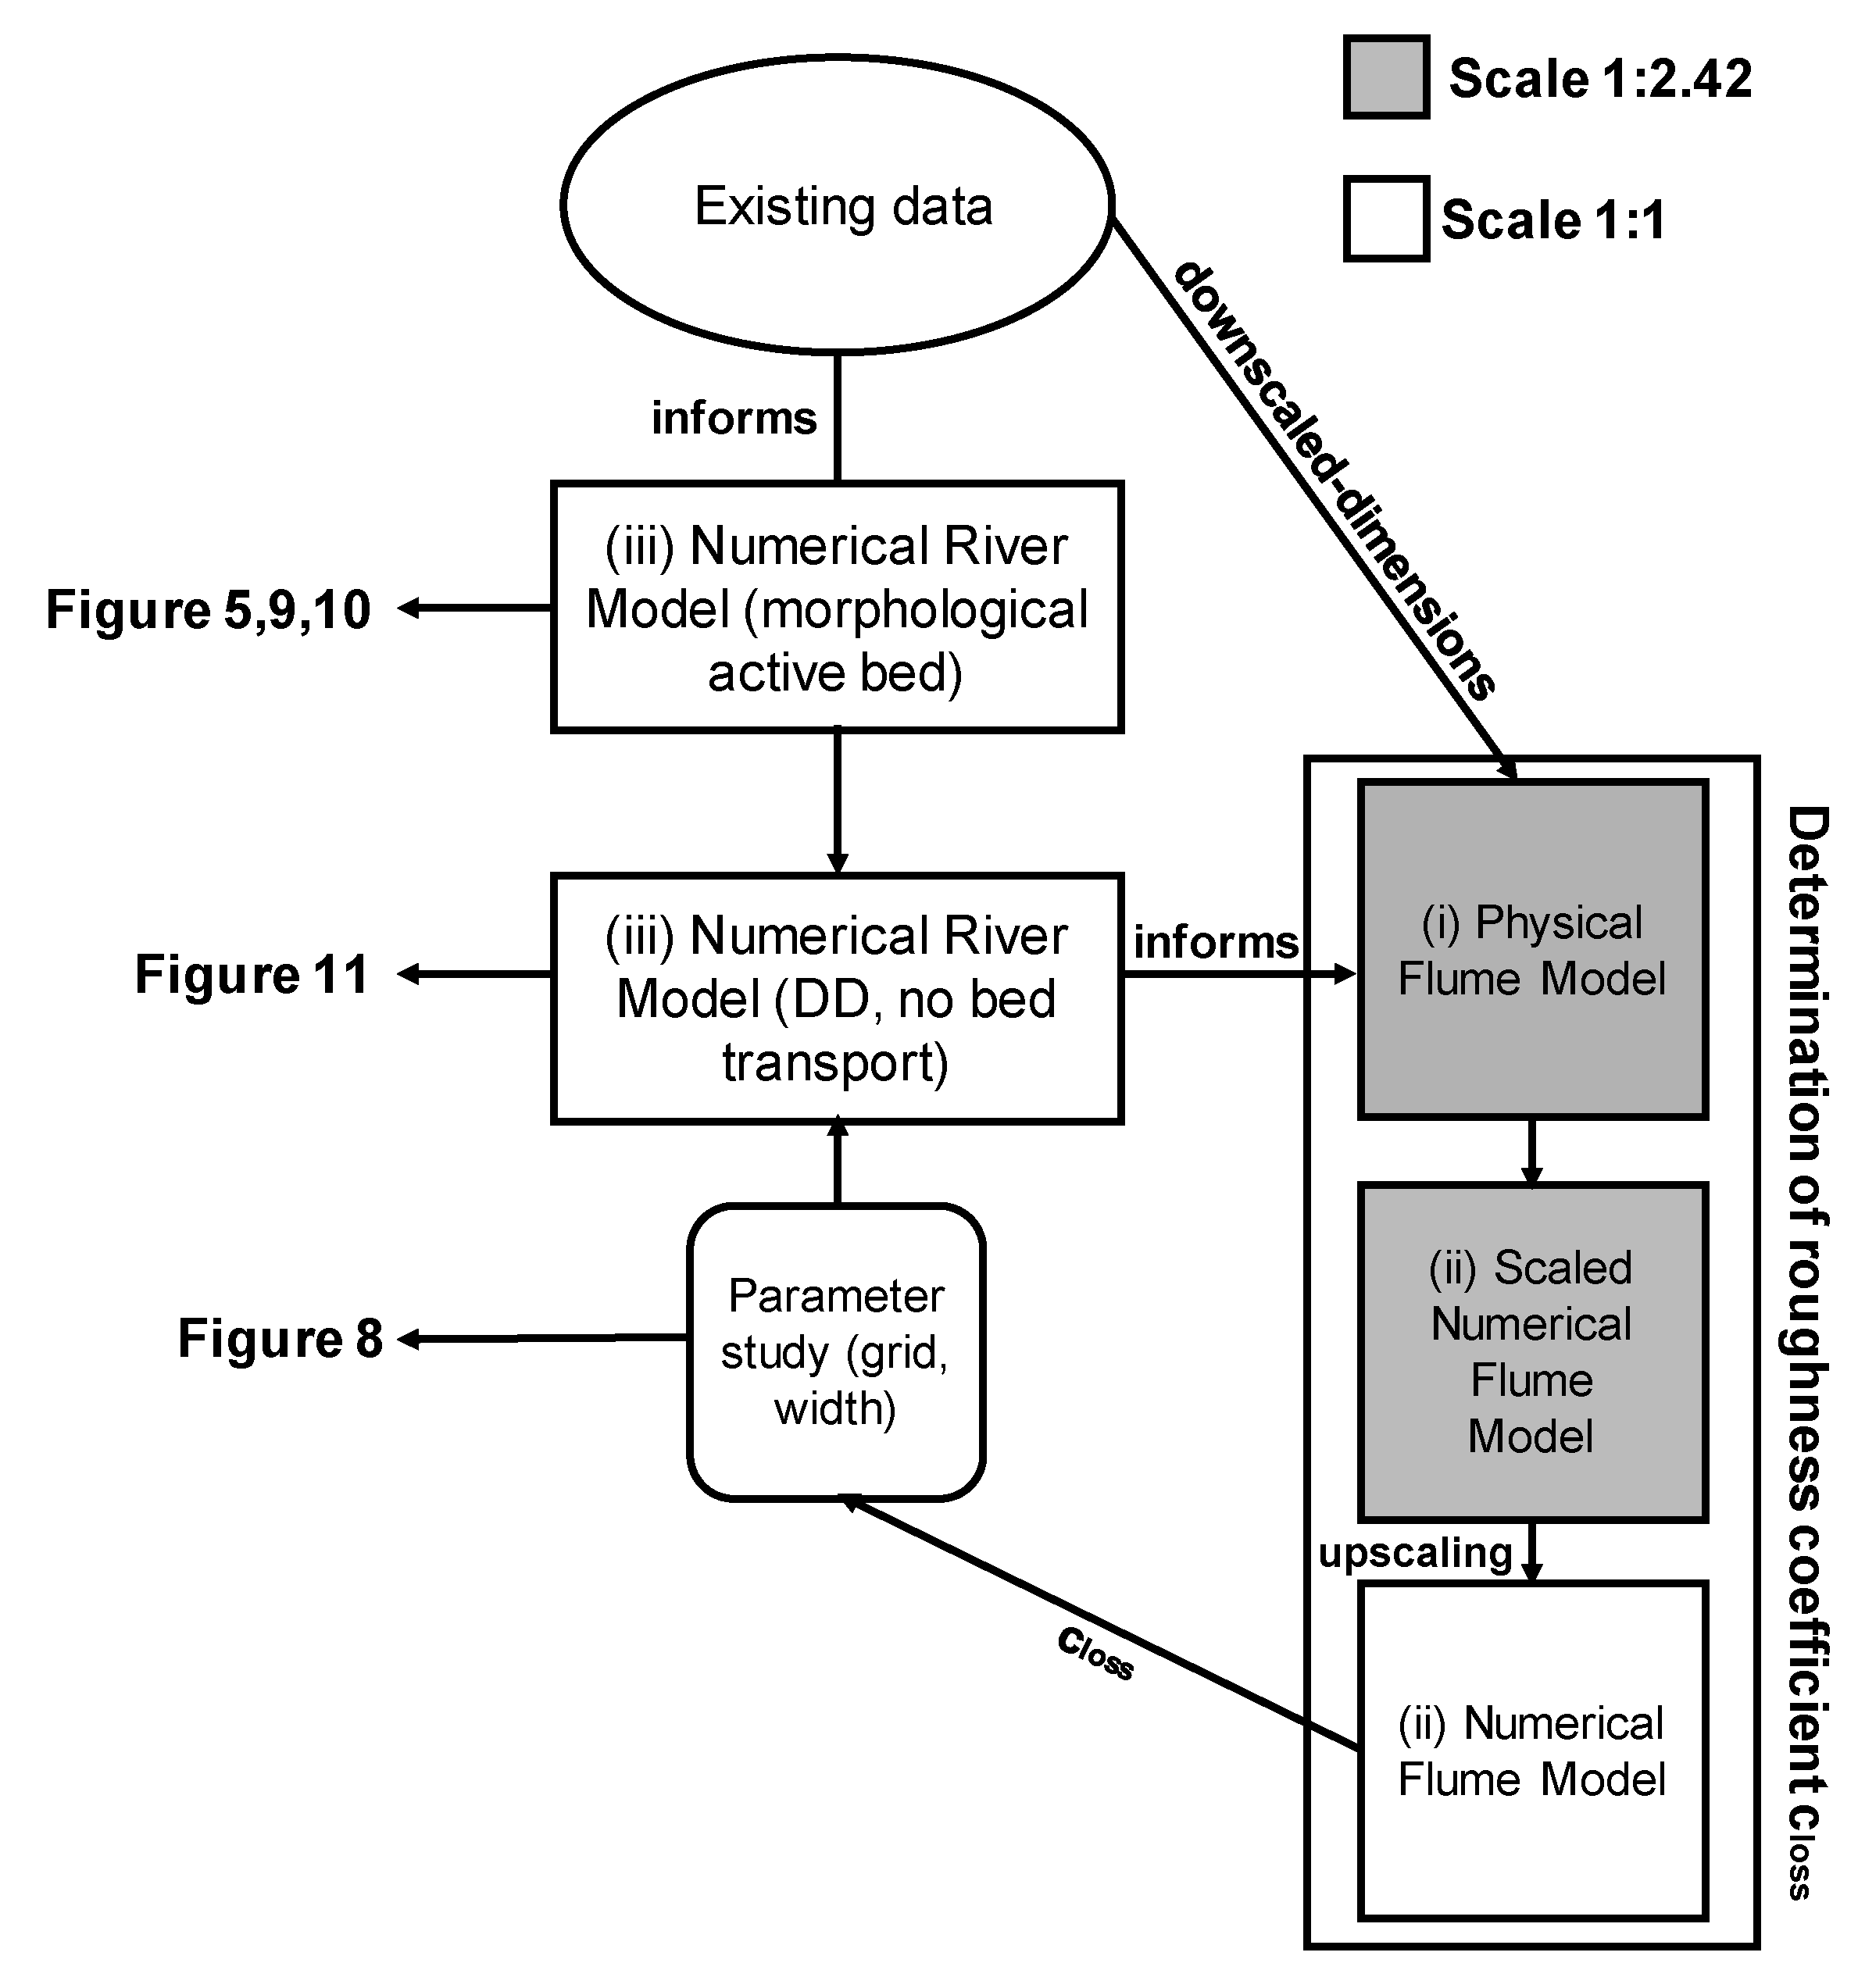
2.1. Cross-Scale Multi-Model Approach

To shed light on different aspects of the historic harbour, a cross-scale multi-model approach incorporating three model-packages was developed, to allow for an effective examination ensuring maximum inclusion of available data from the outset. These packages are:
(i)
Physical Flume Model
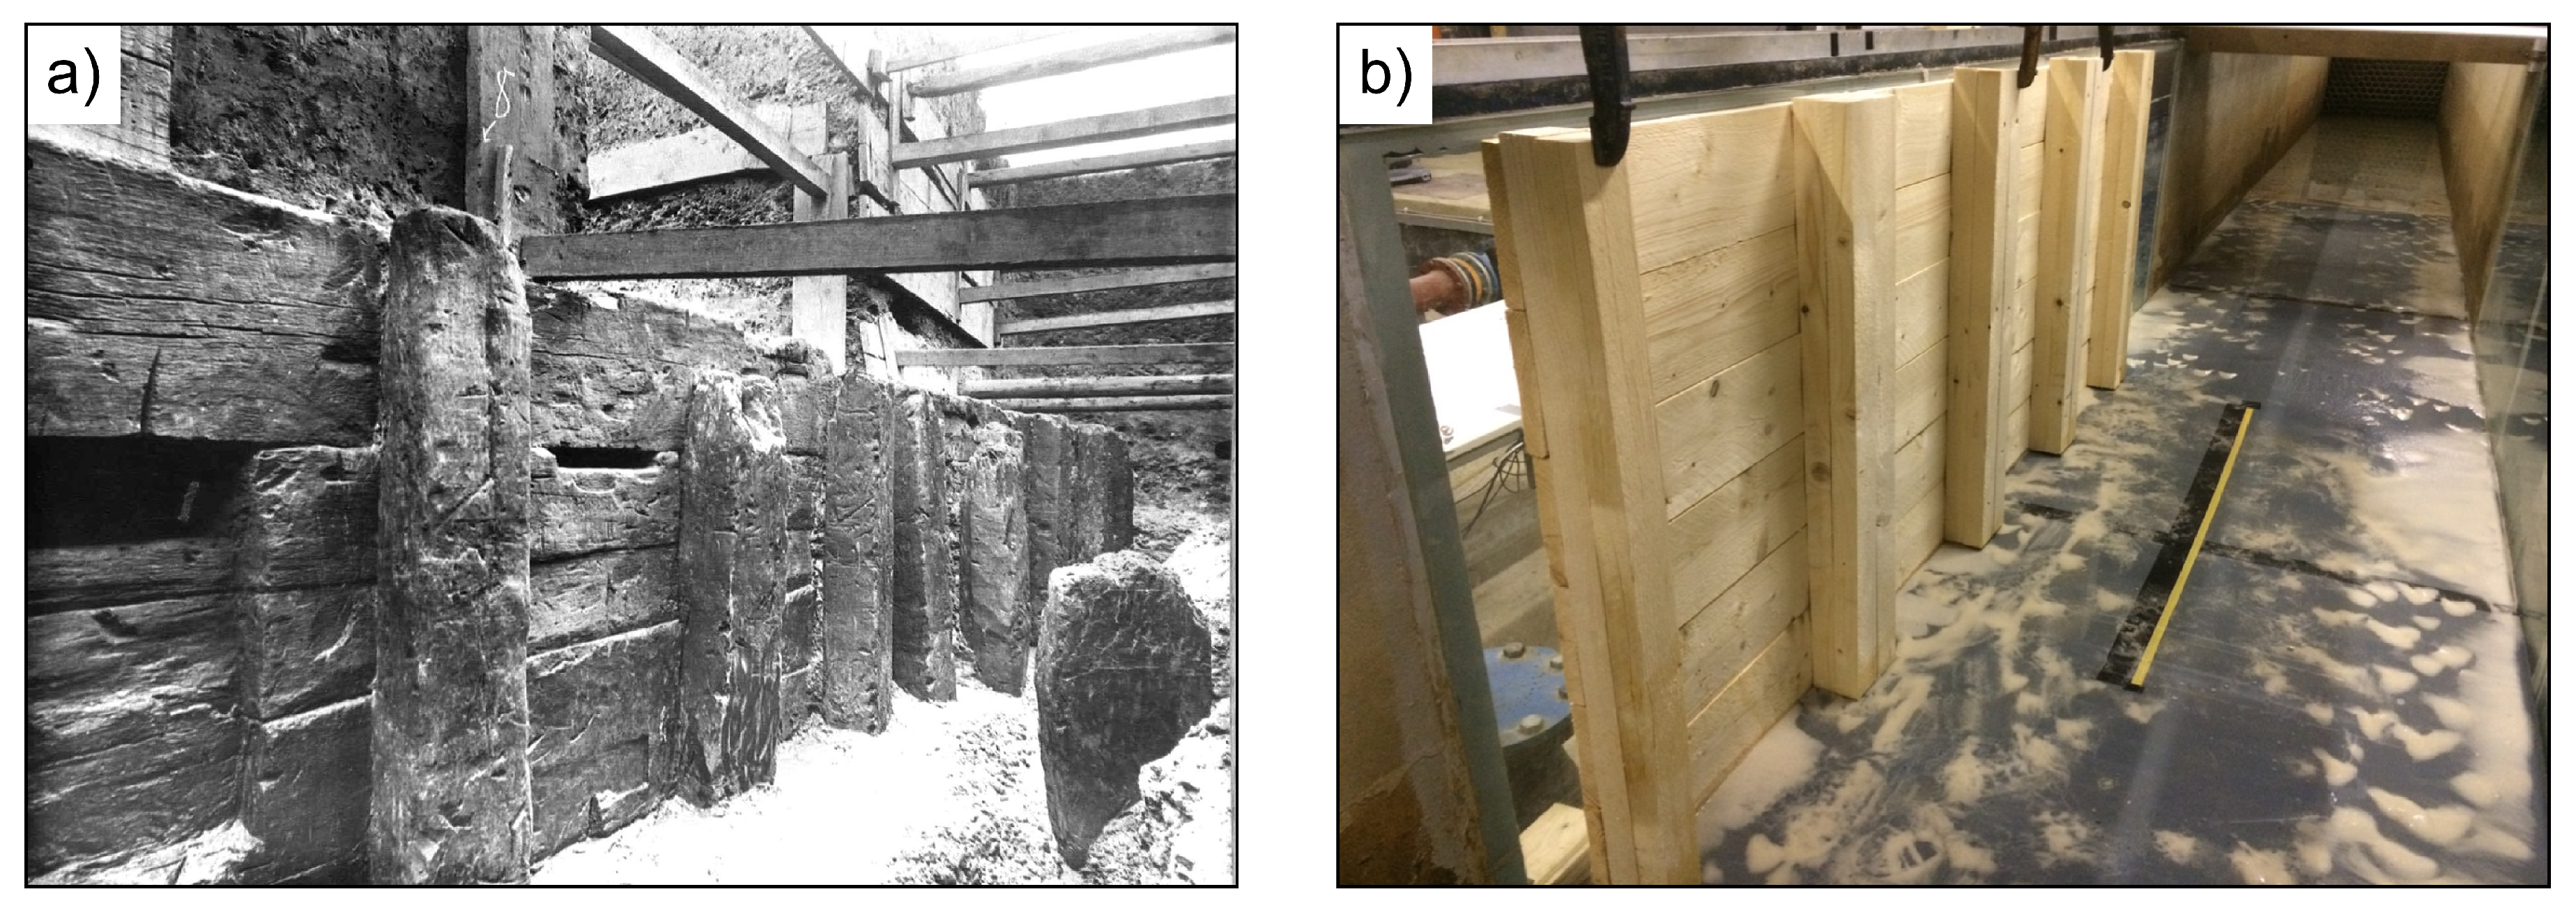
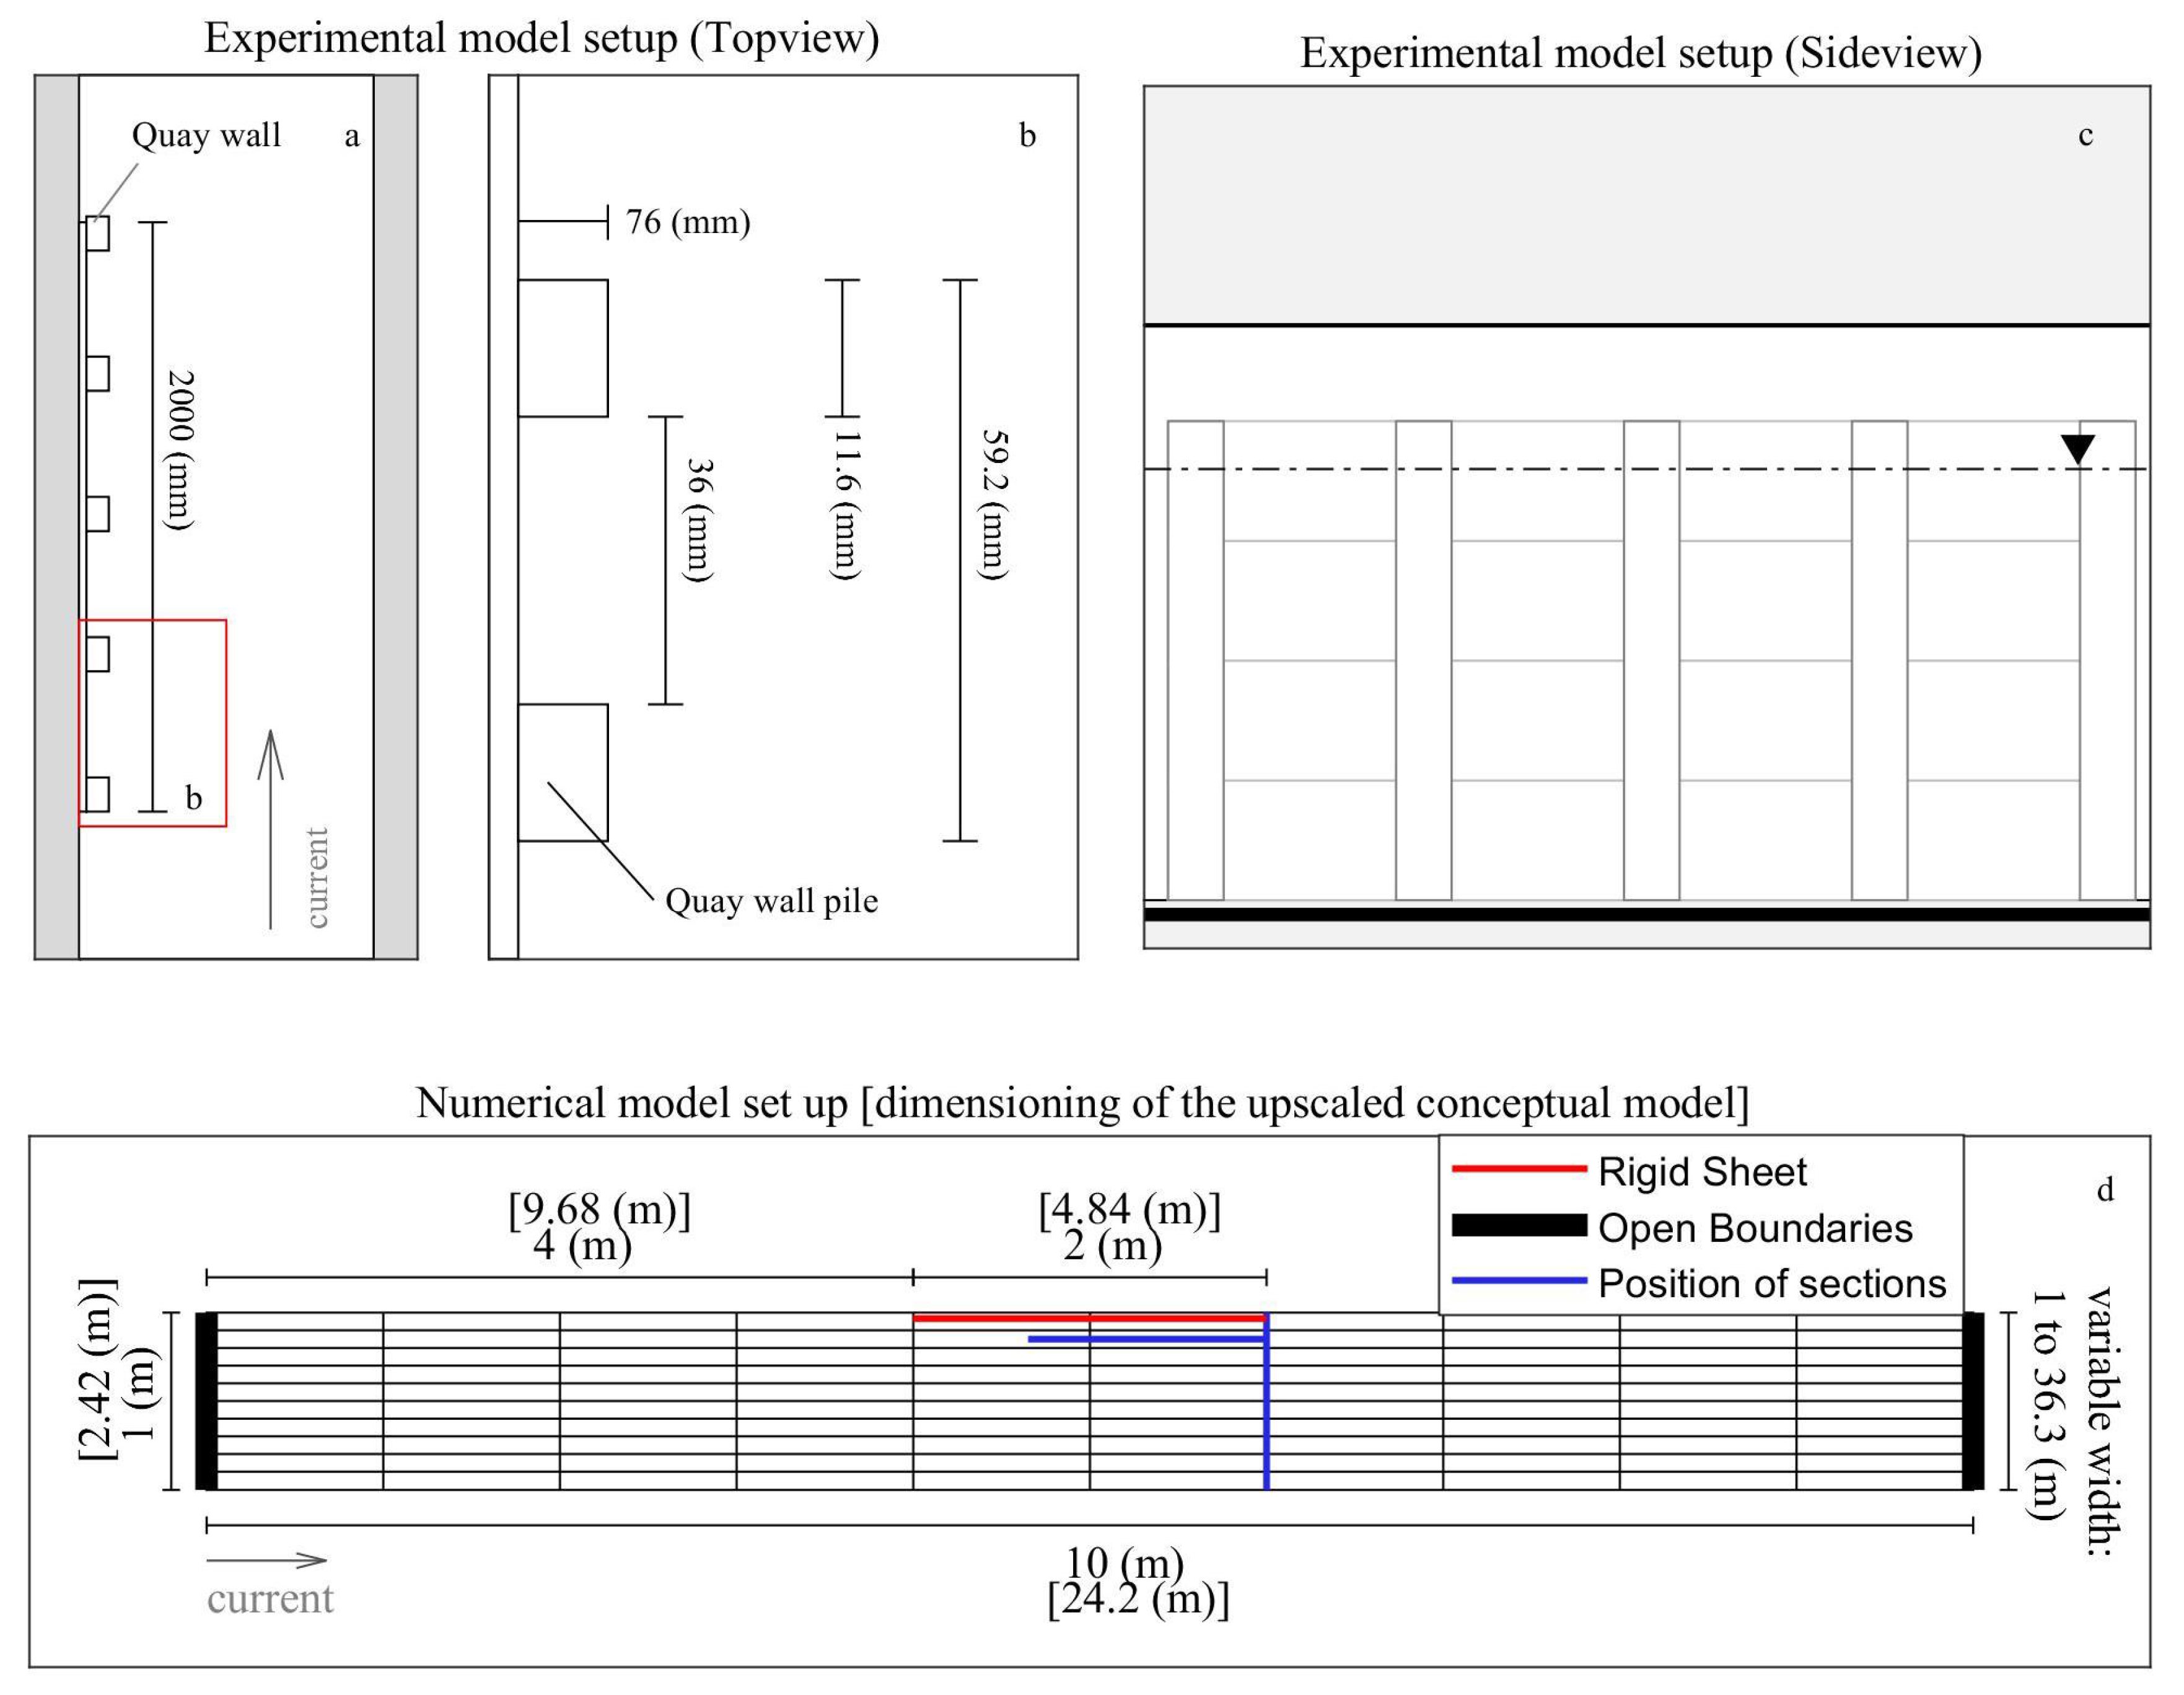
  • A physical surrogate model of the archaeological roman wooden quay-wall is designed on a 1:2.42 scale, adhering the size of the experimental facility and the availability of construction timber on the retail market. This model is installed in a current flume for hydraulic experiments determining the wall-roughness induced loss alongside the quay wall. The geometric constraints are derived from the archaeological data, while information such as the water level and the velocity are chosen according to the numeric model of the river stretch. The influence of the tip pointing into the stream is not examined.
(ii)
Numerical Flume Model
  • A simple conceptual numeric model of the experimental set-up is reproduced in Delft3D, where the quay-wall is included as a parametrized loss function. This numerical model is initially scaled at 2.42 to compare with physical lab results. In a second step, these are up-scaled to real-life dimensions to ensure correct adaption. The comparison allows for the identification of a value of the loss coefficient, that leads to a minimal difference in the velocity distribution of the experimental and numerical results.
(iii)
Numerical River Model
  • Finally, a numerical river model (NRM) of the ancient Rhine containing the CUT stretch is developed. It comprises two steps. The first one is the generation of a physically plausible bathymetry using an active bed to simulate the morphological processes of the river. The second step is the examination of the hydrodynamics in vicinity of the harbour structures on basis of the bathymetry generated in step one, now neglecting the morphodynamics of the river.
  • The model is combining archaeological field research data for reconstructing a detailed 3D-river bed with hind-cast time-series of ancient Rhine river discharge for forcing the model, including a morphologically active bed. In the second step, the representation of the parametric quay-wall structures to simulate the hydrodynamic effects observed during the initial physical laboratory tests is combined with a parametric representation of the possible current deflection wall (CDW) to account for the harbour influence.
The interconnection in between the modelling packages of the multi-model approach is visualized in Figure 3, showcasing the different models in each modelling-package, their scale and the information interchanged in between.

2.2. Physical Flume Experiments

A lack of readily available literature values of surface roughness for wooden style quay-walls in roman construction style sparked/inspired the conduction of scaled physical laboratory experiments to obtain aforementioned values. For the quantification of the parametric loss induced by the quay wall, examinations on the velocity field around a scaled model of the archaeological findings were performed.
The experiments took place in the 65 m long oval-shaped current flume of the Ludwig-Franzius- Institute with a width of 1 m [34]. The dimensions and proportions of the archaeological find at CUT were hydro-dynamically scaled using Froude’s law of similarity [35,36]. The Froude number is given with F r = v g × L , where v is the velocity, g is the acceleration of gravity and L is a characteristic length, in case of open channel flow the waterdepth d. This leads to a definition of a relation of prototype velocity v p to model velocity v m of v p v m = L r , where L r is the length relation of the model, assuming that the acceleration due to gravity applies for both model and prototype [37]. As the turbulence and energy dissipation is also influenced by the fluid’s viscosity the Reynolds number accounting for the resulting forces is another dimensionless parameter having an effect on the scalability. In this model the Reynolds number was not kept constant, as it was assumed that regarding the size of the roughness elements the fluids viscosity is not resulting in a dominant force. Nonetheless, it remains a possible source for deviation between the model and its prototype. The constructed model extended 2.00 m in length, 1 m in height with a wall-thickness of 0.02 m and 5 regularly spaced rectangular support pillars of w = 0.076 m by l = 0.116 m in a distance of 0.36 m (see Figure 4). The model was clamped to the flume wall and sealed with silicone around the edges and bottom to prevent back-flow. Applied current velocities in the laboratory facility were adjusted accordingly, scaling the parameters occuring at that position in the NRM, operating the PFM with 0.32 m s 1 and a water depth of 0.65 m . A Longitudinal section parallel to the quay wall as well as a cross-sectional transect through the flume were measured taking into account five points in the vertical scale using the acoustic Doppler velocimeter (ADV) Nortek Vectrino with the firmware 1.31. Measurements with and without the structure installed reveal its effect on local hydrodynamics. The three-minute timeseries of the velocity in x-direction was filtered according to [38], eliminating values with a signal-to-noise ratio (SNR) under 15 and a correlation under 80% along with identifying and replacing nonphysical peaks in the measurements in use of the acceleration-threshold-method [39] and afterwards temporally averaged.
In Figure 2a the original quay wall unearthed at the site is depicted. In Figure 2b the scaled equivalent is shown at its location in the current flume, without water inside.

2.3. Numerical Model Flume

To develop an approach that reproduces the physical results in a numerical model, a conceptual model of the flume was developed in Delft3D, [40] version 4.03.01. The hydrodynamic counterpart of the physical experiments was designed, initially maintaining the Froude scale approach for comparability. The conceptual flume represents the 2.00 m model section tested in the PFM plus an addition 4 m up- and downstream, resulting in total model dimensions of 10.00 m in length and 1.00 m in width (see Figure 4d). The upstream and downstream boundaries were forced with a constant discharge and current condition, respectively, to reach a steady flow field. The resulting velocities were extracted at positions identical to the physical laboratory measurements. The grid resolution is set to 30 × 30 cells, leading to cell dimensions of 0.33   m × 0.033   m . For the advection Delft3D’s standard scheme, a combination of a third-order upwind scheme and a second-order central scheme denoted as cyclic method is chosen [41]. Turbulence models can only be applied for three dimensional computations in Delft3D [42]. Consequently, no turbulence model is applied, the background horizontal viscosity coefficient is set to 1 and the time step is set to 0.0006 s to stay consistent with the Courant–Friedrichs–Lewy criterion.
To compare the vertically resolved x-velocity in the physical experiments to the depth-averaged numerical counterpart, measurements were depth-averaged, according to [43]:
v m = 1 d 0 d v d z
where v m is the depth-averaged velocity d is the water depth and z the vertical coordinate.
After calibrating the numeric flume model without rigid sheet (RGS) against the measurement in the channel without the wooden structure included to calibrate the boundary conditions, a parametric RGS is added to the numeric model. The wall roughness acted as calibration parameter to match the measured velocity values. A value of 0.01 m for the roughness length is identified as suitable. Bed roughness was set to a uniform Manning-coefficient of 0.024. To account for the energy loss induced in the numerical model an artificial bed level gradient of 3 cm had to be introduced that was not present in the physical flume to ensure uniform flow conditions.
A RGS accounting for the friction induced by the shape of the quay-wall is included throughout the length of the quay-wall. This hydraulic structure adds a loss term M, linearly dependent on the flow velocity, the cell-dimensions and a loss coefficient c l o s s to be specified by the user (Equation (2)).
In Figure 4a–c the dimensions of the quay wall in the experimental tests are given. In Figure 4d the numerical reproduction is presented, including the location of the parametrized loss function, the sections compared and the numerical grid applied. The dimensions are given for the original scale and the upscaled version of the numerical flume model (NFM).
M = c l o s s u Δ x
In a second step, the NFM was scaled up to match the archaeological structure at the CUT. This was necessary to account for the scaling effects, because otherwise the determined loss coefficient would correspond to the downscaled dimensions of the quay wall parameter. In this scale bed roughness was set to a uniform Manning-value of 0.028 applying the scaling approach presented in [37] and wall roughness to a value of 0.024. To account for the additional energy loss the bed level difference had to be adapted to 0.15 m .
In a third step, it was tested, how the velocity distribution changes if the influence of the wall roughness decreases through wider flume settings, while the other parameters of the upscaled model remain. This is indicated on the right of Figure 4d. Five different values for a width up to 36.3 m were examined. The cell size of the grid remained the same leading to a maximum number of 30 × 150 cells.

2.4. Rhine River Model

The modelling of the river stretch is divided in two parts. First the available data is aggregated and a possible historic riverbed is reconstructed using the sediment transport module of Delft3D. In a second step, the local effects studied in Section 2.1 and Section 2.2 are embedded in the larger model assuming a static riverbed now.

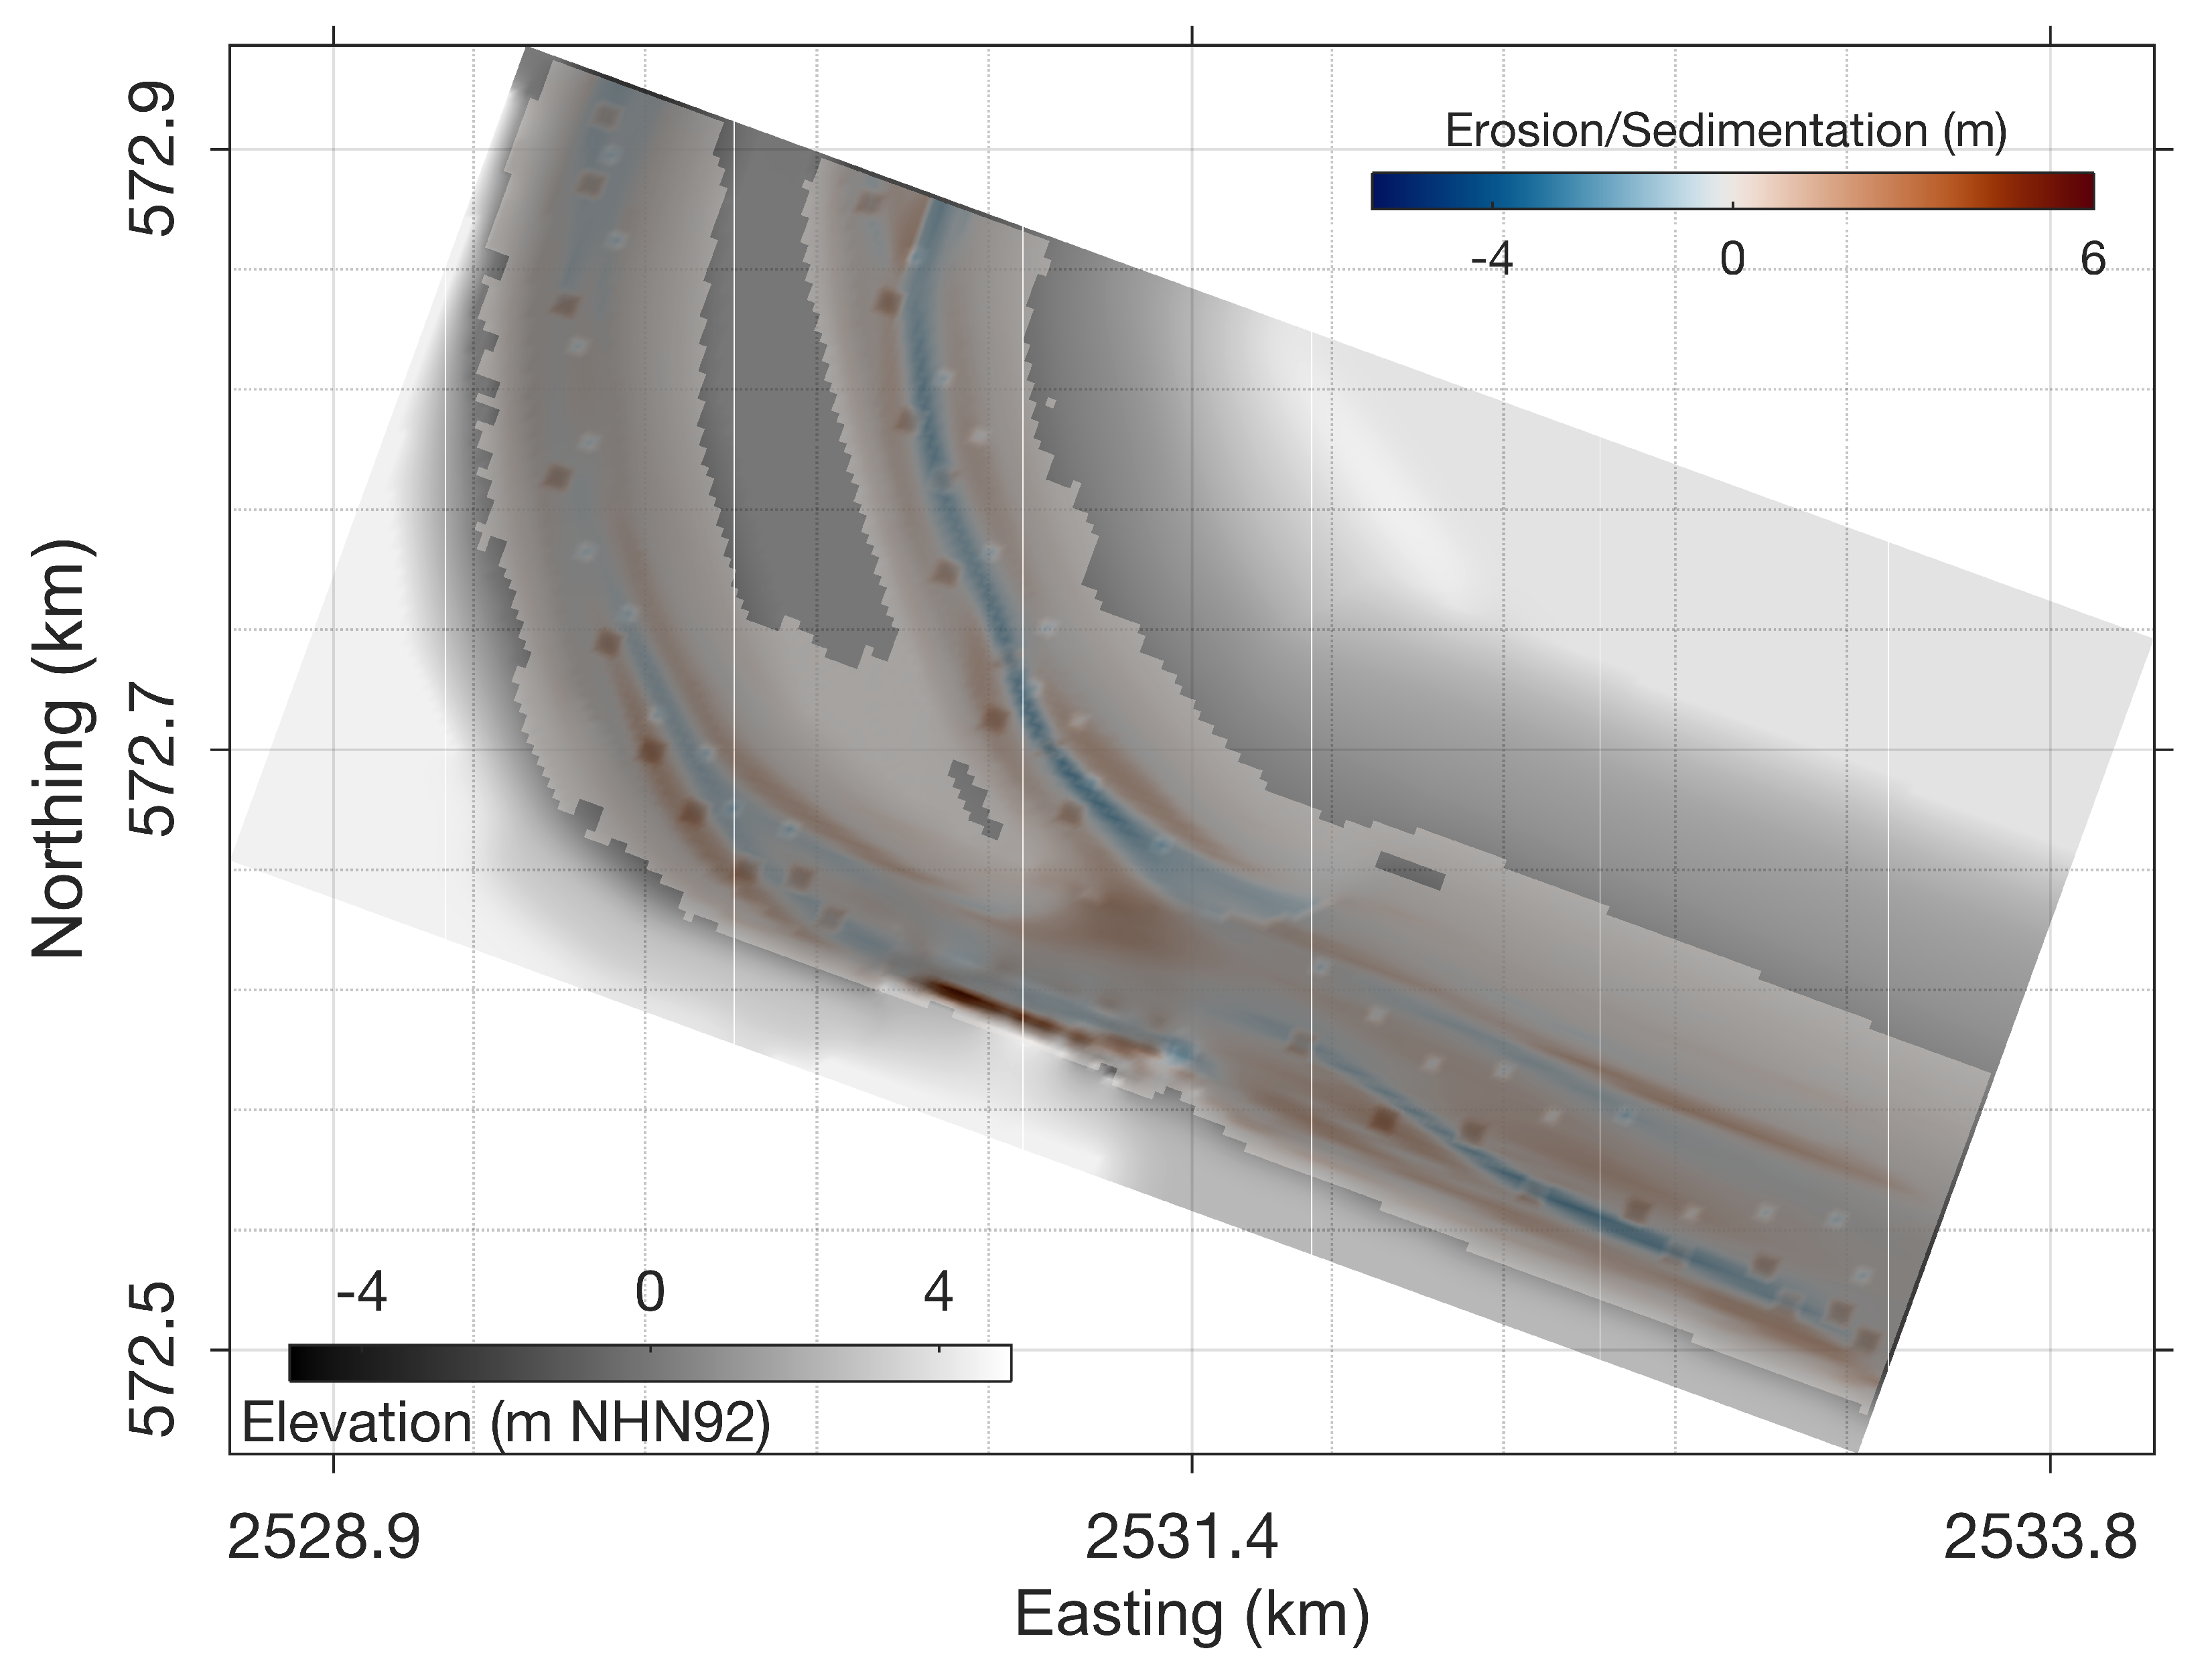
2.4.1. Rhine River Bathymetry

The river bed is a composite of high resolution data of 148 river bed markers derived from drill cores [44] reaching down to 9 m comprising a very high resolution allowing for a detailed 3D-bathymetry interpolation for the vicinity of the quay-wall river bed. The river bathymetry has been subject of discussion. While it was initially assumed that the harbour was located at a dead branch with reduced flow [19,20], the discovery of roman artefacts in the gravel layer lead to the conclusion that the flow velocity had to be high in order to transport the surrounding material that formed the bed at this time. That indicates, the harbour was located on the main branch of the river. This knowledge makes a new evaluation of previous findings necessary. On the study-site 148 drill-cores were collected and evaluated [44] with respect to the assumed location at a dead branch and the subsequent assumption of fine sands defining the bed [19,45]. The model river bed slope can be assumed to equal the contemporary slope of the river [46]. Based on the present-day neighbouring gauges Wesel (No. 2770040) and Rees (No. 2790010) the slope was determined to 0.1‰ [47]. The exact location of the river run outside of the area covered by drilling cores is uncertain and an approximation can only be done with low evidence. Geodata was aggregated using open source Quantum Geo Information System software (Long Term Release version 3.10 [48]). The bathymetry between the river bank lines at 4.5 m and the river axis defined at the intermediate depth of the drill cores of 3 m was interpolated to form a trapezoidal river bed. Figure 5 presents the overall location the site and the local positions of the drill cores, bank markers and the structure unearthed, on a scale comprising the entire river stretch model and in vicinity to the harbour. The bathymetry depicted is the result of morphodynamic simulation runs.
Based on field data, three prevalent sediment fractions a coarse fraction cSA an intermediate sand fraction mSa and a fine fraction fSa were identified and implemented in the numerical model. Sediment diameter and layer thickness used are presented in Table 1.

2.4.2. Hydrodynamic Calibration

The hydrologic regime of a river is to large extent characterized by parameters like the mean water level and discharge. Since no recordings on the ancient water level exist, archaeological indicators and literature values are used. In former studies, it was assumed that archaeobotanical markers are only reductively conserved under water. Based on the status of such markers it was concluded that the mean water level was at 16.00 m [49]. This was no longer applicable when cohesive and organic rich soils showed to have the same effect. The archaeological findings indicate a water level of 15.30 m , which corresponds to the lower edge of the ancient quay-wall, a value that was already proposed by [20] when first discovering the structures. Roggenkamp [49] proposes a method to aggregate historic sources, geological field data and archaeological findings with the empirical Gauckler–Manning–Strickler formula, in order to estimate the discharge at the time. Since this study relies on the hypothesis of the harbour located at a dead arm, the values obtained can not directly be implemented, but the geometric constraints need to be adapted to match the data used here. Open boundaries are assumed at the river inlet and the two outlets. The values for the average current velocity and the discharge finally applied, at the inlet were v = 0.63 m s 1 and Q = 1300 m 3 s 1 , while at the outlet boundary a constant waterlevel of 15.30 m is defined. For the morphodynamic simulation the domain is resolved using a rectangular grid with 100 × 200 evenly spread nodes, yielding a grid cell resolution of 25 m in between knots. Considering the CFL-criterion [50], a time step of 12 s is applied.
The model inherent bottom roughness coefficient is adapted to ensure that the water level gradient matches the bed level gradient. This is the case for a manning-value of 0.029. The bed roughness in numerical models does not necessarily correspond to the physical counterpart but acts as a primary hydrodynamic calibration parameter [42,51,52].
In order to promote morphodynamic activity, the hypothetical bed elevation was modified by adding an equal number of grid cells, of which half were elevated and half were lowered by 0.5 m pre-simulation. Their extend was of quadratic shape, each covering an area of 2500 m 2 , corresponding to 4 grid cells. In the main branch and in each of the split branches 10 locations of reduced water-depth and 10 locations of a risen depth were positioned, so that a final number of 60 modulations was introduced. This resulted in a regularly studded river bed along the river axis, extending 50 m on both sides. It was found that this technique greatly accelerated the morphodynamic evolution due to additionally induced bed shear stresses and turbulence, reducing computational effort. The timeseries of the cumulated sedimentation/erosion is depicted in Figure 9. Furthermore, they served as an indicator on sensitivity of the final bathymetry on the initial assumptions. The initially added artificial modulations were completely removed during the course of the bed generating simulations (see Figure 10). A near-natural river bed results, as the model evens out the generic modulations introduced.
In a subsequent step, the hypothetical bathymetry composed of the information given was modulated using the model inherent morphodynamic capabilities to grind-in the river bed using sediment transport mechanics resulting in physically based near natural development [52], to generate boundary conditions for an in depth analysis of the hydrodynamic conditions. With regard to the spatio-temporal limitation of the underlying hydrologic data, the determined discharge was kept constant instead of considering seasonal fluctuations. Influence of different morphologic acceleration factors (MorFacs) [51,53,54,55] has been tested in combination with three sediment fractions. The MorFac is a numerical factor linearly scaling the bed level changes. This way the morphodynamic processes usually taking place at a much longer time scale than the hydrodynamic ones can be represented while keeping the computational cost within reasonable limits. Based on field data fine, medium and coarse sand fractions were implemented in the model [20] yielding parameters compiled in Table 1. All bed generating simulations spanned a simulation time of 7 days, which were up-scaled using MorFacs from 260 to 1040. As to the nature of the MorFac the corresponding morphodynamic time is obtained by the multiplication of the Factor with the simulated time resulting in a representation of 5 to 20 years morphologic simulation time. Simulation times were extended to reach quasi-equilibrium states [54,55] for the morphodynamic bed activity, to obtain a quasi-steady-state river bed for further investigations.

2.4.3. Hydrodynamic Modelling of Harbour Structures

The obtained bed was used for further hydrodynamic-only simulations, since further morphodynamic simulations would result in a sediment shortage at some point due to the erosion limited modelling approach [55], which was chosen due to a lack of information on suspended sediment transport for the ancient Rhine river. The mesh geometry of the model is refined using a composition of two domains featuring different resolutions. The area highlighted in Figure 11b,c features a higher resolution with 534 × 1274 grid cells with 0.9615 m regular edge length and is nested inside the larger model domain through bi-directional coupling and features a regular grid cell size of 12.5 m by 12.5 m . The Roman quay-wall structure is represented in parameterized form. Model inherent thin dams [42] to block the flow in one direction are used to simulate a quay-wall of 200 m length with additional walls at the tips to prevent back-flow inside the jetty. The turbulence induced loss as identified in Section 3.1and Section 3.2 is included along the length of the structure as a RGS. The possible CDW is accounted for by adding thin dams at the upstream tip of the quay-wall. Due to the conservation status the possible length of the tip is not entirely clear. Different values for the length between 2.7 m to 10.9 m are tested. In the following the longest variant is further presented, because this illuminates the general effect more clearly.

3. Results

3.1. Physical Flume Model

In Figure 6 the cross-section through the flume is shown. The contour plot indicates the velocity in x or along flume direction at the measured locations, while the dots represented the resulting depth averaged value multiplied with the scaling factor to allow the comparison with the scaled numerical results. This is complemented by a quadratic fit of the depth averaged-values and their 95% confidence-interval. The black-yellow line represents the depth-averaged velocity resulting from the NFM.
Current velocities are lowest near the bed and the quay-wall model to the left in direction of flow ranging around 0.15 m s 1 . Highest current speeds are measured near the upper central third reaching up to 0.35 m s 1 . The black-yellow line indicating the depth-averaged velocity in the numerical model compares well to the experimental one, showing that it is an adequate representation of the physical flume. It lies within the 95% confidence interval of the velocity measured within the experiment, showing the validity of the rigid-sheet approach in modelling the loss induced by the quay wall.
Similarly to the cross profile, measurements have been taken along a longitudinal plane on five depth levels and at six horizontal positions. The resulting velocities in x-direction are given in Figure 7.
As expected, velocities measured along the wooden quay-wall model at a distance of 0.15 m correlate with the values obtained near the wall within the cross section (cp. Figure 6). The depth scaled averaged velocity ranges between 0.31 m s 1 to 0.36 m s 1 , increasing throughout the length of the measured section.

3.2. Numerical Flume Experiments

For a numerical model of the experimental set-up scaled to the size of the original quay wall, a coefficient of 10 shows best agreement with the experimental results (cp. Figure 6 and Figure 7). Cross and longitudinal results, both show a good resemblance of the scaled physically obtained values and the numerical parametric function falls well within the 95% confidence interval (ci) of the quadratic fits of the depth-averaged measurements. A sensitivity analysis was conducted for numerical parameter settings such as grid resolution and slip-conditions for wall related boundary-layer effects as well as bed roughness values, possibly affecting simulated velocities. Three different grid resolutions were tested covering cell numbers of 20 × 20 , 30 × 30 and 40 × 40 . No influence on the velocity at the location of the RGS could be observed, leading to the conclusion that the mesh resolution does not influence the results in this specific case. However, the numerical flume dimensions and especially its width revealed a strong influence.
In Figure 8 the depth averaged x-velocity is given on crosssections through six different variations of the NFM characterized by varying dimensions of the flume. The legend presents the width in m. The velocity at the location of the RGS was 0.3 m s 1 in the original upscaled model whereas it was reduced to only 0.15 m s 1 in a generic model of 15 times its width, showing the influence of the wall effect on the velocity distribution. The velocity on the opposing wall also reduces significantly with increasing flume width.

3.3. Numeric River Model

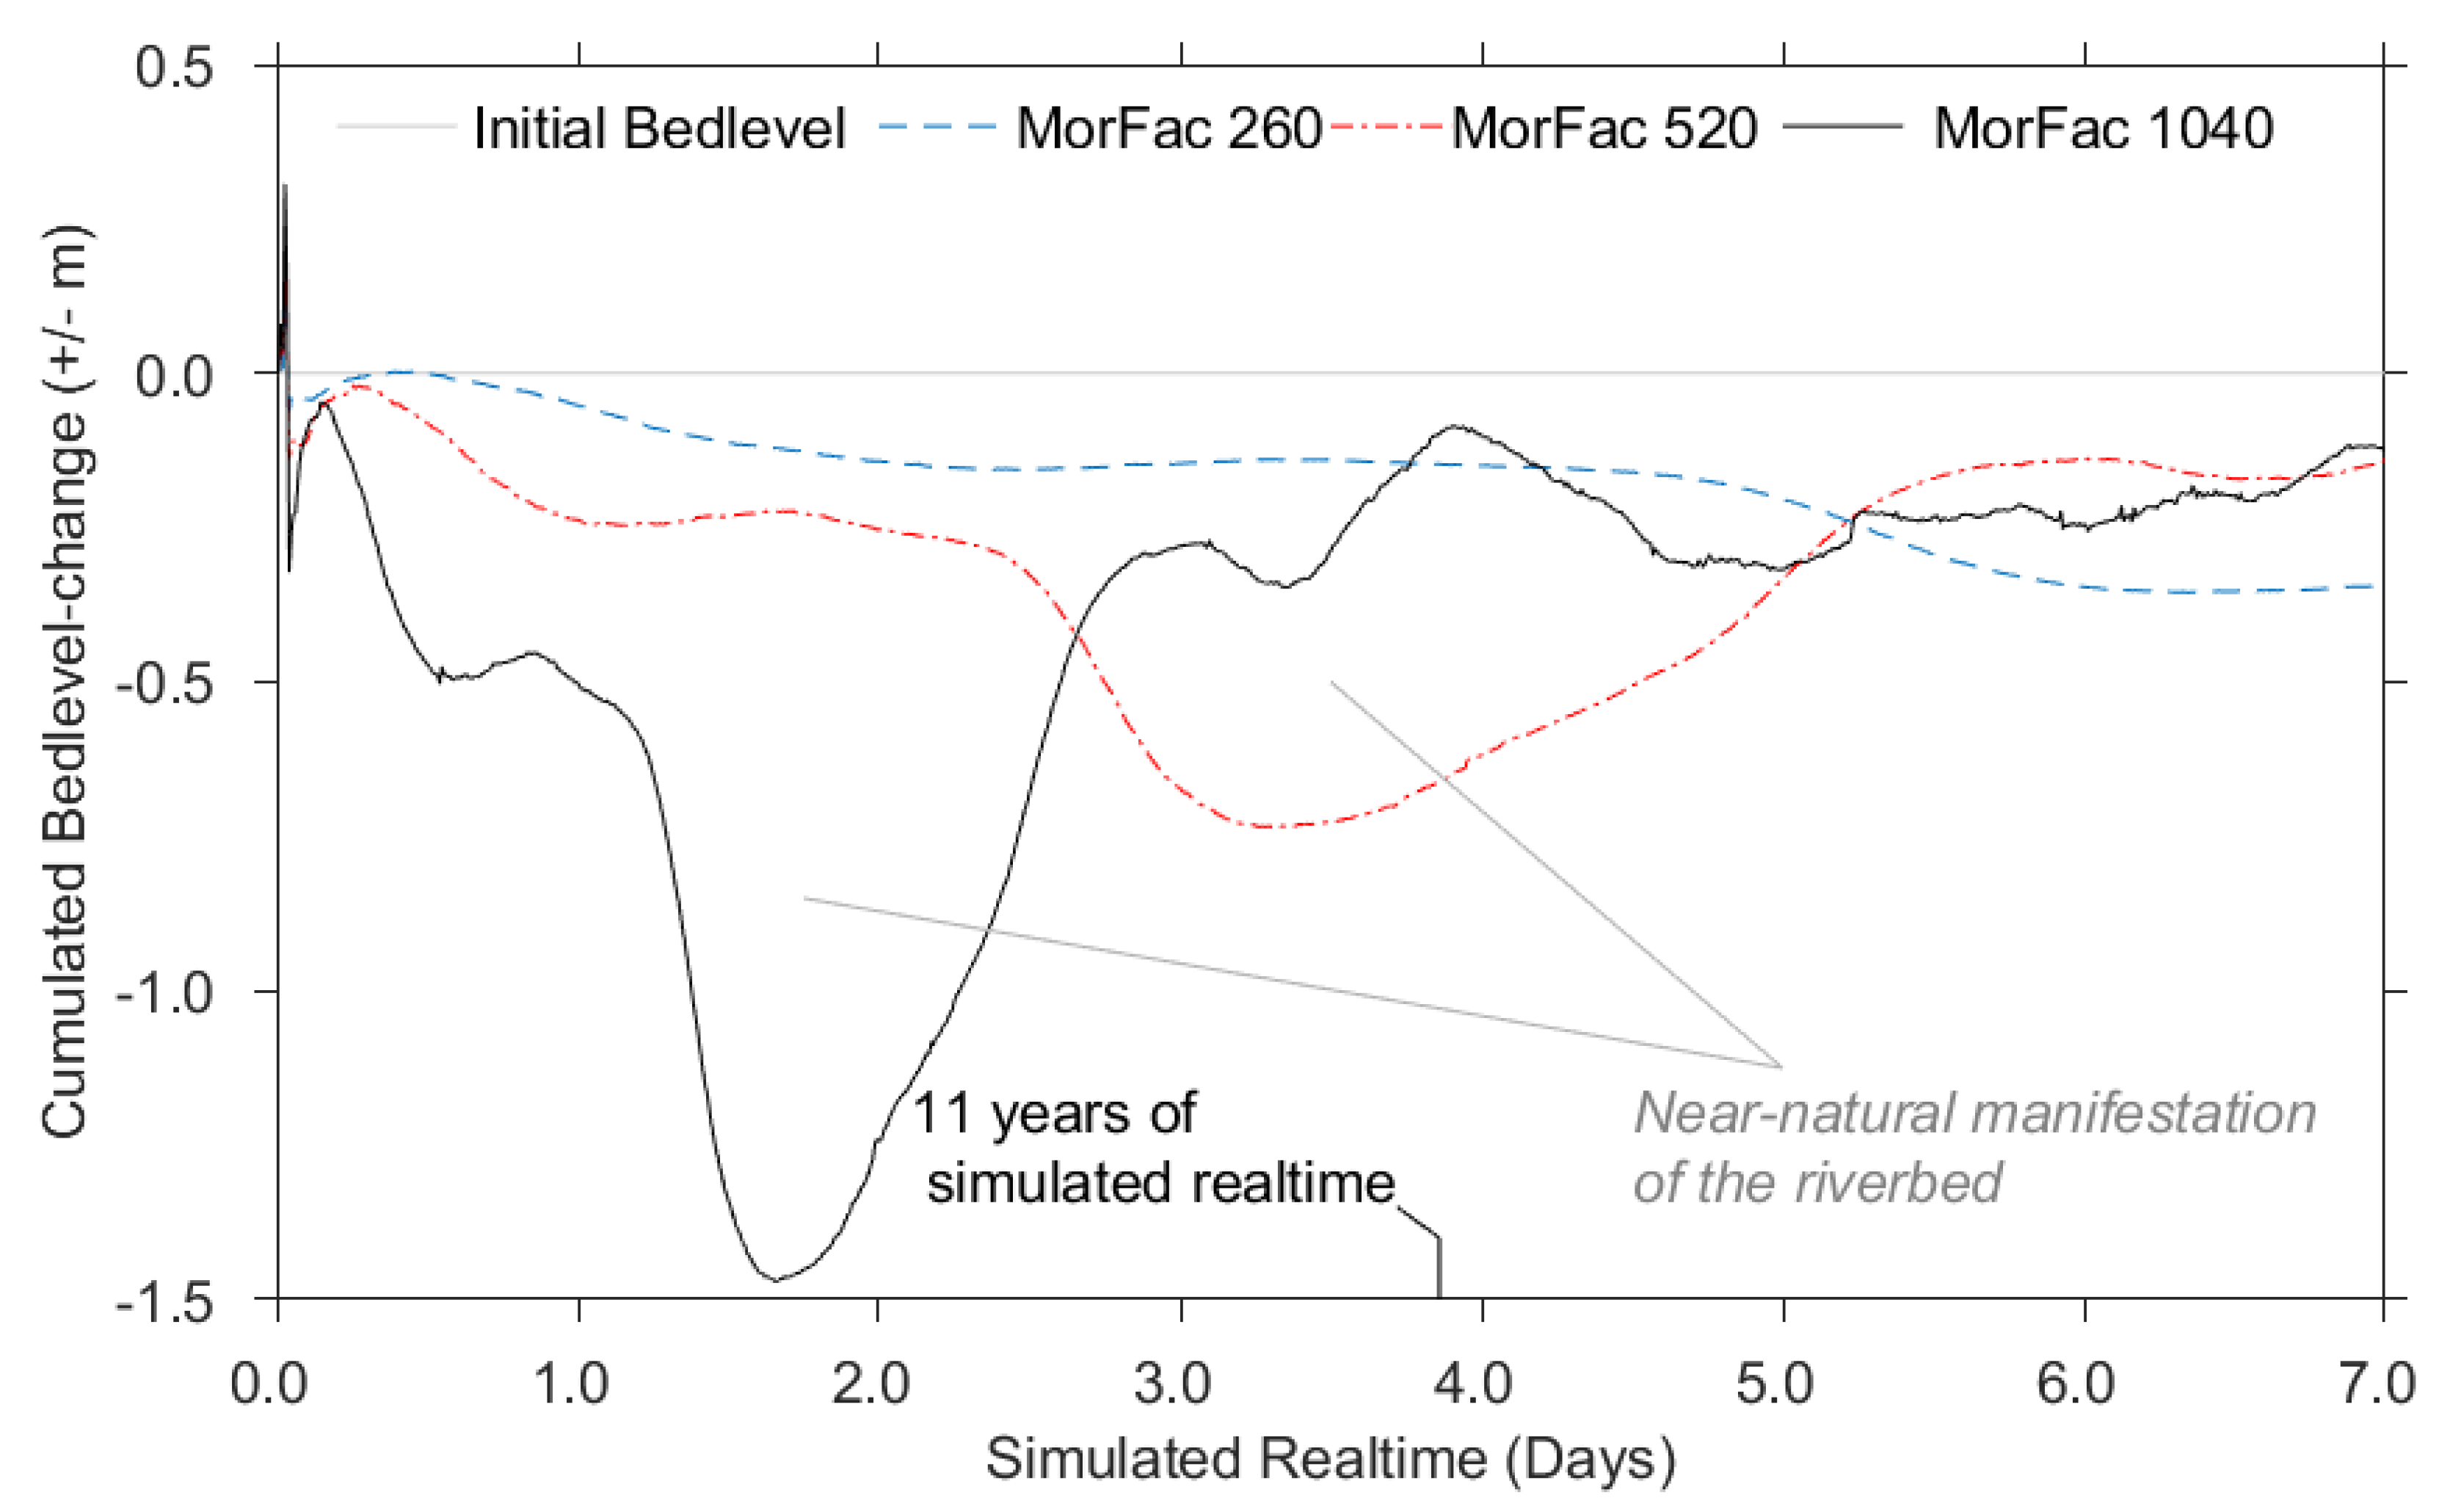
3.3.1. Morphodynamic Simulations of the Riverbed

Figure 9 presents the evolution of the cumulative bed level change for a set of different MorFac parameters used in Delft3D runs. It compares these bed evolutions to the initial bedlevel assumption used at the beginning of the simulation.
It can be observed that the cumulated bedlevel-change increases at the beginning of the simulation for all MorFacs or simulated morphological simulation times, respectively. Only in the simulation with the MorFac of 1040 it reaches a steady plateau afterwards indicating that morphological equilibrium has been reached. This point is reached at 3.8 days corresponding to morphological simulation time of 11 years.
It is hence assumed, that a MorFac of 1040 representing 20 years of morphodynamic evolution is sufficiently high and the resulting bathymetry is further examined, without any further evolution of the bed taken into account.
Figure 10 shows the initially assumed hypothetical riverbed including the bed modulations in greyscales. The erosion/sedimentation for morphodynamic modelling equivalent to 20 years of activity is given in red/blue color.
Gullies up to 4.00 m deep form in both river branches due to erosion. Along the single-branch section two channels develop, lined by sedimentation at the banks. Erosion induced terrain depressions reach 5.00 m down, with local maxima of 8.00 m . The in downstream direction left branch’s gully shows a wider cross-section than the other one. Moreover, directly in front of the harbour strong sedimentation occurs, reducing the local water depth up to 6.00 m . Additionally, the central river island is prolonged due to sedimentation at its tip. The initial modulations, though visible due to high gradients, have been smoothed out by the model during the course of the bed generation (see Figure 10).

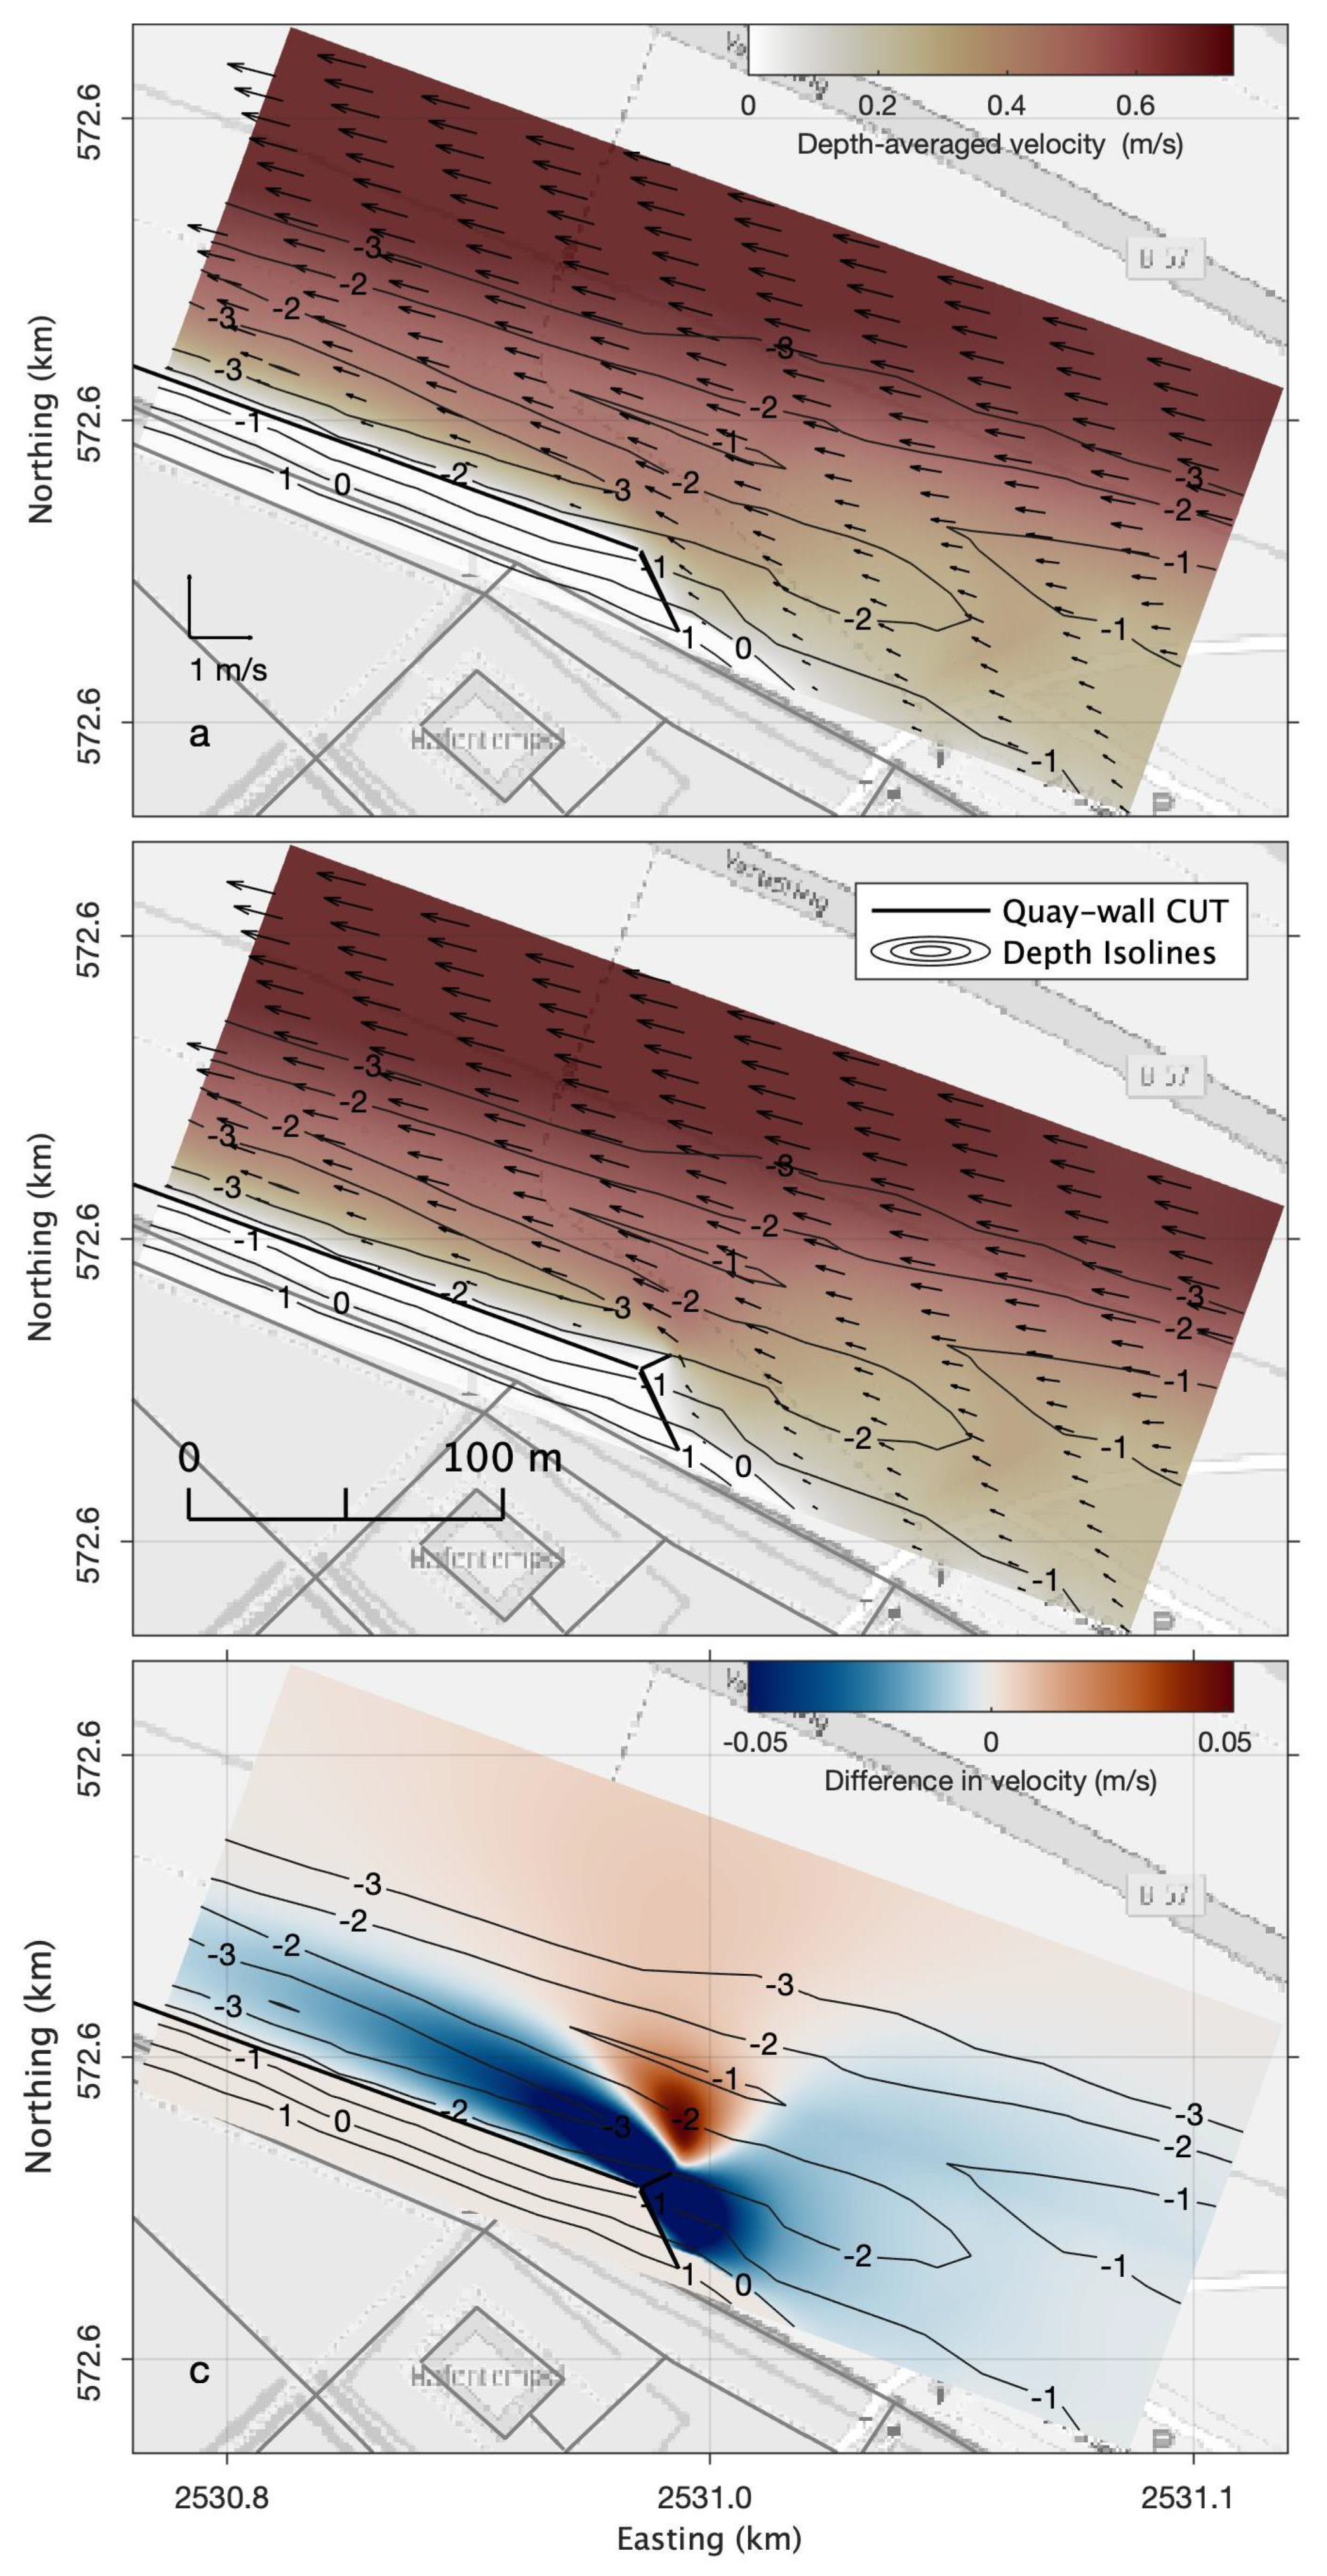
3.3.2. Structure Impact

Hydrodynamics along the harbour were simulated and examined in the wake of the structure.
The hydrodynamic influence of the hydraulic structures representing the quay wall shows to be of relevance only in close vicinity to the harbour. Consequently, the depth-averaged velocity in quay-wall vicinity is shown in Figure 11a for the case without CDW and another one with parametric structure given in Figure 11b beneath it. At the bottom, the velocity difference between these cases is given in Figure 11c. The 2DH flow field developing along the quay-wall, where the roughness induced turbulence effect of the vertical pillars is included by a linear loss term according to the findings of the physical and numerical flume models, without the addition of the protruding structure at its upstream tip shows velocities in excess of 0.5 m s 1 in the mainstream of the Rhine river. Nevertheless, near the river banks the velocity in the shallows is reduced to 0.3 m s 1 , whilst the quay-wall, realized as parametric structure, reduces the flow velocity to < 0.2 m s 1 along the river harbour of Xanten in the numerical simulations (see Figure 11a). Extending the results from the previous findings by additionally including the possible CDW, that was not yet examined in the physical or numerical flume models, implemented as a protruding wall into the stream at the upstream end of the quay-wall reveals a reduction of velocity up- and downstream of the structure in the vicinity to the river bank (see. Figure 11b). The area of maximal reduction of 0.05 m s 1 is located directly at the structure, with its impact extending all along the length of the quay-wall. Deflecting the oncoming water away from the bank towards the river axis slightly increases the current velocity in the main stream of the river. The numeric representation of the wooden structure protruding away from the upstream end of the quay-wall into the Rhine river at 45° stows the oncoming water, creating a backlog, which deflects the current towards the center of the river. The structure exhibits a discernible hydrodynamic influence on the flow field along the river harbour, reducing the simulated current velocities by as much as 0.05 m s 1 or 25% (see Figure 11c). The effect forms a wake like pattern downstream of the structure, affecting the complete quay-wall length and extending 50 m into the Rhine river. The overall flow pattern developing according to the numerical result, generally seem plausible regarding the flow field. A higher velocity in the entire remaining part of the river is generated, while the largest increase in velocity is directly adjacent to the obstacle in flow. That compares well to numerical modelling of the flow around a single groyne as performed in [56]. Even though the extend of maximal velocity varies with the channel width, the qualitative results correspond, indicating the validity of the numerical modelling performed. For the interpretation of the results is important to keep in mind that the depicted velocity field not only accounts for the effect of the harbour structure, but also the generated bathymetry, which possibly has a biasing effect on the results. The implementation of the structure unearthed by the archaeologists into the numerical model alters the flow patterns showcasing the impact of the potential CDW.

4. Discussion

Results presented and described in the previous Section 3 are obtained with different methods using a variety of field and research data, presented in Section 2. This section deals with the assumptions and caveats, that were encountered within the three different segments of the physical model tests described in Section 3.1, the complimentary numerical flume tests from Section 3.2 and the resulting numerical model of the Rhine river stretch with the CUT in Section 3.3.

4.1. Physical Model Tests

Physical model tests conducted in the oval current-flume [34] serve as basis for assigning a research based loss coefficient to the wooden quay-wall type found at the Roman Rhine river harbour in Xanten for further numerical investigations. While quay-walls are a common feature of modern day hydraulic engineering [33], wooden structures and their roman construction particularities, such as up-right stacked planks clamped between oaken pillars for support [1,57], are not, necessitating this step. Both, the original and the model used roughly cut wood. In difference to the original structure, the surrogate model was constructed using pine instead of oak due to availability. Given the relatively short period of its exposure to water for a couple of hours any potential detrimental effects due to soaking and swelling were prevented. Where the original structure was held together by faucet joints and nails, the pine model was assembled using wood screws with countersunk heads, ensuring no screw heads influence the flow field on the tested front side, potentially distorting the results. A potential caveat presents the lateral extent of the current-flume. With a width of 1 m the opposing wall could be too close for the measurements not to be influenced/distorted by potential wall-effects. Nevertheless, this circumstance was accounted for by the subsequent NFM. Measurement positions for the cross-section were taken near the end of the quay-wall model, assuming that due to the flow distance the flow field has developed to its fullest, preventing initial turbulence from distorting the results. The longitudinal section was placed at a distance of 0.15 m from the model quay-wall. This was done to allow the ADV to move along the model without lateral displacements of position due to the vertical support pillars. The results clearly show, that across the channel the influence of the wall extends.

4.2. Numeric Flume Tests

A conceptual NFM of the physical facility was developed using Delft3D (see Figure 4d), to investigate the representation of the roughness in a numerical model and allow for a later implementation in the river model. It was chosen to compare the depth-averaged velocity of the physical experiments to the numerical outcome, seeing that this would allow an evaluation of the velocity distribution better than just calculating the mean difference, but more precisely than comparing the three-dimensional data. Comparing the results of three dimensional calculations and simulations performed in 2DH-mode for the given case of the simple conceptual flume model, showed that no difference in the depth averaged velocity resulted from the different approaches. As a consequence 2DH mode was applied for the simulations of the conceptual flume with respect to the computational ressources required. The physical measurements were depth averaged according to Equation (1).
The influence of the opposing wall was expected to be large in the physical experiments with respect to the dimensions of the experimental facility. This was accounted for in the numeric tests through wall-roughness conditions for the concrete surface using a roughness length of 0.024 m [42] in the upscaled NFM. Comparison with the measurements in the empty flume showed good agreement. This means the additional roughness induced by the wooden wall is well reproduced already taking into account the distortions of the physical experiments. In the river model (see Section 3.3) this influence is not present. Thus, it can be expected, that the same loss induction has a different effect on the velocity distribution, than in the restricted channel. This was verified by checking how an incrementally increasing width of the flume and a corresponding diminished influence of the opposing wall affect the velocity distribution. The outcome showed as expected, that the influence of the quay wall increases with diminishing influence of the wall roughness, up to a width of 21.78 m . It can be concluded that the loss coefficient transferred from the PFM measurements to the NFM is considering the wall effects correctly. Furthermore, the numerical model accounts for the width related influences and accordingly reduces these with increasing channel size. Therefore, the experimentally determined coefficient was successfully transferred to the large scale numeric model of the CUT harbour. The representation of hydraulic structures as parametric function, meaning no actual structure but roughness inducing linear loss coefficient, is an established method in mid- to large-scale numeric models [29,30,31,42].

4.3. Numeric River Model

Finally, a mid-scale numeric model of a Rhine river bend harbouring the CUT with it’s quay-wall has been developed (see Figure 11), using the previously determined loss coefficient from the PFM and NFM experiments (see Section 3.1 and Section 3.2). The model is comprised of two domains, this allows for increasing the resolution near the hydraulic structures of interest, while reducing the overall calculation effort for the model. The upstream boundary of the model was discharge forced using re-analysis data of the ancient Rhine river for this region during normal flow [49] in combination with a water level boundary downstream to maintain numeric stability [42,58].
The drilling depth to extract cores was based on the former hypothesis of the harbour being located at an inactive river branch. As a consequence 38.5% of the cores extracted do not penetrate the crucial underlying gravel layer. From this data the cut bank can be reconstructed with depths up to 9.0 m . In the area of the slip-off bank the bottom of the cores is assumed as the riverbed and extrapolated on the cross-section. Since this only represents the minimal water depth, a higher value can not be excluded. For the surrounding bathymetry, ancient reports indicate a water depth of 1.5 m [49]. The discrepancy between this value and the maximal water depth indicated by the drill cores seems to big and physically implausible. The depths indicated by the drill samples are extrapolated, leading to a value of 3 m for the regions up- and downstream. The location at a main branch also makes a reevaluation of the horizontal expansion of the river necessary. While former assumptions included up to three branches at the location of the CUT the latest findings [59,60,61] indicate a single branch that splits into two ones near the location of the CUT.
The bathymetry of the ancient Rhine river was generated using established morphologic evolution methods [51,52,53,54,55], in combination with field data to obtain a physically based near-natural river bed for further investigations. In absence of bed slope data for the Roman period, present day values are used, assuming that the larger terrain of the Middle Rhine valley has not experienced significant elevation changes in the past [46]. Constant boundary-conditions result in a quasi-stationary flow-state with no changes in water level or velocity and near-constant flow patterns alongside the quay-wall. Due to the uncertainties regarding the river course, depth and slope, the model can only approximate the historic state, based on the latest findings in combination with well founded assumption [49]. With regard to the morphological development, varying discharge conditions would represent the typical regime of a natural river more accurately, since floods are a big driver of sediment resuspension. This has not been done in this study, since the currently available data does not cover any such events [49]. An increased uncertainty would otherwise be the consequence, since the available data does not support a more precise estimation of the ancient regime at this time. For the case any progress is made on the hydrologic estimation of extreme events at the specific location an inclusion of a yearly hydrograph in the morphodynamic simulations come into reach, probably yielding interesting results. As the harbour is likely supposed to be operated during day-to day conditions, no benefit of an advanced analysis regarding the boundary conditions is expected on this part of the examination.
The quay-wall is represented as parametric structure, similar to the NFM (see Section 4.2). Implemented as river-parallel hydraulic structure with a length of 200 m and additional barriers angled towards the river bank, blocking flow between the quay-wall and the river bank to avoid unwanted scouring inside the quay. Construction induced flow resistance from oaken poles was accounted by the derived loss term throughout its length, which is based on the physical and numerical experiments outlined in Section 3.1 and Section 3.2. Limitations given for the PFM and the NFM apply to this model as well, being based on previous experiments.
Nevertheless, the experimentally determined loss coefficient, numerically transferred and up-scaled, reduces the along-quay current as expected with an impact comparable to results from the PFM and NFM experiments (cp. Section 3).
Additionally, the unique structure at the up-stream tip of the quay-wall unearthed by archaeology, was investigated using the numerical model. The quasi-steady flow conditions allow for assessing structure related impacts. The opaque structure is represented by thin dams in Delft3D, protruding from the quay-wall into the Rhine river at 45°, creating a quiescent area in its wake along the berthing area of the river harbour, reducing the flow by as much as 25% (see Figure 11b). The structure is possibly longer than the original roman one, overemphasizing the absolute velocity reduction. The qualitative effect is independent from this value. This impact compares well to present day CDWs [29,31,33] suggesting the intended functionality of this hydraulic Roman structure was to create a quiescent berthing area in its wake for the ease of docking and navigating. A substantial reduction of the local flow velocity can be ascertained, as a consequence of the loss induced by the jetties form-roughness.
Roman engineers are famous for their advanced engineering methods and their understanding of hydraulic processes. Even though their set of methods did not include any of the methods we nowadays have within our toolboxes, their creativity allowed for a design of harbour structures surprisingly modern and intentionally well adapted to the intended function of a harbour. This illustrates how even with simple mathematical methods a presumable mix of rough calculations, close observation of physical processes and the willingness to try out progressive design approaches commit to technical evolution and facilitate the operations necessary for trade and everyday-life. The fascination for the achievements made in the field of engineering continue to be impressive and can still inspire modern engineers to develop creative solutions within an environment of integrated curiosity on the interaction of engineered design with the natural world.

5. Conclusions

A novel cross-scale multi-model approach was developed and successfully applied, to reconstruct possible historic Rhine river characteristics and to investigate the hydrodynamic influence of a wooden quay-wall structure at the CUT river harbour from the Roman period, yielding the following conclusions:
-
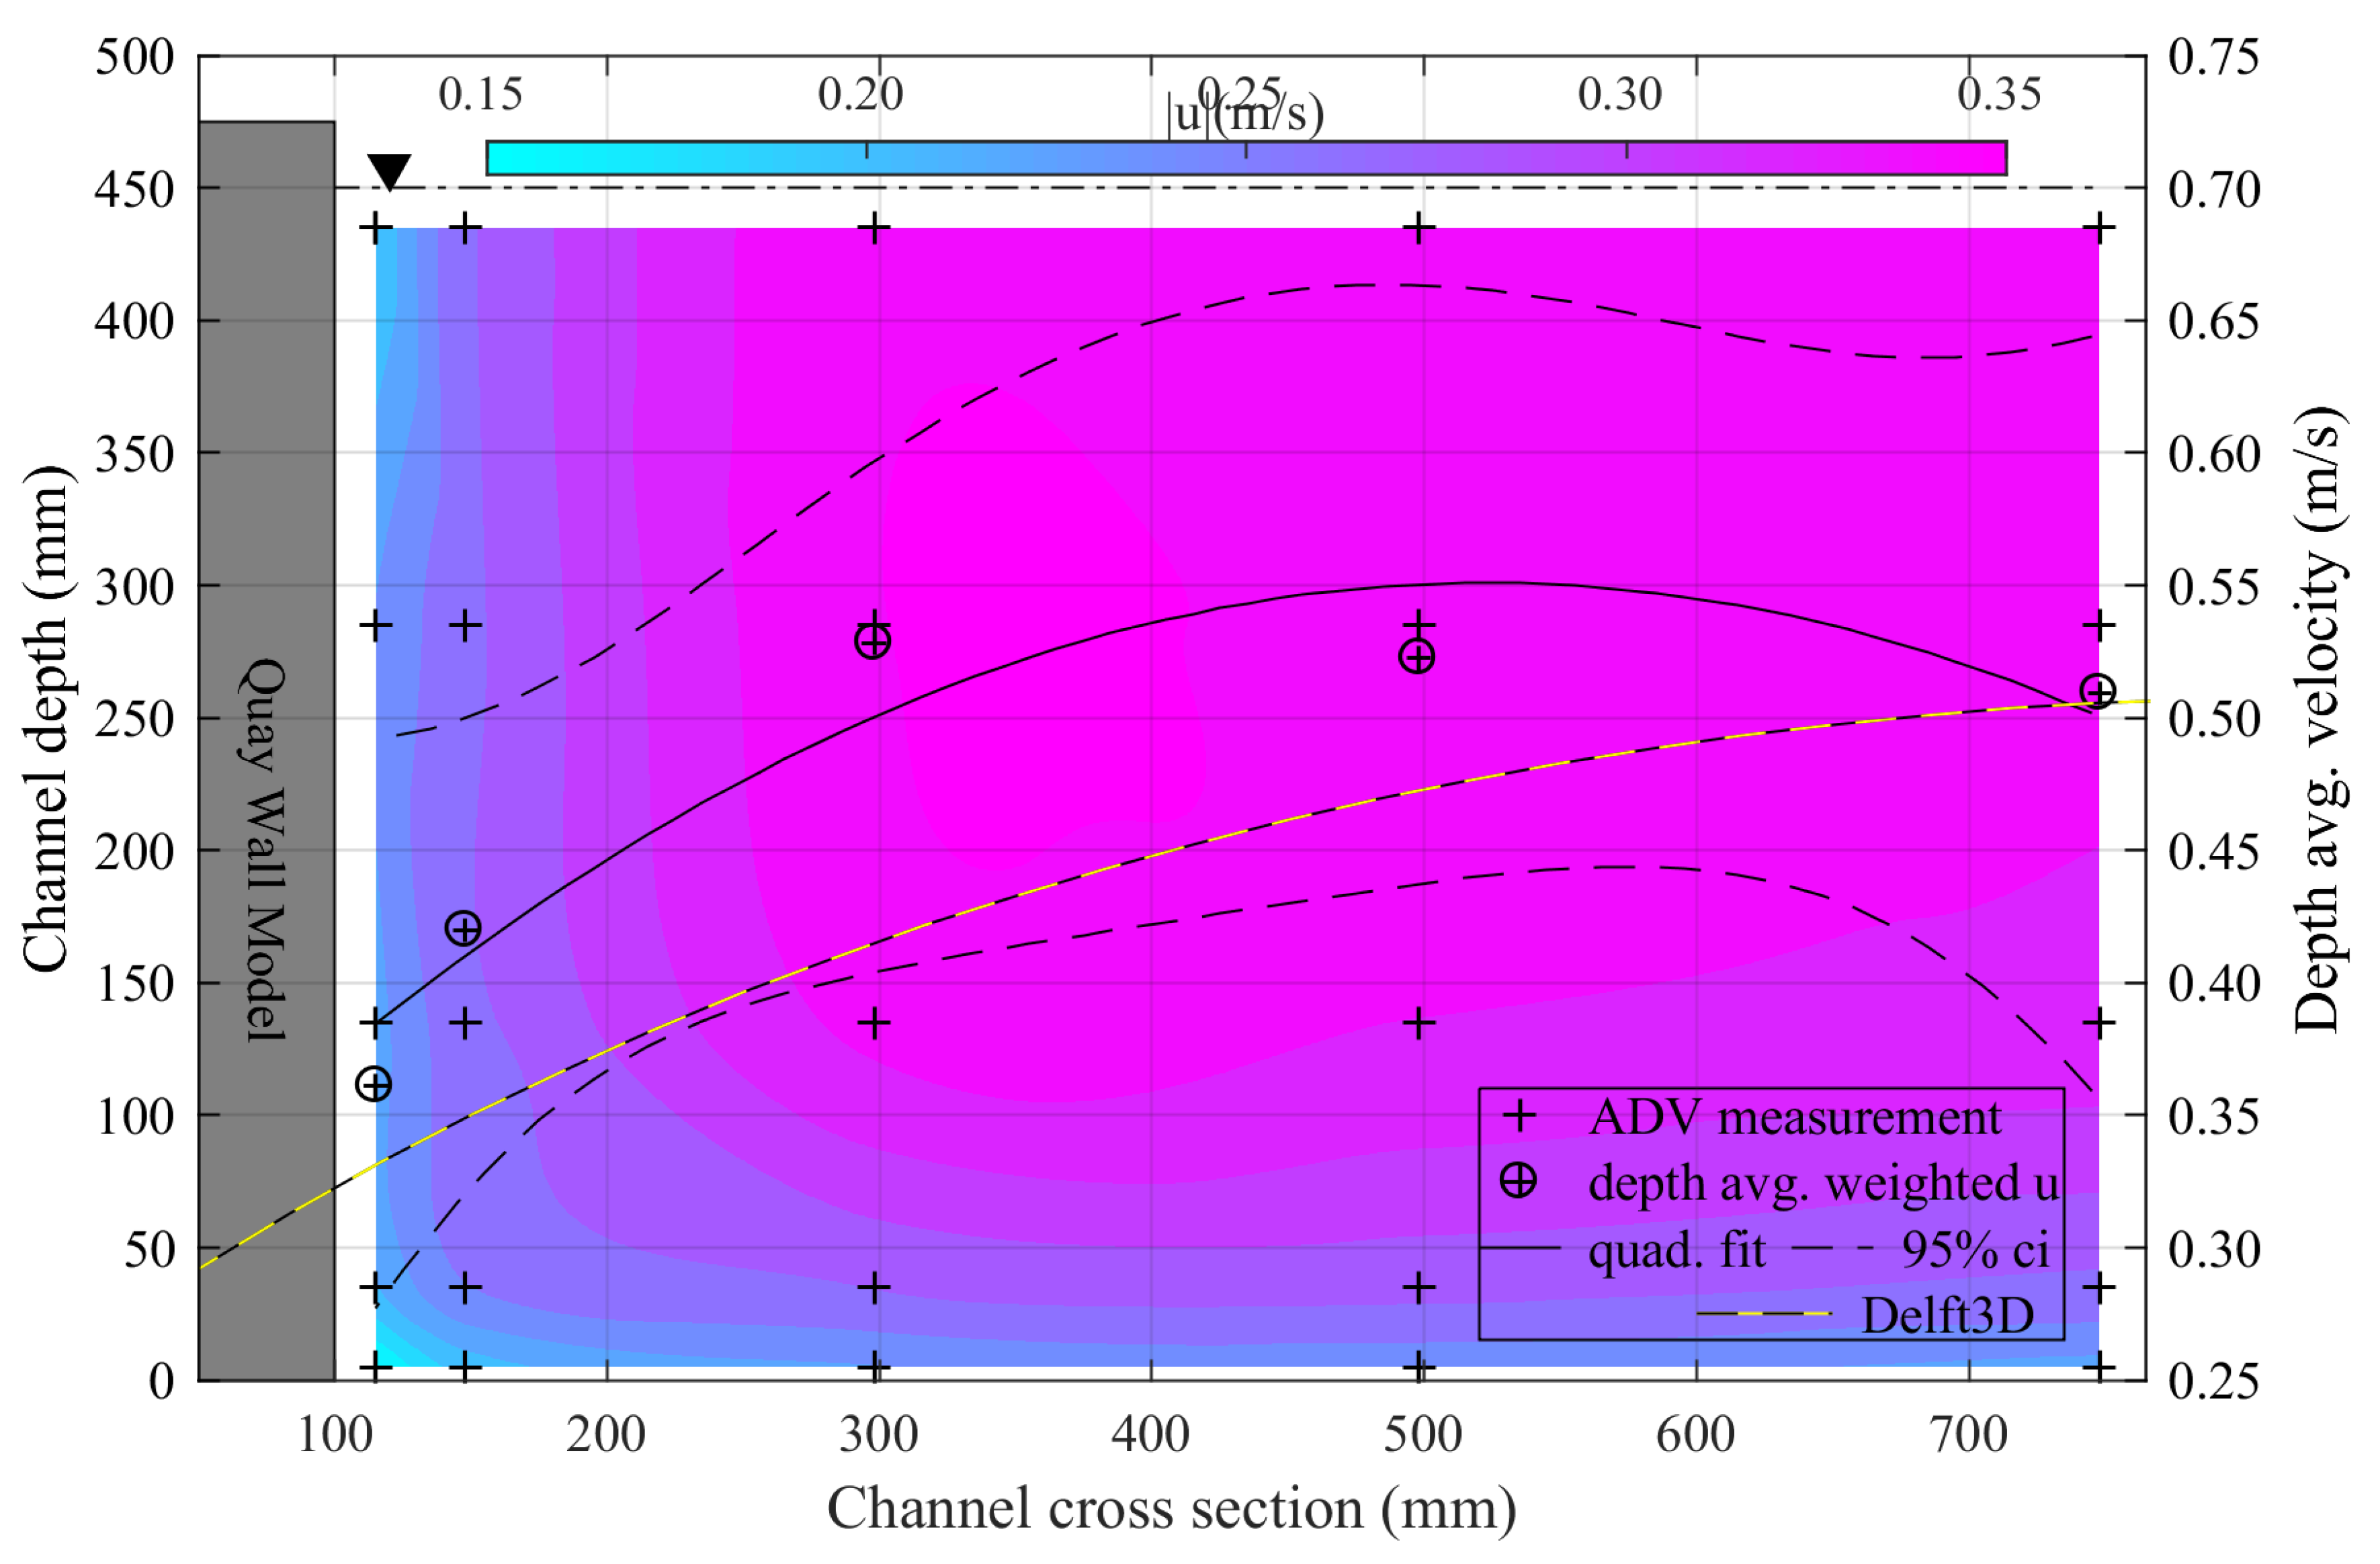
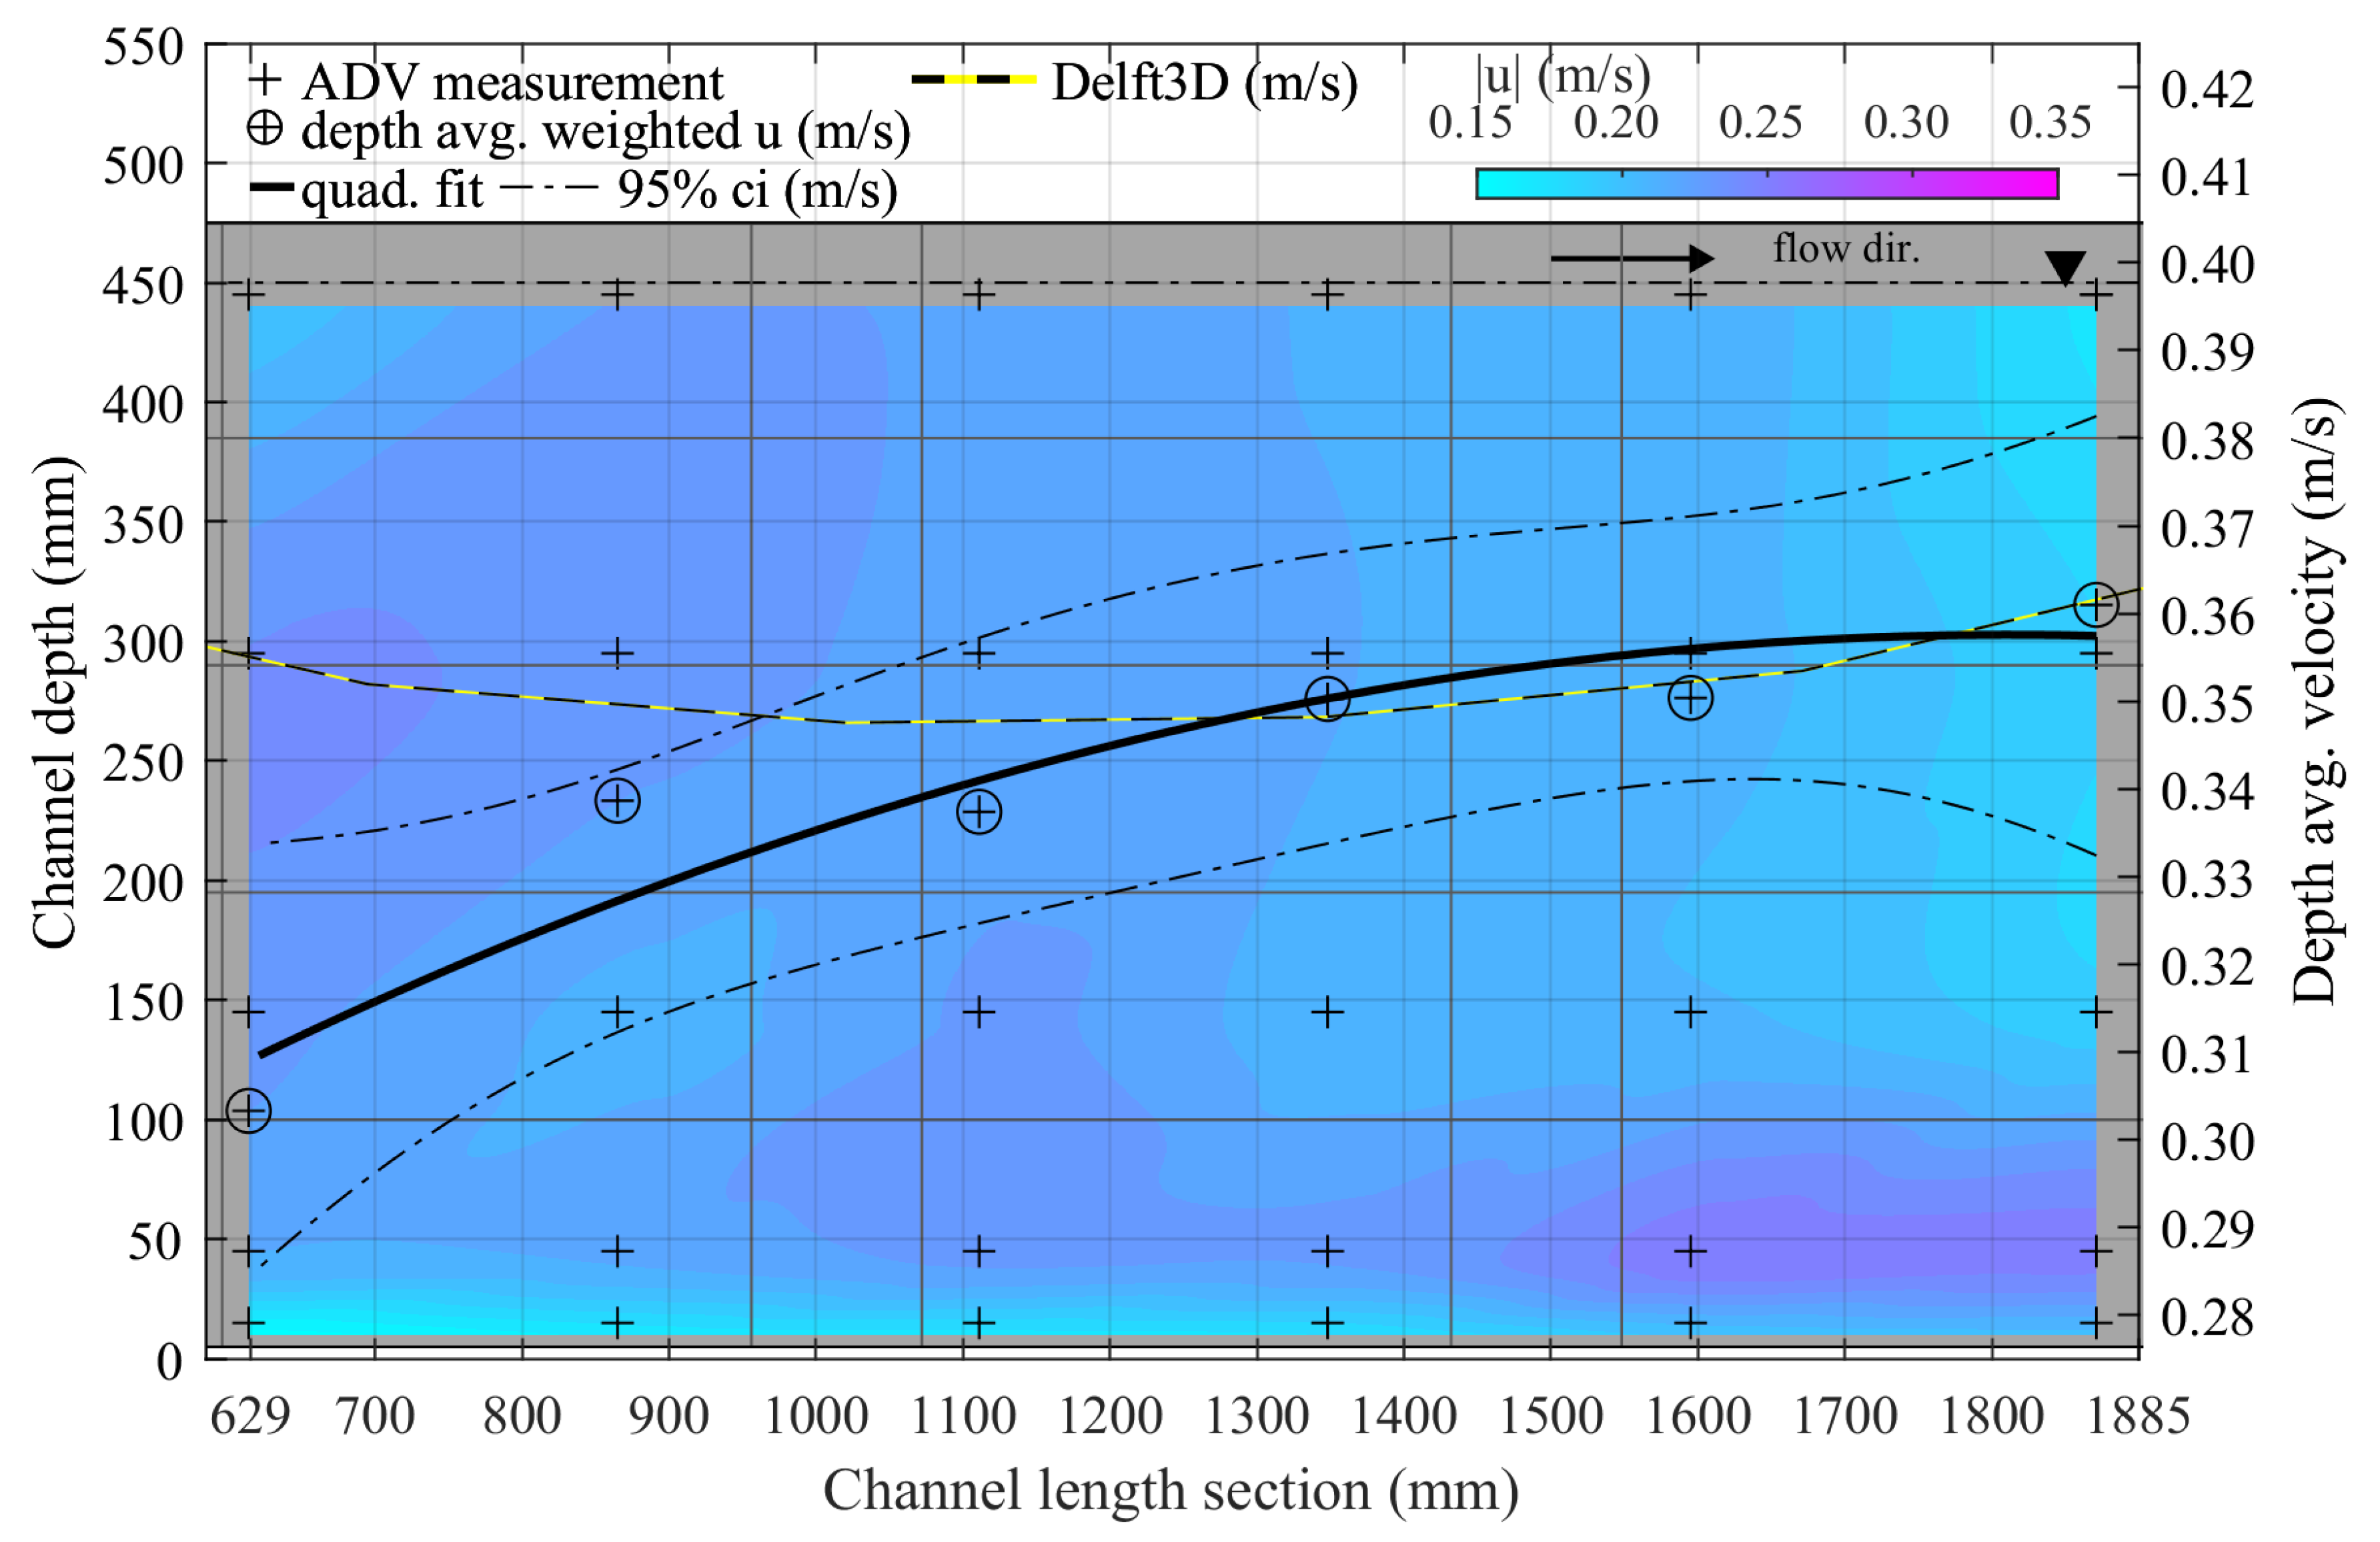
A scaled physical model was constructed according to archaeological findings and installed in a hydraulic test facility to measure roughness induced reduction of flow on a longitudinal and a crosswise transect at five vertical levels. A substantial reduction of 30% near the wall is observed.
-
Measurements are compared against a conceptual numerical twin model of the physical laboratory experiments using Delft3D. This shows that the experimental velocity distribution can be reproduced well employing a linear friction loss a term with a loss coefficient of 10.
-
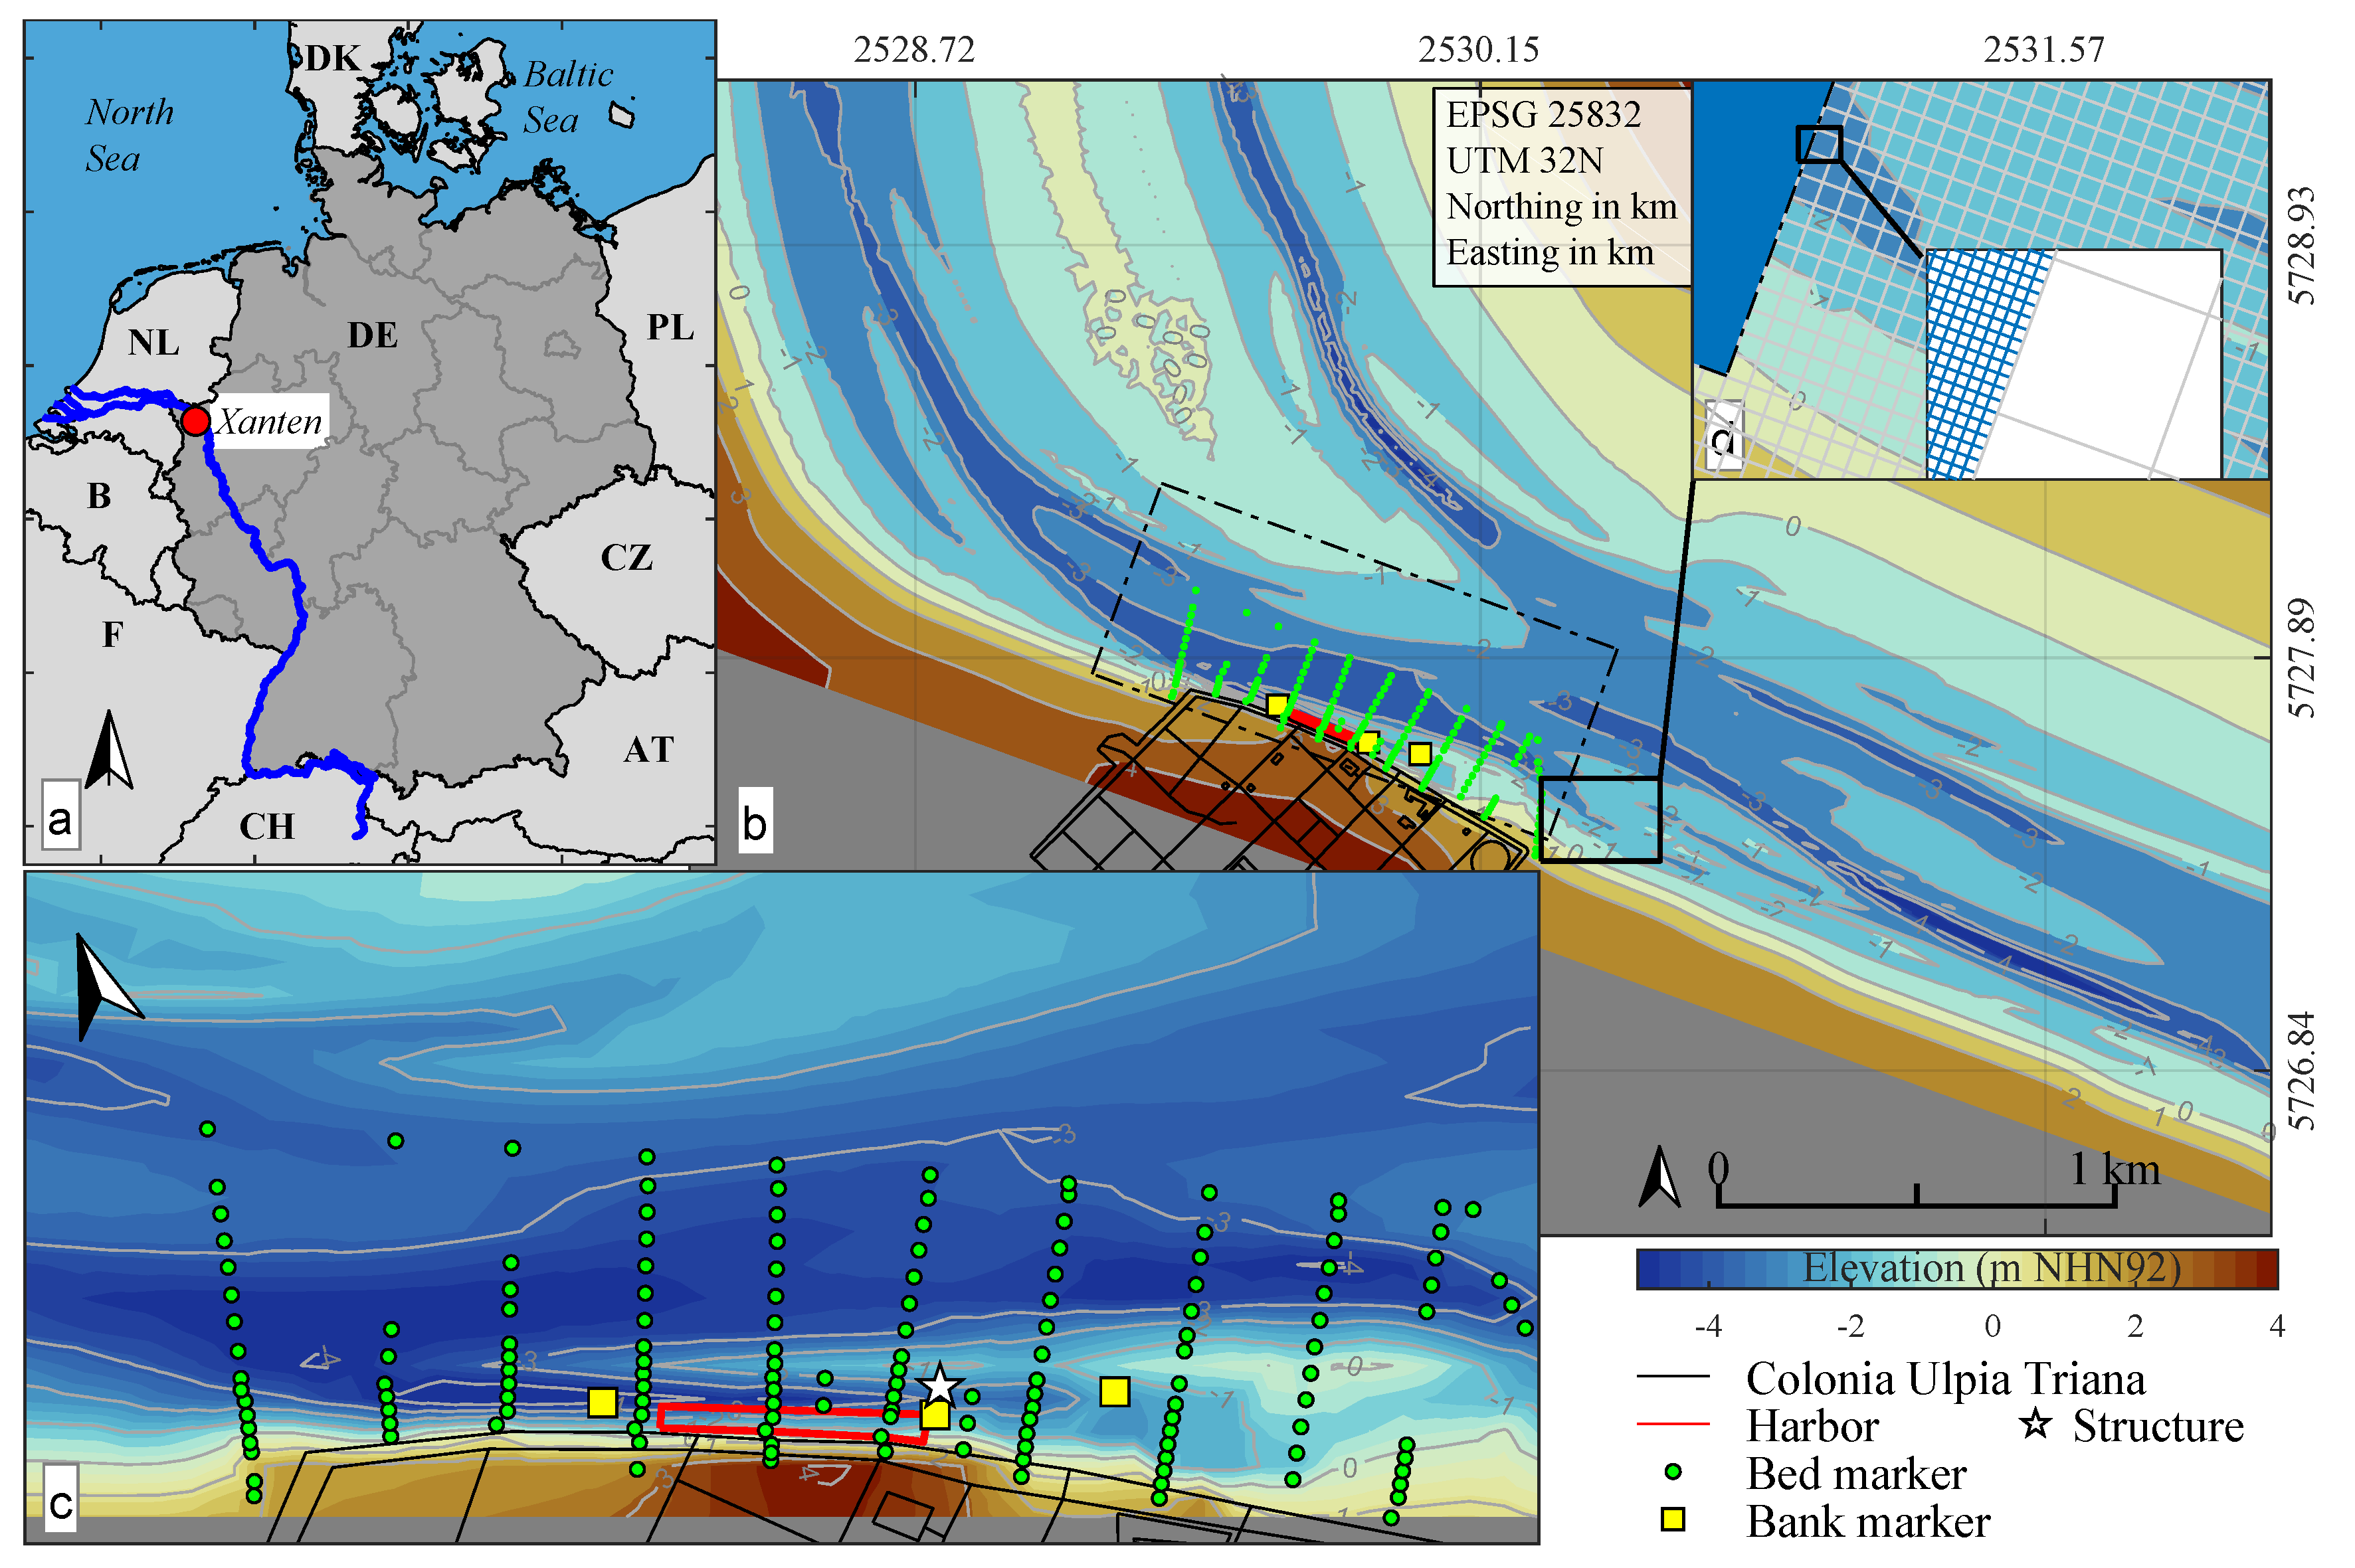
Combining (i) field data from the excavation site and the results from dendrochronological investigations of the wooden quai with (ii) hydrological re-analysis data for the historic Rhine river discharge regime and (iii) state of the art numerical engineering methods, a 2DH model of the Rhine river section harbouring the CUT with the Roman type wooden quay-wall is developed. The calibrated model reproduces near-natural historic hydrodynamic conditions, depicting a possible realization of the flow field along the Roman river harbour during normal flow.
-
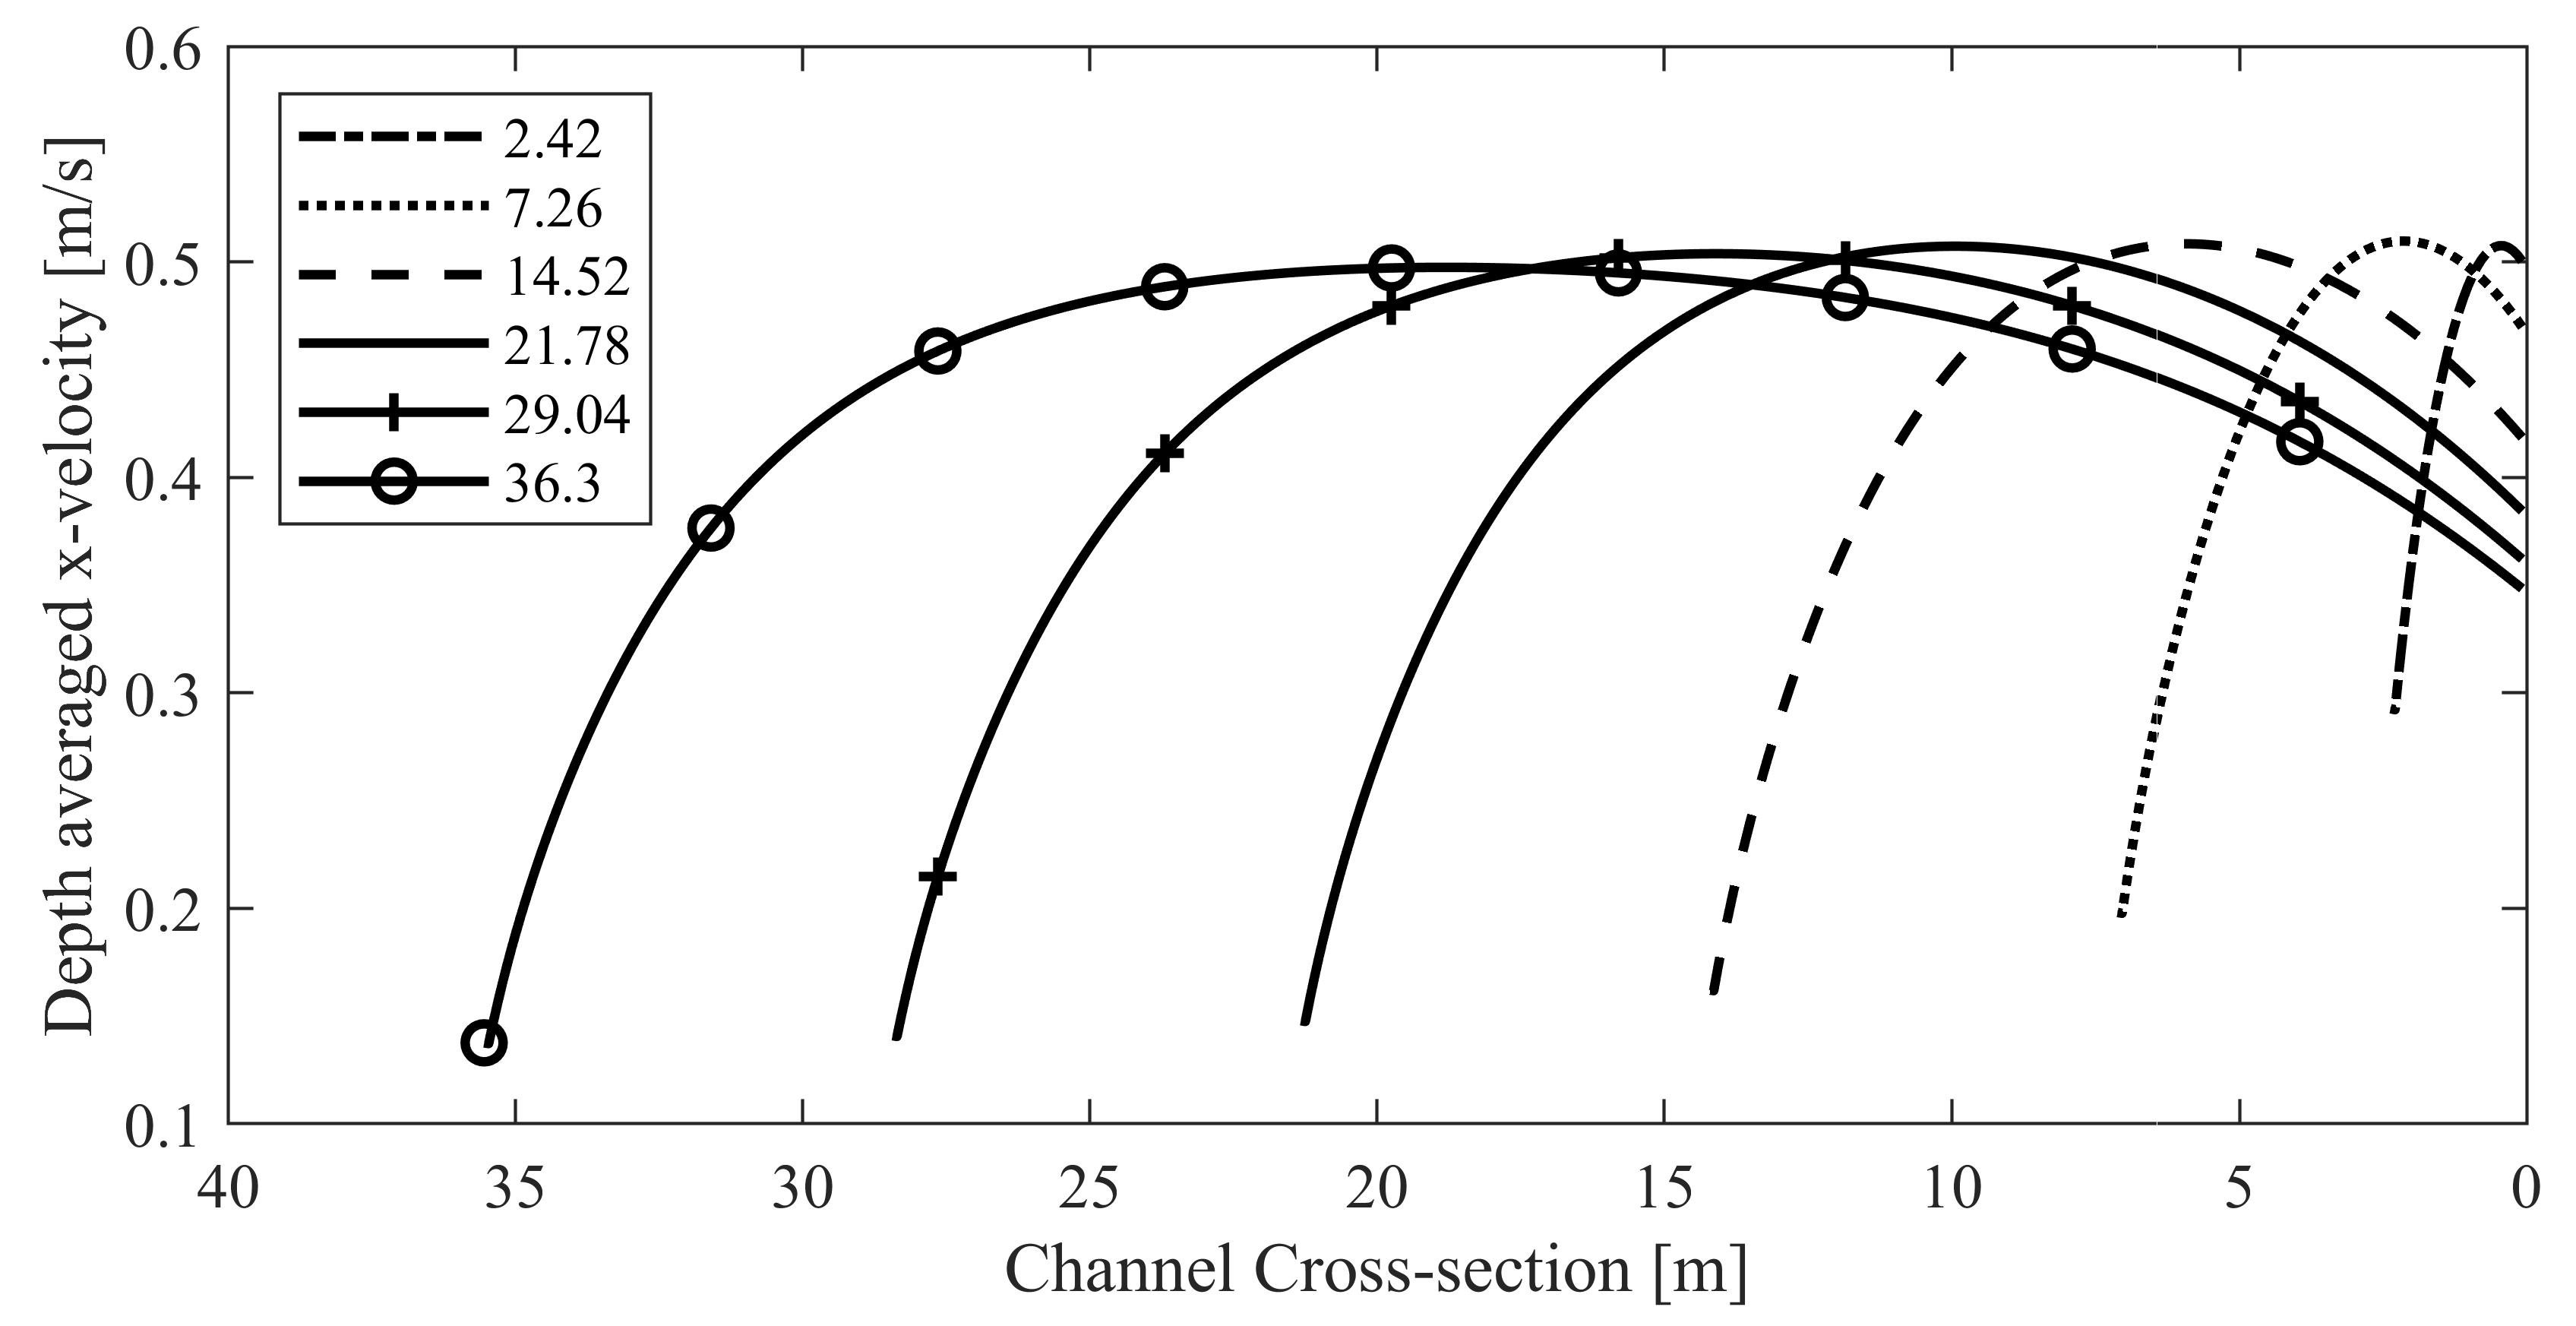
The wooden quay-wall is numerically represented in a parametric form endued with the experimentally determined loss coefficient of 10. Consequently, the numerical Rhine river model correctly maps the 200 m long parametric structure, which projects its roughness related hydrodynamic influence with digital exactitude into the adjacent water body. Consistently it can be inferred, that the wooden Roman jetty was successfully assessed and its hydrodynamic impact effectively reproduced using state of the art methods.
-
Finally, the unique wooden structure unearthed at the upstream tip of the jetty protruding into the river was included in the 2DH Rhine river model to unravel its functionality with scientific acuteness. Substantiated by testing various lengths at 45° obviating coincidental results, it is revealed that the structure exerts the hydrodynamic impact similar to a current-deflection-wall. With a degree of efficiency reducing current speeds by up to 25% or 0.15 m s 1 to 0.20 m s 1 in its wake along the quay-wall, the Roman hydraulic structure rivals present day designs.
Physical and numerical methods were successfully used to recreate hydrodynamic conditions at a historic site and allowed for the densification of knowledge at this archaeologically extensively researched location. Further questions concern the relation of the man-made structures and the morphodynamic activity of the river. In this light the possible need for maintenance work regarding reliable navigation or structural stability are interesting points to be toggled. While the uncertainty regarding seasonal fluctuations of the river remains high, potential realizations are of interest for other research fields such as ancient ship building and navigation research tapping into logistics and supra-regional trade routes or hydraulic engineering regarding potential siltation problems and maintenance of the harbour.

Author Contributions

Investigation, L.-C.D.; visualization, L.-C.D. and O.L.; writing—original draft preparation, L.-C.D., O.L. and V.S.; conceptualization, L.-C.D., O.L., V.S., N.G., R.G; Methodology, L.-C.D., O.L., N.G.; data curation, V.S., R.G.; writing—review and editing, N.G., R.G.; supervision, N.G. and R.G. All authors have read and agreed to the published version of the manuscript.

Funding

This research received no external funding.

Acknowledgments

The authors would like to thank the LVR-Archaeological Park Xanten for their hospitality during meetings and the provision of data, the Leibniz University Hanover for the possibility to use the experimental facilities and the Technische Universität Braunschweig for the financial support to publish these results.

Conflicts of Interest

The authors declare no conflict of interest.

Abbreviations

The following abbreviations are used in this manuscript:
ADVacoustic Doppler velocimeter
CDWcurrent deflection wall
ciconfidence interval
RGSrigid sheet
CUTColonia Ulpia Traiana
MorFacmorphologic acceleration factor
NFMnumerical flume model
PFMphysical flume model
NRMnumerical river model
NHN16normal height null 2016 (in m)
SNRsignal-to-noise ratio (in %)
DDdomain decomposition
SWLstill water level

References

  1. Merckel, C. Die Ingenieurtechnik im Alterthum; Springer: Berlin, Germany, 1899. [Google Scholar]
  2. Tölle-Kastenbein, R. Antike Wasserkultur; Beck’s archäologische Bibliothek, Beck: München, Germany, 1990. [Google Scholar]
  3. Oleson, J.P.; Brandon, C.; Cramer, S.M.; Cucitore, R.; Gotti, E.; Hohlfelder, R.L. The ROMACONS Project: A Contribution to the Historical and Engineering Analysis of Hydraulic Concrete in Roman Maritime Structures. Int. J. Naut. Archaeol. 2004, 33, 199–229. [Google Scholar] [CrossRef]
  4. Brandon, C.; Hohlfelder, R.L.; Oleson, J.P.; Stern, C. The Roman Maritime Concrete Study (ROMACONS): The harbour of Chersonisos in Crete and its Italian connection. Méditerranée 2005, 2005, 25–29. [Google Scholar] [CrossRef]
  5. Hanel, N. Die Militärlager von Vetera I und ihre Lagersiedlungen. In Colonia Ulpia Traiana; Müller, M., Ed.; Eine Veröffentlichung des Landschaftsverbandes Rheinland, LVR—Archäologischer Park Xanten/LVR—RömerMuseum, von Zabern: Mainz am Rhein, Germany, 2008; pp. 93–107. [Google Scholar]
  6. Schmitz, D. Das Lager Vetera II und seine Legionen. In Colonia Ulpia Traiana; Müller, M., Ed.; Eine Veröffentlichung des Landschaftsverbandes Rheinland, LVR—Archäologischer Park Xanten/LVR—RömerMuseum, von Zabern: Mainz am Rhein, Germany, 2008; pp. 141–170. [Google Scholar]
  7. Precht, G. Das Forum. In Colonia Ulpia Traiana; Müller, M., Ed.; Eine Veröffentlichung des Landschaftsverbandes Rheinland, LVR—Archäologischer Park Xanten/LVR—RömerMuseum, von Zabern: Mainz am Rhein, Germany, 2008; pp. 341–353. [Google Scholar]
  8. Eck, W. Die Gründung der Colonia Ulpia Traiana in ihrem politischen Kontext. In Colonia Ulpia Traiana; Müller, M., Ed.; Eine Veröffentlichung des Landschaftsverbandes Rheinland, LVR—Archäologischer Park Xanten/LVR—RömerMuseum, von Zabern: Mainz am Rhein, Germany, 2008; pp. 243–255. [Google Scholar]
  9. Erdrich, M. Der “Repräsentationsbau”—Überlegungen zum Charakter der Bebauung der Doppelinsula 11/18. In Colonia Ulpia Traiana; Müller, M., Ed.; Eine Veröffentlichung des Landschaftsverbandes Rheinland, LVR—Archäologischer Park Xanten/LVR—RömerMuseum, von Zabern: Mainz am Rhein, Germany, 2008; pp. 355–359. [Google Scholar]
  10. Kienzle, P. Die zivile Wohnbebauung in der CUT. In Colonia Ulpia Traiana; Müller, M., Ed.; Eine Veröffentlichung des Landschaftsverbandes Rheinland, LVR—Archäologischer Park Xanten/LVR—RömerMuseum, von Zabern: Mainz am Rhein, Germany, 2008; pp. 413–432. [Google Scholar]
  11. Müller, M. (Ed.) Colonia Ulpia Traiana; Eine Veröffentlichung des Landschaftsverbandes Rheinland, LVR—Archäologischer Park Xanten/LVR—RömerMuseum, von Zabern: Mainz am Rhein, Germany, 2008. [Google Scholar]
  12. Müller, M. Die Stadtmauer der CUT. In Colonia Ulpia Traiana; Müller, M., Ed.; Eine Veröffentlichung des Landschaftsverbandes Rheinland, LVR—Archäologischer Park Xanten/LVR—RömerMuseum, von Zabern: Mainz am Rhein, Germany, 2008; pp. 277–290. [Google Scholar]
  13. Müller, M. Das Amphitheater. In Colonia Ulpia Traiana; Müller, M., Ed.; Eine Veröffentlichung des Landschaftsverbandes Rheinland, LVR—Archäologischer Park Xanten/LVR—RömerMuseum, von Zabern: Mainz am Rhein, Germany, 2008; pp. 361–372. [Google Scholar]
  14. Precht, G. Das Kapitol. In Colonia Ulpia Traiana; Müller, M., Ed.; Eine Veröffentlichung des Landschaftsverbandes Rheinland, LVR—Archäologischer Park Xanten/LVR—RömerMuseum, von Zabern: Mainz am Rhein, Germany, 2008; pp. 291–310. [Google Scholar]
  15. Precht, G. Die früheste römische Besiedlung im Gebiet der späteren CUT. In Colonia Ulpia Traiana; Müller, M., Ed.; Eine Veröffentlichung des Landschaftsverbandes Rheinland, LVR—Archäologischer Park Xanten/LVR—RömerMuseum, von Zabern: Mainz am Rhein, Germany, 2008; pp. 171–209. [Google Scholar]
  16. Schalles, H.J. Der Hafentempel. In Colonia Ulpia Traiana; Müller, M., Ed.; Eine Veröffentlichung des Landschaftsverbandes Rheinland, LVR—Archäologischer Park Xanten/LVR—RömerMuseum, von Zabern: Mainz am Rhein, Germany, 2008; pp. 311–318. [Google Scholar]
  17. Zieling, N. Die Thermen. In Colonia Ulpia Traiana; Müller, M., Ed.; Eine Veröffentlichung des Landschaftsverbandes Rheinland, LVR—Archäologischer Park Xanten/LVR—RömerMuseum, von Zabern: Mainz am Rhein, Germany, 2008; pp. 373–389. [Google Scholar]
  18. Selke, V. Zum Stand der Erforschung des Hafens der Colonia Ulpia Traiana/Xanten. In Der Rhein als europäische Verkehrsachse II, Volume 19, Bonner Beiträge zur Vor- und Frühgeschichtlichen Archäologie; Bemmann, J., Mirschenz, M., Eds.; Vor- und Frühgeschichtliche Archäologie Rheinische Friedrich-Wilhelms-Universität: Bonn, Germany, 2016; pp. 335–350. [Google Scholar]
  19. Gerlach, R.; Herchenbach, M.; Meurers-Balke, J. Das Rheinufer vor der Colonia Ulpia Traiana. In Archäologie im Rheinland 2016; Archäologie im Rheinland, Theiss: Darmstadt, Germany, 2017; pp. 114–116. [Google Scholar]
  20. von Petrikovits, H. Die Ausgrabungen in der Colonia Traiana bei Xanten: Die Ausgrabung der Kernsiedlung und der Uferanlagen (1934–1936). In Bonner Jahrbücher des Rheinischen Landesmuseums in Bonn; Butzon & Bercker: Kevelaer, Germany, 1952. [Google Scholar]
  21. Schmidt, B. Das Bauholz für die römerzeitlichen Häfen in Xanten und Köln: Eine Interpretation der dendrochronologischen Datierungen. In Von Anfang an: Archäologie in Nordrhein-Westfalen: [Begleitbuch zur Landesausstellung Von Anfang an—Archäologie in Nordrhein-Westfalen, Köln, Römisch-Germanisches Museum 13. März bis 28. August 2005, Herne, Westfälisches Museum für Archäologie, Landesmuseum 22. September 2005 bis 5. Februar 2006; Horn, H.G., Hellenkemper, H., Isenberg, G., Kunow, J., Eds.; Schriften zur Bodendenkmalpflege in Nordrhein-Westfalen, Verlag Philipp von Zabern: Mainz am Rhein, Germany, 2005; pp. 201–207. [Google Scholar]
  22. Leih, S. Der Hafen der Colonia Ulpia Traiana. In Colonia Ulpia Traiana; Müller, M., Ed.; Eine Veröffentlichung des Landschaftsverbandes Rheinland, LVR—Archäologischer Park Xanten/LVR—RömerMuseum, von Zabern: Mainz am Rhein, Germany, 2008; Volume 1, pp. 447–469. [Google Scholar]
  23. Selke, V. Der Hafen der Colonia Ulpia Traiana/Xanten. In Der Rhein als Europäische Verkehrsachse III; Mirschenz, M., Gerlach, R., Bemmann, J., Eds.; Bonner Beiträge 22, Vor- und Frühgeschichtliche Archäologie, Rheinische Friedrich-Wilhelms-Universität Bonn: Bonn, Germany, 2019. [Google Scholar]
  24. Jimenez, J. Turbulent flows over rough walls. Annu. Rev. Fluid Mech. 2004, 36, 173–196. [Google Scholar] [CrossRef]
  25. Leandro, J.; Bung, D.B.; Carvalho, R. Measuring void fraction and velocity fields of a stepped spillway for skimming flow using non-intrusive methods. Exp. Fluids 2014, 55. [Google Scholar] [CrossRef]
  26. Uijttewaal, W.S.J.; Lehmann, D.; van Mazijk, A. Exchange Processes between a River and Its Groyne Fields: Model Experiments. J. Hydraul. Eng. 2001, 127, 928–936. [Google Scholar] [CrossRef]
  27. Chanson, H. Hydraulics of skimming flows over stepped channels and spillways. J. Hydraul. Res. 1994, 32, 445–460. [Google Scholar] [CrossRef] [Green Version]
  28. Lojek, O.; Dempwolff, L.C.; Goseberg, N.R. Hydronumerische Simulation von Strömungsprozessen im Nahfeld des Römerhafens der Colonia Ulpia Triana: Der Rhein als europäische Verkehrsachse III: Bonner Beiträge zur Vor- und Frühgeschichtlichen Archäologie. In Der Rhein als Europäische Verkehrsachse III; Mirschenz, M., Gerlach, R., Bemmann, J., Eds.; Vor- und Frühgeschichtliche Archäologie, Rheinische Friedrich-Wilhelms-Universität Bonn: Bonn, Germany, 2019; Volume 22, pp. 109–120. [Google Scholar]
  29. Stoschek, O.; Matheja, A.; Zimmermann, C. Underwater structures against sedimentation at a ship berth in a tidal river. In Conference on Coastal and Port Engineering in Developing Countries COPEDEC; COPEDEC, Ed.; PIANC Secrétariat Général: Sri Lanka, Colombo, 2003; Volume 6, pp. 1–12. [Google Scholar]
  30. Matheja, A.; Stoschek, O.; Geils, J.; Zimmermann, C. Effetcs of a Current Deflection Wall in a tidal harbour entrance. In Conference on Coastal and Port Engineering in Developing Countries COPEDEC; COPEDEC, Ed.; PIANC Secrétariat Général: Sri Lanka, Colombo, 2003; Volume 6, pp. 1–12. [Google Scholar]
  31. van Maren, D.S.; Winterwerp, J.C.; Decrop, B.; Wang, Z.B.; Vanlede, J. Predicting the effect of a Current Deflecting Wall on harbour siltation. Cont. Shelf Res. 2011, 31, S182–S198. [Google Scholar] [CrossRef]
  32. Knüppel, J. Current deflection wall, Köhlfleet: Measure analysis in the framework of the Interreg IVB project TIDE: Elbe Estuary. Interreg IVB North Sea Reg. Progr. 2012, 2012, 1–12. [Google Scholar]
  33. PIANC. Minimising Harbour Siltation: PIANC Report n° 102, Vol. 102, Minimising Harbour Siltation; PIANC Secrétariat Général: Bruxelles, Belgium, 2008. [Google Scholar]
  34. Schendel, A.; Goseberg, N.; Schlurmann, T. Erosion Stability of Wide-Graded Quarry-Stone Material under Unidirectional Current. J. Waterw. Port Coast. Ocean Eng. 2016, 142, 04015023. [Google Scholar] [CrossRef] [Green Version]
  35. Hughes, S.A. Physical Models and Laboratory Techniques in Coastal Engineering; Advanced Series on Ocean Engineering; World Scientific Pub. Co.: Singapore; River Edge, NJ, USA, 1993; Volume 7. [Google Scholar]
  36. Frostick, L.E.; McLelland, S.J.; Mercer, T.G. Users Guide to Physical Modelling and Experimentation: Experience of the HYDRALAB Network; IAHR Design Manual, CRC Press: Hoboken, NJ, USA, 2011. [Google Scholar]
  37. Webb, C.B.; Barfuss, S.L.; Johnson, M.C. Modelling roughness in scale models. J. Hydraul. Res. 2010, 48, 260–264. [Google Scholar] [CrossRef]
  38. Sulaiman, M.; Sinnakaudan, S.; Shukor, M. Near bed turbulence measurement with acoustic doppler velocimeter (ADV). KSCE J. Civil Eng. 2013, 17, 1515–1528. [Google Scholar] [CrossRef]
  39. Goring, D.G.; Nikora, V.I. Despiking Acoustic Doppler Velocimeter Data. J. Hydraul. Eng. 2002, 128, 117–126. [Google Scholar] [CrossRef] [Green Version]
  40. Lesser, G.R.; Roelvink, J.A.; van Kester, J.; Stelling, G.S. Development and validation of a three-dimensional morphological model. Coast. Eng. 2004, 51, 883–915. [Google Scholar] [CrossRef]
  41. Stelling, G.S.; Leendertse, J.J. Approximation of Convective Processes by Cyclic AOI Methods. In Proceedings of the ASCE 2nd Conference on Estuarine and Coastal Modeling, Tampa, FL, USA, 13–15 November 1992; pp. 771–782. [Google Scholar]
  42. Deltares. Delft3D-FLOW: Simulation of Multi-Dimensional Hydrodynamic Flows and Transport Phenomena, Including Sediments—User Manual: Hydro-Morphodynamics; Deltares: Delft, The Netherlands, 2004; pp. 1–712. [Google Scholar]
  43. Khuntia, J.R.; Devi, K.; Khatua, K.K. Prediction of depth-averaged velocity in an open channel flow. Appl. Water Sci. 2018, 8, 172. [Google Scholar] [CrossRef] [Green Version]
  44. Charlier, D. Ergänzungen und Korrekturen zur Untersuchung der Bohrkerne aus dem Hafen der CUT: Unveröffentlichte Gutachten: “Ergebnisse der Nachbestimmung Ausgewählter Bohrkerne”, unpublished report 1995.
  45. Gerlach, R.; Fischer, P.; Meurers-Balke, J.; Mirschenz, M.; Röpke, A.; Hadler, H.; Willershäuser, T.; Vött, A. Römische Hafenstandorte: Standortbedingungen und Flussdynamik am Niedergermanischen Rheinlimes von Königswinter bis Kleve-Rindern. In Der Rhein als europäische Verkehrsachse III; Mirschenz, M., Gerlach, R., Bemmann, J., Eds.; Bonner Beiträge 22, Vor- und Frühgeschichtliche Archäologie, Rheinische Friedrich-Wilhelms-Universität Bonn: Bonn, Germany, 2019. [Google Scholar]
  46. Herget, J.; Roggenkamp, T.; Krell, M. Estimation of peak discharges of historical floods. Hydrol. Earth Syst. Sci. 2014, 18, 4029–4037. [Google Scholar] [CrossRef] [Green Version]
  47. Deutsches Gewässerkundliches Jahrbuch. 2020. Available online: https://www.lfu.bayern.de/wasser/wasserstand_abfluss/dgj/index.htm (accessed on 22 April 2020).
  48. QGIS_Dev. Team. Quantum Geographic Information System: QGIS: 64 Bit. 2019. Available online: https://qgis.org/en/site/ (accessed on 27 November 2020).
  49. Roggenkamp, T. Der Rhein zur Römerzeit: Wasserstände und Abflüsse des Mittel- und Niederrheins. In Forschungen. Geographie und Landeskunde; Deutsche Akademie für Landeskunde: Leipzig, Germany, 2016; Band 264. [Google Scholar]
  50. Courant, R.; Friedrichs, K.; Lewy, H. Über die partiellen Differenzgleichungen der mathematischen Physik. Math. Ann. 1928, 100, 32–74. [Google Scholar] [CrossRef]
  51. Dissanayake, P.K.; Wurpts, A.; Miani, M.; Knaack, H. Modelling Anthropogenic Effect of a Tidal Basin Evolution. Coast. Eng. Proc. 2012, 1, 50. [Google Scholar] [CrossRef]
  52. van der Wegen, M. Modeling Morphodynamic Evolution in Alluvial Estuaries: UNESCO-IHE; Taylor and Francis: Hoboken, NJ, USA, 2011. [Google Scholar]
  53. Dissanayake, D.M.P.K.; Ranasinghe, R.; Roelvink, J.A. The morphological response of large tidal inlet/basin systems to relative sea level rise. Clim. Chang. 2012, 113, 253–276. [Google Scholar] [CrossRef] [Green Version]
  54. van der Wegen, M.; Roelvink, J.A. Long-term morphodynamic evolution of a tidal embayment using a two-dimensional, process-based model. J. Geophys. Res. 2008, 113, 390. [Google Scholar] [CrossRef] [Green Version]
  55. Roelvink, J.A. Coastal morphodynamic evolution techniques. Coast. Eng. 2006, 53, 277–287. [Google Scholar] [CrossRef]
  56. Saberi, O.; Galoie, M. Numerical Modeling of Flow Around Groynes with Different Shapes Using TELEMAC-3D Software. Am. J. Water Sci. Eng. 2017, 2, 43–52. [Google Scholar] [CrossRef]
  57. Müller, M. Die städtebauliche Entwicklung von der Coloniagründung bis zur Spätantike. In Colonia Ulpia Traiana; Müller, M., Ed.; Eine Veröffentlichung des Landschaftsverbandes Rheinland, LVR—Archäologischer Park Xanten/LVR—RömerMuseum, von Zabern: Mainz am Rhein, Germany, 2008; pp. 269–273. [Google Scholar]
  58. Rolvink, J.A.; Van Banning, G.K.F.M.; IAHR. Design and development of Delft3D and Application to Coastal Morphodynamics. In Proceedings of the First International Conference on Hydroinformatics, Delft, The Netherlands, 19–23 September 1994; Balkema: Rotterdam, The Netherlands, 1994; Volume 1. [Google Scholar]
  59. Obladen-Kauder, J. Spuren römischer Lastschifffahrt am Unteren Niederrhein. In Colonia Ulpia Traiana; Müller, M., Ed.; Eine Veröffentlichung des Landschaftsverbandes Rheinland, LVR—Archäologischer Park Xanten/LVR—RömerMuseum, von Zabern: Mainz am Rhein, Germany, 2008. [Google Scholar]
  60. Gerlach, R.; Meurers-Balke, J. Der Prallhang als Standortvorteil—Der römische Rhein bei Burginatium. In Archäologie im Rheinland 2013; Archäologie im Rheinland, Theiss, Konrad: Darmstadt, Germany, 2014; pp. 114–117. [Google Scholar]
  61. Gerlach, R.; Meurers-Balke, J. Wo wurden römische Häfen am Niederrhein angelegt? Die Beispiele Colonia Ulpia Traiana (Xanten) und Burginatium (Kalkar). In Der Rhein als Europäische Verkehrsachse: Die Römerzeit; Kennecke, H., Ed.; Bonner Beiträge zur Vor- und Frühgeschichtlichen Archäologie, Vor- und Frühgeschichtliche Archäologie Rheinische Friedrich-Wilhelms-Univ: Bonn, Germany, 2014. [Google Scholar]
Sample Availability: Samples of the compounds are available from the authors.
Figure 1. (a) Quasi-3D isometric sketch of the tip of the hydraulic structure (not to scale) with various associated hydrodynamic processes and the still water level (SWL); (b) Top view of the excavated structure (opaque) with extrapolated segments (transparent); (c) Quay-wall segment physically simulated in the hydraulic laboratory for determining roughness induced losses for numeric simulations.
Water 12 03365 g001
Figure 2. (a) Photography of the original harbour structures discovered at the Colonia Ulpia Traiana (CUT) [20] (LVR—Archaeological Park Xanten); (b) Scaled physical flume model (PFM) installed in the current flume. View in direction of flow.
Water 12 03365 g002
Figure 3. Flow chart of the Cross-scale multi-model approach including a domain decomposition (DD)-model developed and employed illustrating the interdependence of the modelling-packages. This way, different spatial discretizations are realised, allowing to increase the resolution within target areas, whilst reducing the grid resolution for areas not so crucial, thereby optimizing the computational effort.
Water 12 03365 g003
Figure 4. Dimensions of the experimental model for (a) dorsal view, (b) detailed top down and (c) frontal view. The numerical flume model (NFM) (d) top-down for calibrating the roughness coefficient c l o s s with positions of measured sections.
Water 12 03365 g004
Figure 5. Overview Map with (a) the location of Xanten in relation to the Rhine in Europe (b) the modelled historic Rhine river bed and (c) detailed view of the roman riverine harbour location at the CUT with the position of the possible current deflection wall (CDW). Subfigure (d) examplifies the different grid resolutions of the two model areas.
Water 12 03365 g005
Figure 6. Velocity profile measured on the physical flume model (PFM) in cross channel direction at the end of the structure complimented by depth averaged values and a corresponding quadratic fit and numeric results.
Water 12 03365 g006
Figure 7. Velocity profile measured on the PFM in channel direction 15 cm in front of the structure complimented by depth averaged values and a corresponding quadratic fit and numeric results.
Water 12 03365 g007
Figure 8. Depth averaged x-velocity on a crosssection through different variations of the NFM with a width indicated by the legend in m.
Water 12 03365 g008
Figure 9. Cumulated sedimentation/erosion over time for three different values of the MorFac.
Water 12 03365 g009
Figure 10. Initial bathymetry as grey-scale superimposed with cumulative erosion/sedimentation related changes after 20 year of morphodynamic simulation without any parametric representation of the harbour structures included.
Water 12 03365 g010
Figure 11. Depth-averaged flow velocity for a case (a) without protruding structure and (b) including a projecting structure CDW of 10.88 m and (c) the difference in flow between these two cases.
Water 12 03365 g011
Table 1. Sediment fractions and parameters used in the large numerical model.
ParameterSymb.UnitcSamSafSa
grain diameter d 50 ( mm )2.21.50.8
layer thicknessm( m )7.01.50.2
dry bulk density ρ b ( k g m 3 )165016501650
Publisher’s Note: MDPI stays neutral with regard to jurisdictional claims in published maps and institutional affiliations.

