Temporal Variation of Water Environment Carrying Capacity in a Highly Urbanized Region of China

Abstract
:1. Introduction
2. Materials and Methods
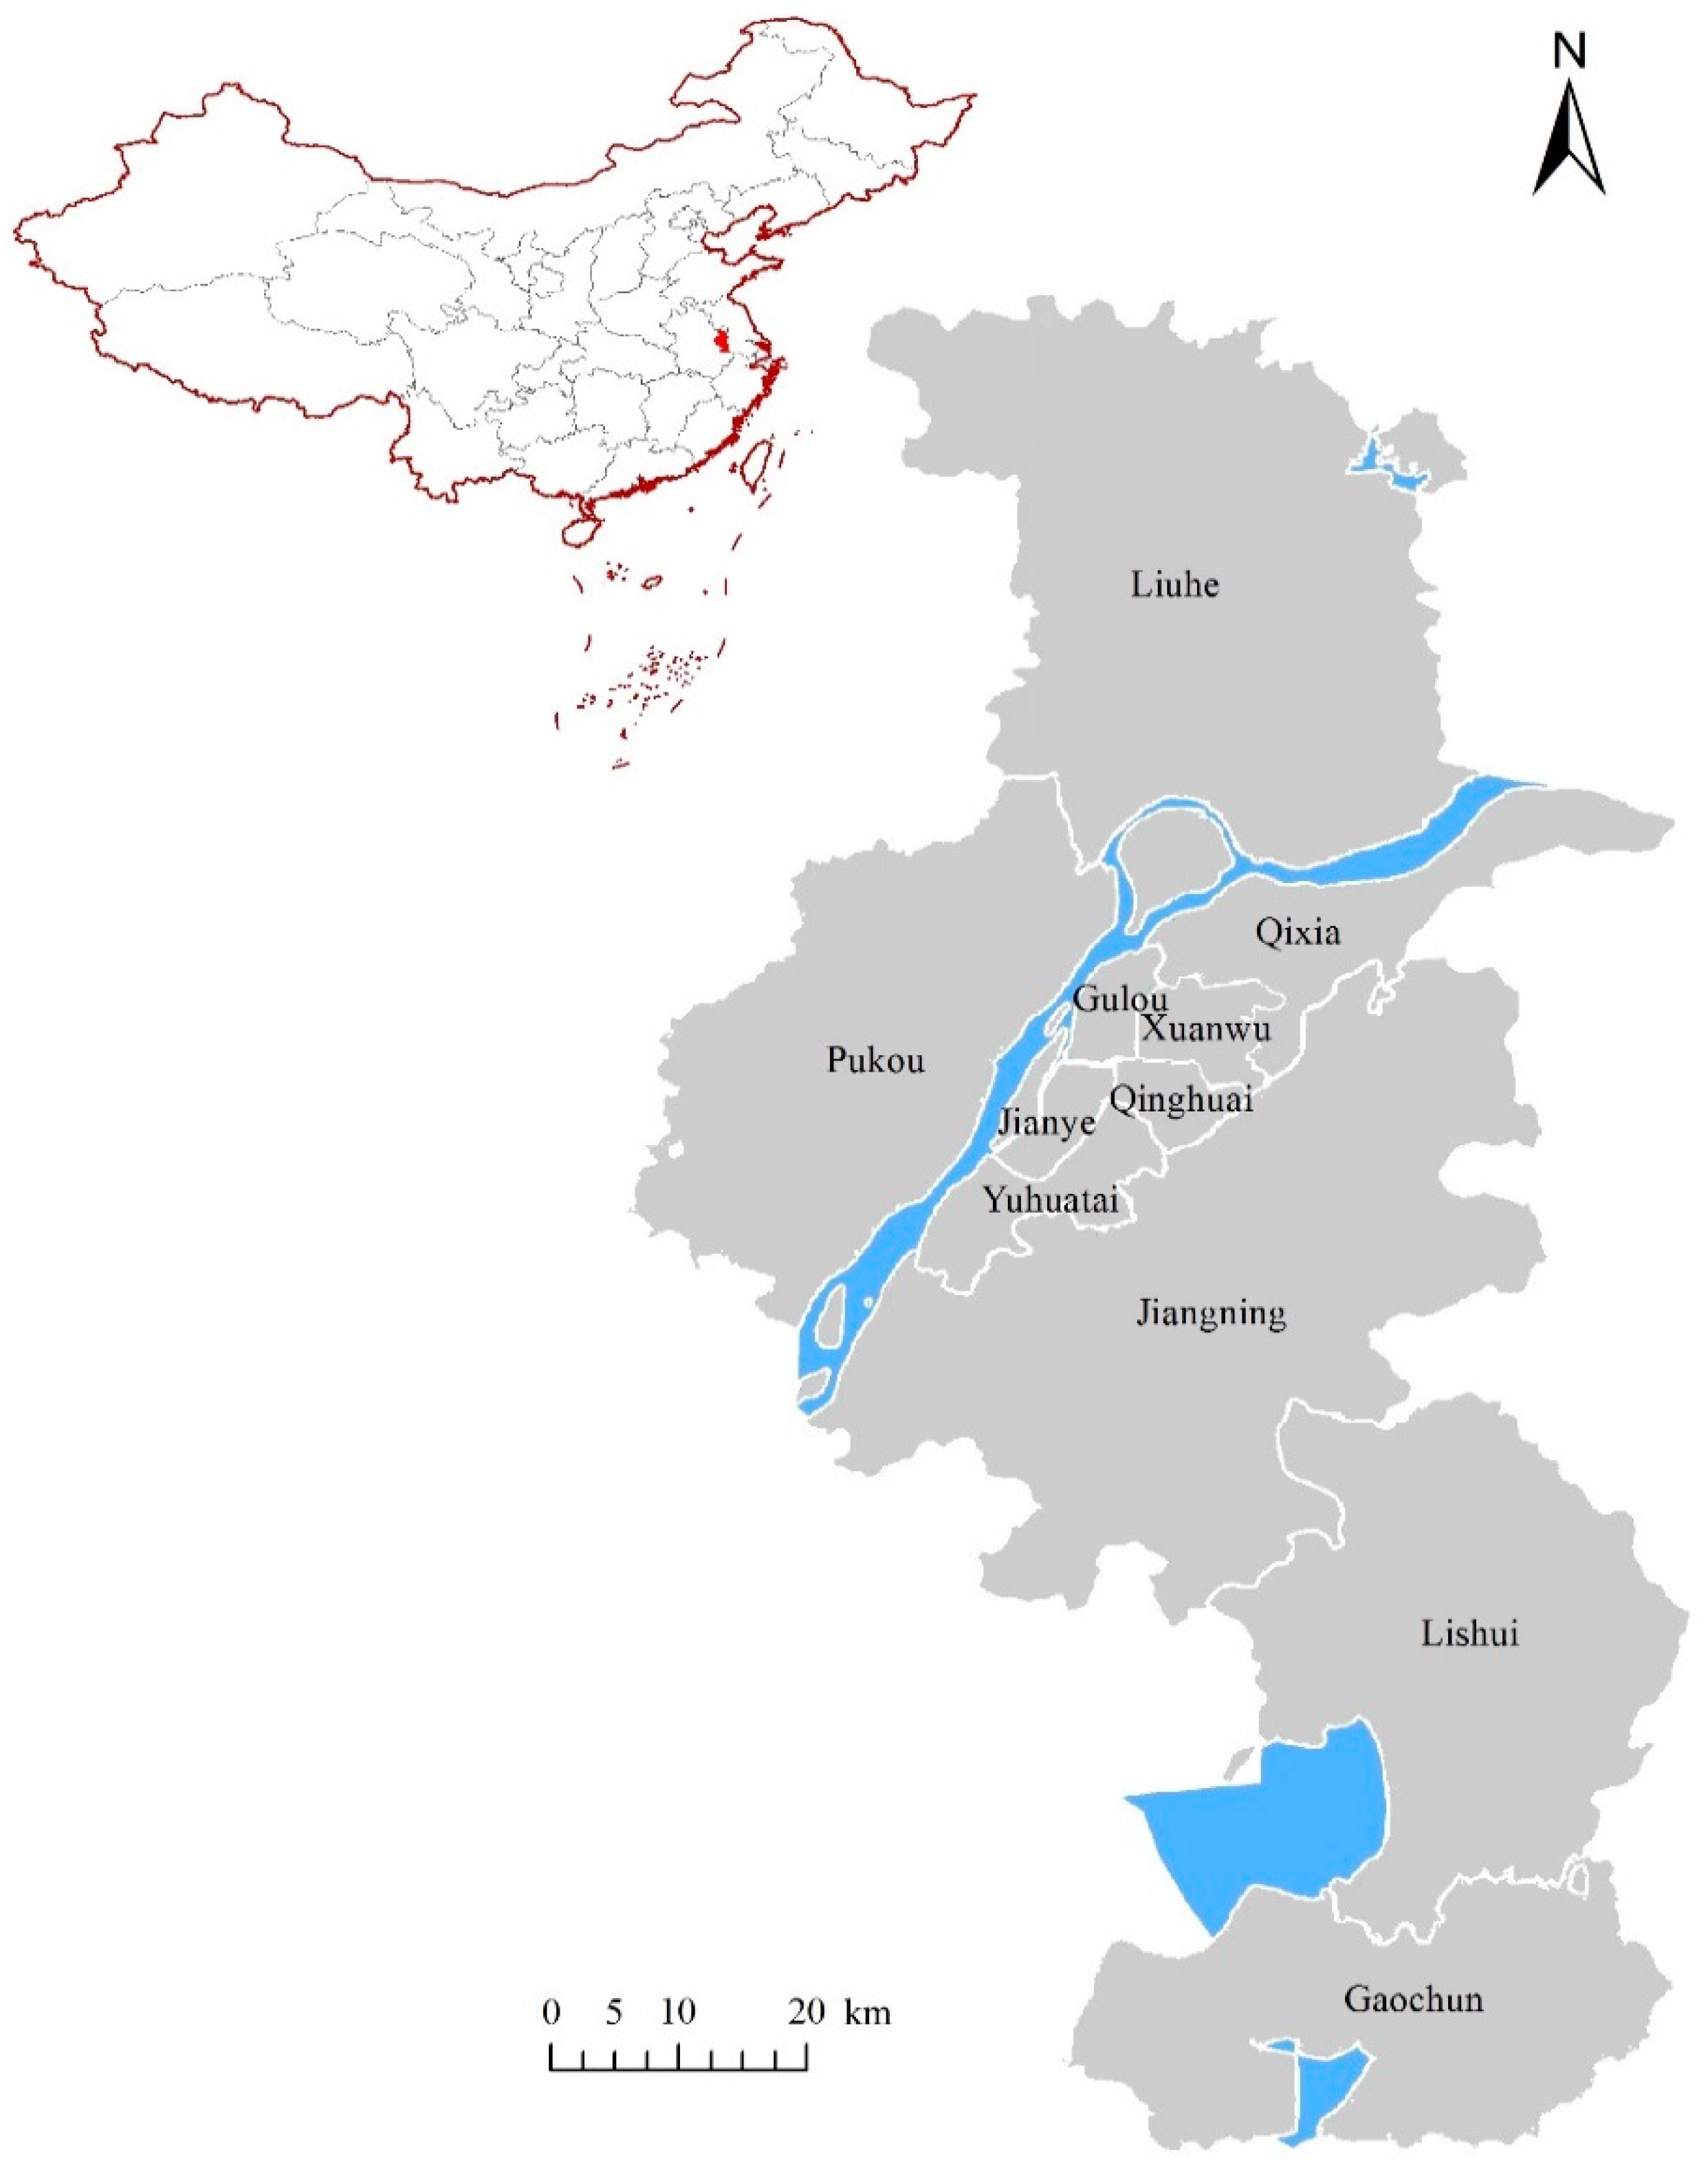
2.1. Study Area
2.2. Construction of Evaluation Indicator System
2.3. Data Analysis
2.3.1. Standardization of Raw Data
2.3.2. Entropy Weight Method
2.3.3. Fuzzy Comprehensive Evaluation
3. Results
3.1. Weight and Descriptive Statistics of Indicators
3.2. Grading Criteria of Evaluation Indicators
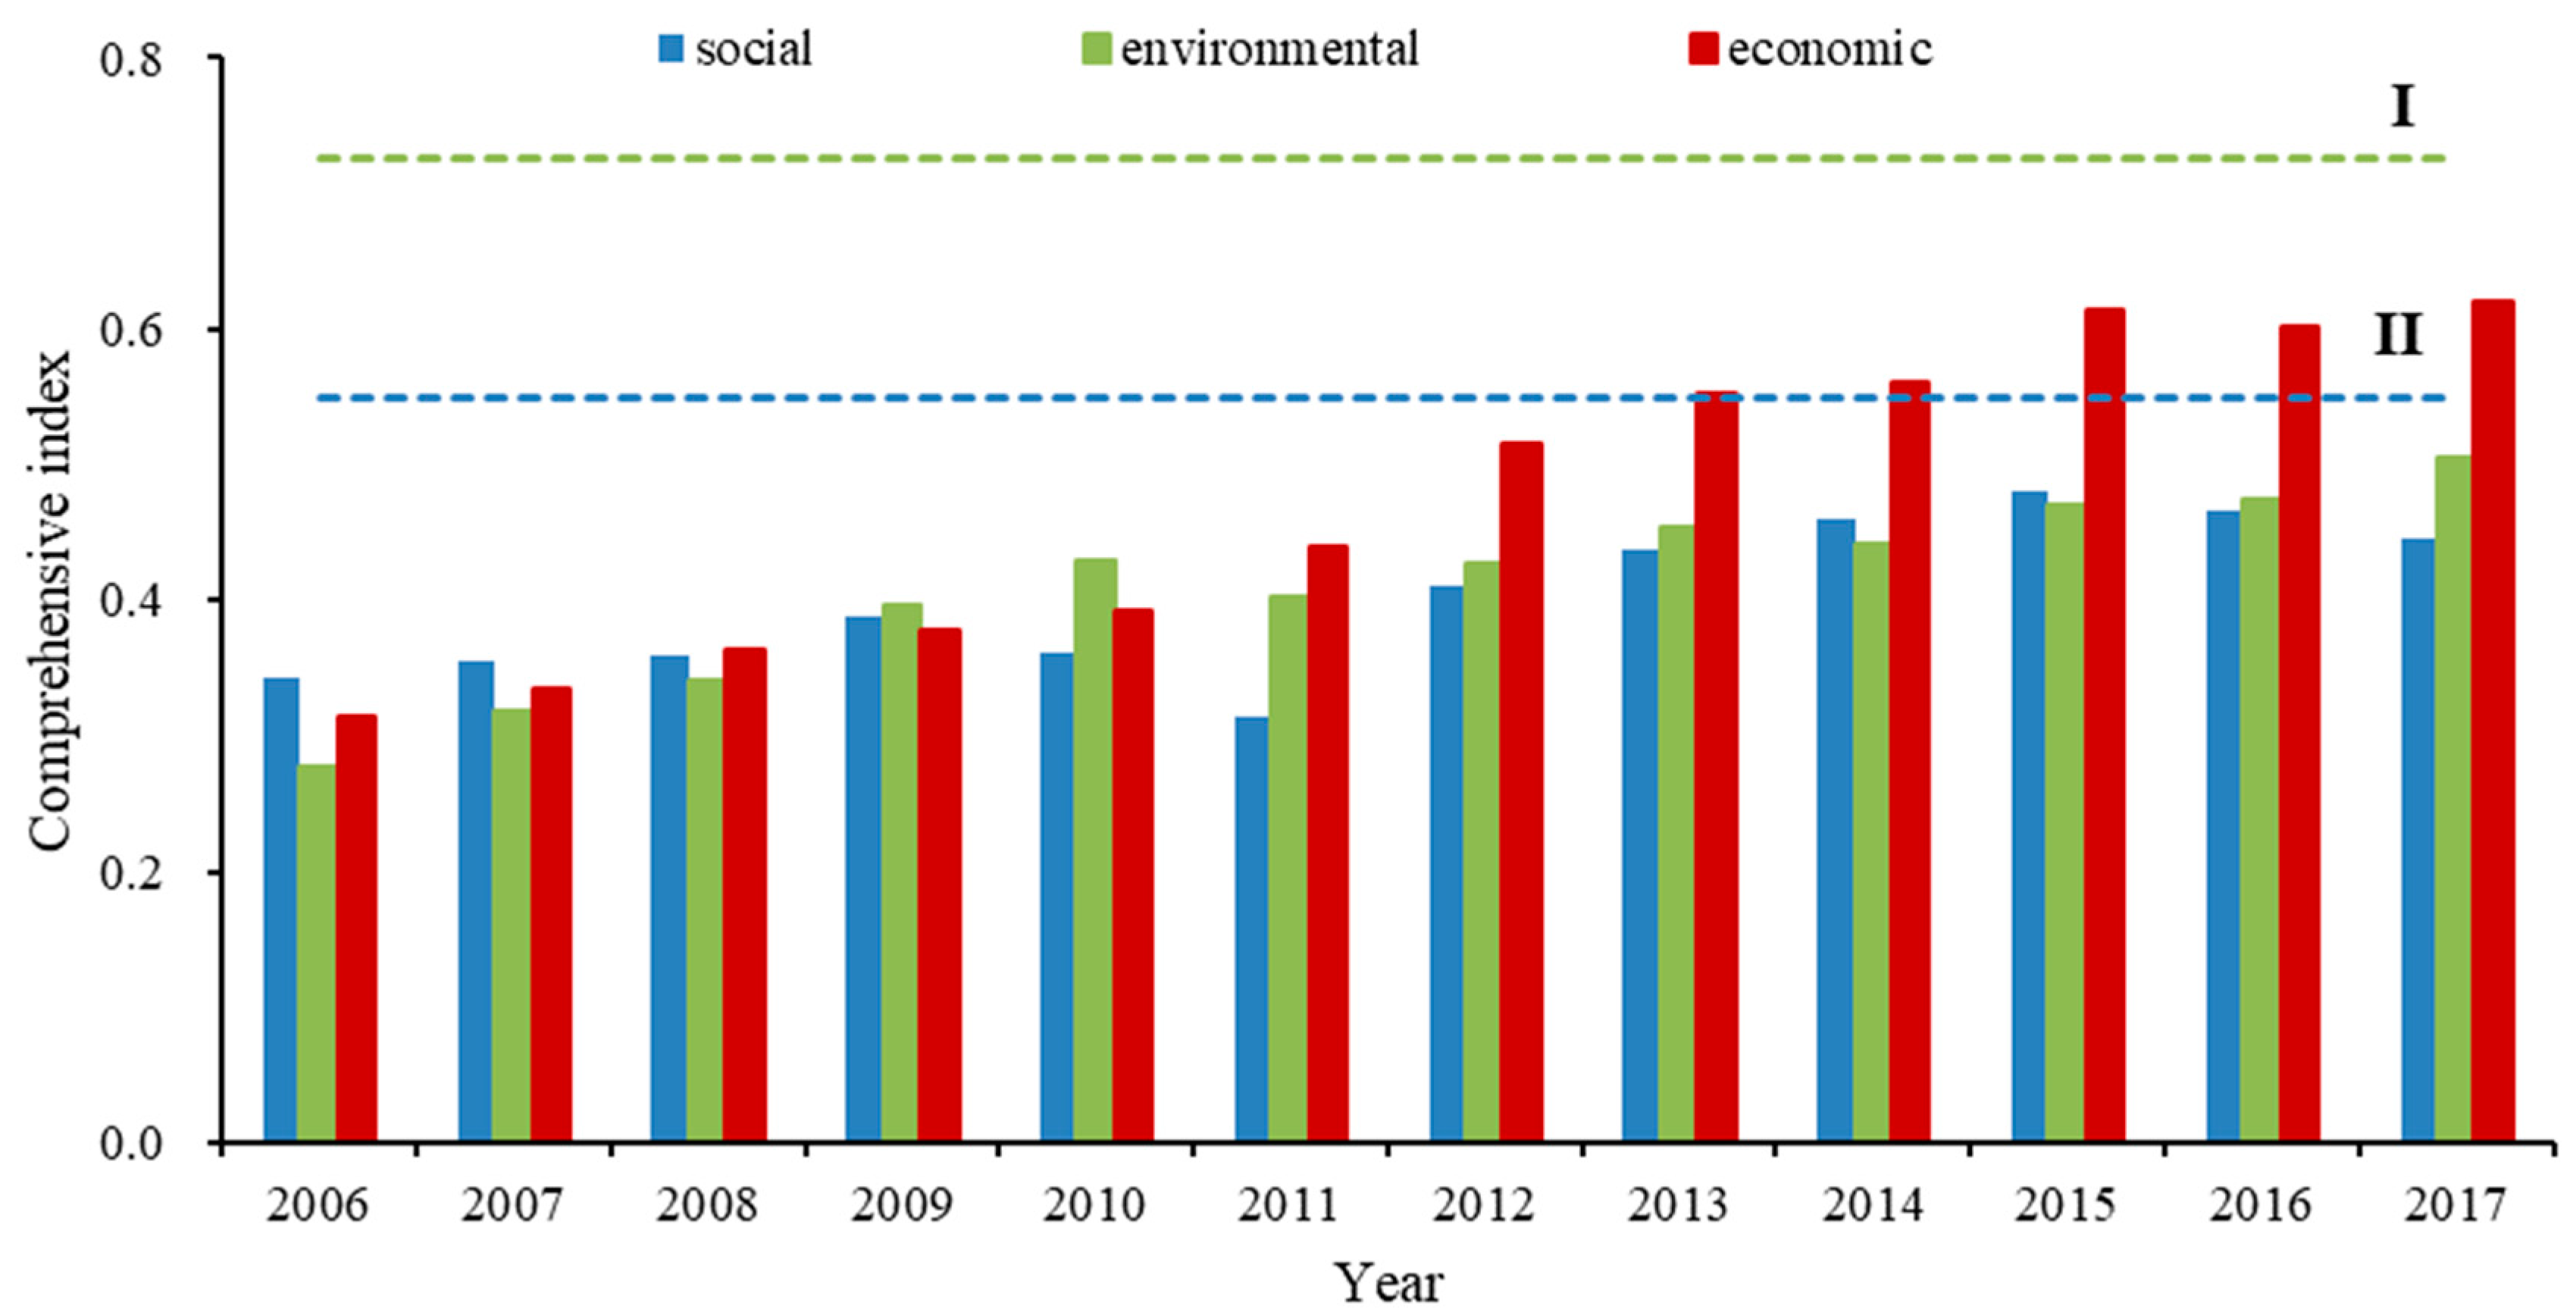
3.3. Changes in WECC from 2006 to 2017
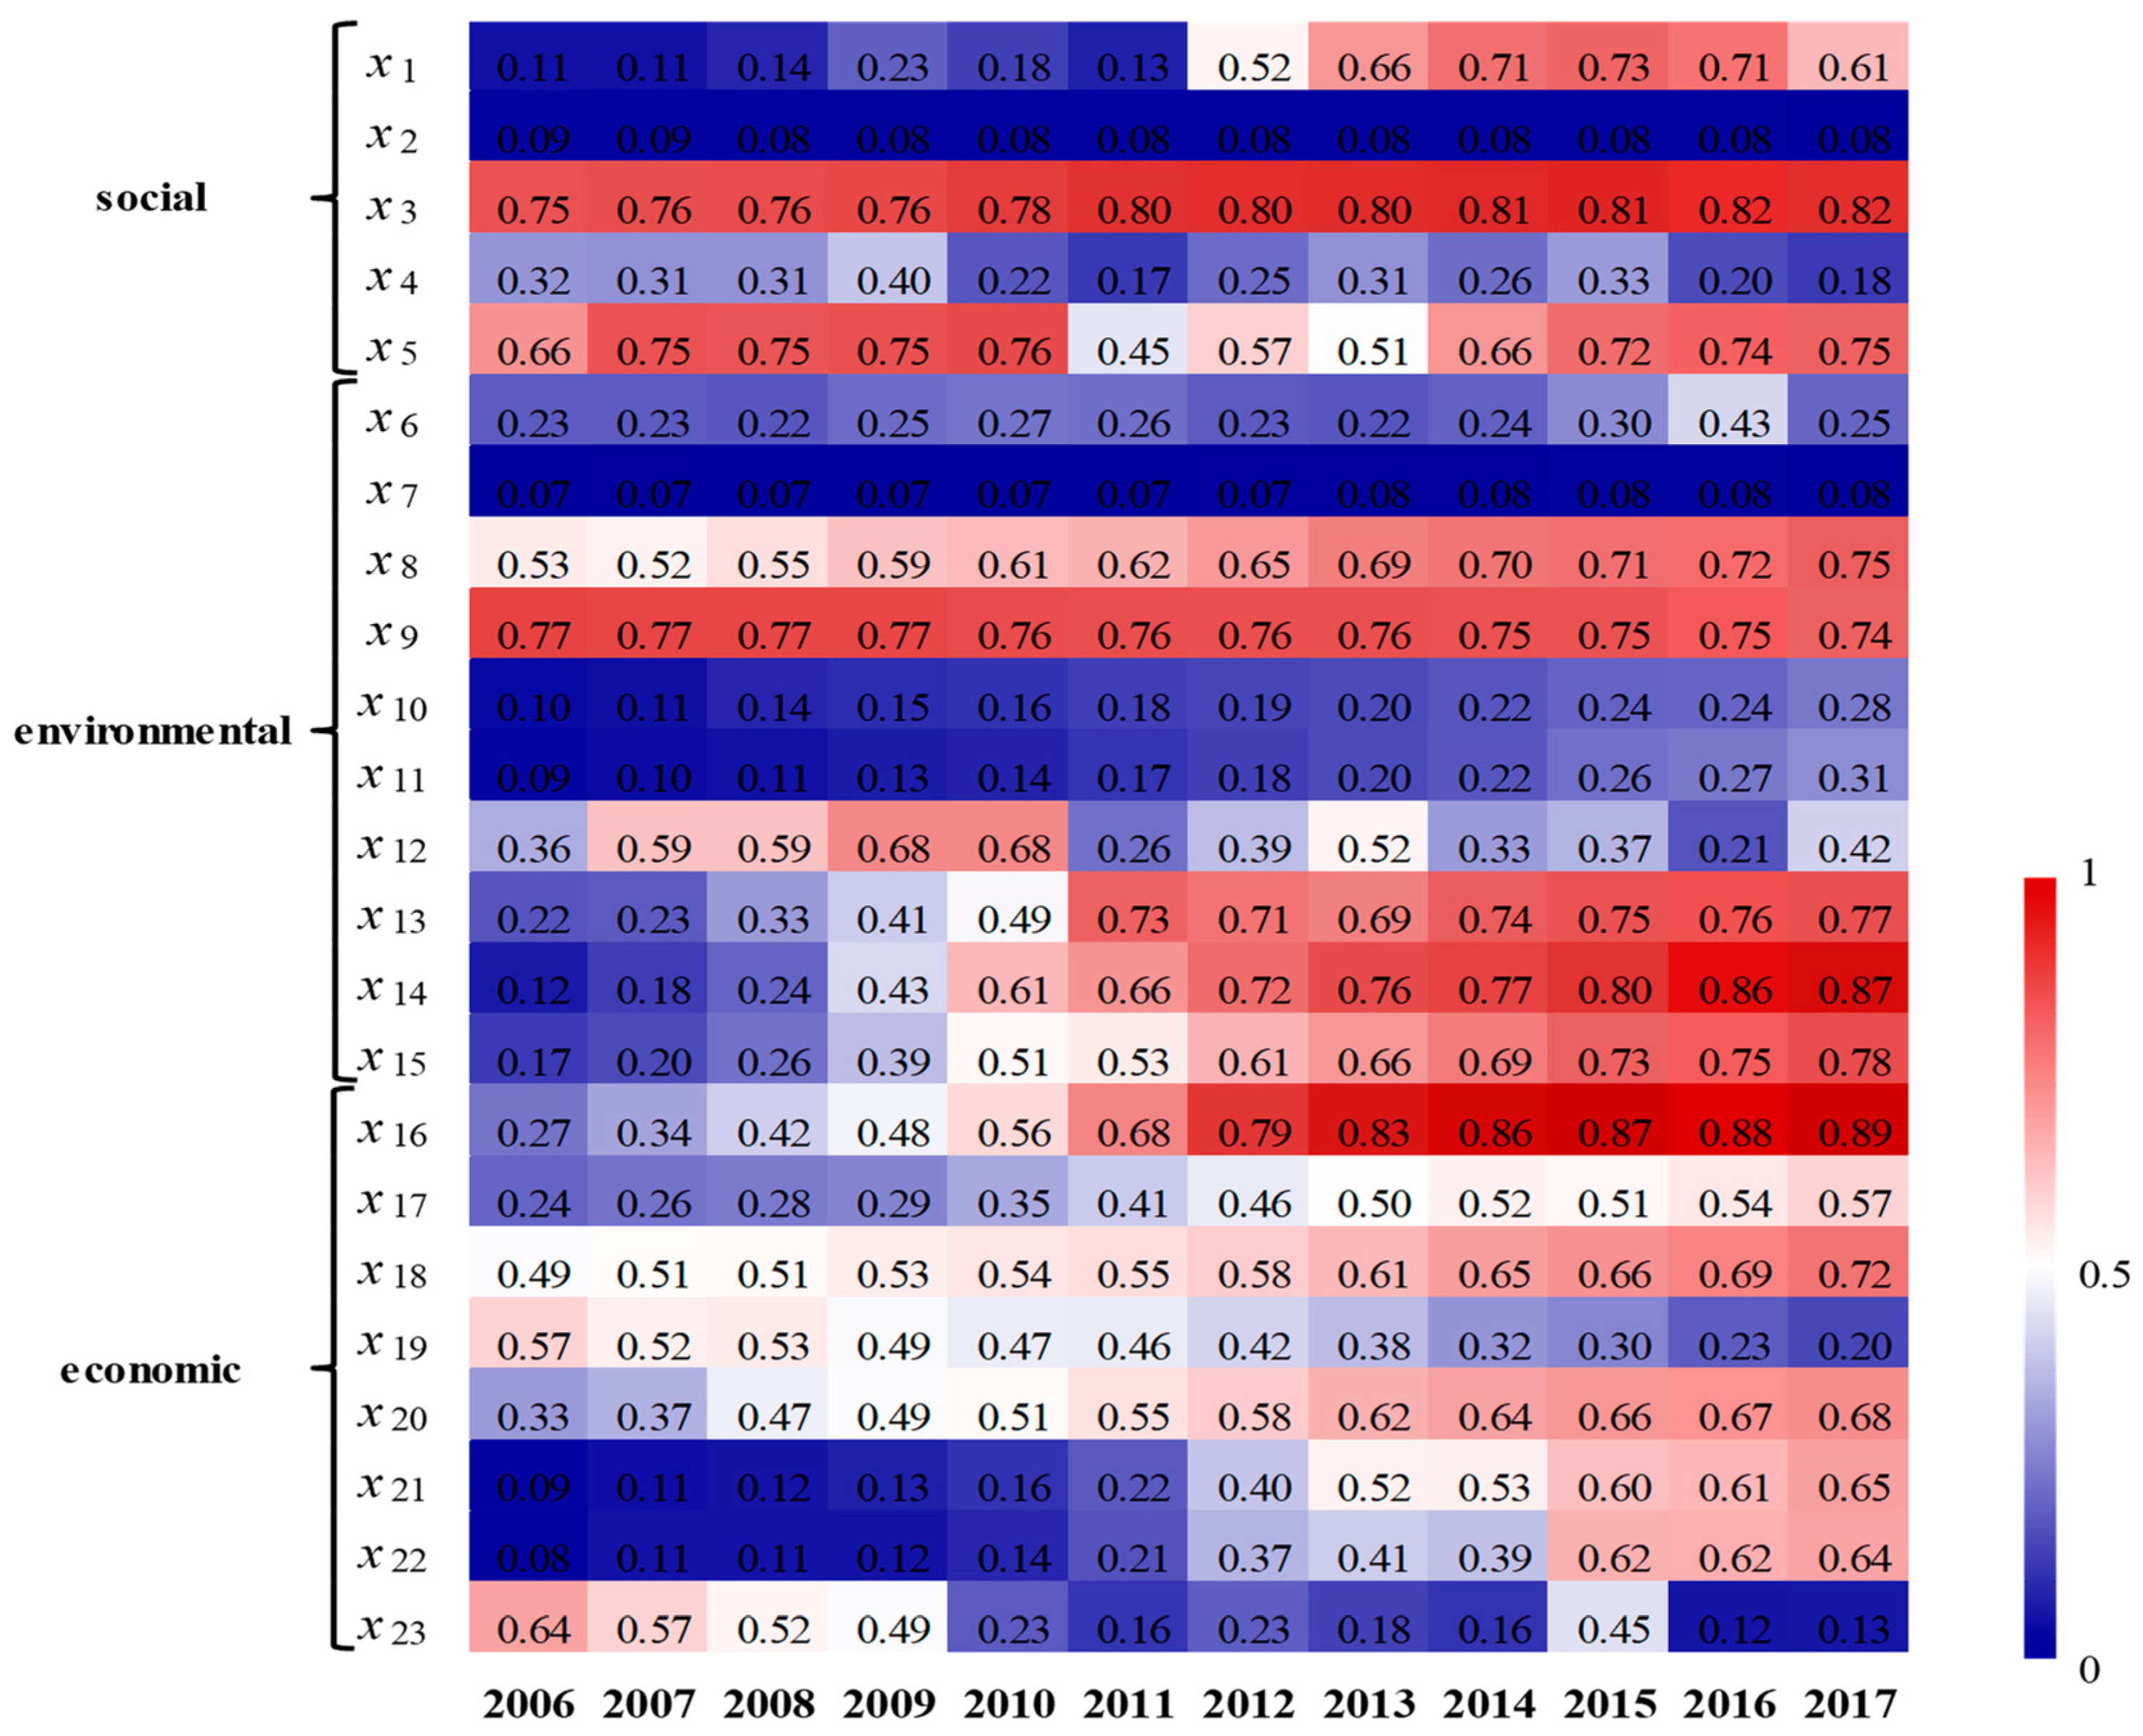
3.4. Evaluation of Indicators from 2006 to 2017
3.4.1. Social Subsystem
3.4.2. Environmental Subsystem
3.4.3. Economic Subsystem
4. Discussion
4.1. Problems Underlying Changes in WECC
4.2. Policy Suggestion
- (1)
- Strict enforcement of environmental regulations
- (2)
- Spatial arrangement of the urban population
- (3)
- Transformation of the development model
- (4)
- Optimization of the industrial structure
5. Conclusions
- (1)
- Based on the carrying capacity concept, this study constructed a hierarchical evaluation indicator system including three system layers (social, environmental and economic subsystems), and determined grading criteria to provide a reference for WECC assessment.
- (2)
- The WECC comprehensive index of Nanjing increased from 0.3045–0.5302 in 2006–2017, approaching Grade II (moderate) with a slow growth rate. The economic subsystem presented a stable and continuous growth, whereas the social and environmental subsystems were under considerable pressure.
- (3)
- Factors improving WECC include slow population growth, improved water environment protection, rapid economic growth, and reduced energy and water use intensity. Factors blocking WECC include increased population density, excessive water consumption, degraded water quality and an unsustainable economic development pattern.
- (4)
- To resolve the primary problems of WECC under urbanization, practical suggestions are proposed from the aspects of population, environmental regulation enforcement, development patterns and industrial structure.
Author Contributions
Funding
Conflicts of Interest
References
- Xiao, R.; Wang, G.; Zhang, Q.; Zhang, Z. Multi-scale analysis of relationship between landscape pattern and urban river water quality in different seasons. Sci. Rep. 2016, 6, 25250. [Google Scholar] [CrossRef] [PubMed] [Green Version]
- Wang, S.J.; Ma, H.; Zhao, Y.B. Exploring the relationship between urbanization and the eco-environment—A case study of Beijing–Tianjin–Hebei region. Ecol. Indic. 2014, 45, 171–183. [Google Scholar] [CrossRef]
- Li, Y.; Jia, L.; Wu, W.; Yan, J.; Liu, Y. Urbanization for Rural Sustainability Rethinking China’s Urbanization Strategy. J. Clean. Prod. 2018, 178, 580–586. [Google Scholar] [CrossRef]
- Liu, J.; Yang, W. Water sustainability for China and beyond. Science 2012, 337, 649–650. [Google Scholar] [CrossRef] [PubMed]
- Lu, Y.; Zhang, Y.; Cao, X.; Wang, C. Forty years of reform and opening up: China’s progress toward a sustainable path. Sci. Adv. 2019, 5, eaau9413. [Google Scholar] [CrossRef] [Green Version]
- Wang, S.; Xu, L.; Yang, F.; Wang, H. Assessment of water ecological carrying capacity under the two policies in Tieling City on the basis of the integrated system dynamics model. Sci. Total Environ. 2014, 472, 1070–1081. [Google Scholar] [CrossRef]
- Ehrlich, P.R.; Holdren, J.P. Impact of population growth. Science 1971, 171, 1212–1217. [Google Scholar] [CrossRef]
- Meadows, D.H.; Meadows, D.L.; Randers, J.; Behrens, W.W. The limits to growth: A report for the Club of Rome’s project on the predicament of mankind. Demography 1973, 10, 289–299. [Google Scholar]
- Baldwin, J.H. Environmental Planning and Management; Westview Press: Boulder, CO, USA, 1985. [Google Scholar]
- De La Sen, M.; Alonso-Quesada, S. Control issues for the Beverton–Holt equation in ecology by locally monitoring the environment carrying capacity: Non-adaptive and adaptive cases. Appl. Math. Comput. 2009, 215, 2616–2633. [Google Scholar] [CrossRef]
- Dang, X.; Liu, G. Emergy measures of carrying capacity and sustainability of a target region for an ecological restoration programme: A case study in Loess Hilly Region, China. J. Environ. Manag. 2012, 102, 55–64. [Google Scholar] [CrossRef]
- Dou, M.; Ma, J.; Li, G.; Zuo, Q. Measurement and assessment of water resources carrying capacity in Henan Province, China. Water Sci. Eng. 2015, 8, 102–113. [Google Scholar] [CrossRef] [Green Version]
- Wang, C.; Hou, Y.; Xue, Y. Water resources carrying capacity of wetlands in Beijing: Analysis of policy optimization for urban wetland water resources management. J. Clean. Prod. 2017, 161, 1180–1191. [Google Scholar] [CrossRef]
- Jia, Z.; Cai, Y.; Chen, Y.; Zeng, W. Regionalization of water environmental carrying capacity for supporting the sustainable water resources management and development in China. Resour. Conserv. Recycl. 2018, 134, 282–293. [Google Scholar] [CrossRef]
- Meng, C.; Du, X.; Ren, Y. Sustainable urban development: An examination of literature evolution on urban carrying capacity in the Chinese context. J. Clean. Prod. 2020, 277, 122802. [Google Scholar] [CrossRef]
- Peng, T.; Deng, H. Comprehensive evaluation for sustainable development based on relative resource carrying capacity—A case study of Guiyang, Southwest China. Environ. Sci. Pollut. Res. 2020, 27, 20090–20103. [Google Scholar] [CrossRef]
- Wang, Y.; Wang, Y.; Su, X. Evaluation of the comprehensive carrying capacity of interprovincial water resources in China and the spatial effect. J. Hydrol. 2019, 575, 794–809. [Google Scholar] [CrossRef]
- Lei, K.; Zhou, S. Per capita resource consumption and resource carrying capacity: A comparison of the sustainability of 17 mainstream countries. Energy Policy 2012, 42, 603–612. [Google Scholar] [CrossRef]
- David, G.S.; Carvalho, E.D.; Lemos, D.; Silveira, A.N.; Dall’Aglio-Sobrinho, M. Ecological carrying capacity for intensive tilapia (Oreochromis niloticus) cage aquaculture in a large hydroelectrical reservoir in Southeastern Brazil. Aquac. Eng. 2015, 66, 30–40. [Google Scholar] [CrossRef]
- Murilloalvarado, P.E.; Guilléngosálbez, G.; Ponceortega, J.M.; Castromontoya, A.J.; Sernagonzález, M.; Jiménez, L. Multi-objective optimization of the supply chain of biofuels from residues of the tequila industry in Mexico. J. Clean. Prod. 2015, 108, 422–441. [Google Scholar] [CrossRef]
- Ye, F.; Park, J.; Wang, F. Analysis of Early Warning Spatial and Temporal Differences of Tourism Carrying Capacity in China’s Island Cities. Sustainability 2020, 12, 1328. [Google Scholar] [CrossRef] [Green Version]
- He, Y.; Xie, H. Exploring the spatiotemporal changes of ecological carrying capacity for regional sustainable development based on GIS: A case study of Nanchang City. Technol. Forecast. Soc. Chang. 2019, 148, 119720. [Google Scholar] [CrossRef]
- Lu, Y.; Xu, H.; Wang, Y.; Yang, Y. Evaluation of water environmental carrying capacity of city in Huaihe River Basin based on the AHP method: A case in Huai’an City. Water Resour. Ind. 2017, 18, 71–77. [Google Scholar] [CrossRef]
- Zhang, J.; Zhang, C.; Shi, W.; Fu, Y. Quantitative Evaluation and Optimized Utilization of Water Resources-Water Environment Carrying Capacity based on Nature-Based Solutions. J. Hydrol. 2018, 568, 96–107. [Google Scholar] [CrossRef]
- Yang, Z.; Song, J. Comprehensive evaluation and scenario simulation for the water resources carrying capacity in Xi’an city, China. J. Environ. Manag. 2019, 230, 221–233. [Google Scholar] [CrossRef] [PubMed]
- Chi, M.; Zhang, D.; Fan, G. Prediction of water resource carrying capacity by the analytic hierarchy process-fuzzy discrimination method in a mining area. Ecol. Indic. 2019, 96, 647–655. [Google Scholar] [CrossRef]
- Forio, M.A.E.; Mouton, A.; Lock, K. Fuzzy modelling to identify key drivers of ecological water quality to support decision and policy making. Environ. Sci. Policy 2017, 68, 58–68. [Google Scholar] [CrossRef]
- Wu, X.; Hu, F. Analysis of ecological carrying capacity using a fuzzy comprehensive evaluation method. Ecol. Indic. 2020, 113, 106243. [Google Scholar] [CrossRef]
- Xie, T.; Wang, M.; Chao, C. Evaluation of the natural attenuation capacity of urban residential soils with ecosystem-service performance index (EPX) and entropy-weight methods. Environ. Pollut. 2018, 238, 222–229. [Google Scholar] [CrossRef]
- Niccolucci, V.; Galli, A.; Reed, A.; Neri, E.; Wackernagel, M.; Bastianoni, S. Towards a 3D National Ecological Footprint Geography. Ecol. Model. 2011, 222, 2939–2944. [Google Scholar] [CrossRef]
- Shao, Q.; Liu, X.; Zhao, W. An alternative method for analyzing dimensional interactions of urban carrying capacity: Case study of Guangdong-Hong Kong-Macao Greater Bay Area. J. Environ. Manag. 2020, 273, 111064. [Google Scholar] [CrossRef]
- Wang, J.; Wei, X.; Guo, Q. A three-dimensional evaluation model for regional carrying capacity of ecological environment to social economic development: Model development and a case study in China. Ecol. Indic. 2018, 89, 348–355. [Google Scholar] [CrossRef]
- Sun, L.; Miao, C.; Yang, L. Ecological-economic efficiency evaluation of green technology innovation in strategic emerging industries based on entropy weighted TOPSIS method. Ecol. Indic. 2017, 73, 554–558. [Google Scholar] [CrossRef]
- Wang, G.; Liu, Y.; Hu, Z. Flood Risk Assessment Based on Fuzzy Synthetic Evaluation Method in the Beijing-Tianjin-Hebei Metropolitan Area, China. Sustainability 2020, 12, 1451. [Google Scholar] [CrossRef] [Green Version]
- Chiu, R.H.; Lin, L.H.; Ting, S.C. Evaluation of Green Port Factors and Performance: A Fuzzy AHP Analysis. Math. Probl. Eng. 2014, 5, 1–12. [Google Scholar] [CrossRef]
- Zhu, R.; Liang, Q.; Zhan, H. Analysis of Aero-engine Performance and Selection Based on Fuzzy Comprehensive Evaluation. Procedia Eng. 2017, 174, 1202–1207. [Google Scholar] [CrossRef]
- Sun, C.; Chen, L.; Tian, Y. Study on the urban state carrying capacity for unbalanced sustainable development regions: Evidence from the Yangtze River Economic Belt. Ecol. Indic. 2018, 89, 150–158. [Google Scholar] [CrossRef]
- Liu, J.; Diamond, J. Revolutionizing China’s Environmental Protection. Science 2008, 319, 37–38. [Google Scholar] [CrossRef]
- Lu, Y.; Jenkins, A.; Ferrier, R.C.; Bailey, M.I.; Gordon, J.; Song, S.; Huang, J.; Jia, S.; Zhang, F.; Liu, X. Addressing China’s grand challenge of achieving food security while ensuring environmental sustainability. Sci. Adv. 2015, 1, e1400039. [Google Scholar] [CrossRef] [Green Version]
- Peng, X. China’s Demographic History and Future Challenges. Science 2011, 333, 581–587. [Google Scholar] [CrossRef] [Green Version]
- Gao, J.; Tang, X.; Ren, H.; Cai, W. Evolution of the Construction Industry in China from the Perspectives of the Driving and Driven Ability. Sustainability 2019, 11, 1772. [Google Scholar] [CrossRef] [Green Version]
- Zhang, W.; Wang, J.; Zhang, B.; Bi, J.; Jiang, H. Can China Comply with Its 12th Five-Year Plan on Industrial Emissions Control: A Structural Decomposition Analysis. Environ. Sci. Technol. 2015, 49, 4816–4824. [Google Scholar] [CrossRef] [PubMed]
- Wu, J.; Dennis, Y.; Wen, W. Environmental regulations and redistribution of polluting industries in transitional China: Understanding regional and industrial differences. J. Clean. Prod. 2019, 126, 142–155. [Google Scholar] [CrossRef]
- Peters, G.P.; Guan, D.; Hubacek, K.; Minx, J.; Weber, C.L. Effects of China’s Economic Growth. Science 2010, 328, 824–825. [Google Scholar] [CrossRef]
- Li, L.; Liu, B. Research on the Relationship between Economy Growth and Environmental Pollution in Shandong Province - The Empirical Research from 1981 to 2009. Adv. Mater. Res. 2012, 524-527, 3433–3437. [Google Scholar] [CrossRef]
- Wang, Z.; Chen, J.M. A Greener Future for China’s Cities. Science 2010, 327, 1199. [Google Scholar] [CrossRef] [PubMed]


| Overall Target | System Layer | Indicator Layer | Units | Attributes |
|---|---|---|---|---|
| water environment carrying capacity(A) | Social subsystem (A1) | Population growth rate (u1) | % | − |
| Population density (u2) | people/km2 | − | ||
| Urbanization rate (u3) | % | + | ||
| Domestic water use per capita (u4) | L/(day·person) | − | ||
| Industrial water reuse (u5) | % | + | ||
| Environmental subsystem (A2) | Water resources per capita (u6) | m3/person | + | |
| Water resources utility rate(u7) | % | − | ||
| Forest area as percent of land area(u8) | % | + | ||
| Arable land area as percent of land area(u9) | % | + | ||
| Use of fertilizers per unit of agricultural land area(u10) | 103 kg/km2 | − | ||
| Use of pesticides per unit of agricultural land area(u11) | kg/km2 | − | ||
| Compliance rate for water quality standards(u12) | % | + | ||
| Wastewater treatment rate(u13) | % | + | ||
| COD emission per unit of industrial added value(u14) | kg/104 RMB | − | ||
| Wastewater discharge per unit of GDP(u15) | kg/RMB | − | ||
| Economic subsystem (A3) | GDP per capita(u16) | 104 RMB/person | + | |
| Industrial output per capita (u17) | 104 RMB/person | + | ||
| The percentage of tertiary industry(u18) | % | + | ||
| Annual energy consumption per capita(u19) | kg/person | − | ||
| Energy consumption per unit of GDP(u20) | kg/104 RMB | − | ||
| Water consumption per unit of GDP(u21) | m3/104 RMB | − | ||
| Water consumption per unit of industrial added value(u22) | m3/104 RMB | − | ||
| Generation of industrial solid waste(u23) | 107 kg | − |
| u1 | u2 | u3 | u4 | u5 | u6 | u7 | u8 | u9 | u10 | u11 | u12 | |
|---|---|---|---|---|---|---|---|---|---|---|---|---|
| Maximum | 3.10 | 1259 | 82.1 | 361 | 88.1 | 834 | 153 | 31.0 | 37.0 | 55.2 | 1502 | 77.8 |
| Minimum | 0.29 | 1092 | 76.4 | 266 | 64.8 | 290 | 127 | 22.0 | 35.7 | 30.0 | 675 | 56.2 |
| Average | 1.47 | 1203 | 79.4 | 308 | 81.5 | 430 | 142 | 27.0 | 36.3 | 37.7 | 961 | 67.8 |
| Weight | 0.0436 | 0.0763 | 0.0534 | 0.0283 | 0.0266 | 0.0731 | 0.0622 | 0.0351 | 0.0412 | 0.0225 | 0.0216 | 0.0652 |
| u13 | u14 | u15 | u16 | u17 | u18 | u19 | u20 | u21 | u22 | u23 | ||
| Maximum | 96.3 | 2.40 | 2.40 | 14.11 | 4.64 | 59.7 | 4750 | 1.310 | 162.2 | 143.1 | 2068 | |
| Minimum | 83.2 | 0.14 | 0.85 | 3.93 | 1.64 | 47.9 | 3849 | 0.590 | 36.5 | 30.4 | 1278 | |
| Average | 91.4 | 1.04 | 1.48 | 8.44 | 3.10 | 53.5 | 4253 | 0.874 | 79.7 | 66.4 | 1634 | |
| Weight | 0.0518 | 0.0247 | 0.0376 | 0.0555 | 0.0504 | 0.0526 | 0.0309 | 0.0463 | 0.0481 | 0.0325 | 0.0206 |
| Indicator | Excellent | Moderate | Poor | Attributes |
|---|---|---|---|---|
| Population growth rate | 0.3 | 0.9 | 1.5 | − |
| Population density | 400 | 500 | 600 | − |
| Urbanization rate | 75 | 65 | 55 | + |
| Domestic water use per capita | 150 | 225 | 300 | − |
| Industrial water reuse | 85 | 70 | 55 | + |
| Water resources per capita | 1700 | 1100 | 500 | + |
| Water resources utility rate | 40 | 50 | 60 | − |
| Forest area as percent of land area | 30 | 22.5 | 15 | + |
| Arable land area as percent of land area | 35 | 27.5 | 20 | + |
| Use of fertilizers per unit of agricultural land area | 15 | 22.5 | 30 | − |
| Use of pesticides per unit of agricultural land area | 300 | 500 | 700 | − |
| Compliance rate for water quality standards | 80 | 70 | 60 | + |
| Wastewater treatment rate | 95 | 90 | 85 | + |
| COD emission per unit of industrial added value | 0.8 | 1.2 | 1.6 | − |
| Wastewater discharge per unit of GDP | 1 | 1.5 | 2 | − |
| GDP per capita | 8 | 6 | 4 | + |
| Industrial output per capita | 6 | 4 | 2 | + |
| The percentage of tertiary industry | 60 | 50 | 40 | + |
| Annual energy consumption per capita | 3500 | 4000 | 4500 | − |
| Energy consumption per unit of GDP | 0.5 | 0.95 | 1.4 | − |
| Water consumption per unit of GDP | 30 | 50 | 70 | − |
| Water consumption per unit of industrial added value | 25 | 40 | 55 | − |
| Generation of industrial solid waste | 1200 | 1400 | 1600 | − |
| Grade | Comprehensive Index |
|---|---|
| excellent (I) | 0.725 |
| moderate (II) | 0.55 |
| poor (III) | 0 |
Publisher’s Note: MDPI stays neutral with regard to jurisdictional claims in published maps and institutional affiliations. |
© 2020 by the authors. Licensee MDPI, Basel, Switzerland. This article is an open access article distributed under the terms and conditions of the Creative Commons Attribution (CC BY) license (http://creativecommons.org/licenses/by/4.0/).
Share and Cite
Xu, Z.; Xiao, S.; Du, C.; Deng, Q.; Yan, B.; Zeng, Z.; Liu, X. Temporal Variation of Water Environment Carrying Capacity in a Highly Urbanized Region of China. Water 2020, 12, 3362. https://doi.org/10.3390/w12123362
Xu Z, Xiao S, Du C, Deng Q, Yan B, Zeng Z, Liu X. Temporal Variation of Water Environment Carrying Capacity in a Highly Urbanized Region of China. Water. 2020; 12(12):3362. https://doi.org/10.3390/w12123362
Chicago/Turabian StyleXu, Zhiqing, Shuhu Xiao, Cong Du, Qiyu Deng, Bingfei Yan, Zhiwen Zeng, and Xueyu Liu. 2020. "Temporal Variation of Water Environment Carrying Capacity in a Highly Urbanized Region of China" Water 12, no. 12: 3362. https://doi.org/10.3390/w12123362
APA StyleXu, Z., Xiao, S., Du, C., Deng, Q., Yan, B., Zeng, Z., & Liu, X. (2020). Temporal Variation of Water Environment Carrying Capacity in a Highly Urbanized Region of China. Water, 12(12), 3362. https://doi.org/10.3390/w12123362