Article

Distributions of Microplastics in Surface Water, Fish, and Sediment in the Vicinity of a Sewage Treatment Plant

1
Water Environmental Engineering Research Division, National Institute of Environmental Research, Incheon 22689, Korea
2
Department of Environmental Health Sciences, School of Public Health, Seoul National University, Seoul 08826, Korea
*
Author to whom correspondence should be addressed.
Water 2020, 12(12), 3333; https://doi.org/10.3390/w12123333
Submission received: 21 October 2020 / Revised: 19 November 2020 / Accepted: 23 November 2020 / Published: 27 November 2020
(This article belongs to the Special Issue Microplastics in Aquatic Environments and Wastewater Treatment )

Abstract

:
Microplastics are ubiquitously found in freshwater and marine environments worldwide. In particular, wastewater treatment plants (WWTPs) or sewage treatment plants (STPs) have been recognized as a main source of microplastics in the receiving freshwater. However, only a few studies have been conducted to examine the impact of these facilities on receiving waters. In this study, we investigated the distribution of microplastics in surface water, fish, and sediment near a sewage treatment plant (STP) in the Tanchon stream, one of the main tributaries flowing into the Han River, Korea. The concentration of microplastics in water varied spatially and temporarily, ranging between 5.3 and 87.3 particles/m3 (31.4 ± 28.5 particles/m3). In fish, the concentration in upstream and downstream sites was 7.3 ± 7.3 and 12.4 ± 17.9 particles/fish, respectively. Spatially, the downstream site was the most polluted with microplastics in water and fish. The concentration of microplastics was positively correlated with fish body length and weight. In sediment, microplastic concentration in upstream and downstream sites was 493.1 ± 136.0 and 380.0 ± 144.2 particles/kg, respectively. The contribution of upstream to the microplastic load in downstream was 15.8% in dry season (April), which was higher than that of STP effluent and Yangjaechon creek. Meanwhile, the highest load was observed in STP effluent (5.1%) in rainy season (August). Microplastics were more abundant in water in the rainy season (37.4 ± 37.0 particles/m3) than in the dry season (28.2 ± 22.2 particles/m3). Polyethylene (49%) and polypropylene (18%) were the most abundant polymer types in water, fish, and sediment. Regarding shape of microplastics, fragments were dominant (95%) over fiber and film in water, fish, and sediment.

1. Introduction

Plastic materials and products have been an inevitable part of daily life since the world’s first-ever manmade plastic was introduced in 1862 [1]. Due to the versatility of plastic, with it being a light weight, strong material with low production costs, global production in 2017 exceeded 348 million tons and is expected to increase annually [2]. As a result, plastic debris has accumulated in aquatic environments [3]. Recently, many researchers have been interested in microplastics, i.e., plastic particles less than 5 mm in size, in freshwater bodies, and they have observed that microplastics have been discovered in surface water, benthic sediment, and fish in freshwater across the world [4,5,6,7,8,9]
Microplastic pollution has been recognized as a potential threat to the health of humans and aquatic organisms. Recent studies found that ingesting microplastics could pose risk to various aquatic organisms [10,11,12,13]. For instance, Lu et al. [10] reported that zebrafish, Danio rerio, showed inflammation, oxidative stress, alteration of metabolic profiles in the liver, and disturbed lipid and energy metabolism after ingesting microplastics. Oxidative stress and lipid peroxidation were also found in the rotifer Bachionus koreanus [11]. When Daphnia magna ingested microplastics, it was reported that mortality and the length of the inter-brood period increased, while reproduction and food intake decreased [12]. Tigriopus japonicus was also found to have a lowered reproduction rate and reduced body size following microplastic ingestion [13].
It is of critical importance to understand the source of microplastics to the aquatic environment as it can provide the opportunity for mitigation to prevent the pollution and minimize the possibility of effects in the future [14]. However, the sources of microplastics to freshwater systems are less understood. Wastewater treatment plant (WWTPs) and sewage treatment plant (STPs) have been recognized as the main pathways transporting microplastics to freshwater bodies [15,16,17,18]. Microplastics which are delivered into STPs or WWTPs may bypass treatment plants, eventually entering neighboring surface waters. Microplastics in WWTP or STP effluents can contaminate surface water, sediments, and fish in freshwater in the vicinity of treatment plants. However, only a few studies examined the impact of these facilities on the receiving aquatic environments and the occurrence of microplastics in the vicinity of plants [19]. Furthermore, studies have started to investigate sources and to assess the influences of pathways by linking weather pattern and hydrologic parameters to microplastic concentration near WWTP or STP [14,20,21]
In this study, we investigated the distribution of microplastics in the vicinity of a sewage treatment plant (STP) in three matrices (surface water stream, sediment, and fish). We examined microplastic characteristics between upstream and downstream sites, i.e., before and after the STP effluent entered the stream. We also examined the occurrence of microplastics in upstream and downstream sites before and after the rainy season, as well as the contribution of STPs to the receiving aquatic environment. Lastly, the characteristics of microplastics such as size distribution, shape, and polymer type of microplastics obtained in surface water stream, sediment, and fish were compared.

2. Materials and Methods

2.1. Study Area

Tanchon stream is one of the major tributaries that flow into the Han River in Korea. There are four major tributaries in the Han River below the Paldang dam, which is the largest drinking water reservoir in Korea, providing a drinking water source to more than 25 million people. Tanchon stream is adjacent to the Han River (Figure 1). It is 33.86 km long and its watershed has an area of 417 km2. The population and density in the watershed near the Tanchon stream were 3,088,326 inhabitants and 9406 inhabitants/km2 in 2018, respectively [22]. There are two STPs in this stream, one of which was the site for this study and is located in the downstream of the Tanchon stream. The amount of treated effluent from this STP is 758,962 m3/day (Korean Ministry of Environment, 2018). There were four sampling sites for water and two sites for fish and sediment in this stream (Figure 1). Sampling sites were selected to compare the concentration of microplastics in the water, fish, and sediment before and after the STP effluent entered the stream.

2.2. Sample Collection

Samples for analyzing microplastics were obtained from surface water, sediment, and fish. Surface water samples were collected in the middle of the stream at four sites (upstream (n = 2), downstream (n = 2), in the effluent of the STP (n = 2), and at the end of Yangjaechon creek (n = 2)) on two occasions (April and August 2019). Yangjaechon creek is a tributary flowing into the Tanchon stream where there is no upstream STP. The upstream, Yangjaechon creek, and downstream sampling sites were located 3 km upstream, and 1.3 km and 3 km downstream, respectively, from the STP effluent inflow (Figure 1).
Water samples were collected twice a year in the dry season (April) and the rainy season (August). Water sampling was performed with a 100 µm pore size manta net, which is a commonly used tool. The total volume of sampling was 3–5 m3, which was calculated using a flow meter (Digital flowmeter (438 115), Germany). The sampling device was washed with Milli-Q water between samples to avoid cross-contamination. Filtered samples from the manta net were collected in collection caps, and then the samples were transferred into 1 L glass jars and transported to the laboratory for analysis. Blank samples were also collected to identify any contamination during the sampling procedure.
For samplings of fish and sediment, two sites were selected at upstream (n = 7 for fish, n = 1 for sediment) and downstream (n = 7 for fish, n = 1 for sediment) locations. Sediment sampling was performed in April 2019. The top 10 cm of the sediment was collected with a ponar grab sampler from two sites, i.e., upstream and downstream in the Tanchon stream. Five sediment samples were collected in a transect of the stream and combined into a single representative sample, to reduce the sample heterogeneity. Samples were placed in 2 L glass bottles, transported to the laboratory, and stored at 4 °C before analysis.
Fish were captured using a net in upstream and downstream locations in the Tanchon stream in April 2019. Overall, 14 fish belonging to five genera were sampled, i.e., Cyprinus carpio, Carassius auratus, Pseudogobio esocinus, Micropterus salmoides, and Zacco platypus. Where possible, the fish were transported to the laboratory alive. Then, the fish were placed straight into the freezer. Samples were kept at −20 °C until processed in the laboratory.

2.3. Sample Preparation

All samples were analyzed in the laboratory using modified methods described in previous research [3,23,24]. Water samples were filtered through a stacked series of metal sieves between 100 µm and 5 mm with Milli-Q water, and particles sized >5 mm and <100 µm were discarded. After the filtration, the substances on the filters were immediately transferred to a beaker, and 30% H2O2 was used to digest the organic matter. The beaker was stirred with a glass magnetic bar at 62.5 °C and 180 rpm for 24 h. After the digestion was completed, the sample in the beaker was vacuum-filtered through a stainless-steel filter (45 µm pore size). After the filtration, the metal filter was sealed in a Petri dish and placed into an oven at 40 °C for 12 h prior to Fourier-transform infrared spectroscopy (FTIR) analysis.
For fish samples, body length (mm) and weight (g) were measured. Subsequently, the entire gastrointestinal tract (GIT) in each fish was dissembled and transferred to 250 mL glass beakers, and 150 mL of 10% potassium hydroxide (KOH) solution (Wako Chemicals USA, Inc., Richmond, VA, USA) was added for digestion. The beaker was stirred with a glass magnetic bar at 62.5 °C and 180 rpm for at least 3 days. However, the time for digestion was determined by the size of GIT. After complete digestion of the GIT, the sample in the beaker was vacuum-filtered through a stainless-steel filter (45 µm pore size). After the filtration, the metal filter was sealed in a Petri dish and placed into an oven at 40 °C for 12 h before FTIR analysis.
Five sediment samples were collected across the stream and combined into a single representative sample. One mixed sample was placed in stainless-steel trays and dried in an oven at 50 °C until a constant weight was obtained. Approximately 50 g of dried sediment was weighed and placed in a 250 mL beaker. Then, density separation was followed using a high-density (2.5 g/cm3) ZnBr2 solution. NaI solution, instead of the concentrated NaCl solution, enables the extraction of all types of microplastics in environmental samples, resulting in high (98%) extraction efficiency [25]. In this study, however, NaI was replaced with ZnBr2. When NaI was melted completely to be adjusted to 2.5 g/cm3, dihydrate was formed on the following day. This suggests that the density of NaI is <2.5 g/cm3 and is not capable of separating polytetrafluoroethylene PTFE from the sediment. In a previous study [26], PTFE was found in fish but not in the water, due to its density. Considering the density of PTFE, it is highly possible that PTFE could be found in sediments. However, there is no research that dealt with PTFE in sediments. After the addition of a 50 mL ZnBr2 solution to the sample, the mixture was stirred with a glass magnetic stirring bar for 1 h and allowed to stand for 24 h. The supernatant extracted from the sediment was filtered on a 45 µm pore size steel-wire sieve. The sieve was placed into a 250 mL beaker filled with 100 mL of H2O2 (Wako Chemicals USA, Inc., USA) and shaken carefully to separate the particles from the sieve. The solution was stirred using a glass magnetic stirring bar at 62.5 °C and 180 rpm for at least 3 days. After the digestion was complete, the sample in the beaker was vacuum-filtered through a 45 µm pore size steel-wire filter. Steel-wire filters were stored in Petri dishes and placed in an oven at 40 °C for 12 h before FTIR analysis.

2.4. Characterization of Microplastics

Microplastics were classified by the plastic type (e.g., polyethylene, polypropylene, and polystyrene) and shape (e.g., fragment, fiber, and film). Furthermore, particles were measured at their largest cross-section and categorized according to the following size classes: 0.1–0.3 mm, 0.3–0.6 mm, 0.6–1.0 mm, and 1–5 mm. Then, an FTIR microscope (NicoletTM MX Imaging, Thermo-Fisher Scientific, Madison, WI, USA) with an array detector was used to identify the polymer composition. Images were collected through infrared mapping with transition mode whose step size was 25 µm × 25 µm. Ultrafast mapping covered 10 mm × 10 mm of the total imaged area at one time. Areas of interest were then selected, and the spectra of each particle were obtained using OMNIC picta ver.1.7 HF1, an automated software. The spectral range was set between 4000 and 715 cm−1 with a collection time of 0.1 s and one scan per measurement. Using OMNIC Picta ver.1.7 HF1 software (Thermo-Fisher Scientific, Madison, WI, USA), all obtained spectra were post-processed and compared with a database of custom references provided by Thermo-Fisher Scientific. Although each polymer type has a different matching rate, results compared with the library that matched with >65% confidence were regarded as plastic polymers.

3. Results and Discussion

3.1. The Concentration of Microplastics in Water

Microplastics were detected in almost all surface water, fish, and sediment samples. Microplastics were found in all water samples. The concentration of microplastics in water varied spatially and temporarily, ranging from 5.3–87.3 particles/m3. The highest concentration of microplastics was observed in the downstream site in Tanchon stream in August (i.e., the rainy season), where the microplastic concentration was one order of magnitude higher than in the lowest concentration. The concentration of microplastic in the Han River increased from upstream to downstream as the Tanchon stream flew toward the Seoul metropolitan area. This result was similar to the result reported by Windsor et al. [27], in which the microplastic concentration in upstream was higher than that of downstream in the Rhine river. In contrast, Windsor et al. [28] reported that no increase was observed in a downstream area of a WWTP in the United Kingdom (UK) compared to upstream.
During the sampling periods, total precipitation for 2 days prior to each sampling date in the upstream and downstream area was (data from a local station in Seoul city) 5.6 mm in April and 62.6 mm in August. Taking into account episodic precipitation which may influence the concentration of microplastic, we compared the seasonal variation of microplastic concentration in water. Overall microplastic concentration in water samples was higher in August, ranging from 5.3–87.3 particles/m3 (37.4 ± 37.0 particles/m3), than in April (i.e., the dry season), ranging from 8.6–60.0 particles/m3 (28.2 ± 22.2 particles/m3) at all sampling sites with the exception of the upstream site in August (Figure 2). This result was consistent with other studies [29,30,31], which showed that the highest concentration in water was observed during the rainy season. One possible reason is that runoff could play a pivotal role in increasing the concentration of microplastic in water. Heavy rain induces microplastics on the land to flow into streams or rivers [29,32]. The microplastic concentration in this study was distinctively higher than that of Germany, whose result showed that there was no evident seasonal microplastic concentration variation pattern detected [6]. This result implies that rainfall potentially increases microplastic input into streams or rivers. Another possible reason is that heavy rain increases the flow velocity, resulting in resuspension of microplastics deposited on the sediment [33].
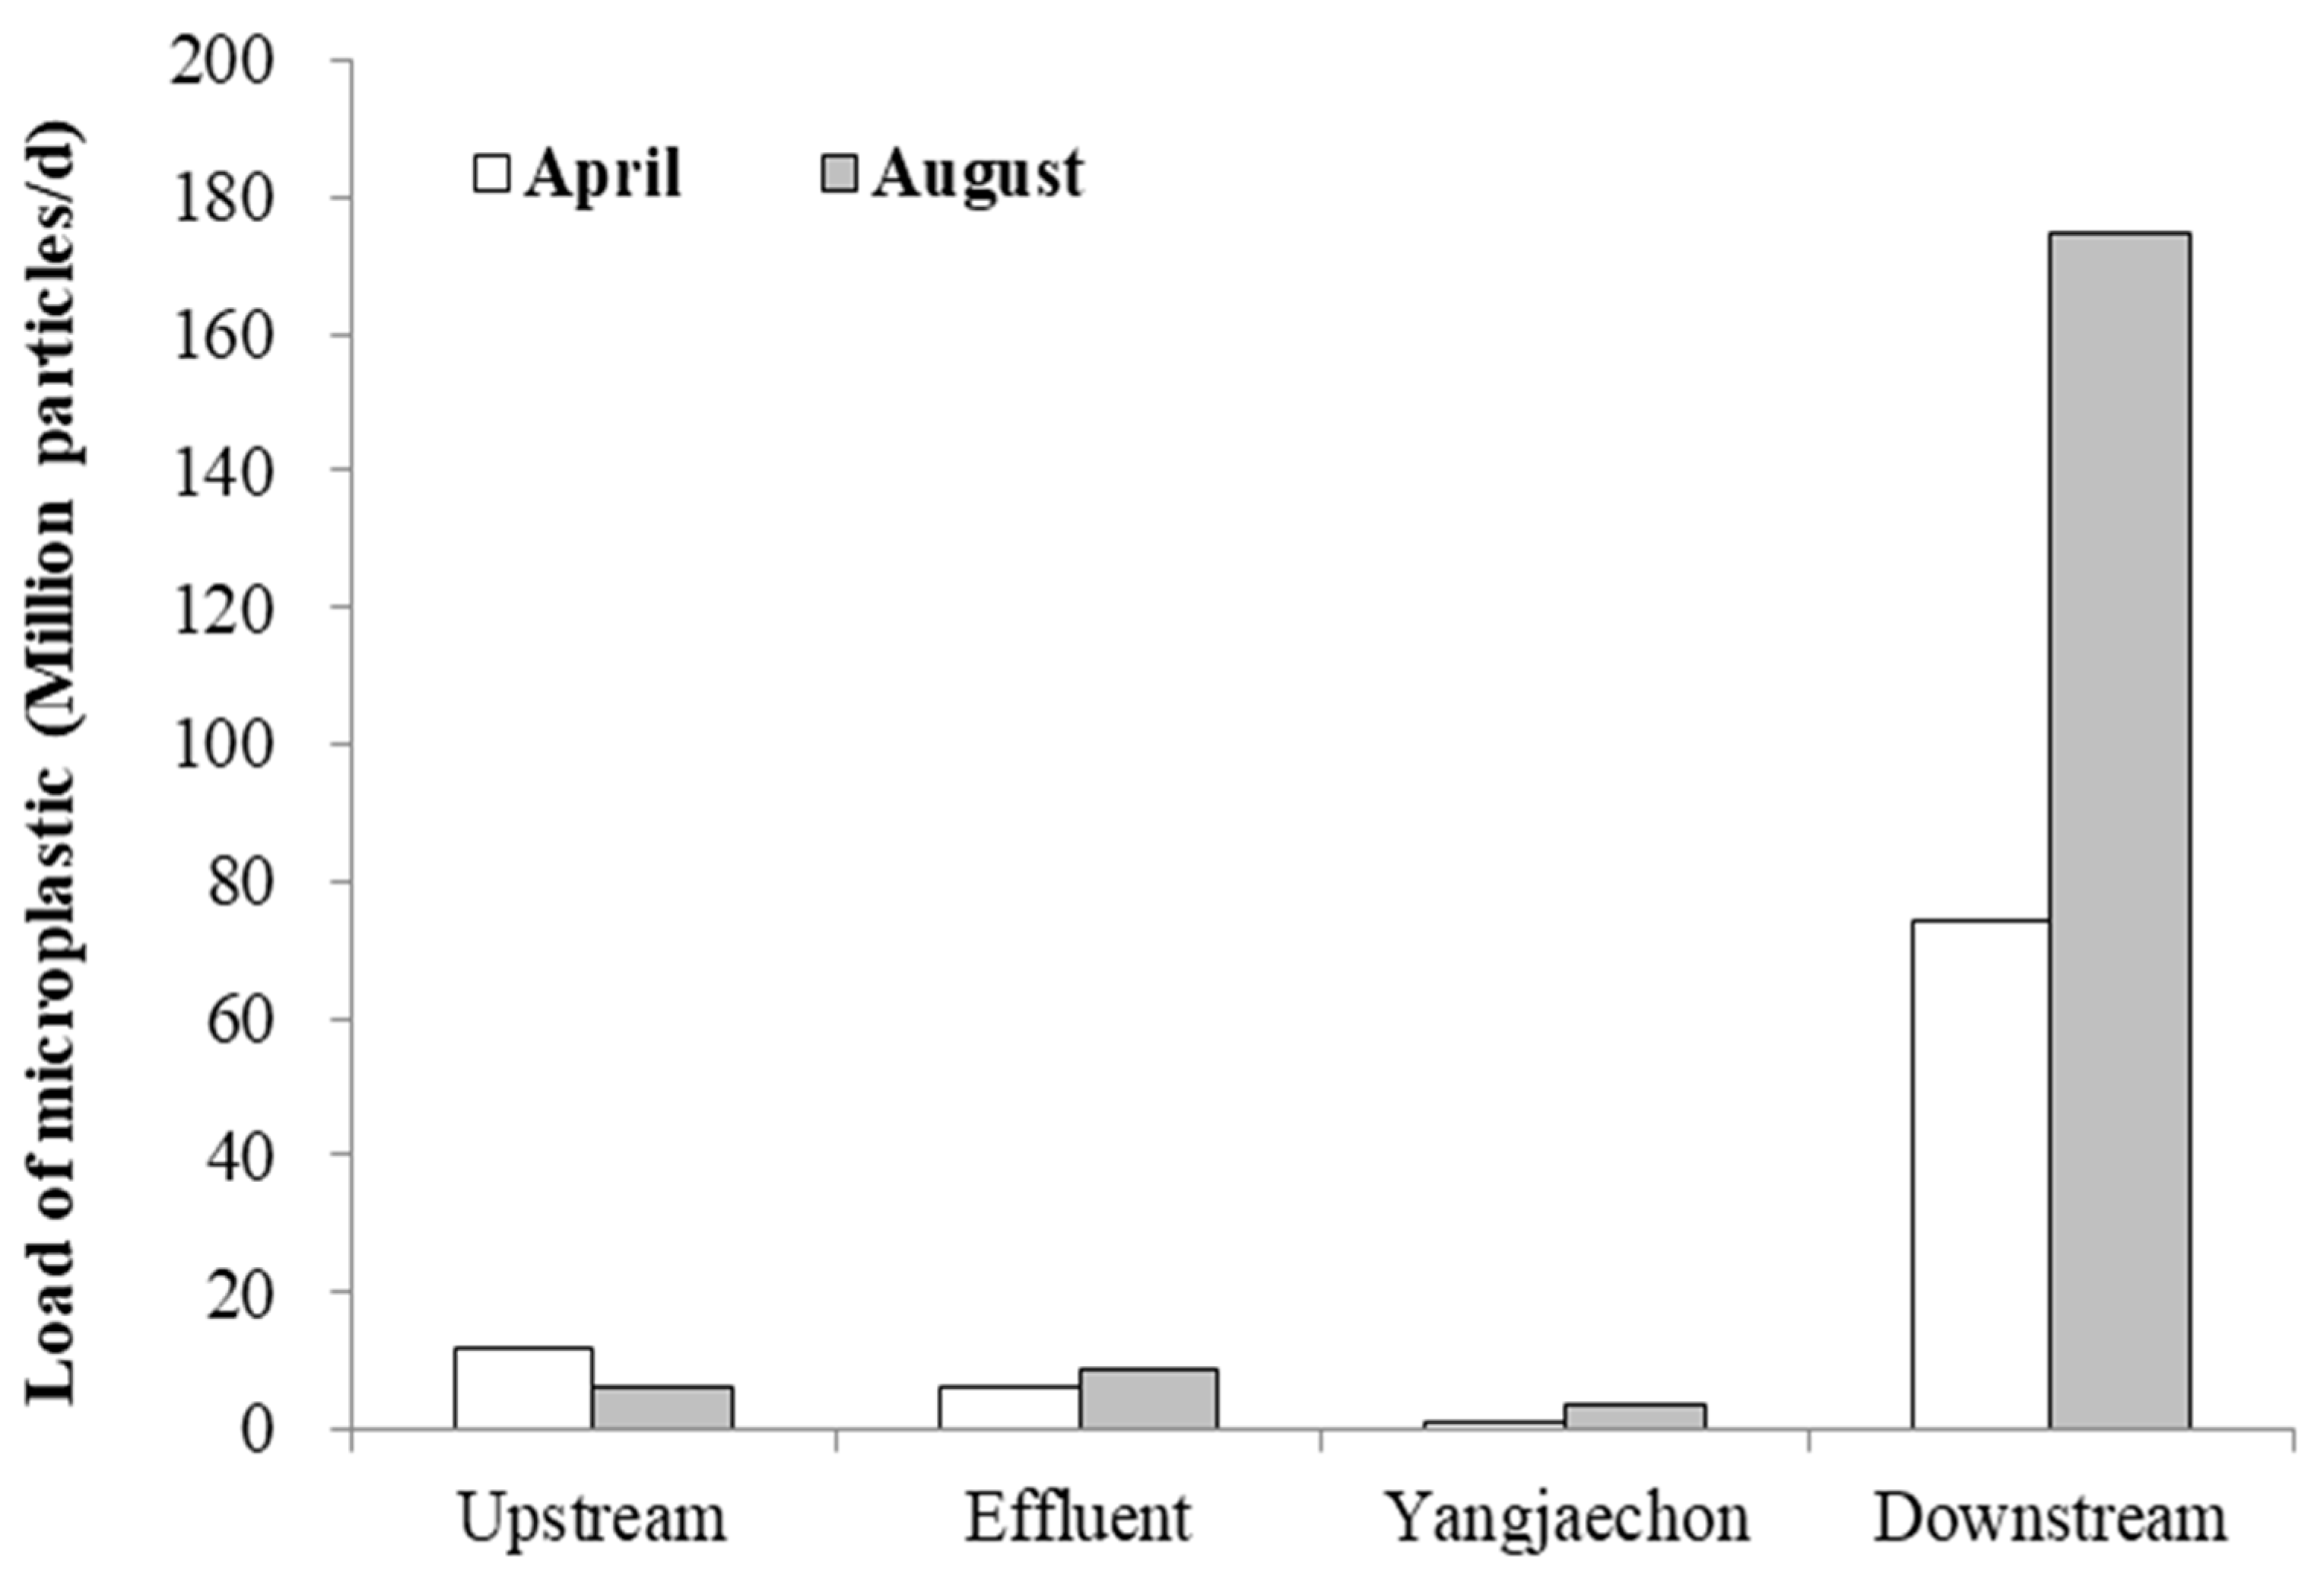
The contributions of microplastics from upstream, STP effluent, and Yangjaechon creek to the concentration in the downstream site were calculated by calculating microplastic concentration using microplastic concentration and flow rate at each site (Figure 3). Since the samples were collected from the water surface, the vertical distribution was not taken into account when calculating the microplastic load. The flow rates in upstream, in STP effluent, in Yangjaechon creek, and in downstream were 503,798, 693,904, 38,362, and 1,236,064 m3·day−1 in April and 599,728, 693,904, 105,667, and 1,399,299 m3·day−1 in August, respectively. On average, the flow rate in August was 62% higher than that in April due to the heavy rain. A seasonal load variation was observed. The contribution of upstream to the microplastic load in downstream was 15.8% in April, which was higher than that of STP effluent and Yangjaechon creek. Meanwhile, the highest load was observed in STP effluent (5.1%) in August (Figure 3).
Several studies reported that STPs or WWTPs are considered as main point sources of microplastics in aquatic environments [34,35,36]. Our result indicated that, despite the higher removal efficiency (99.9%) of microplastics in STPs and WWTPs, when the flow rate was considered, a significant amount of microplastics escaped from these facilities and entered receiving waters [36]. However, there was a significant discrepancy in the daily microplastic load downstream and at other sites (Figure 3). The sum of the daily microplastic load at the upstream site, in STP effluent, and from Yangjaechon creek was far less than that in the downstream site. This result can be due to several reasons. One reason is that the flow rate and microplastic concentration at the downstream site were much higher than those of other sites. As mentioned, resuspension in the downstream area caused an increased concentration, resulting in a dramatic increase in the daily microplastic load [33]. Another reason can be that microplastics might be washed off after the rainfall and flow into the nearby stream via surface runoff. When the stream flows down, the area affected by rainfall is increased, which causes a dramatic increase in microplastic concentration downstream compared to upstream [37,38,39,40,41]. It was reported that the concentration in stormwater runoff from the urban area was higher than that of agricultural runoff and treated wastewater effluent, indicating that anthropogenic particles from the urban area can have a significant contribution to the stormwater runoff concentration [31]. This result implies that the diffuse sources need to be quantified to understand the contribution of microplastics to adjacent water bodies and the transport and fate of microplastic in freshwater systems.

3.2. The Concentration of Microplastics in Fish

Regarding the concentration of microplastics in fish, to the best of our knowledge, this study is the first to monitor the concentration of microplastics ingested by fish inhabiting a surface water environment near the STPs in Korea. Three omnivorous, one insectivorous, and one carnivorous species were examined for microplastics (Table 1). In total, 14 freshwater fish (five species) were examined. A total of 138 microplastic particles were observed from fish caught in Tanchon stream in the vicinity of the STP, implying that microplastics were observed in 93% of the sampled fish. This is a higher detection frequency in freshwater fish compared to that reported other countries, e.g., 83% in Brazil [42], 9% in Belgium [43], 91% in China [44], 12% in France [7], 20.6% in Germany [6], 8.2–29.2% in Mexico [45], and 85% in the United States of America (USA) [4].
The mean concentration of microplastics in the 14 fish was 9.9 ± 13.4 particles/fish. Comparing the two sites, the concentration range of microplastics in fish at the upstream site was 7.3 ± 7.3 particles/fish, while that of microplastics in fish from downstream was 12.4 ± 17.9 particles/fish (Figure 2). A similar result was obtained by the study of Peters and Bratton [40], which concluded that, due to the urbanization, the concentration in fish collected in downstream was higher than that of upstream. This result implies that microplastic ingestion by fish is influenced by anthropogenic disturbance and point source [27].
The highest concentration of microplastic was found in carp and the lowest concentration was recorded in bass (Table 1). The concentration of microplastics in fish in this study showed a similar result to that observed in the Muskeong River, Milwaukee River, and St. Joseph River in the USA, which ranged from 10–13 particles/fish [4]. Meanwhile, the microplastic concentration reported in another study was lower than that of this study, showing a mean ingestion value with 0.69 ± 1.25 particles/fish in the River Thames, UK [41]. However, the concentration in fish in this study was lower than that reported by [46], which found that the concentration in fish was approximately 8–55 particles/fish in Argentina. This result indicates the microplastic concentration varies and is dependent on geological factors [47,48].
The concentration of microplastic in fish was correlated with the microplastic concentration in water (Figure 2a,b), indicating that fish is likely to be mainly exposed to microplastics present in water. However, habitat is another important factor in determining the microplastic concentration in fish [26]. A recent result suggested that feeding habits could determine the degree of accumulation of microplastic in fish because different types of fish with different feeding habits consume different amounts of microplastic in water [40].
There was a positive correlation between the concentration of microplastics and fish body length and weight (Figure 4). Linear regression analyses indicated that the concentration of microplastic was associated with fish length (r2 = 0.85, y = 0.06x + 2.991) and weight (r2 = 0.87, y = 0.0099x + 2.8695). A higher concentration of microplastics was observed in omnivorous species. This result corroborates the findings of other studies [4,41,49], implying that microplastics ingested by fish could accumulate with age and that the higher energy demands of larger fish require an increased volume of food. In contrast, some results were not consistent with this result, arguing that there was no correlation between the microplastic concentration and the length or weight of fish [50].

3.3. The Concentration of Microplastics in Sediment

While microplastic pollution was prevalent at the upstream and downstream sites of the Tanchon stream, a different distribution pattern of microplastics was observed in the sediments (Figure 2c). Compared to the results of water and fish, microplastic concentration in the downstream side of the Tanchon stream was higher than that of the upstream site. The concentrations in the upstream and downstream sites were 499.8 ± 124.8 particles/kg and 339.8 ± 52.9 particles/kg, respectively, which are two orders of magnitude lower than those in the Pearl River (80–9597 particles/kg) [51]. Our result was similar to other results reported by [52], in which the concentration ranged from 178–554 particles/kg in the Beijiang River, and by [41], where the concentration ranged from 143–193 particles/kg in the River Thames basin. The concentration of microplastics also ranged from 10–520 particles/kg in Brisbane River sediments [53], and the microplastic concentration in the Bloukrans River in South Africa was 13.3–563.8 particles/kg [54]. Moreover, it was reported that, when the microplastic concentration in sediment was high, the microplastic concentration in Chironomus spp., a typical deposit feeder inhabiting in the benthic river, was also high [55]. However, in our study, the microplastic concentration in downstream sediment was lower than that in upstream sediments, whereas the opposite results were obtained in water and fish. Further research is needed to elucidate the reasons for these different results.

3.4. Characteristics of Microplastics

3.4.1. The Size Distribution of Microplastics

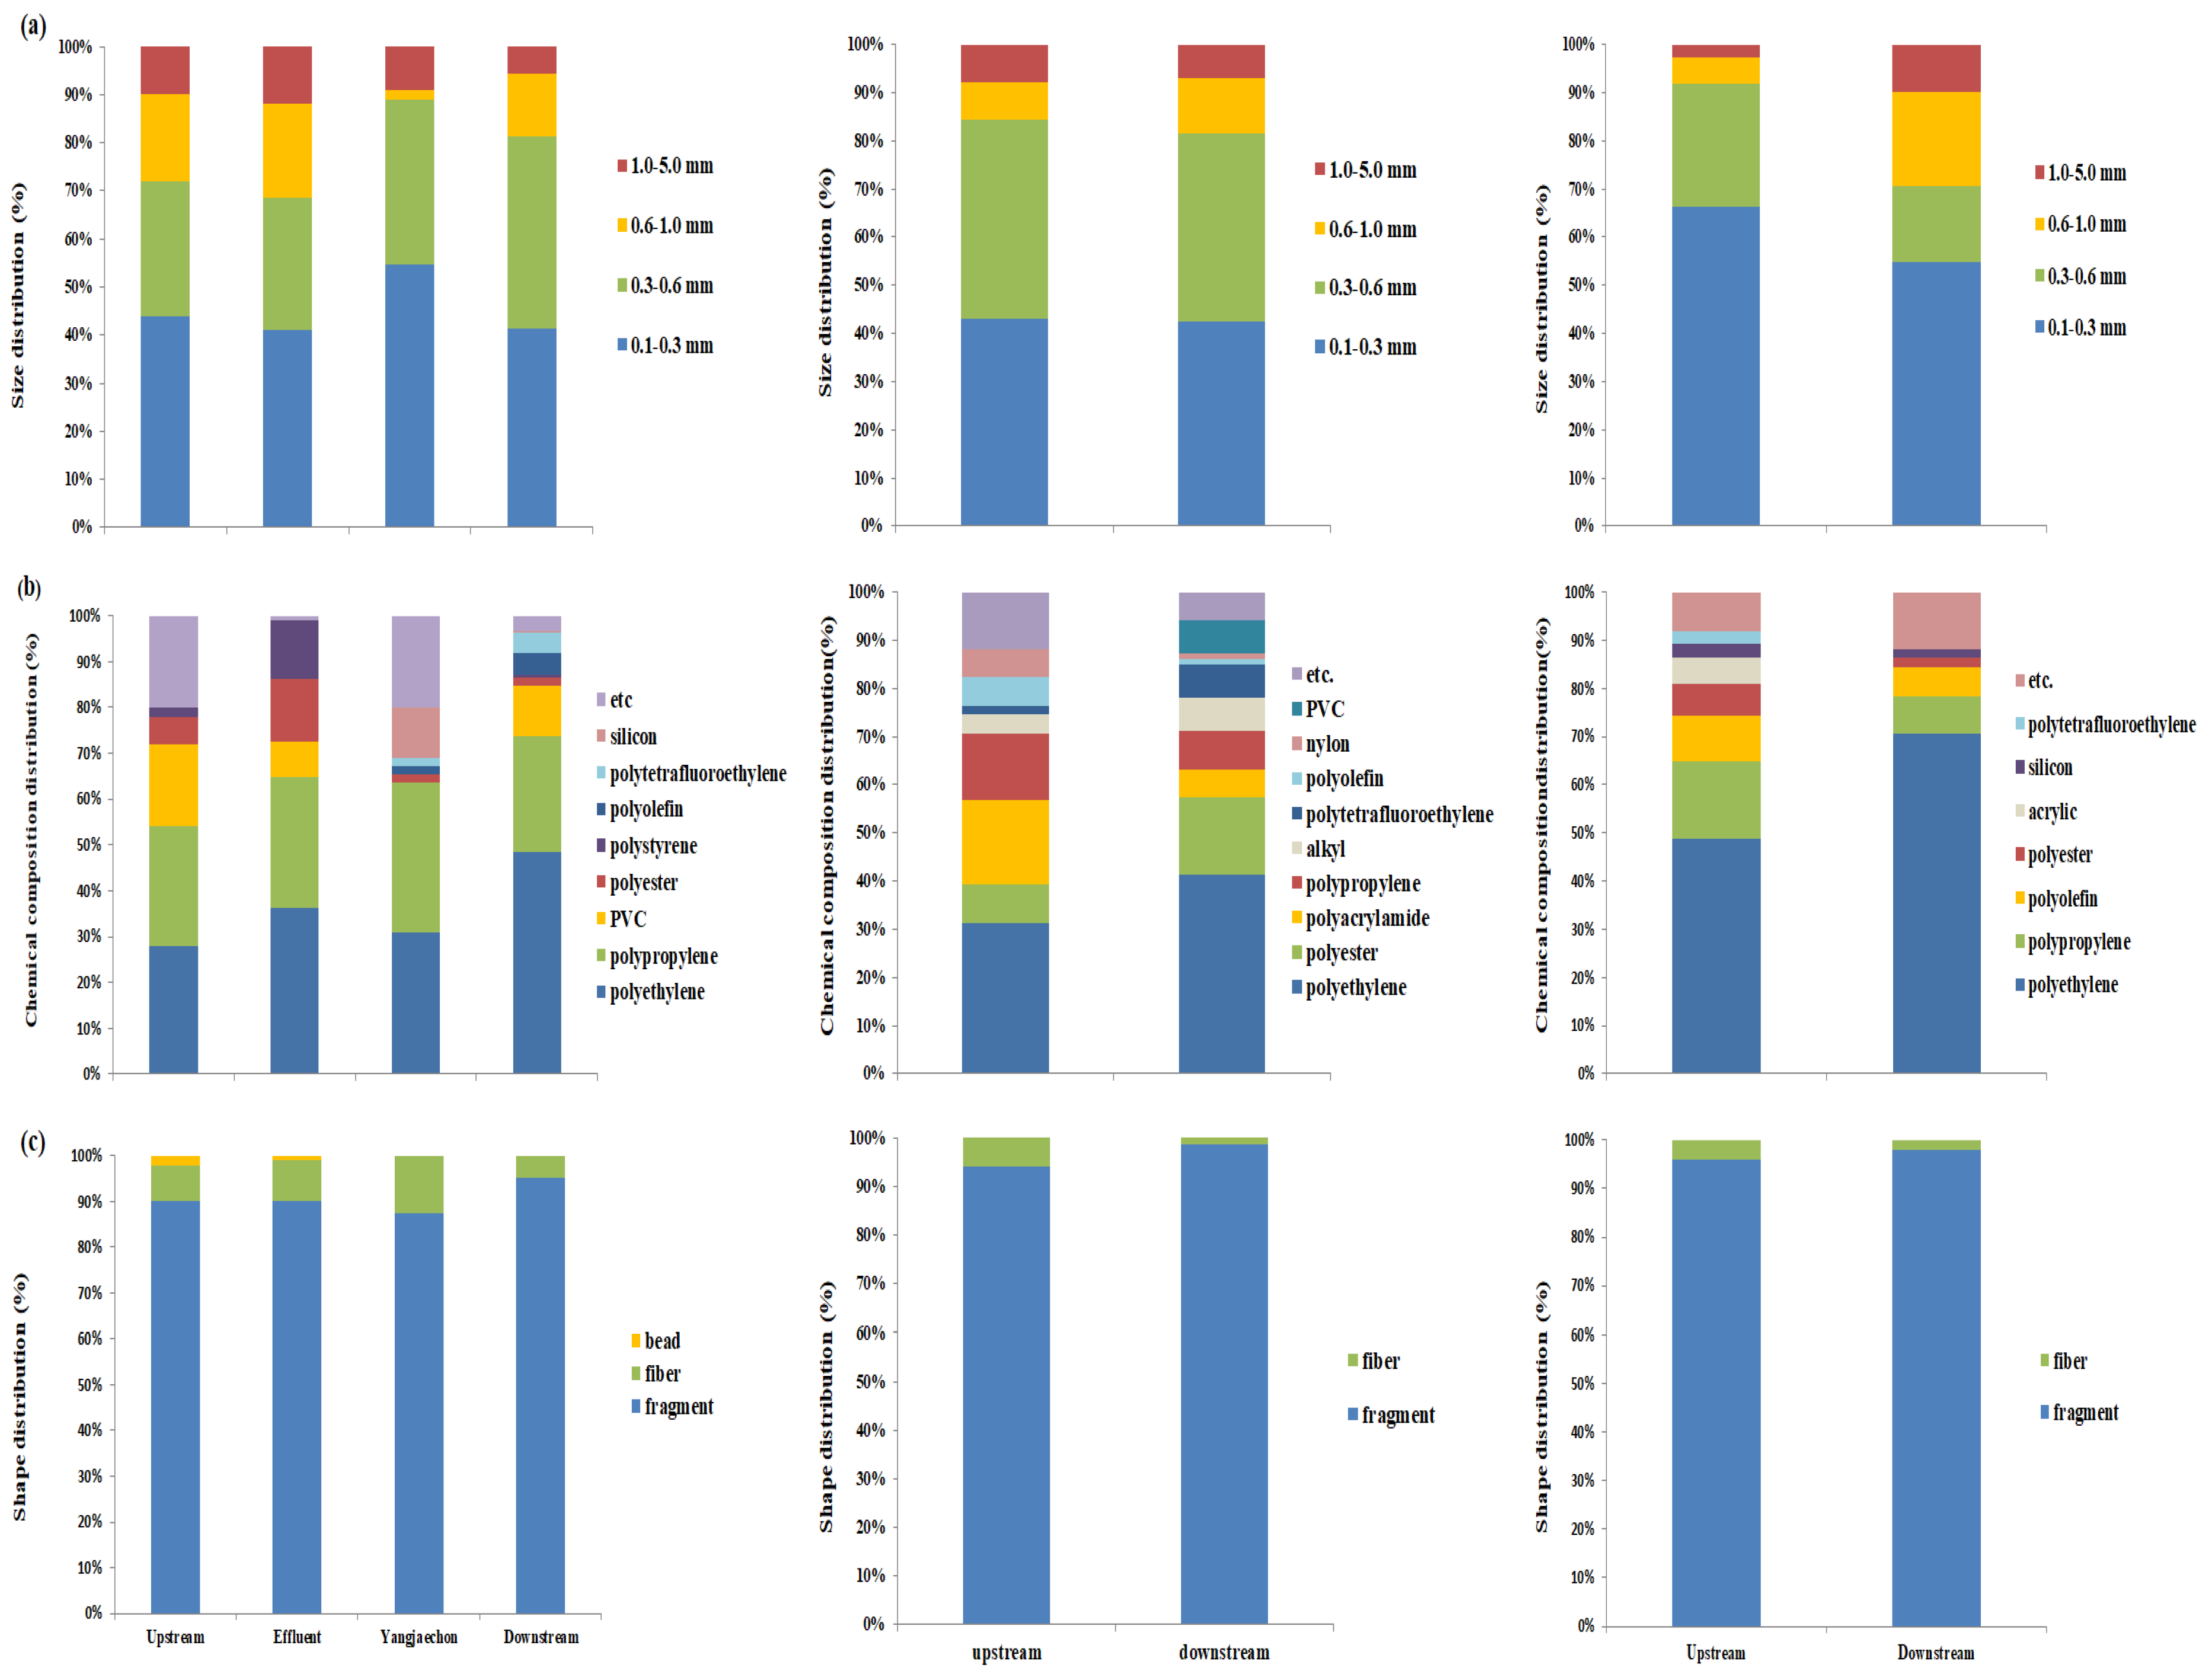
The size classification of microplastics in water, fish, and sediment was divided into four classes: 0.1–0.3 mm, 0.3–0.6 mm, 0.6–1.0 mm, and 1.0–5.0 mm, (Figure 5, Table S1, Supplementary Materials). Regardless of the sample type, the microplastic size distributions in all sites were similar. Small microplastics (<1 mm) were predominant at all sites (98%, 410/417), indicating that, when the particle size is smaller, the concentration of microplastics usually increases. Similar results were reported in other studies conducted by [26,44,55,56,57,58,59]. Meanwhile, in sediment samples, microplastics with a size ranging from 0.1–0.3 mm were the most abundant (66% upstream and 54% downstream), followed by the size class of 0.3–0.6 mm (26% upstream and 16% downstream). Higher concentrations of small-sized microplastics in water and sediment in this study were most likely due to the decomposition of larger particles into smaller ones [59,60,61,62]. The size distribution in fish was similar to that in water and sediment samples. The most abundant size class was 0.1–0.3 mm (43% upstream and downstream), followed by 0.3–0.6 mm (41% upstream and 39% downstream). The result in fish indicates that, since small-sized microplastics appear similar to zooplankton, it is highly possible that aquatic organisms could mistakenly ingest the microplastics [44,63].

3.4.2. Shape of Microplastics

Although small amounts of bead-shaped particles were found in the upstream site and the STP effluent, fragment type was the most dominant microplastic shape in water, fish, and sediment. The fragment type comprised 92% of the microplastics in water, 97% in fish, and 97% in sediment. Among the water samples, fragments comprised 90% of the microplastics in the upstream site and in the STP effluent, 87% in Yangjaechon creek, and 95% in the downstream site (Figure 5, Table S2, Supplementary Materials). Similar results were reported in other studies [17,50,57,58,64,65,66,67] (Figure 5c). This result implies that fragment-shaped microplastics are the result of anthropogenic activities and evidence of secondary microplastics, which are produced via the fragmentation of larger plastics [17,67].
Compared to of fragment types observed in this study, fiber-shaped microplastics were abundant in many other studies [4,40,44,58,68,69,70,71,72]. This discrepancy in concentration between fragments and fibers may be explained by the fact that this study area is mainly polluted with secondary microplastics produced by the decomposition of larger low-density plastics such as polyethylene and polypropylene. Another reason can be that when the sample is vacuum-filtered through a 45-µm pore size stainless-steel filter, some fibers might be lost by passing through the filter, resulting in the concentration of fibers being underestimated. Additional experiments are needed to elucidate the reason for the observed difference in the concentrations of microplastic fragments and fibers.

3.4.3. Polymer Type

The most common polymer types detected in the upstream and downstream of Tanchon stream were polyethylene (41%) and polypropylene (22%) in water, polyethylene (38%) and polyester (13%) in fish, and polyethylene (58%) and polypropylene (13%) in sediment (Figure 5, Table S3, Supplementary Materials). Overall, polyethylene and polypropylene were the most common polymer types observed. These polymers are known to be the most widely produced in the world, satisfying 48.7% of the European plastic demand [72]. The high demand in the market for polyethylene and polypropylene is in line with the frequent detection of these plastics in aquatic environments. Although these ubiquitous polymers have a lower density than water, they can be found in sediment [63,73,74], which can be explained by biofilm growth or biofouling and aggregation [75,76,77].
In water, in addition to polyethylene and polypropylene, polyvinyl chloride (10%), polyester (5%), polystyrene (4%), polyolefin (3%), and polytetrafluoroethylene (2%) were detected. In fish, polyacrylamide (10%), polypropylene (10%), alkyl (6%), and polytetrafluoroethylene (5%) were followed by polyethylene (49%) and polyester (17%). In sediment, polyolefin (8%), polyester (3%), acrylic, silicon (2%), and polytetrafluoroethylene (2%) which was not commonly found in other studies, were detected. Since polytetrafluoroethylene has a high density (2.2–2.3 g cm−3), it was found in sediment and fish while it was rarely found in water in this study. This result implies that plastic density plays an important role in determining their distribution in aquatic environments [77]. In addition, polyester was observed only in STP effluent. The main source of this polymer is synthetic textile [78], suggesting that it might have originated from households. This may be evidence that STPs can contribute to microplastic contamination of receiving waters [79].

4. Conclusions

To the best of our knowledge, this is the first investigation into the distribution of microplastics in freshwater, fish, and sediment in the vicinity of the STP in Korea. The contributions of the STP, as well as the diffuse source to the Tanchon stream, were determined. In particular, the contribution of the diffuse source to the Tanchon stream was more than the sum of the amount of microplastic in the upstream site, the STP effluent, and Yangjaechon creek. A positive correlation between the microplastic concentration and fish body length and weight was observed. Spatially, the downstream was the most polluted with microplastics in water and fish. However, it is not clear why the microplastic concentration in downstream sediment was lower than that of upstream sediments, and this needs further investigation. Temporarily, microplastic was more abundant in the rainy season than in the dry season. Polyethylene (PE) and polypropylene (PP) were the most abundant polymer types, and fragments were the dominant shape in all media including water, fish, and sediment. Further study is necessary to quantitatively determine the contributions of diffuse sources to adjacent water bodies to understand the transport, fate, and distribution of microplastics in freshwater.

Supplementary Materials

The following are available online at https://www.mdpi.com/2073-4441/12/12/3333/s1, Table S1. Size distribution of microplastic in upstream, effluent, Yangjaechon and downstream of Tanchon stream, Korea. Table S2. Shape distribution of microplastic in upstream, effluent, Yangjaechon and downstream of Tanchon stream, Korea. Table S3. Chemical compositions of microplastic in upstream, effluent, Yangjaechon and downstream of Tanchon stream, Korea.

Author Contributions

T.-J.P. Conceptualization, Methodology, Writing–original draft. S.-H.L.: Investigation, Formal analysis, Validation. M.-S.L.: Methodology, Investigation, Writing-review & editing. J.-K.L.: Review, Supervision. J.-H.P.: Review, Supervision. K.-D.Z.: Conceptualization, Supervision, Writing-review & editing. All authors have read and agreed to the published version of the manuscript.

Funding

This work was funded by the Ministry of Environment (MOE) of the Korea.

Acknowledgments

This work was supported by a grant from the National Institute of Environment Research (NIER-2019-01-01-036).

Conflicts of Interest

The authors declare no conflict of interest.

References

  1. Buist, J.M. Resume-the origins of polymers and their cellular derivates. Prog. Rubber Plast. Technol. 1986, 2, 17–30. [Google Scholar]
  2. Plastics—The Facts. An Analysis of European Plastics Production, Demand and Waste Data; PlasticEurope: Brussels, Belgium, 2018. [Google Scholar]
  3. Foekema, E.M.; Gruijter, C.D.; Mergia, M.T.; van Franeker, J.A.; Murk, A.T.J.; Kolemans, A.A. Plastic in North sea fish. Environ. Sci. Technol. 2013, 27, 8818–8824. [Google Scholar] [CrossRef] [PubMed]
  4. McNeish, R.E.; Kim, L.H.; Barrett, H.A.; Mason, S.A.; Kelly, J.J.; Hoellein, T.J. Microplastic in riverine fish is connected to species traits. Sci. Rep. 2018, 8, 11639. [Google Scholar] [CrossRef] [Green Version]
  5. Pinheiro, C.; Oliveira, U.; Vieira, M. Occurrence and impacts of microplastics in freshwater fish. J. Aquac. Mar. Biol. 2017, 5, 00138. [Google Scholar]
  6. Roch, S.; Water, T.; Ittner, L.D.; Friedrich, C.; Brinker, A. A systematic study of the microplastic burden in freshwater fishes of south-western Germany—Are we searching at the right scale? Sci. Total Environ. 2019, 689, 1001–1011. [Google Scholar] [CrossRef]
  7. Sanchez, W.; Bender, C.; Porcher, J.M. Wild gudgeons (Gobio gobio) from French rivers are contaminated by microplastics: Preliminary study and first evidence. Environ. Res. 2014, 128, 98–100. [Google Scholar] [CrossRef]
  8. Sighicelli, M.; Pietrelli, L.; Lecce, F.; Iannilli, V.; Falconieri, M.; Coscia, L.; Di Vito, S.; Nuglio, S.; Zampetti, G. Microplastic pollution in the surface waters of Italian subalpine lake. Environ. Pollut. 2018, 236, 645–651. [Google Scholar] [CrossRef] [PubMed]
  9. Van Cauwenberghe, L.; Devries, L.; Galgani, F.; Robbens, J.; Janssen, C.R. Microplastics in sediments: A review of techniques, occurrence and effects. Mar. Environ. Res. 2015, 111, 5–17. [Google Scholar] [CrossRef] [Green Version]
  10. Lu, Y.F.; Zhng, Y.; Deng, Y.F. Uptake and accumulation of polystyrene microplastics in zebrafish (Danio rerio) and toxic effects in liver. Environ. Sci. Technol. 2016, 50, 4054–4060. [Google Scholar] [CrossRef]
  11. Jeong, C.B.; Kang, H.M.; Lee, Y.H. Nanoplastic ingestion enhances toxicity of persistent organic pollutants (POPs) in the monogonont rotifer Brachionus koreanus via multixenobiotic resistance (MXR) disruption. Environ. Sci. Technol. 2018, 52, 11411–11418. [Google Scholar] [CrossRef]
  12. Ogonowski, M.; Schur, C.; Jarsen, A. The effects of natural and anthropogenic microplastics on individual fitness in Daphnia magna. PLoS ONE. 2016, 11, e0155063. [Google Scholar] [CrossRef] [PubMed]
  13. Lee, K.W.; Shin, W.J.; Kwon, O.Y.; Kang, J.H. Size-dependent effects of micropolystyrene particles in the marine copepod Tigriopus japonicas. Environ. Sci. Technol. 2013, 47, 11278–11283. [Google Scholar] [CrossRef] [PubMed]
  14. Grbíc, J.; Hel, P.; Athey, S.; Rochman, C.M. Microplastics entering northwestern Lake Ontario are diverse and linked to urban sources. Water Res. 2020, 174, 115623. [Google Scholar] [CrossRef] [PubMed]
  15. Murphy, F.; Edwins, C.; Carbonnier, F.; Quinn, B. Wastewater treatment works (WwTW) as a source of microplastics in the aquatic environment. Environ. Sci. Technol. 2016, 50, 5800–5808. [Google Scholar] [CrossRef] [Green Version]
  16. Conley, K.; Clum, A.; Deepe, J.; Lane, H.; Beckingham, B. Wastewater treatment plants as a source of microplastics to an urban estuary: Removal efficiencies and loading per capita over one year. Water Res. X 2019, 3, 100030. [Google Scholar] [CrossRef]
  17. Kazour, M.; Terki, S.; Rabhi, K.; Jemaaa, S.; Khalaf, G.; Amara, R. Sources of microplastics pollution in the marine environment: Importance of wastewater treatment plant and coastal landfill. Mar. Pollut. Bull. 2019, 146, 608–618. [Google Scholar] [CrossRef]
  18. Alvim, C.B.; Mendoza-Roca, J.A.; Bes-Pia, A. Wastewater treatment plant as microplastics release source—Quantification and identification techniques. J. Environ. Manag. 2020, 255, 109739. [Google Scholar] [CrossRef]
  19. Blair, R.M.; Waldron, S.; Phoenix, V.; Guachotte-Lindsay, C. Micro- and nanoplastic pollution of freshwater and wastewater treatment systems. Springer Sci. Rev. 2017, 5, 19–30. [Google Scholar] [CrossRef] [Green Version]
  20. Watkins, L.; McGrattan, S.; Sullivan, P.; Walter, M.T. The effect of dams on river transport of microplastic pollution. Sci. Total Environ. 2019, 664, 834–840. [Google Scholar] [CrossRef]
  21. Mani, T.; Burkhardt-Holm, P. Seasonal microplastic variation in nival and pluvial stretches of the Rhine River—From the Swiss catchment towards the North Sea. Sci. Total Environ. 2020, 707, 135579. [Google Scholar] [CrossRef]
  22. Statistics of Sewerage. Korean Ministry of Environment. 2018. Available online: www.me.go.kr (accessed on 5 May 2020).
  23. Bordós, G.; Urbány, B.; Micsinai, A.; Kriszt, B.; Palotai, Z.; Szabó, I.; Hantosi, Z.; Szoboszlay, S. Identification of microplastics in fish ponds and natural freshwater environments of the Carpathian basin, Europe. Chemosphere 2019, 216, 110–116. [Google Scholar] [CrossRef] [PubMed]
  24. Yin, L.; Wen, X.; Du, C.; Jiang, J.; Wu, L.; Zhang, Y.; Hu, Z.; Hu, S.; Feng, Z.; Zhou, Z.; et al. Comparison of the abundance of microplastics between rural and urban areas: A case study from East Dongting Lake. Chemosphere. 2019, 244, 125486. [Google Scholar] [CrossRef] [PubMed]
  25. Claessens, M.; Van Cauwenberghe, L.; Vandegehuchte, M.B.; Jassen, C.R. New techniques for the detection of microplastics in sediments and field collected organisms. Mar. Pollut. Bull. 2013, 70, 227–233. [Google Scholar] [CrossRef] [PubMed]
  26. Park, T.J.; Lee, S.H.; Lee, M.S.; Lee, J.K.; Lee, S.H.; Zoh, K.D. Occurrence of microplastics in the Han River and riverine fish in Korea. Sci. Total Environ. 2020, 708, 134535. [Google Scholar] [CrossRef] [PubMed]
  27. Peters, C.A.; Bratton, S.P. Urbanization is a major influence on microplastic ingestion by sunfish in the Brazos River Basin, Central Texas, USA. Environ. Pollut. 2016, 210, 380–387. [Google Scholar] [CrossRef]
  28. Windsor, F.M.; Tilley, R.M.; Tyler, C.R.; Ormerod, S.J. Microplastic ingestion by riverine macroinvertebrates. Sci. Total Environ. 2019, 646, 68–74. [Google Scholar] [CrossRef]
  29. Lima, A.R.; Costa, M.F.; Barletta, M. Distribution patterns of microplastics within the plankton of a tropical estuary. Environ. Res. 2014, 132, 146–155. [Google Scholar] [CrossRef]
  30. Eo, S.; Hong, S.H.; Song, Y.K.; Han, G.M.; Shim, W.J. Spatiotemporal distribution and annual load of microplastics in the Nakdong River, Korea. Water Res. 2019, 160, 228–237. [Google Scholar] [CrossRef]
  31. Piñon-Colin, T.J.; Rodriguez-Jimenez, R.; Rogel-Hernandez, E.R.; Alvarez-Andrade, A.; Wakida, F.T. Microplastics in stormwater runoff in a semiarid region, Tijuana, Mexico. Sci. Total Environ. 2020, 704, 135411. [Google Scholar] [CrossRef]
  32. Akarsu, C.; Kumbur, H.; Gokdag, K.; Kideys, A.E.; Sanchez-Vidal, A. Microplastics composition and load from three wastewater treatment plants discharging into Mersin Bay, north eastern Mediterranean Sea. Mar. Pollut. Bull. 2020, 150, 110776. [Google Scholar] [CrossRef]
  33. Hurley, R.; Woodward, J.; Rothwell, J.J. Microplastic contamination of river beds significantly reduced by catchment-wide flooding. Nat. Geosci. 2018, 11, 251–257. [Google Scholar] [CrossRef]
  34. Lasee, S.; Mauricio, J.; Thompson, W.A.; Karnjanapiboonwong, A.; Kasumba, J.; Subbiah, S.; Morse, A.N.; Anderson, T.A. Microplastic in a freshwater environment receiving treated wastewater effluent. Integ. Environ. Assess. Manag. 2013, 13, 528–532. [Google Scholar] [CrossRef] [PubMed]
  35. Kang, H.J.; Park, H.J.; Kwon, O.K.; Lee, W.S.; Jeong, D.H.; Ju, B.K.; Kwon, J.H. Occurrence of microplastics in municipal sewage treatment plants: A review. Environ. Health Toxicol. 2018, 33, e2018013. [Google Scholar] [CrossRef] [PubMed] [Green Version]
  36. Edo, C.; González-Pleiter, M.; Leganés, F.; Fernández-Piñas, F.; Rosal, R. Fate of microplastics in wastewater treatment plants and their environmental dispersion with eluent and sludge. Environ. Pollut. 2020, 259, 113837. [Google Scholar] [CrossRef] [PubMed]
  37. Carr, S.A.; Liu, J.; Tesoro, A.G. Transport and fate of microplastic particles in wastewater treatment plants. Water Res. 2016, 91, 174–182. [Google Scholar] [CrossRef]
  38. Magnusson, K.; Noren, F. Screening of Microplastic Particles in and Downstream a Wastewater Treatment Plant; Report C55; Swedish Environmental Research Institute: Stockholm, Sweden, 2014. [Google Scholar]
  39. Baldwin, A.K.; Corsi, S.R.; Mason, S.A. Plastic debris in 29 Great Lakes tributaries: Relations to watershed attributes and hydrology. Environ. Sci. Technol. 2016, 50, 10377–10385. [Google Scholar] [CrossRef]
  40. Campbell, S.H.; Williamson, P.R.; Hall, B.D. Microplastics in the gastrointestinial tracts of fish and the water from an urban prairie creek. Facets 2017, 2, 359–409. [Google Scholar] [CrossRef] [Green Version]
  41. Horton, A.A.; Jurgens, M.D.; Lahive, E.; van Bodegom, P.M.; Vijver, M.G. The influence of exposure and physiology on microplastic ingestion by the freshwater fish Rutilus (roach) in the River Thames, UK. Environ. Pollut. 2018, 236, 188–194. [Google Scholar] [CrossRef]
  42. Silva-Cavalcanti, J.S.; Silva, J.D.B.; de Franca, E.J.; de Araujo, M.C.B.; Gusmao, F. Microplastics ingestion by a common tropical freshwater fishing resource. Environ. Pollut. 2017, 221, 218–226. [Google Scholar] [CrossRef]
  43. Slootmaekers, B.; Carteny, C.C.; Belpaire, C.; Saverwyns, S.; Fremout, W.; Blust, R.; Bervoets, L. Microplastic contamination in gudgeons (Gobio gobio) from Flemish rivers (Belgium). Environ. Pollut. 2019, 244, 675–684. [Google Scholar] [CrossRef]
  44. Yuan, W.; Liu, X.; Wang, W.; Di, M.; Wang, J. Microplastic abundance, distribution and composition in water, sediments, and wild fish from Poyang Lake, China. Ecotox. Environ. Safety 2019, 170, 180–187. [Google Scholar] [CrossRef] [PubMed]
  45. Phillips, M.B.; Bonner, T.H. Occurrence and amount of microplastic ingested by fishes in watersheds of the Gulf of Mexico. Mar. Pollut. Bull. 2015, 100, 264–269. [Google Scholar] [CrossRef] [PubMed]
  46. Pazos, R.S.; Maiztegui, T.; Colautti, D.C.; Paracampo, A.H.; Gómez, N. Microplastics in gut contents of coastal freshwater fish from Río de la Plata estuary. Mar. Pollut. Bull. 2017, 122, 85–90. [Google Scholar] [CrossRef] [PubMed]
  47. Hamid, F.S.; Bhatti, M.S.; Anuar, N.; Mohan, P.; Periathamby, A. Worldwide distribution and abundance of microplastic: How dire is the situation. Waste Manag. Res. 2018, 36, 873–897. [Google Scholar] [CrossRef] [PubMed]
  48. Li, R.; Zhang, L.; Xue, B.; Wang, Y. Abundance and characteristics of microplastics in the mangrove sediment of the semi-enclosed Maowei Sea of the south China sea: New implications for location, rhizosphere, and sediment compositions. Environ. Pollut. 2019, 244, 685–692. [Google Scholar] [CrossRef]
  49. Pegado, T.S.S.; Shmid, K.; Winemiller, K.O.; Chelazzi, D.; Cincinelli, A.; Dei, L.; Giarrizzo, T. First evidence of microplastic ingestion by fishes from the Amazon River estuary. Mar. Pollut. Bull. 2018, 133, 814–821. [Google Scholar] [CrossRef]
  50. De Vries, A.N.; Govoni, D.; Árnason, S.H.; Carlsson, P. Microplastic ingestion by fish: Body size, condition factor and gut fullness are not related to the amount of plastics consumed. Mar. Pollut. Bull. 2020, 151, 110827. [Google Scholar] [CrossRef]
  51. Lin, L.; Zuo, L.Z.; Peng, J.P.; Cai, L.Q.; Fok, L.; Yan, Y.; Li, H.X.; Xu, X.R. Occurrence and distribution of microplastics in an urgan river: A case study in the Pearl River along Guangzhou city, China. Sci. Total Environ. 2018, 644, 375–381. [Google Scholar] [CrossRef]
  52. Wang, J.D.; Peng, J.P.; Tan, Z.; Gao, Y.F.; Zhan, Z.W.; Chen, Q.Q.; Cai, L.Q. Microplastics in the surface sediments from the Beijiang River littoral zone: Composition, abundance, surface textures and interaction with heavy metals. Chemosphere 2017, 171, 246–258. [Google Scholar] [CrossRef]
  53. He, B.; Goonetilleke, A.; Ayoko, G.A.; Rintoul, L. Abundance, distribution patterns and identification of microplastics in Brisbane River sediments, Australia. Sci. Total Environ. 2020, 700, 134467. [Google Scholar] [CrossRef]
  54. Nel, H.A.; Dalu, T.; Wasserman, R.J. Sinks and sources: Assessing microplastic abundance in river sediment and deposit feeders in an austral temperate urban river system. Sci. Total Environ. 2018, 612, 950–956. [Google Scholar] [CrossRef] [PubMed]
  55. Lusher, A.L.; McHugh, M.; Thmopson, R.C. Occurrence of microplastics in the gastrointestinal tract of pelgaic and demersal fish from the English Channel. Mar. Pollut. Bull. 2013, 67, 94–99. [Google Scholar] [CrossRef] [PubMed]
  56. Tanaka, K.; Takada, H. Microplastic fragments and microbeads in digestive tracts of planktivorous fish from urban coastal waters. Sci. Rep. 2016, 6, 34351. [Google Scholar] [CrossRef] [PubMed]
  57. Murphy, F.; Russel, M.; Ewins, C.; Quinn, B. The uptake of macroplastic & microplastic by demersal and pelagic fish in the Northeast Atlantic around Scotland. Mar. Pollut. Bull. 2017, 122, 353–359. [Google Scholar] [PubMed] [Green Version]
  58. Di, M.; Wang, J. Microplastics in surface waters and sediments of the Three Gorges Reservoir, China. Sci. Total Environ. 2018, 616–617, 1620–1627. [Google Scholar] [CrossRef]
  59. Sun, X.; Li, Q.; Shi, Y.; Zhao, Y.; Zheng, S. Characteristics and retention of microplastics in the digestive extracts of fish from the Yellow Sea. Environ. Pollut. 2019, 249, 878–885. [Google Scholar] [CrossRef]
  60. Browne, M.A.; Galloway, T.S.; Thompson, R.C. Spatial patterns of plastic debris along estuarine shorelines. Environ. Sci. Technol. 2010, 44, 3404–3409. [Google Scholar] [CrossRef]
  61. Zhang, K.; Gong, W.; Lu, J.; Xiong, X.; Wu, C. Accumulation of floating microplastics behind the three gorges dam. Environ. Pollut. 2015, 204, 117–123. [Google Scholar] [CrossRef]
  62. Cole, M.; Lindeque, P.; Halsband, C.; Galloway, T.S. Microplastics as contaminants in the marine environment: A review. Mar. Pollut. Bull. 2011, 62, 2588–2597. [Google Scholar] [CrossRef]
  63. Rodrigues, M.O.; Abrantes, N.; Goncalves, F.J.M.; Nogueira, H.; Marques, J.C.; Goncalves, A.M.M. Spatial and temporal distribution of microplastics in water and sediments of a freshwater system (Antuã River, Portugal). Sci. Total Environ. 2018, 633, 1549–1559. [Google Scholar] [CrossRef]
  64. Cho, Y.; Shim, W.J.; Jang, M.; Han, G.M.; Hong, S.H. Abundance and characteristics of microplastics in market bivalves from Korea. Environ. Pollut. 2019, 245, 1107–1116. [Google Scholar] [CrossRef] [PubMed]
  65. Ganier, Y.; Jacob, H.; Guerra, A.S.; Bertucci, F.; Lecchini, D. Evaluation of microplastic ingestion by tropical fish from Moorea island, French Polynesia. Mar. Pollut. Bull. 2019, 140, 165–170. [Google Scholar] [CrossRef] [PubMed]
  66. Bayo, J.; Olmos, S.; López-Castellanos, J. Microplastics in an urban wastewater treatment plant: The influence of physicochemical parameters and environmental factors. Chemosphere 2020, 238, 124593. [Google Scholar] [CrossRef] [PubMed]
  67. Tibbetts, J.; Krause, S.; Lynch, I.; Smith, G.H.S. Abundance, distribution, and drivers of microplastic contamination in urban river environment. Water 2018, 10, 1597. [Google Scholar] [CrossRef] [Green Version]
  68. Cannas, S.; Fastelli, P.; Guerranti, C.; Renzi, M. Plastic litter in sediments from the coasts of south Tuscany (Tyrhenian Sea). Mar. Pollut. Bull. 2017, 119, 372–375. [Google Scholar] [CrossRef]
  69. Catarino, A.I.; Thompson, R.; Sanderson, W.; Henry, T.B. Development and optimization of a standard method for extraction of microplastics in mussels by enzyme digestion of soft tissues. Environ. Toxicol. Chem. 2017, 36, 947–951. [Google Scholar] [CrossRef]
  70. Lots, F.A.E.; Behrens, P.; Vijver, M.G.; Horton, A.A.; Bosker, T. A large-scale investigation of microplastic contamination: Abundance and characteristics of microplastics in European beach sediment. Mar. Pollut. Bull. 2017, 123, 219–226. [Google Scholar] [CrossRef]
  71. Zhang, L.; Liu, J.; Xie, Y.; Zhong, S.; Yang, B.; Lu, D.; Zong, Q. Distribution of microplastics in surface water and sediments of Qin river in Beibu Gulf, China. Sci. Total Environ. 2020, 708, 135176. [Google Scholar] [CrossRef]
  72. Plastics-The Facts. An Analysis of European Plastics Productions, Demand and Waste Data; Plastics-The Facts: Brussels, Belgium, 2019; pp. 1–42. [Google Scholar]
  73. Ballent, A.; Corcoran, P.L.; Madden, O.; Helm, P.A.; Longstaffe, J.J. Sources and sinks of microplastics in Canadian Lake Ontario nearshore, tributary and beach sediments. Mar. Pollut. Bull. 2016, 110, 383–395. [Google Scholar] [CrossRef] [Green Version]
  74. Zhang, K.; Xiong, X.; Hu, H.; Wu, C.; Bi, Y.; Wu, Y.; Zhou, B.; Lam, P.K.S.; Liu, J. Occurrence and characteristics of microplastic pollution in Xiangxi Bay of three gorges reservoir, China. Environ. Sci. Technol. 2017, 51, 3794–3801. [Google Scholar] [CrossRef]
  75. Andray, A.L. Microplastics in the marine environment. Mar. Pollut. Bull. 2011, 62, 1596–1605. [Google Scholar] [CrossRef] [PubMed]
  76. McCormick, A.; Hoellein, T.J.; Mason, S.A.; Schluep, J.; Kelly, J.J. Microplastic is an abundant and distinct microbial habitat in an urban river. Environ. Sci. Technol. 2014, 48, 11863–11871. [Google Scholar] [CrossRef] [PubMed]
  77. SAPEA. A Scientific Perspective on Microplastics in Nature and Society; SAPEA (Science Advice for Policy by European Adcademies): Brussels, Belgium, 2019; pp. 1–176. [Google Scholar]
  78. Tien, C.J.; Wnag, Z.X.; Chen, C.S. Microplastics in water, sediment and fish from the Fengshan River system: Relationship to aquatic factors and accumulation of polycyclic aromatic hydrocarbons by fish. Environ. Pollut. 2020, 265, 114962. [Google Scholar] [CrossRef] [PubMed]
  79. Browne, M.A.; Crump, P.; Niven, S.J.; Leuten, E.L.; Tonkin, A.; Gallow, T.; Thompson, R.C. Accumulation of microplastic on shorelines worldwide: Sources and sinks. Environ. Sci. Technol. 2011, 45, 9175–9179. [Google Scholar] [CrossRef]
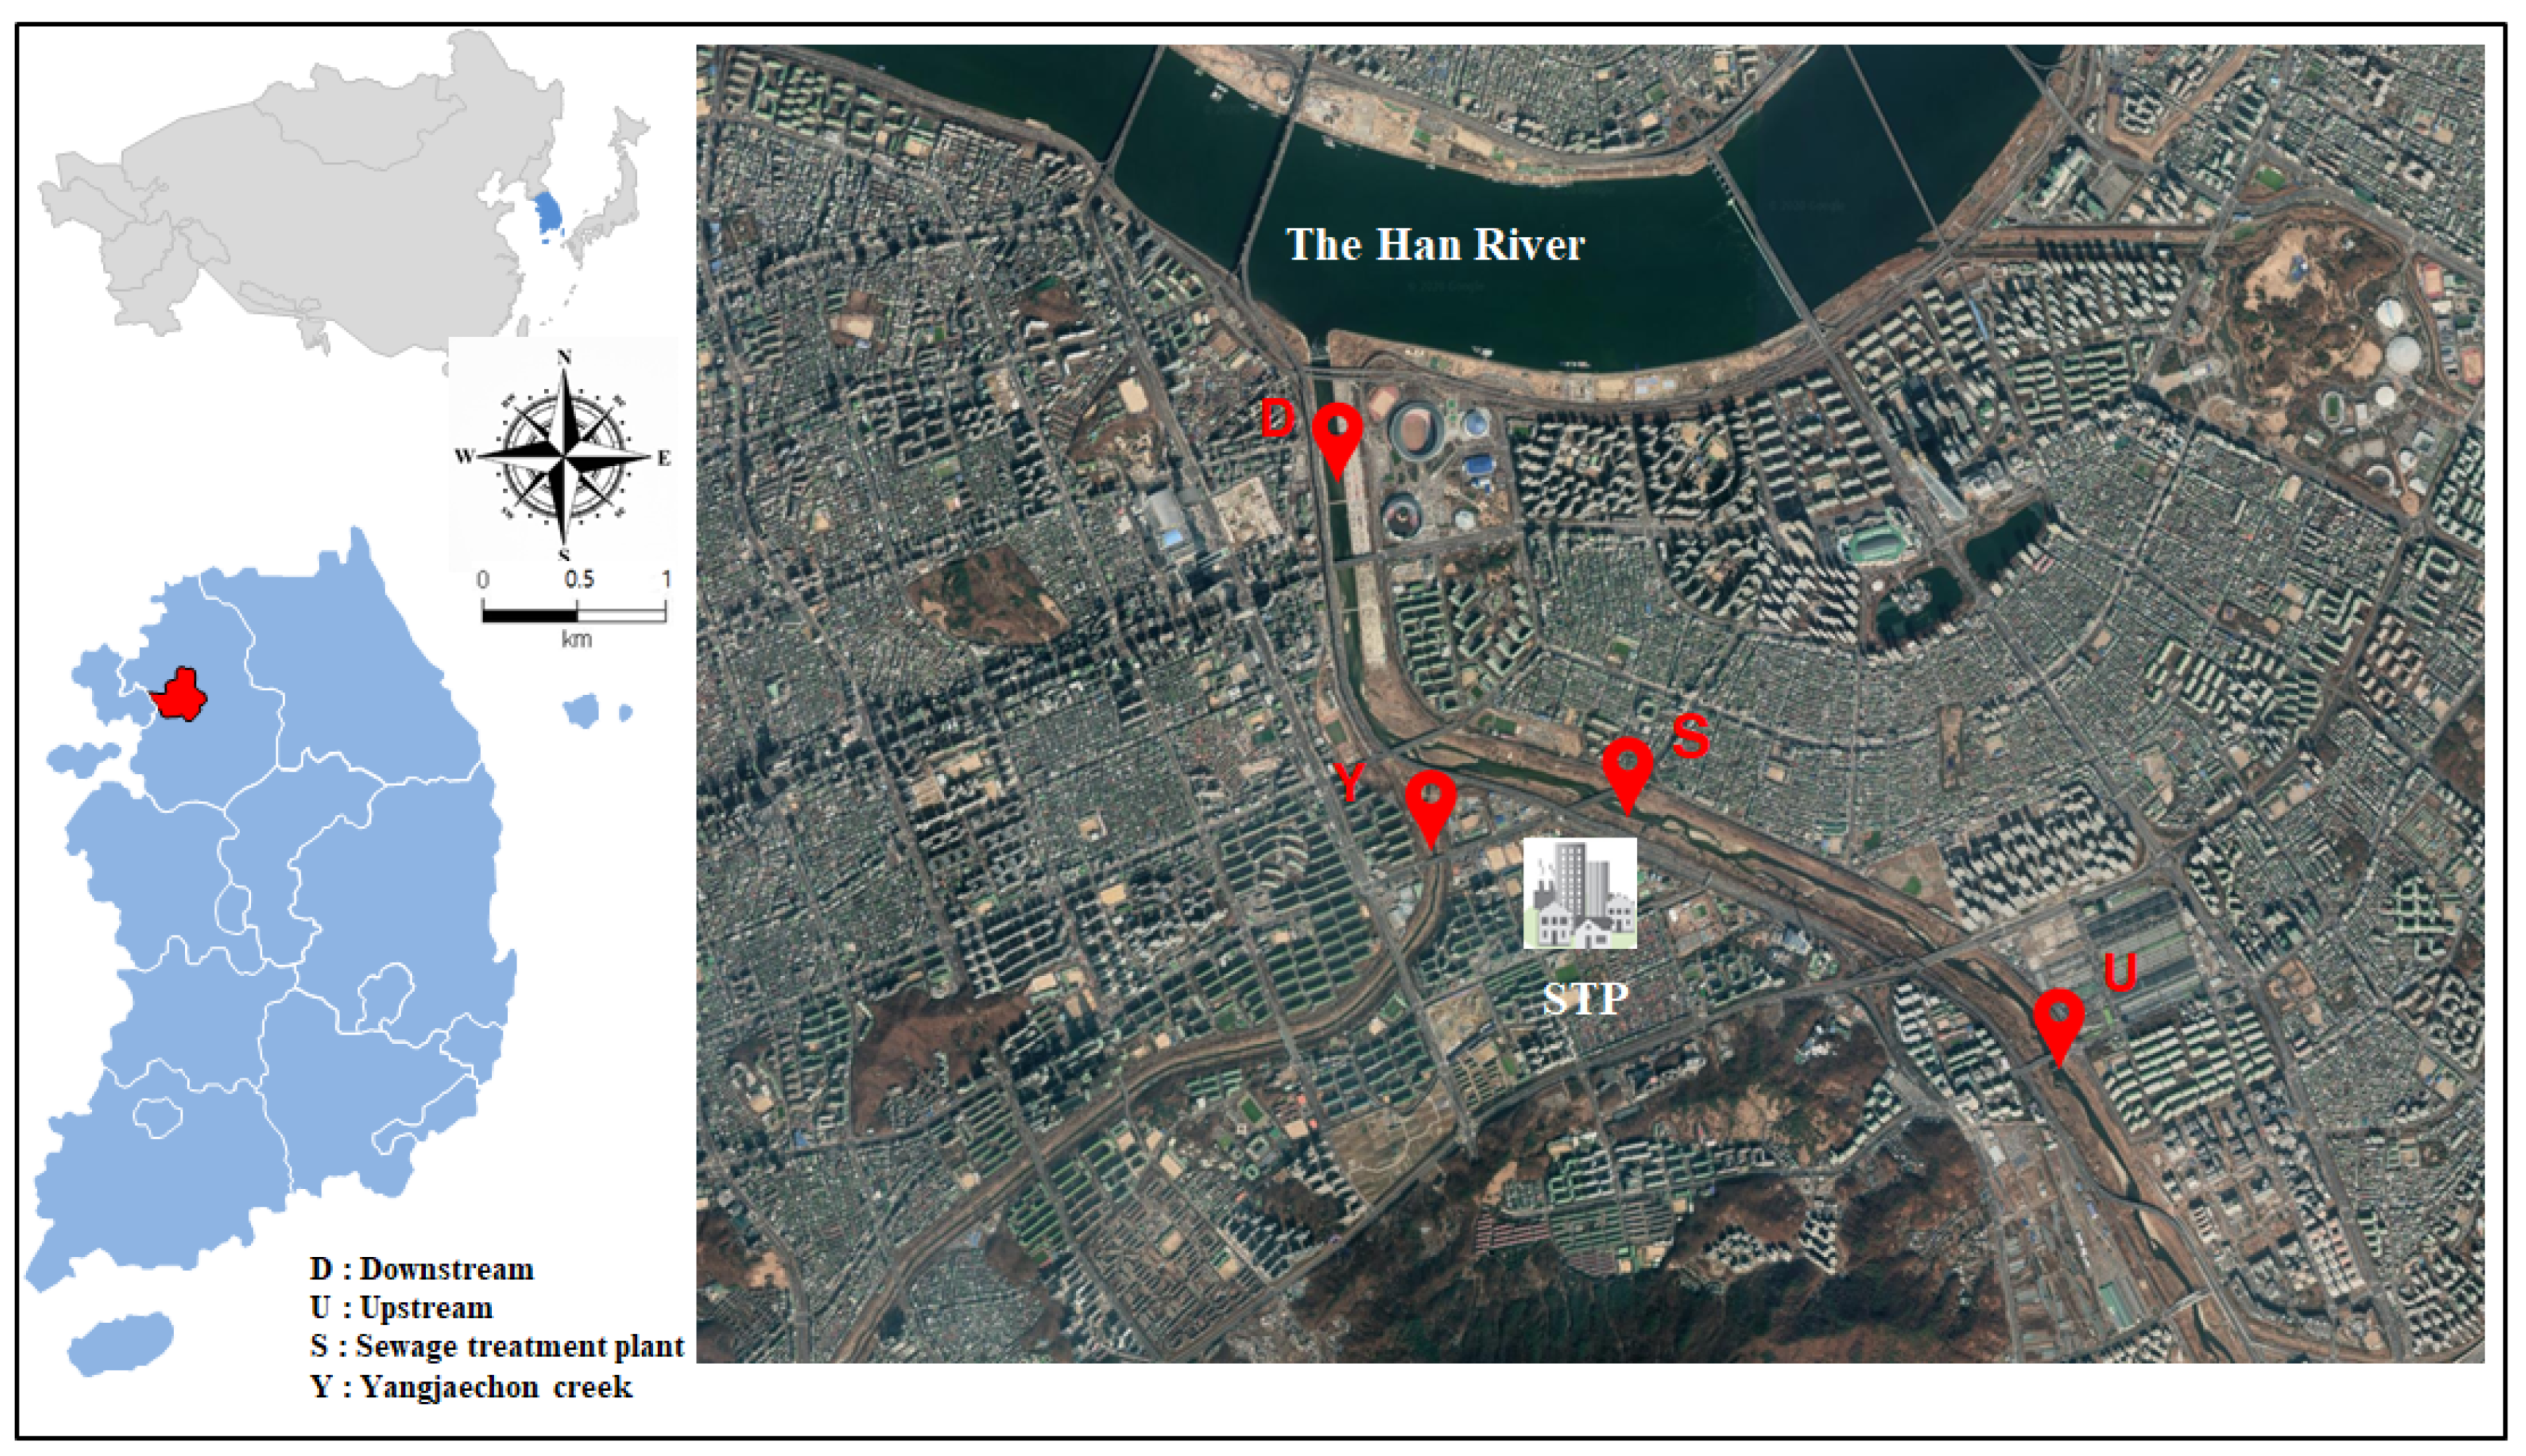
Figure 1. Location of sampling sites (upstream and downstream of Tanchon stream flowing to the Han River, Yangjaechon Creek and near the sewage treatment plant effluent). The satellite map was obtained from google map (www.google.co.kr/maps).
Water 12 03333 g001
Figure 2. The concentration of microplastics in (a) surface water, (b) fish, and (c) sediment in Tanchon stream, Korea.
Water 12 03333 g002
Figure 3. Daily load of microplastics (the concentration of microplastics times the flow rate) from upstream, sewage treatment plant effluent, Yangjaechon creek, and downstream in Tanchon stream.
Water 12 03333 g003
Figure 4. Correlation between microplastic concentration and (a) length and (b) body weight of fish samples (n = 14).
Water 12 03333 g004
Figure 5. (a) Size distribution, (b) polymer type, and (c) shape distribution of microplastics in water, fish, and sediment of Tanchon stream, Korea.
Water 12 03333 g005
Table 1. Feeding habit, length, weight, and number of fishes used in this study and concentration of microplastics in the fishes.
NameScientific NameFeeding HabitLength (mm)Weight (g)NoConcentration (Particles/Fish)
CarpCyrinus carpioOmnivore566 ± 59292.8 ± 767.7332.0 ± 12.8
Crucian carp carpcarpCarassius auratusOmnivore3691024.3114
Goby minnowPseudogobio esocinusInsectivore14124.513
BassMicropterus salmoidesCarnivore11216.012
MinnowZacco platypusOmnivore84 ± 66.4 ± 2.082.9 ± 2.2
Publisher’s Note: MDPI stays neutral with regard to jurisdictional claims in published maps and institutional affiliations.