Article

Oxidation of Selected Trace Organic Compounds through the Combination of Inline Electro-Chlorination with UV Radiation (UV/ECl2) as Alternative AOP for Decentralized Drinking Water Treatment

1
AUTARCON GmbH, D-34117 Kassel, Germany
2
GNF e.V. Volmerstr. 7 B, 12489 Berlin, Germany
3
International Centre for Ecological Engineering, University of Kalyani, Kalyani, West Bengal 741235, India
4
Division of Water Sciences, University of Applied Sciences Dresden, Friedrich-List-Platz 1, 01069 Dresden, Germany
*
Author to whom correspondence should be addressed.
Water 2020, 12(11), 3275; https://doi.org/10.3390/w12113275
Submission received: 6 October 2020 / Revised: 14 November 2020 / Accepted: 17 November 2020 / Published: 21 November 2020
(This article belongs to the Special Issue Advanced Oxidation Processes for Water and Wastewater Treatment)

Abstract

:
A large variety of Advanced Oxidation Processes (AOPs) to degrade trace organic compounds during water treatment have been studied on a lab scale in the past. This paper presents the combination of inline electrolytic chlorine generation (ECl2) with low pressure UV reactors (UV/ECl2) in order to allow the operation of a chlorine-based AOP without the need for any chlorine dosing. Lab studies showed that from a Free Available Chlorine (FAC) concentration range between 1 and 18 mg/L produced by ECl2 up to 84% can be photolyzed to form, among others, hydroxyl radicals (· OH) with an UV energy input of 0.48 kWh/m3. This ratio could be increased to 97% by doubling the UV energy input to 0.96 kWh/m3 and was constant throughout the tested FAC range. Also the achieved radical yield of 64% did not change along the given FAC concentration range and no dependence between pH 6 and pH 8 could be found, largely simplifying the operation of a pilot scale system in drinking water treatment. Whereas with ECl2 alone only 5% of benzotriazoles could be degraded, the combination with UV improved the degradation to 89%. Similar results were achieved for 4-methylbenzotriazole, 5-methylbenzotriazole and iomeprol. Oxipurinol and gabapentin were readily degraded by ECl2 alone. The trihalomethanes values were maintained below the Germany drinking water standard of 50 µg/L, provided residual chlorine concentrations are kept within the permissible limits. The here presented treatment approach is promising for decentralized treatment application but requires further optimization in order to reduce its energy requirements.

1. Introduction

Annually on average 15 g of pharmaceuticals are consumed per capita, but human bodies are unable to fully metabolize pharmaceuticals, which are then excreted as parental components or metabolites [1,2]. They are discharged into wastewater together with Personal Care Products (PCPs), sweeteners, illicit and non-controlled drugs, complexing agents, nanoparticles, perfluorinated compounds, pesticides, flame retardants, fuel additives and endocrine disrupting chemicals and detergents [3,4]. Conventional wastewater treatment such as activated sludge processes, exhibits limitations in the removal of Trace Organic Compounds (TOrCs) [5,6]. TOrCs are additionally released into the environment from irrigation with treated or untreated wastewater [7], disposal of animal waste on agricultural sites [8] and artificial groundwater recharge [9]. World-wide studies have confirmed the occurrence of pharmaceutical residues in the effluents of wastewater treatment plants (WWTPs) as well as in surface and groundwaters [10,11,12,13,14].
The problem of water contamination with TOrCs is even more prevalent in some developing areas. E.g., in India, the amount of ciprofloxacin, sulfamethoxazole, amoxicillin, norfloxacin, and ofloxacin in treated wastewater was up to 40 times higher compared to other countries in Europe, Australia, Asia, and North America [5,8]. Here even remote rural areas are affected.
Conventional drinking water treatment processes such as coagulation and flocculation are not designed to effectively remove TOrCs [8]. Powdered activated carbon (PAC), membrane filtration technologies [15,16,17] or advanced oxidation processes (AOP) have been studied in the past to evaluate their efficiency on the removal of selected TOrCs [18]. Most studied AOPs are based on ozonation, Fenton oxidation, or UV based AOPs such as UV/H2O2. For the application of AOPs in water treatment, the supply of chemicals such H2O2 in UV/H2O2 AOP has been identified as major challenge and cost factor [19].
A relatively new AOP is the combination of chlorination with UV radiation (UV/Cl2) [20,21,22,23,24]. When aqueous chlorine solutions are exposed to UV, ·OH and ·Cl radicals are also formed (Figure 1). The reduction potential of ·OH radicals is with 2.8 V vs. Standard Hydrogen Electrode (SHE) substantially higher compared to the potential of ozone (2.07 V) or chlorine (1.37 V) [25]. UV/Cl2 has proven to produce higher amounts of (·OH) radicals compared to UV/H2O2 mainly due to the low absorbance of UV light by H2O2 [20,26]. Whereas absorption coefficients (e) for UV/H2O2 of 19.6 M−1·cm−1 have been identified for 254 nm [27] they have reached 59 M−1·cm−1 and 66 M−1·cm−1 for HOCl and OCl [28]. Higher quantum yields with regards to radical generation for UV/Cl2 where reported by [26]. When radiated with UV light hypochlorous acid and its anion hypochlorite react in water not only to OH, but also to the reactive chlorine species (RCS) ·Cl and Cl2 as well as to oxygen radicals. At higher pH, hydroxyl radicals might be consumed by chlorine itself also forming RCS [29].
The RCS coexist with ·OH radicals and complement each other in degrading a wider variety of contaminants compared to e.g., UV/H2O2 AOP [29,30]. Depending on the chlorine species present two reaction pathways (Equations (1)–(3)) for the production of ·OH and ·Cl exist [26].
HOCl + h ν     · OH +   · Cl ,
OCl + h ν     · O +   · Cl ,
· O +   H 2 O     · OH + OH
However, the need to supply and dose chlorine reagents also persists for UV/Cl2-based AOPs. Here the production of chlorine through inline electrolysis (ECl2) could offer an alternative to transportation, storage and handling of chlorine reagents. During ECl2 elementary chlorine is produced at the anode of an electrolytic cell from the natural chloride content of the water itself (Equation (4)). The chlorine immediately hydrolyses to form hypochlorous acid (Equation (5)) or hypochlorite (Equation (6)). Anodic side reactions and cathodic reactions are given in Equations (7) and (8):
Anodic reaction chlorine:
2 Cl     Cl 2 +   2 e ,
Hydrolysis of chlorine gas:
Cl 2 +   2 H 2 O     HClO + Cl +   H 3 O + ,
Equilibrium at pH = 7.5:
HClO     OCl +   H + ,
Anodic side reaction oxygen:
2 H 2 O     O 2 +   4 H + +   4 e ,
Cathodic reaction:
2 H 3 O + +   2 e     H 2 +   2 H 2 O
In past studies this approach has already proven feasible to meet the disinfection requirements for remote drinking water supply [31,32,33]. In the presented study ECl2 was combined with UV radiation (Figure 1).
The novelty of this approach is the operation of a chlorine based AOP for the degradation of TOrCs that is completely independent from any external chemical supply. On a small scale, ECl2 as well as UV could be easily operated by photovoltaic (PV) which makes the process also independent of any external energy supply.
Available, studies to evaluate the degradation potential of AOPs using chlorine have been generally carried out for single compounds investigating concentrations much higher than those found in real waters. Further, deionized water free of other organic substances was used as solvent and sophisticated equipment was applied for e.g., determining reaction constants (k’). Therefore, uncertainties exist with regards to real case scenarios [24].
In this study a UV/ECl2 setting was tested under lab conditions in order to evaluate chlorine production and radical formation in dependence of chloride concentrations, pH, cell currents and UV energy input applied. Following the lab test a UV/ECl2 pilot setting was tested for the first time under real case conditions treating Elbe river water. In two short term sampling campaigns the removal efficiency of selected TOrCs, the energy consumption and the formation of disinfection by products (DBPs) by analyzing trihalomethanes (THM) was evaluated. The pilot system was operated long term to observe technical challenges that may occur under real case scenarios. The hypothesis of the here conducted work is, that the combination of ECl2 with UV poses a technically feasible alternative to reduce TOrCs without the need for any external chemicals and electricity supply, which can be applied in decentralized water treatment. The conducted trials hereby allow a first insight into the application of UV/ECl2 as part of an actual drinking water treatment system.

2. Methodology

To produce chlorine by means of ECl2 mixed oxide electrodes (MOX) (GNF, Berlin, Germany) coated with ruthenium (Ru) and iridium (Ir) oxides. Ru- and Ir-mixed oxide electrodes have been selected due to their low overpotential for the oxidation reaction of chloride to chlorine and therefore offer a higher current efficiency for chlorine evolution compared to e.g., platinum coated electrodes [34].

2.1. Lab Test Setting

In order to assure sufficient chlorine generated by inline electrolysis as precursors for the chlorine photolysis and disinfection, lab experiments were conducted. Those included the variation of chloride ion concentration, flow rate, current density, pH and electrical conductivity.
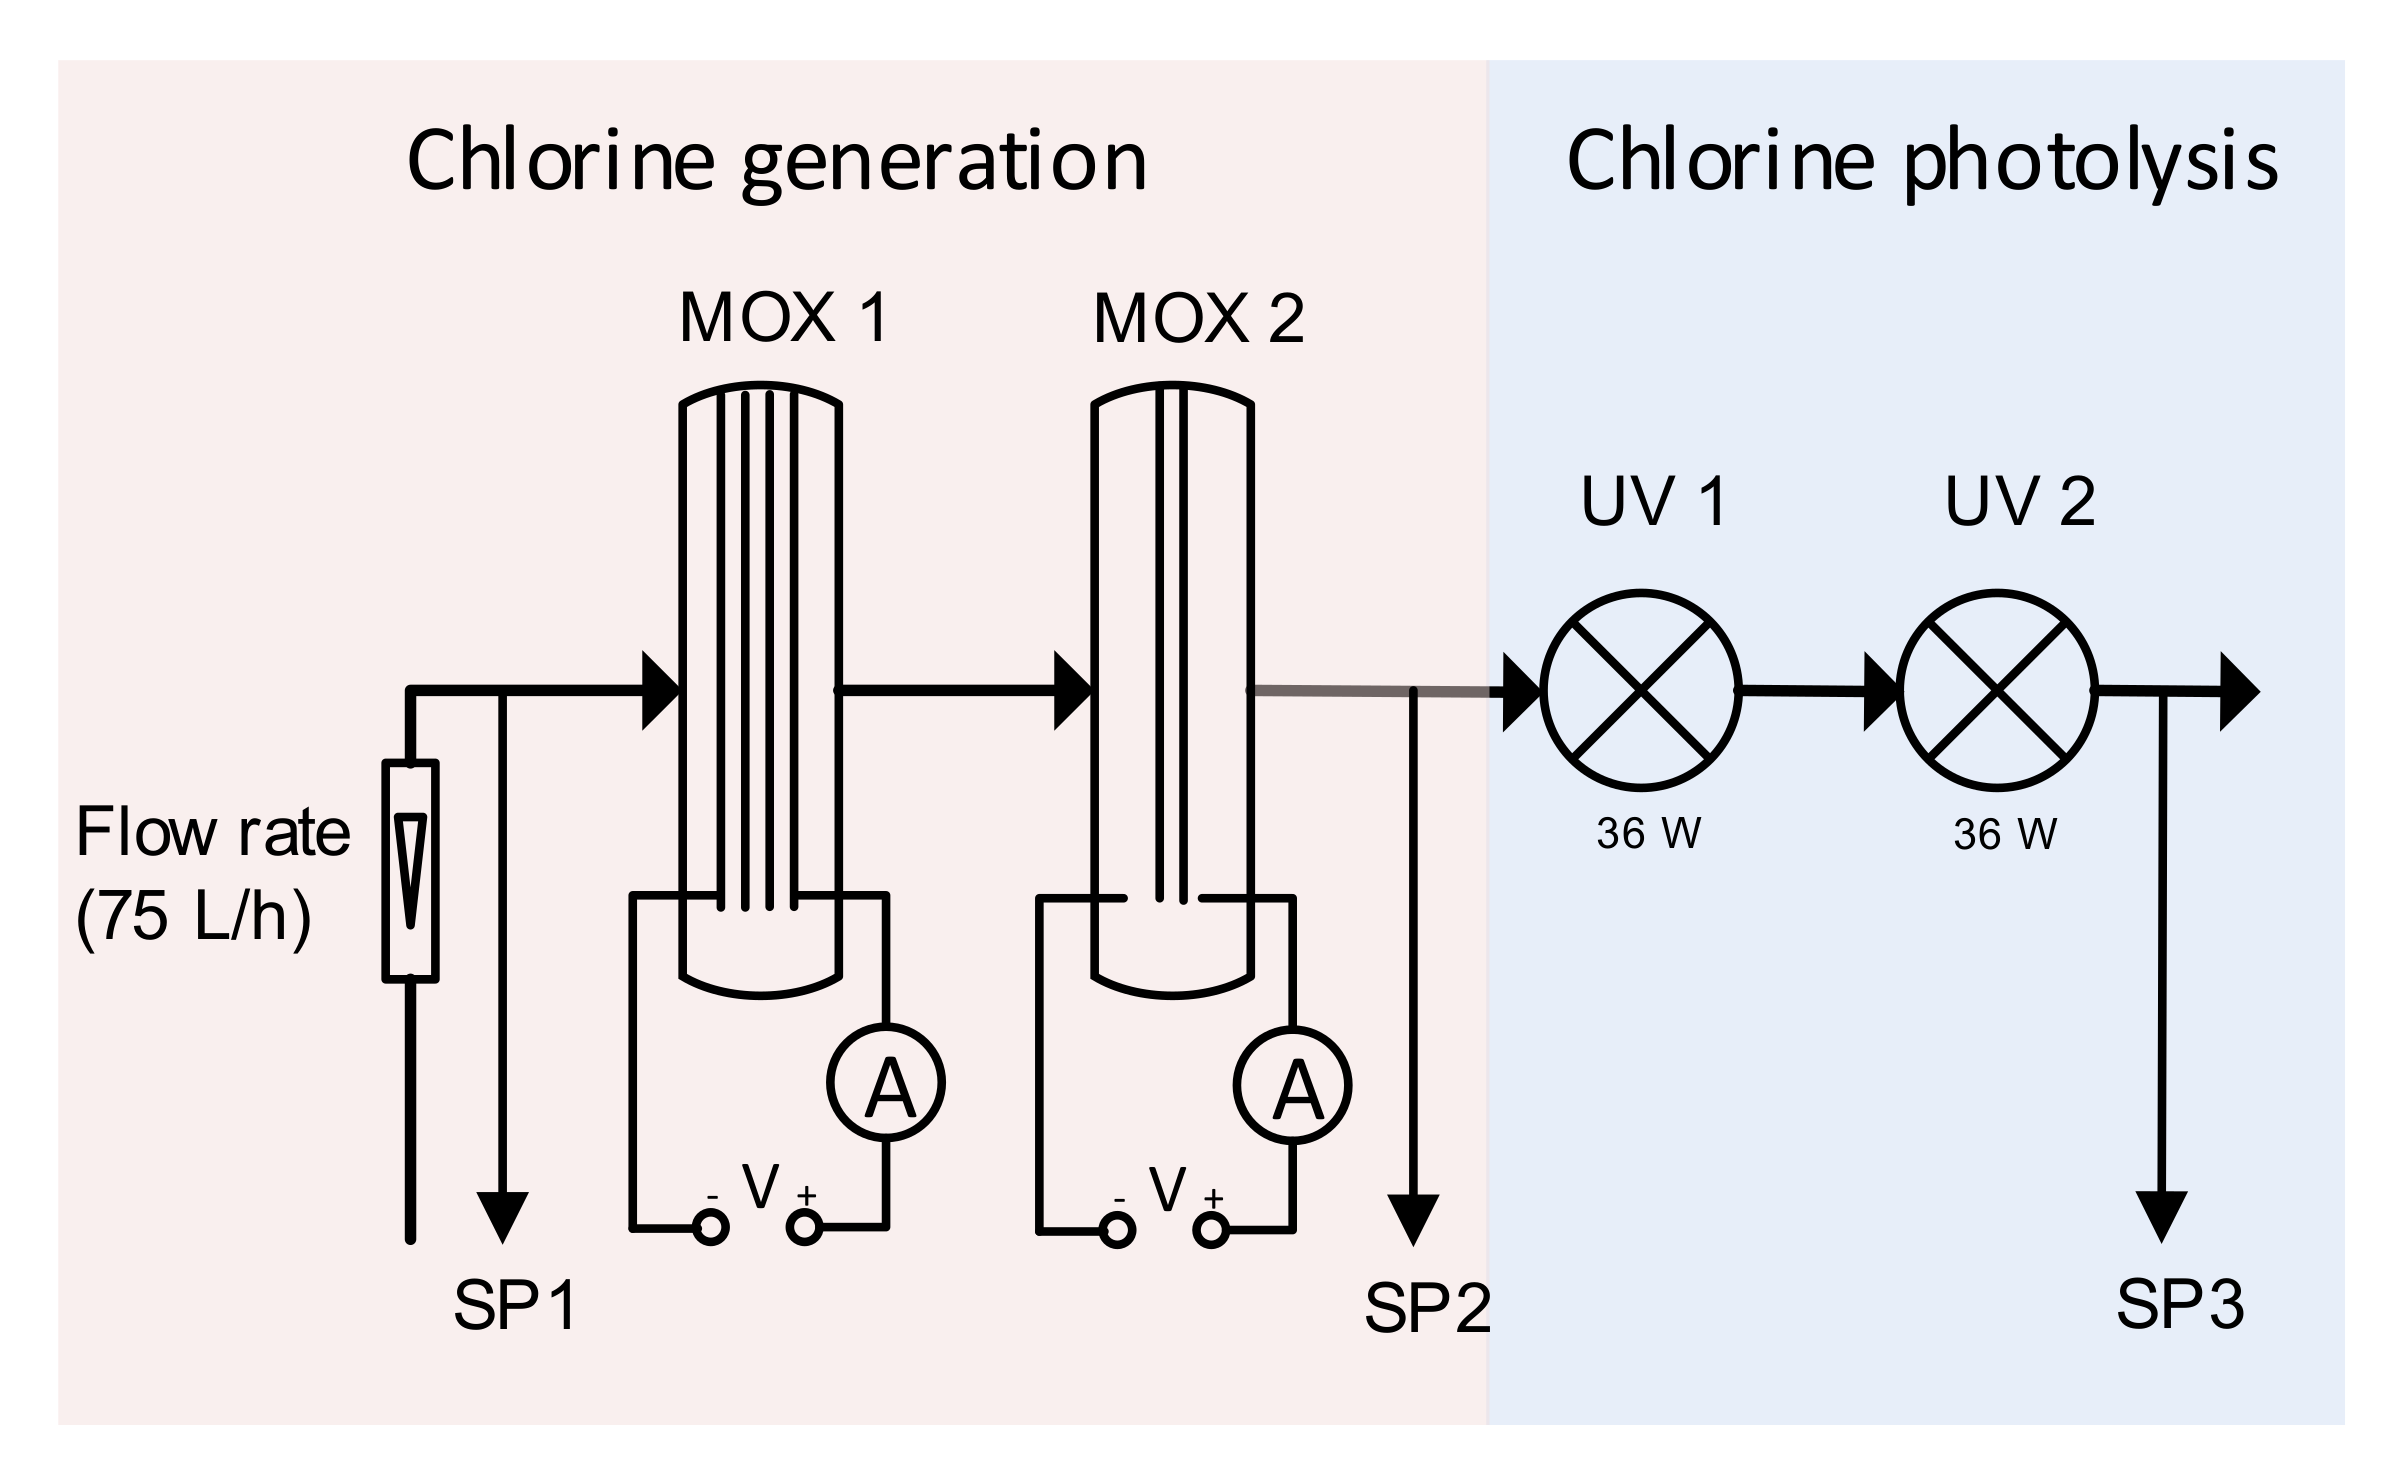
During lab tests water was pumped through an array of two MOX electrodes and up to two UV lamps (Figure 2). The distance between the cell plates was 5 mm. Currents of up to 8 A were applied on the electrodes. With a total surface area of 959 cm2, the current density accounted for 16.7 mA/cm2. These currents were chosen because previous (unpublished) studies showed that this is the maximum applicable current density for long term chlorine evolution without damaging the coating. The MOXs were powered using a BaseTech BT-305 power supply unit (Hirschau, Germany).
Distilled water was pH adjusted with 10% HCl (Carl Roth, Karlsruhe, Germany) and 10% NaOH (Carl Roth). NaCl (Carl Roth) was added to the water to achieve concentrations of 25, 50 and 100 mg/L. The electric conductivity was adjusted to the desired value using NaHCO3 (Carl Roth, Germany) and Na2SO4 (Carl Roth). Samples for chlorine measurement were taken directly behind the MOXs at Sampling Point (SP) 2 and SP 3 (Figure 2). The chlorine was then photolyzed by up to two PURION® 2500 36 W low pressure UV-C reactors with a volume of 0.75 L which were equipped with a calibrated silicon semiconductor-based UV-irradiance sensor (SUV-13A1Y2C, Purion, Zella-Mehlis, Germany) on each UV unit to assure constant irradiation of the UV lamps. The radical yield was determined at SP3.
The input of the electrical energy for the UV photolysis was 0.48 kWh/m3 for one and 0.96 kWh/m3 for two lamps, respectively. Samples to evaluate radical formation were taken prior (SP2) and after the UV reactor(s) (SP3).
The amount of HOCl and OCl decomposed (Equations (1) and (2)) during FAC photodegradation is directly related to the amount of ·OH radicals [35] and the radical yield factor η can thus be quantified following Equation (9):
η =   Δ   n · OH   +   Δ   n · Cl Δ   n FAC    
The quantification of radical formation was carried out following [36] as described below. The yield factors were calculated for pH values of 6, 7 and 8 in order to determine its dependence of chlorine species present (Equation (6)).

2.2. Field Test Settings

The field test was carried out for 10 months and was conducted with Elbe river water, which was filtrated by a UF system (150 kDa, 0.01 µm, Pall, Port Washington, NY, USA) before the UV/ECl2 AOP in order to provide turbidity free water.
As natural water matrices contain a variety of radical scavengers the here tested setting will generate only site-specific results. Better pre-treatment hereby is expected to generate higher degradation as shown in [37].
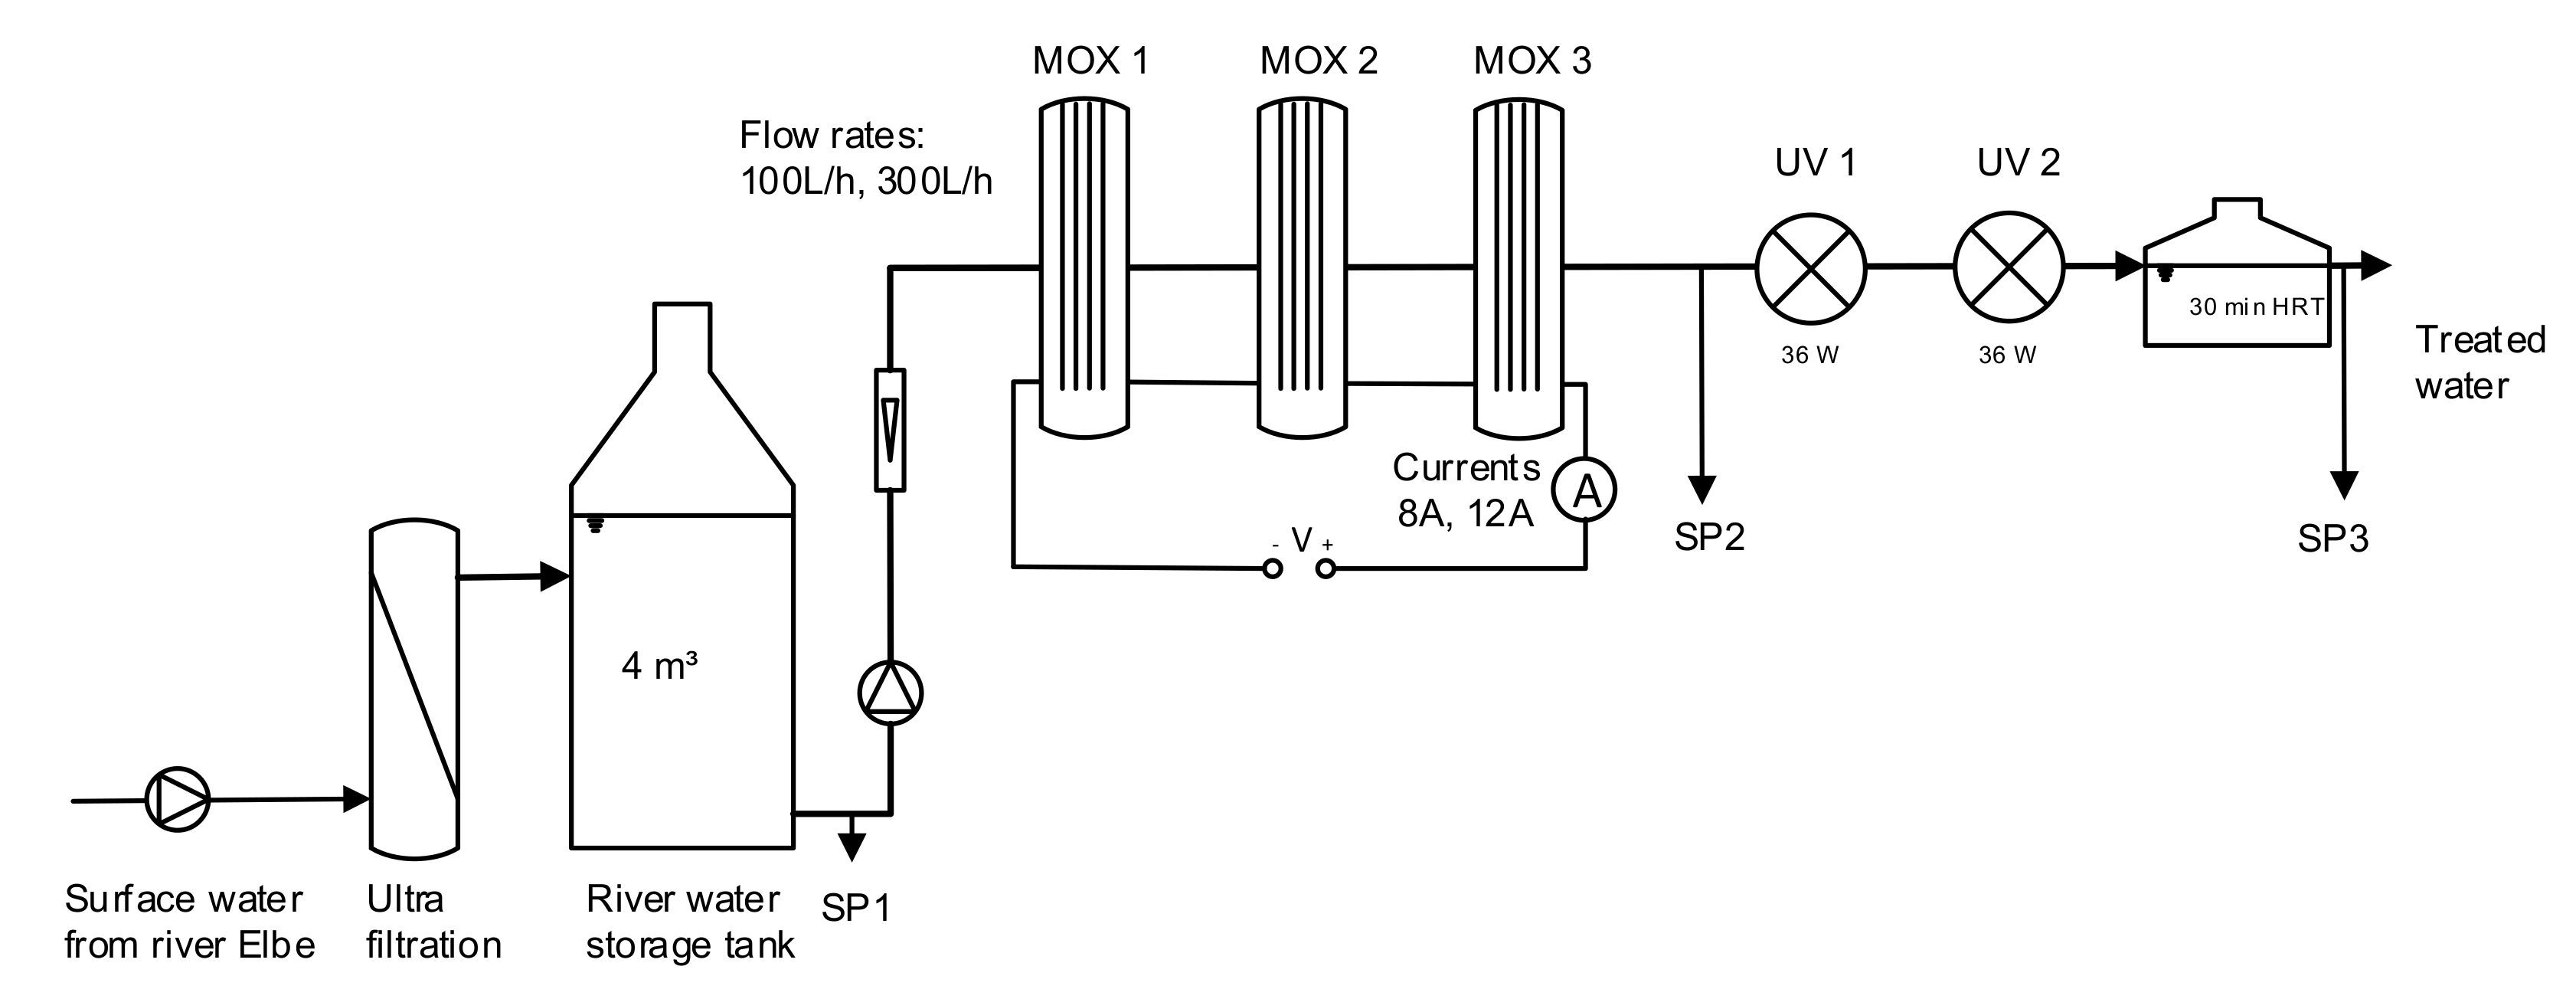
The water was pumped by the pilot system in a flow through setting through three MOX with a total area of 1918 cm2 operated in series followed by up to two Purion® 2500 36 W low pressure UV-C lamps (Figure 3).
To release potentially formed calcareous deposits the polarity was inverted once every three hours. In own past studies, these comparable large intervals have proven to have a negligible effect on the lifetime of the electrolytic cells.
For the evaluation of TOrC degradation during drinking water treatment two short term sampling campaigns were conducted.
In order to evaluate the influence of the chlorine concentration and the UV irradiation on the degradation of TOrCs the ECl2 current and resulting current densities, the number of UV lamps and the flow rate were varied during the field test. This tested pilot settings are documented in Table 1 including the specific energy demand for each of the tested settings.
A current of 8 A was hereby selected to meet a minimum total chlorine concentration of 2 mg/L after the electrolytic cell. Sampling was done before treatment (SP1), behind the ECl2 (SP2) and after a hydraulic retention time (HRT) of 30 min behind the respective number of UV reactors. Samples for TOrCs, DOC, and THM analysis were quenched after 30 min using sulfite.
The MOX cell voltage was recorded in order to calculate energy demand and the “electric energy per order” (EEO) of the ECl2 (Equation (10)). As handling of contaminants at a waterworks site was prohibited, no spiking of the water with TOrCs was performed. Only selected substances, that were regularly present in the Elbe river water at sufficient concentrations (Table 2) were used for the evaluation of TOrC degradation. Due to the high costs of TOrC analysis the number of analyses and test settings was very limited in the here presented work and the results can only give a tendency of the degradation behavior.

2.3. Energy Demand and Energy Efficiency

In order to estimate the energetic efficiency of the UV/ECl2 AOP, the “electric energy per order” (EEO), representing the electrical energy necessary for the degradation of one log unit of a contaminant, was calculated following Equation (10) [39]:
E EO = P q log c 0 c ,
where P: Electrical power applied to run the process (W), q: Flow rate (m3/h), c0: Initial contaminant concentration (µg/L) and c: Final contaminant concentration (µg/L)
The EEO of the here generated data allows a comparison with alternative AOPs and may serve as requisite data for the evaluation of their economic feasibility and sustainability. It should be considered that for the generation of EEO values of UV based AOPs in literature often only the energy required to power the UV lamp is considered. The energy required to produce, transport and dose e.g., H2O2 or chlorine are often neglected. Therefore, the EEO calculated for the here presented approach distinguishes between the energy required for the UV and UV/ECl2. Further deviations are to be expected when varying process capacity and source water quality [40].

2.4. Water Analysis

The quantification of hydroxyl radicals was carried out following [36] by adding methanol (Carl Roth, Karlsruhe, Germany) in excess as radical scavenger. According to [41] methanol reacts with OH and Cl radicals to formaldehyde following the Equations (11)–(14):
CH 3 OH +   · OH     CH 2 OH · +   H 2 O ,
CH 3 OH +   · Cl     CH 2 OH · +   HCl ,
CH 2 OH · +   O 2   O 2 CH 2 OH · ,
O 2 CH 2 OH ·   CH 2 O + HO 2 ·
Formaldehyde concentrations were analyzed following [42], were the extinction coefficient EDDL caused by diacetyldihydrolutidin (DDL) formed during Hantzsch reaction was determined with a calibrated UV-VIS spectrometer (UV-1602, Shimadzu, Jena, Germany) using a 1 cm cuvette. Since the efficiency of ·OH radicals reacting with methanol is 93% [36], the OH radical production can be determined by the amount of DDL produced. As ·Cl is also an active species in this reaction [43], the calculated values only represent an upper limit of the ·OH production. Still, the obtained value is seen as useful to determine the capability of the formed radical species to react even with relatively inert C-H bonds like those of methanol.
Quantitative analysis of oxipurinol, gabapentin and iomeprol was done using HPLC-MS/MS following DIN 38407-47 using Agilent 1260 HPLC-System (Agilent Technologies, Waldbronn, Germany) und API 6500 MS/MS-System (AB Sciex, Darmstadt, Germany). Benzotriazoles were determined after automatic solid phase extraction with ASPEC (Gilson, Middleton, WI, USA) with HPLC-MS/MS Agilent 1200 HPLC-System (Agilent Technologies) and API 5500 MS/MS-System (AB Sciex) following TZW lab method. All substances had a Limit of Detection (LoD) of 0.01 µg/L except oxipurinol with a LoD of 0.025 µg/L. For analytic results below the LoD contaminant reduction rates and EEO values were calculated by using the respective LoD.
The dissolved organic carbon (DOC) was analyzed with a TOC-V-CPH (Shimadzu, Kyoto, Japan) with integrated auto-sampler ASI-V (Shimadzu, Japan) following method DIN EN 1484:2019-04. The electrolytically produced Free Available Chlorine (FAC) and total chlorine was determined with AL410 photometer (Aqualytic, Dortmund, Germany) using Aqualytic DPD1 and DPD3 reagents with a measurement range between 0.01 and 6.0 mg/L. Electric conductivity (CDC401, Hach Düsseldorf, Germany) and pH (CDC401, Hach) were determined using a Hach HQ40d multimeter. THMs were analyzed following DIN EN ISO 10,301 using a 7890A GC/MS by Agilent Technologies (Santa Clara, CA, USA) with a detection limit of 0.1 µg/L.

3. Results and Discussion

3.1. Lab Test

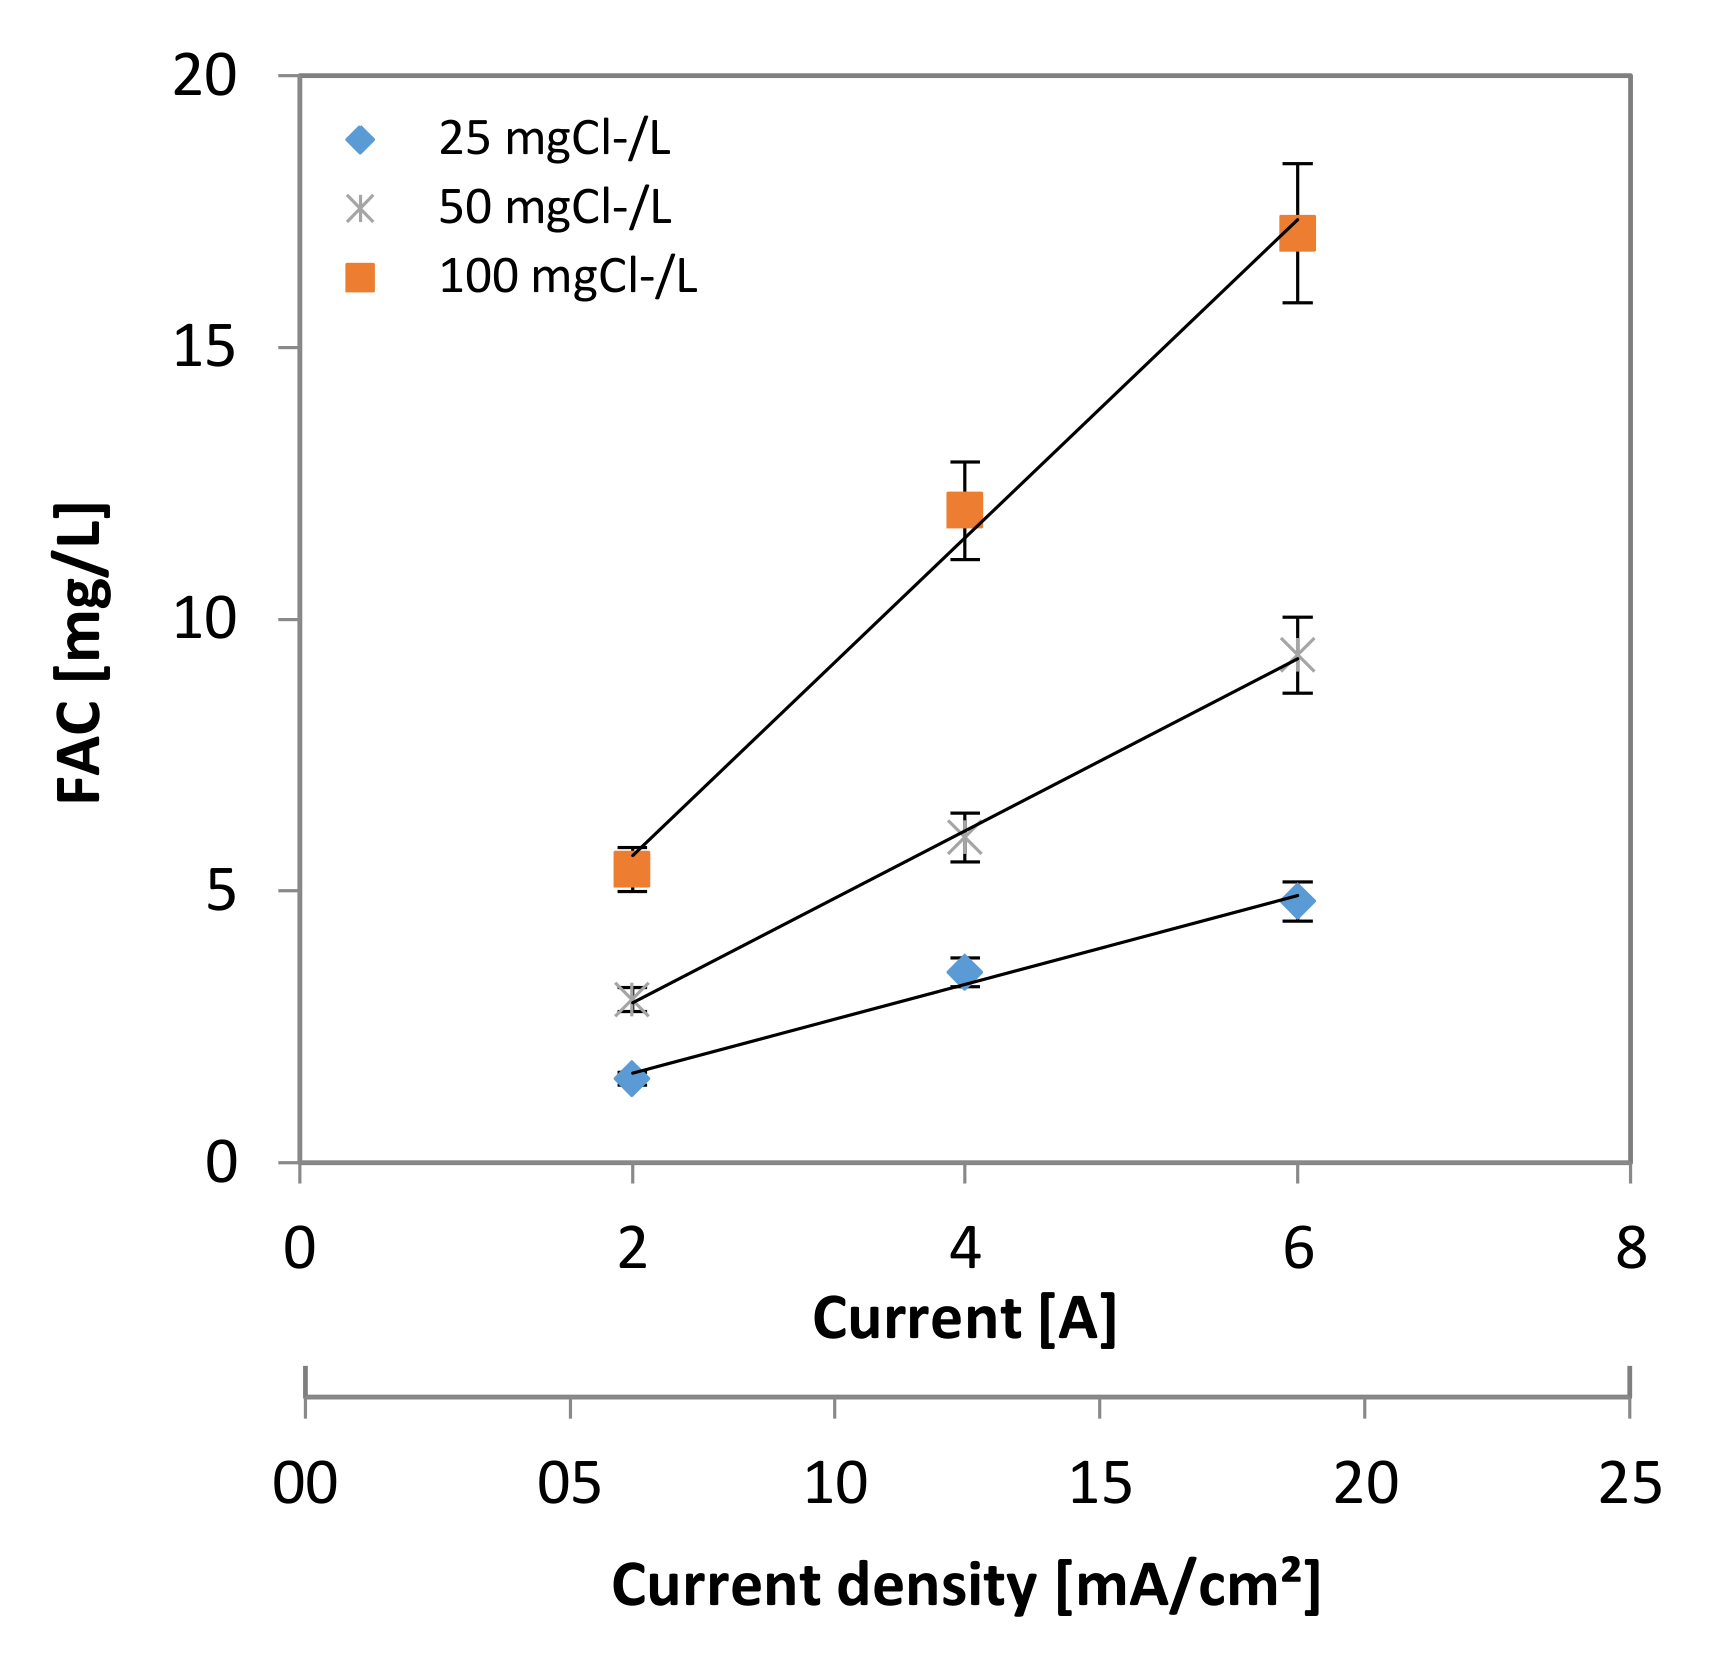
Figure 4 shows the linear relation between current or current density applied at the MOX electrode and the formation of FAC at the given input chloride concentrations considering chloride concentration of 25, 50 and 100 mg/L in the synthetic water.
Figure 5 shows the linear relation between the chloride concentration and the FAC as well as the FAC production rate achieved at the applied currents of 2, 4 and 6 A.
Such relations were also derived in former studies as shown in [44]. The linearity largely simplifies the control of FAC generation, from an operational perspective. The currents at the MOX electrode can be easily adjusted in a treatment system within the here given current densities.
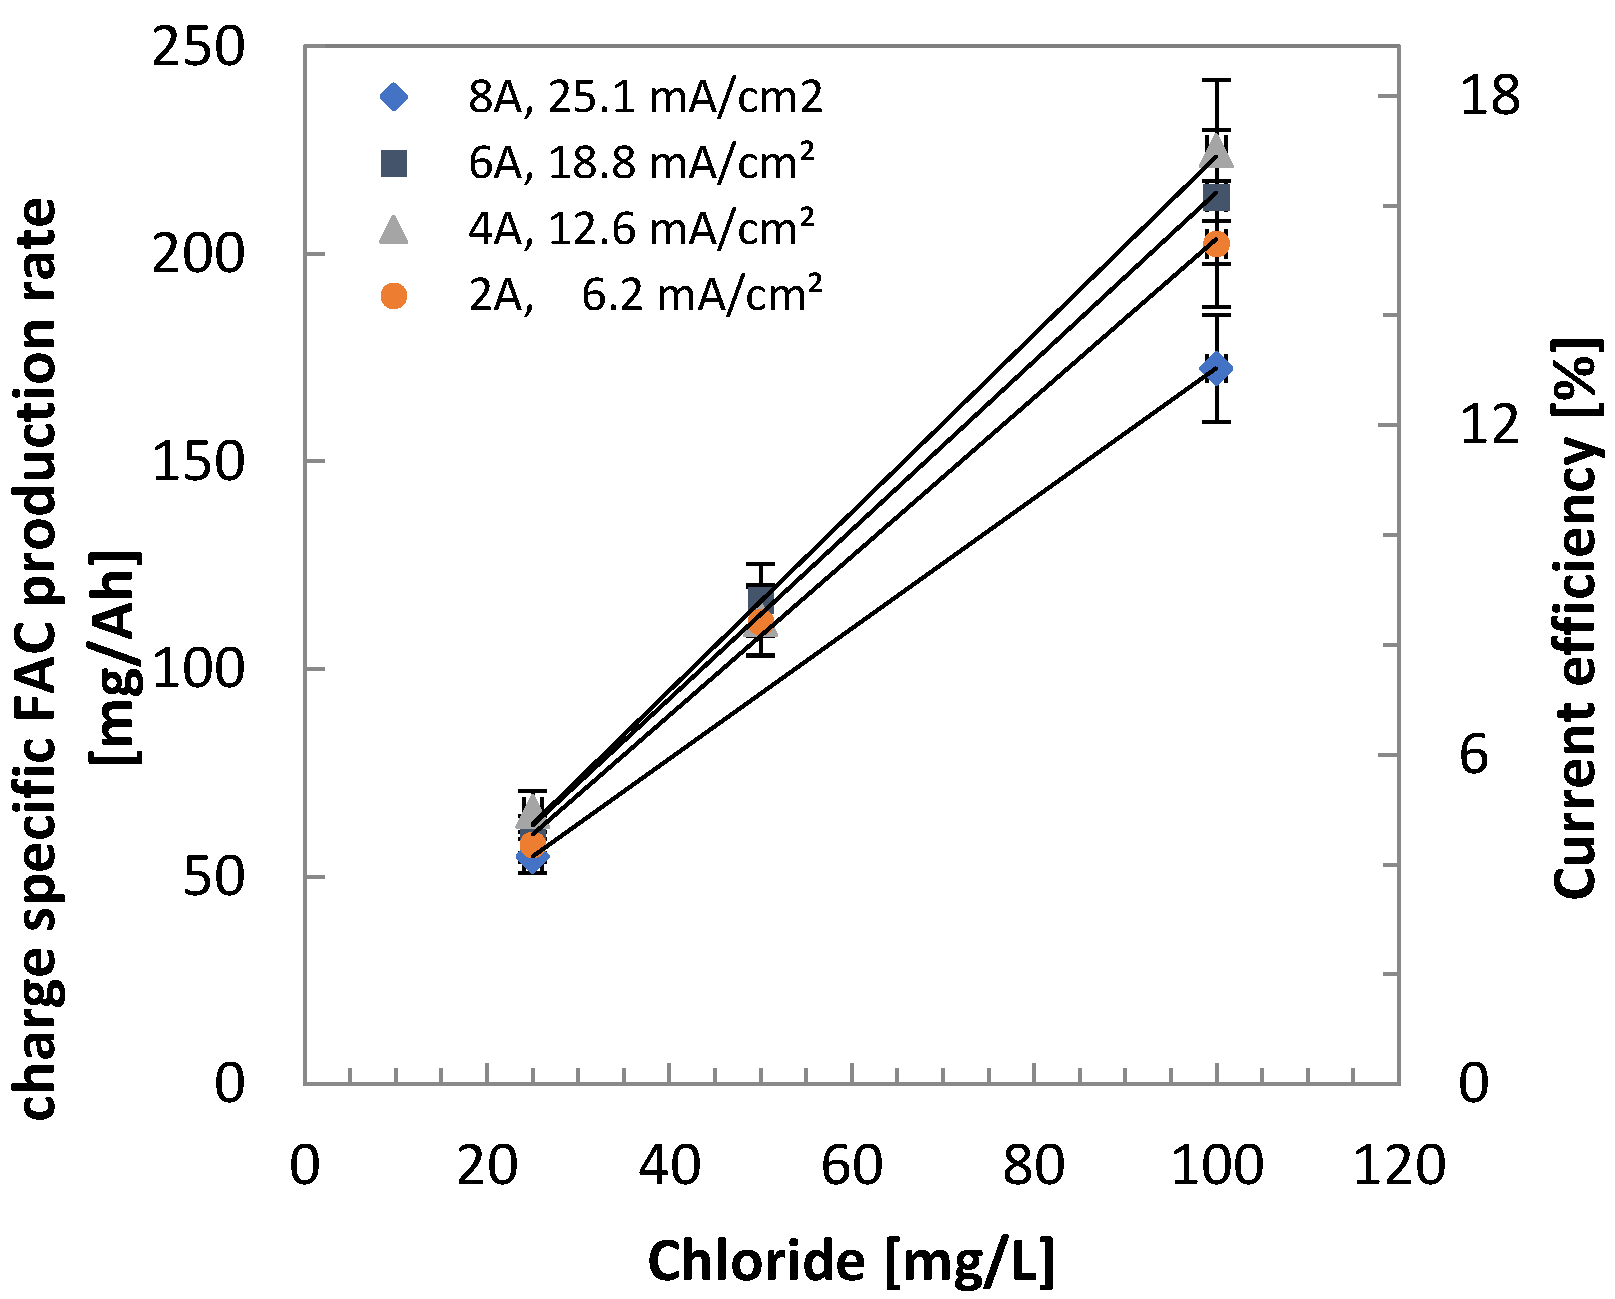
Figure 6 shows that charge specific chlorine production rates and current efficiencies are similar for currents of 2, 4, and 6 A with the applied cell. At higher currents, here shown with 8 A, the efficiency drops especially at higher chloride concentrations. This was related to the formation of gas bubbles at the anode surface.
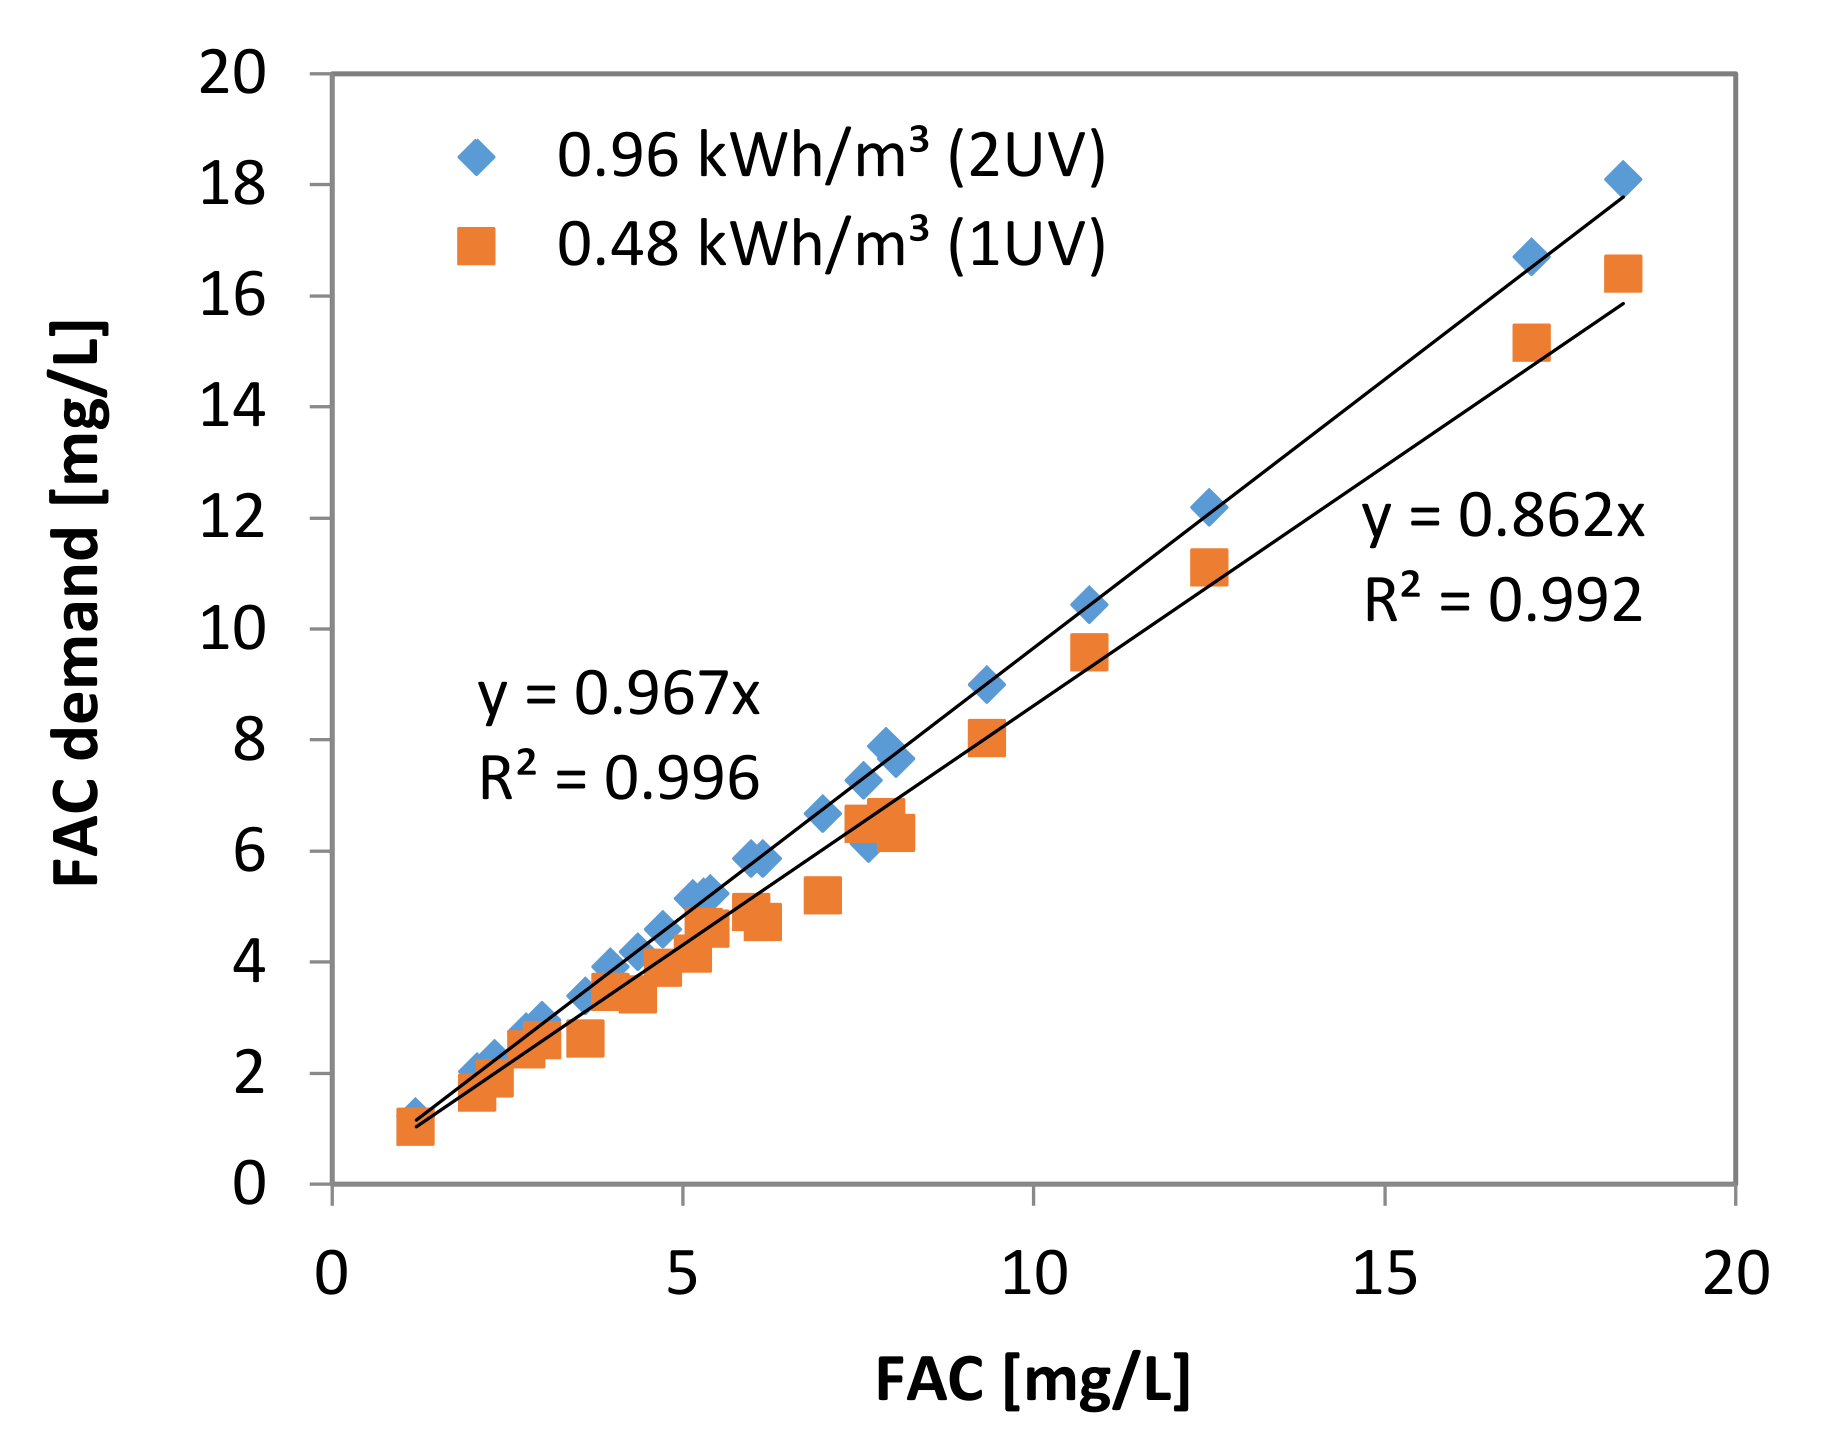
Figure 7 shows the linear relation between the electrolytically produced FAC concentration and the resulting reduction in FAC when irradiated with 1 and 2 UV reactors.
At the given FAC concentrations any additional FAC is readily photolyzed independent of its concentration. Already with the energy input of one UV lamp (0.48 kWh/m3) 84% of the FAC is consumed. On average the chlorine concentration was reduced to 1.0 ± 0.5 mg/L. The trials with two UV lamps achieved a FAC reduction of 96% and the chlorine concentration was further reduced on average to 0.2 ± 0.1 mg/L, which would make FAC quenching as suggested by [24] dispensable. Whether the second UV lamp and with that the extra energy demanded is required, depends on the site-specific treatment targets, with regards to TOrC reduction, DBP formation potential, residual chlorine concentration and the design of the used UV-reactor.
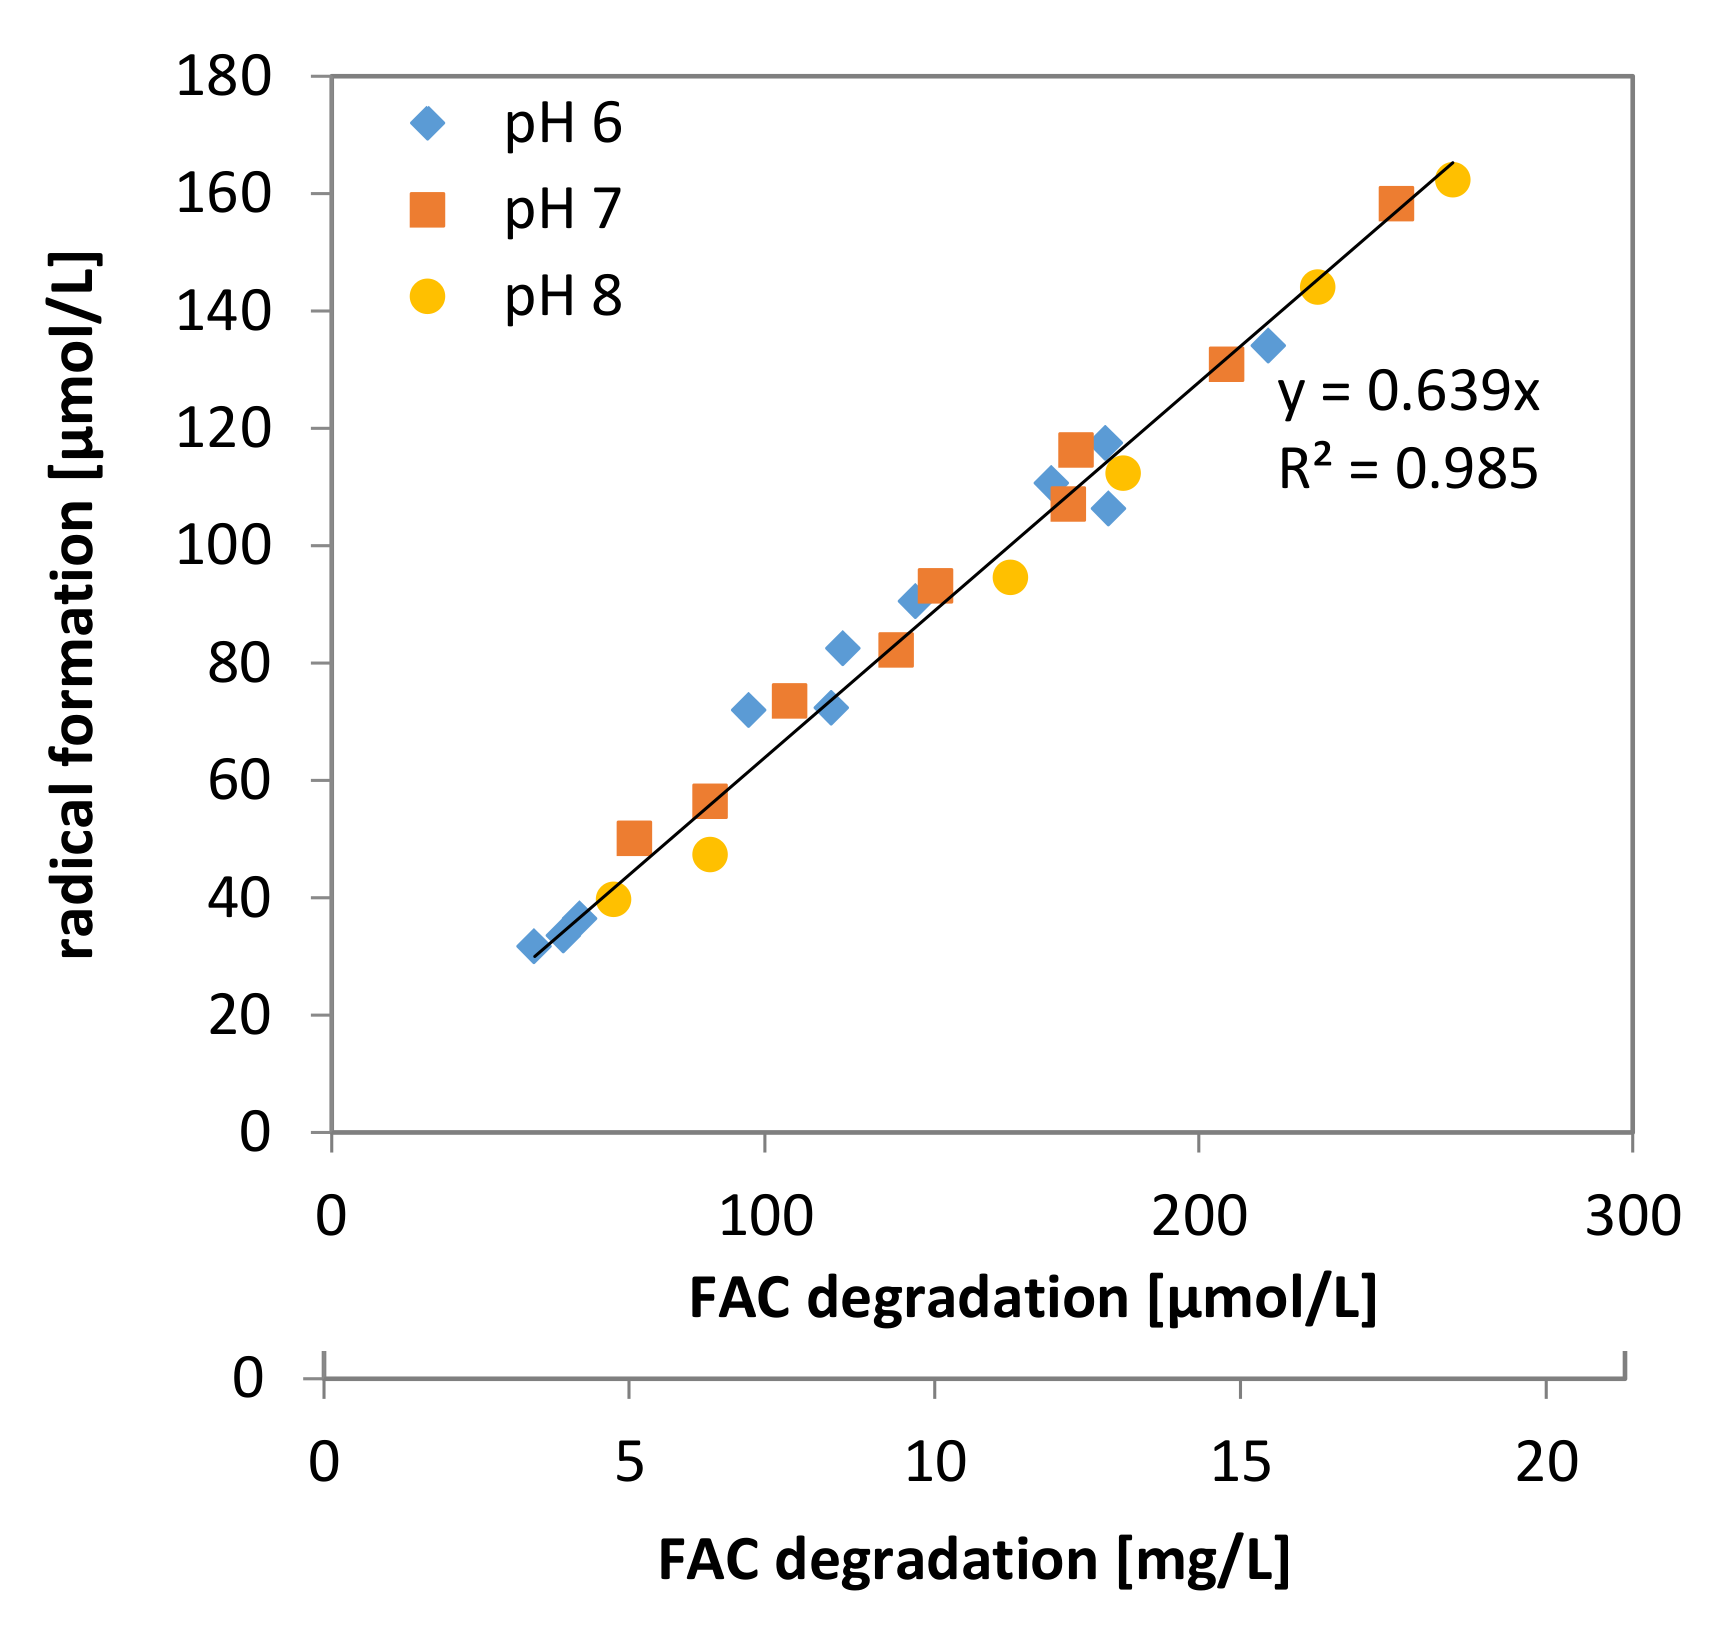
Figure 8 shows the relation between FAC degradation and the radical formation by means of chlorine photolysis at the given pH values.
The pH has no observable effect on the formation of radicals from photolyzed FAC. This relation has already been described by [28]. The average radical yield factor was constant over the here given FAC degradation range and with 64% (n = 26) significantly higher than the reported values of [45].
From an operational perspective the here achieved constant radical yield factor in the examined FAC concentration range offers the possibility to evaluate the degradation of TOrC by monitoring the chlorine degradation.
However, with rising pH the concentration of OCl is increasing (Equation (6)). As OCl has a slightly higher adsorption coefficient at 254 nm [28] slightly higher radical concentrations can be expected at higher pH values. On the other hand radical scavenger effects of HOCl and ClO- may result in additional chlorine degradation and the formation of oxy-chlorine radicals. Such scavenger effects are stronger at basic pH [29].

3.2. Field Tests

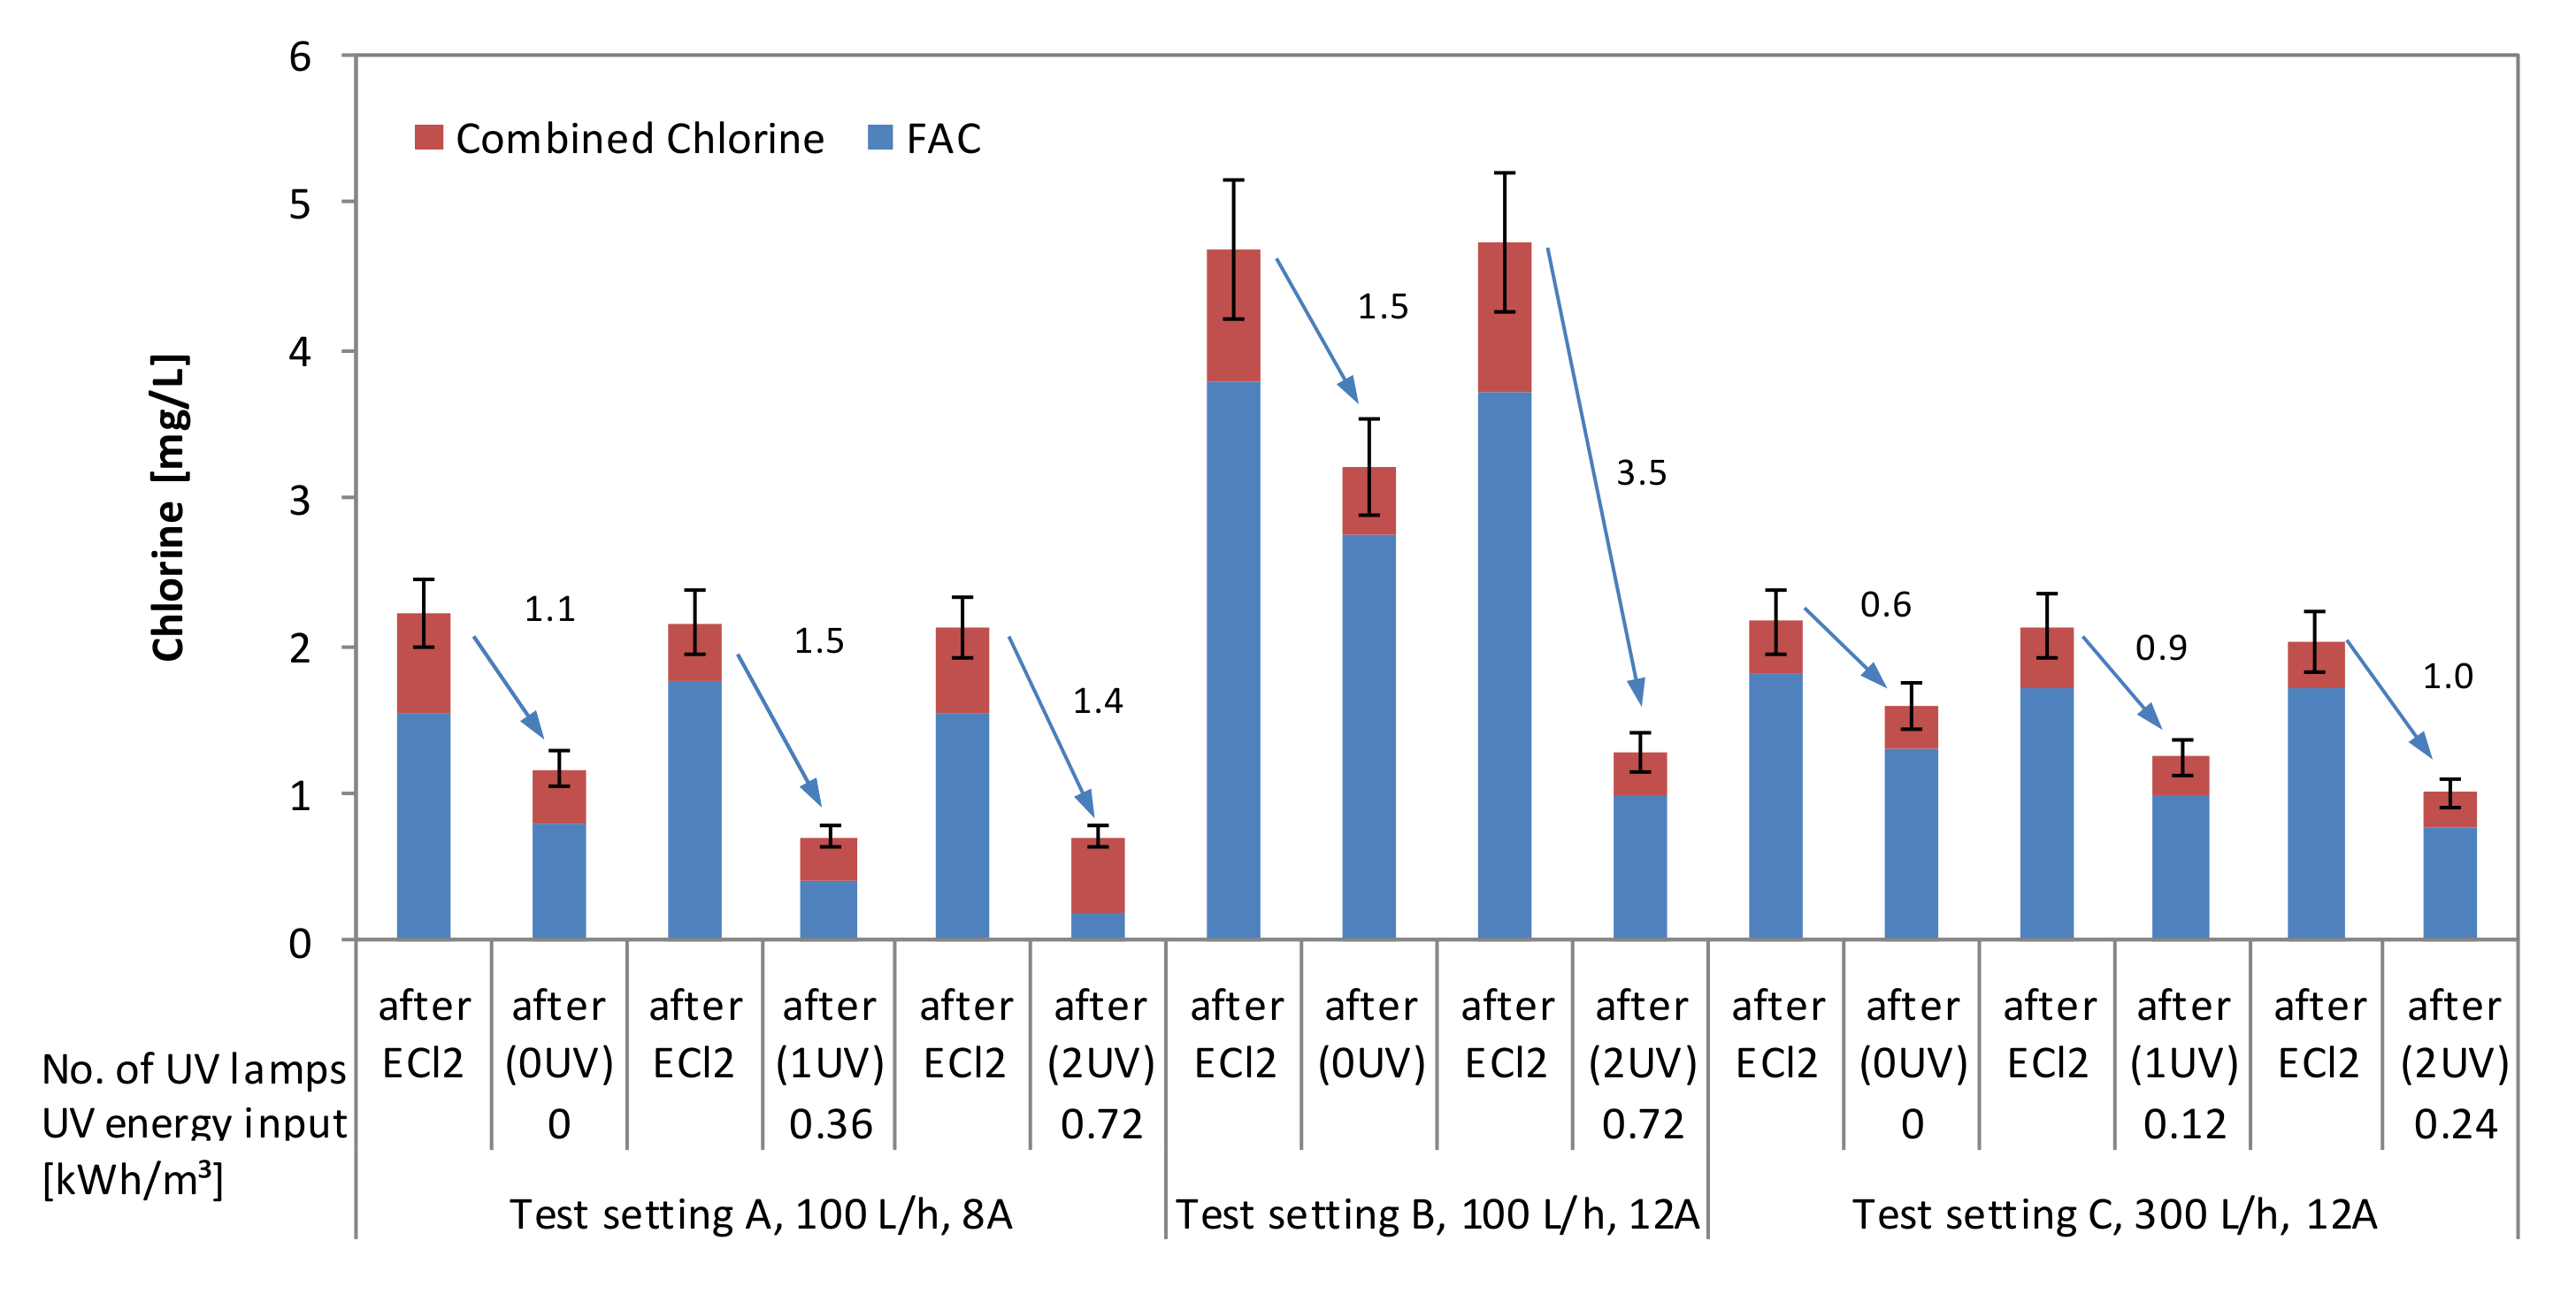
The total chlorine and FAC concentration measured directly after the ECl2 or the respective number of UV lamps (SP 3) during the treatment of Elbe river water is shown in Figure 9.
The average concentrations of FAC directly after the ECl2 reached 1.6 (n = 3), 3.8 (n = 2), and 1.7 mg/L (n = 3) for test settings A, B and C, respectively. Average total chlorine concentrations were 2.2 (n = 3), 4.7 (n = 2) and 2.1 mg/L (n = 3). The chlorine degradation was dependent on the initial chlorine concentration and the UV energy input into the water as already shown in Figure 7.
The reduction in chlorine concentration of the tested water during the trials without UV radiation indicated with 1.1, 1.4 and 0.6 mg/L a high DBP formation potential, typical for surface waters. The lower chlorine demand values during test setting C were related to the shorter HRT in the final storage tank.
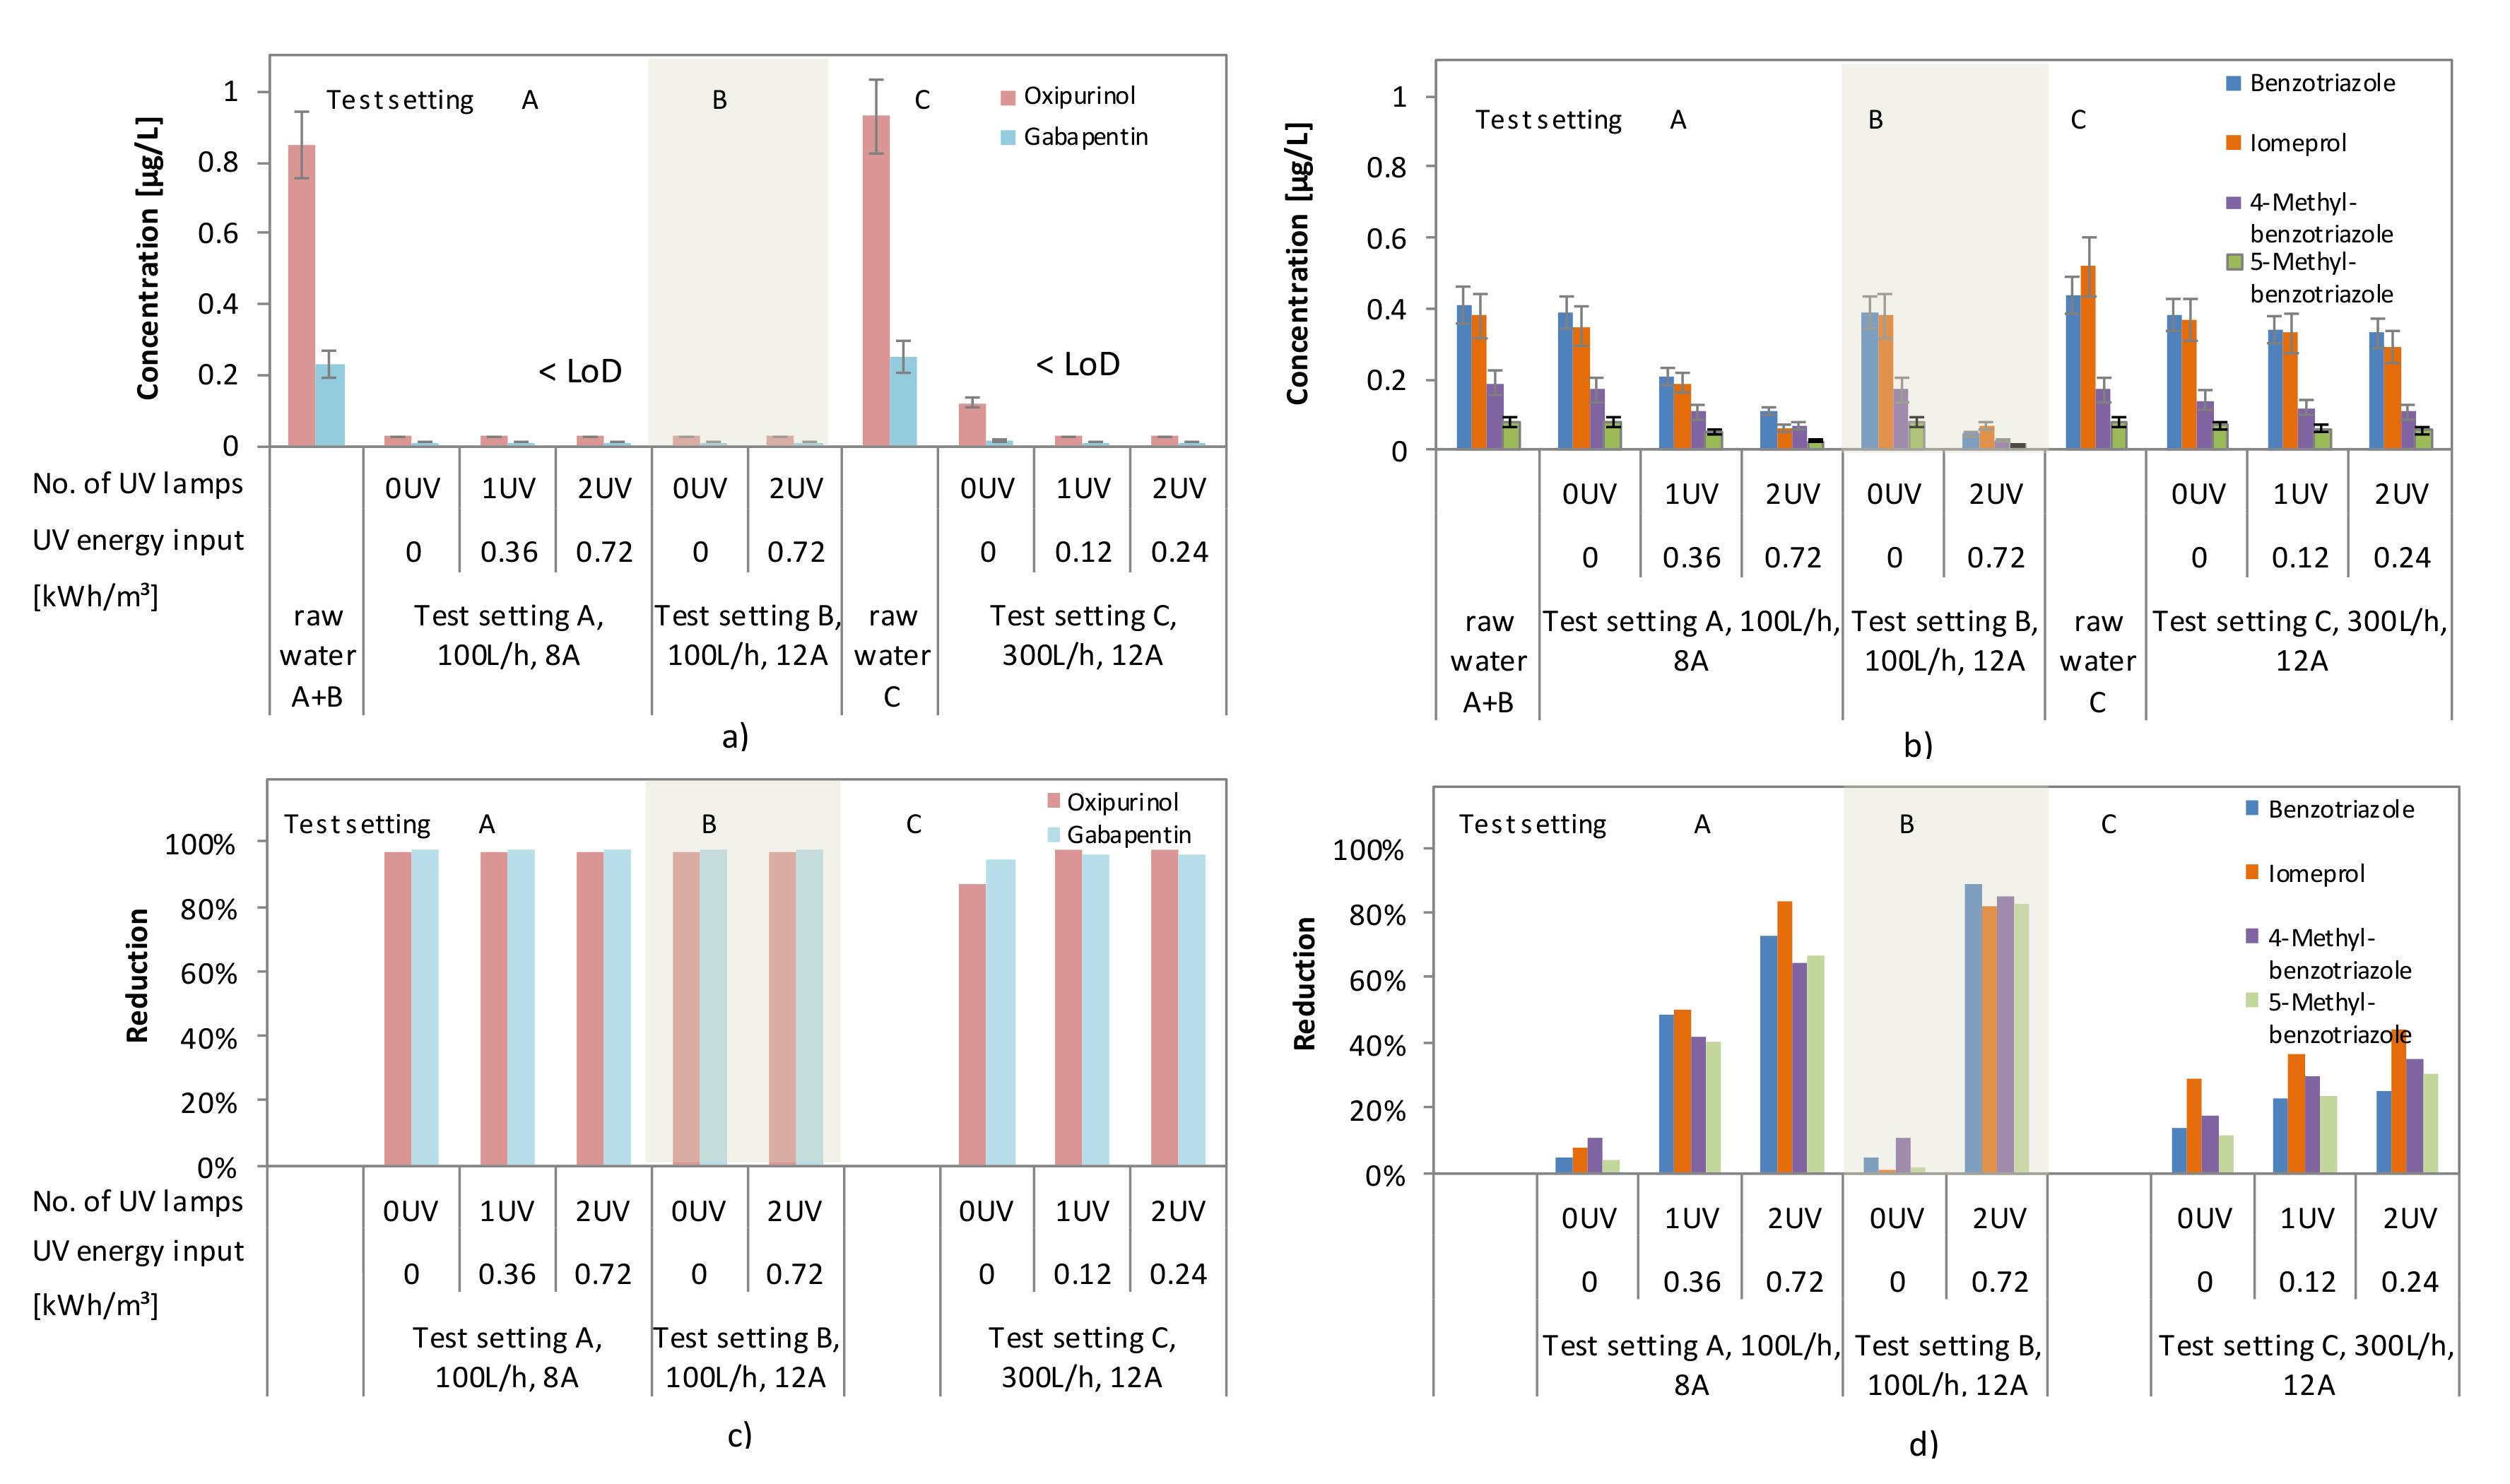
The degradation of the tested TOrCs after ECl2 only and after the photolysis of chlorine with the respective UV energy input is shown in Figure 10a–d.
The input concentrations for gabapentin and oxipurinol were 0.25 and 0.93 µg/L respectively. These substances were nearly completely degraded at all given test settings alone by the produced chlorine. After passing the first UV lamp in test setting A, eventually still available quantities of gabapentin and oxipurinol were degraded below the LoD. In contrast to that benzotriazole and 5-methylbenzotriazole could be degraded by only by 5% and 4% with ECl2 alone during test setting A. Iomeprol and 4-methylbenzotriazole were degraded by 8% and 11%. Higher chlorine concentrations produced during test setting B did not substantially improve the degradation. However, in combination with UV radiation the degradation could be significantly increased. In test setting A the degradation of benzotriazole was increased to 49% and 73% with an energy input of 0.36 (1 UV) and 0.72 kWh/m3 (2 UV), respectively. In combination with UV radiation the additional chlorine made available during test setting B further increased the degradation of benzotriazole to 89%. Iomeprol degradation could be increased to 83% and 82% during test settings A and B, respectively, with the energy of two UV lamps (0.72 kWh/m3). The behavior of 4-methylbenzotriazole and 5-methylbenzotriazole degradation was similar.
Even though nearly equal amounts of chlorine were available, the degradation of all substances susceptible for the UV/ECl2 AOP was largely reduced during test setting C. As also smaller amounts of chlorine were degraded, it can be concluded that at a flow rate of 300 L/h the HRT and by that the UV energy input was not sufficient to produce equal amounts of radicals as in test setting A.

3.3. Behavior of DOC and Formation of Disinfection-by-Products and Metabolites (Toxicity) during Field Tests

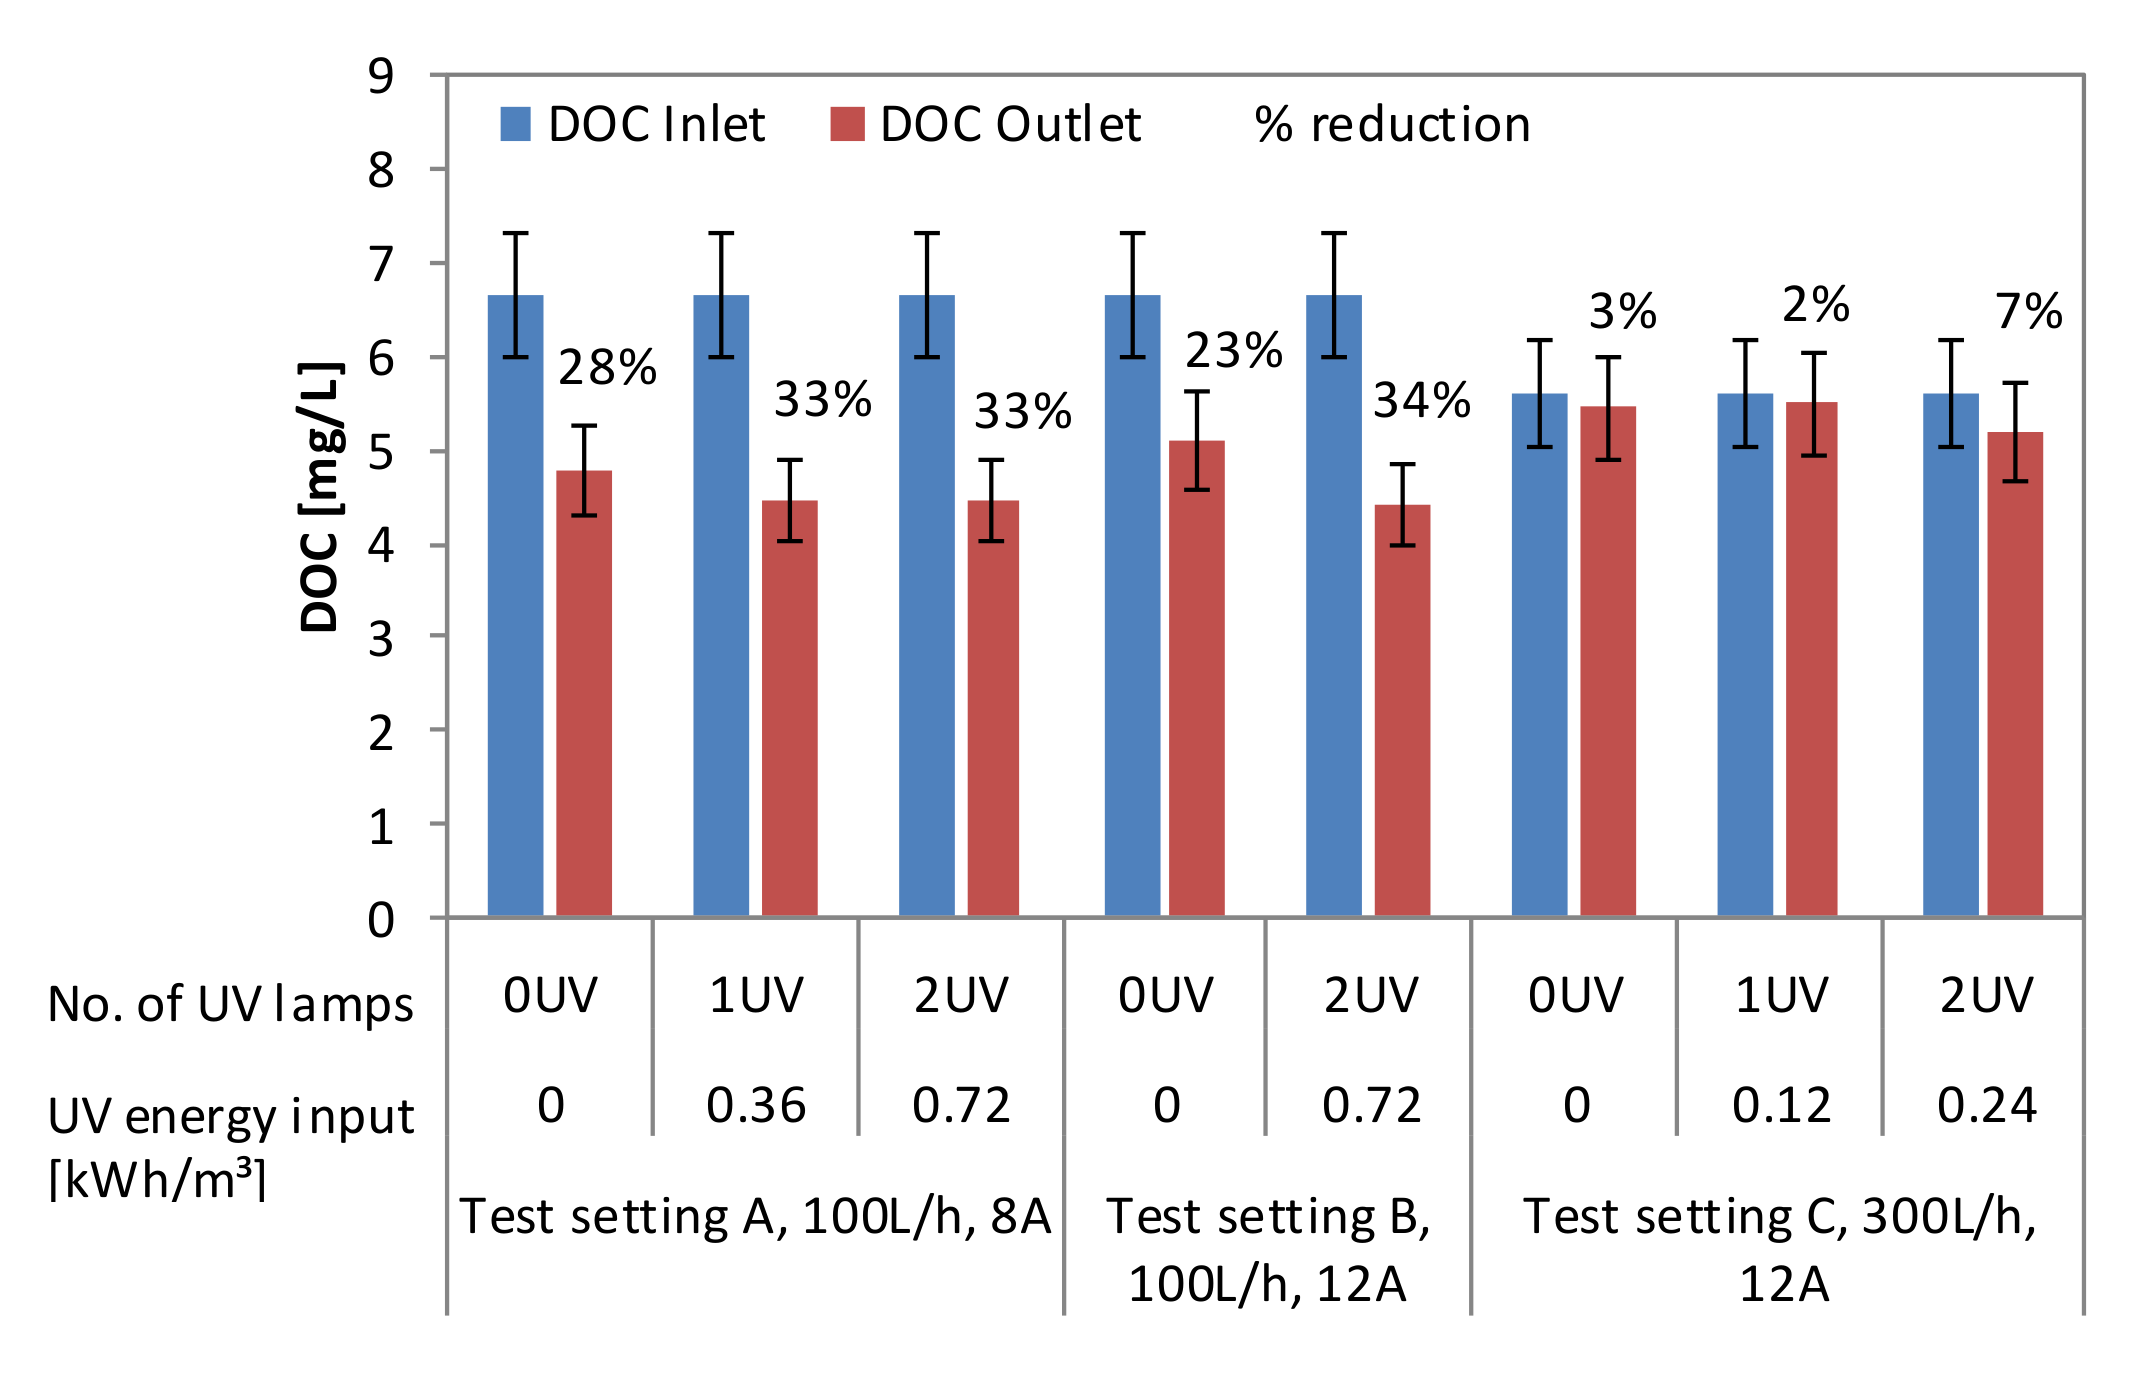
The mean DOC of Elbe river water in Dresden, Germany, is about 5.2 mg/L (4.6–6.0 mg/L, n = 325) [46]. In test settings A and B the river water showed a slightly elevated DOC of 6.7 mg/L, and 5.6 mg/L in test setting C after ultrafiltration. The comparatively high DOC in test settings A and B was caused by runoff after heavy rainfall during the period of this test, whereas test setting C was performed a rainless period. DOC was reduced by 28% and 23% in test setting A and B and by only 3% in test setting C through ECl2 alone as shown in Figure 11. The degradation of DOC without UV is explained by a direct oxidation of organics during the passage through the electrolytic cell as e.g., described in [47,48]. During test settings A and B the degradation of DOC was substantially higher compared to test setting C. This is related to the higher HRT and the nature of the DOC which is more easily degradable when containing runoff.
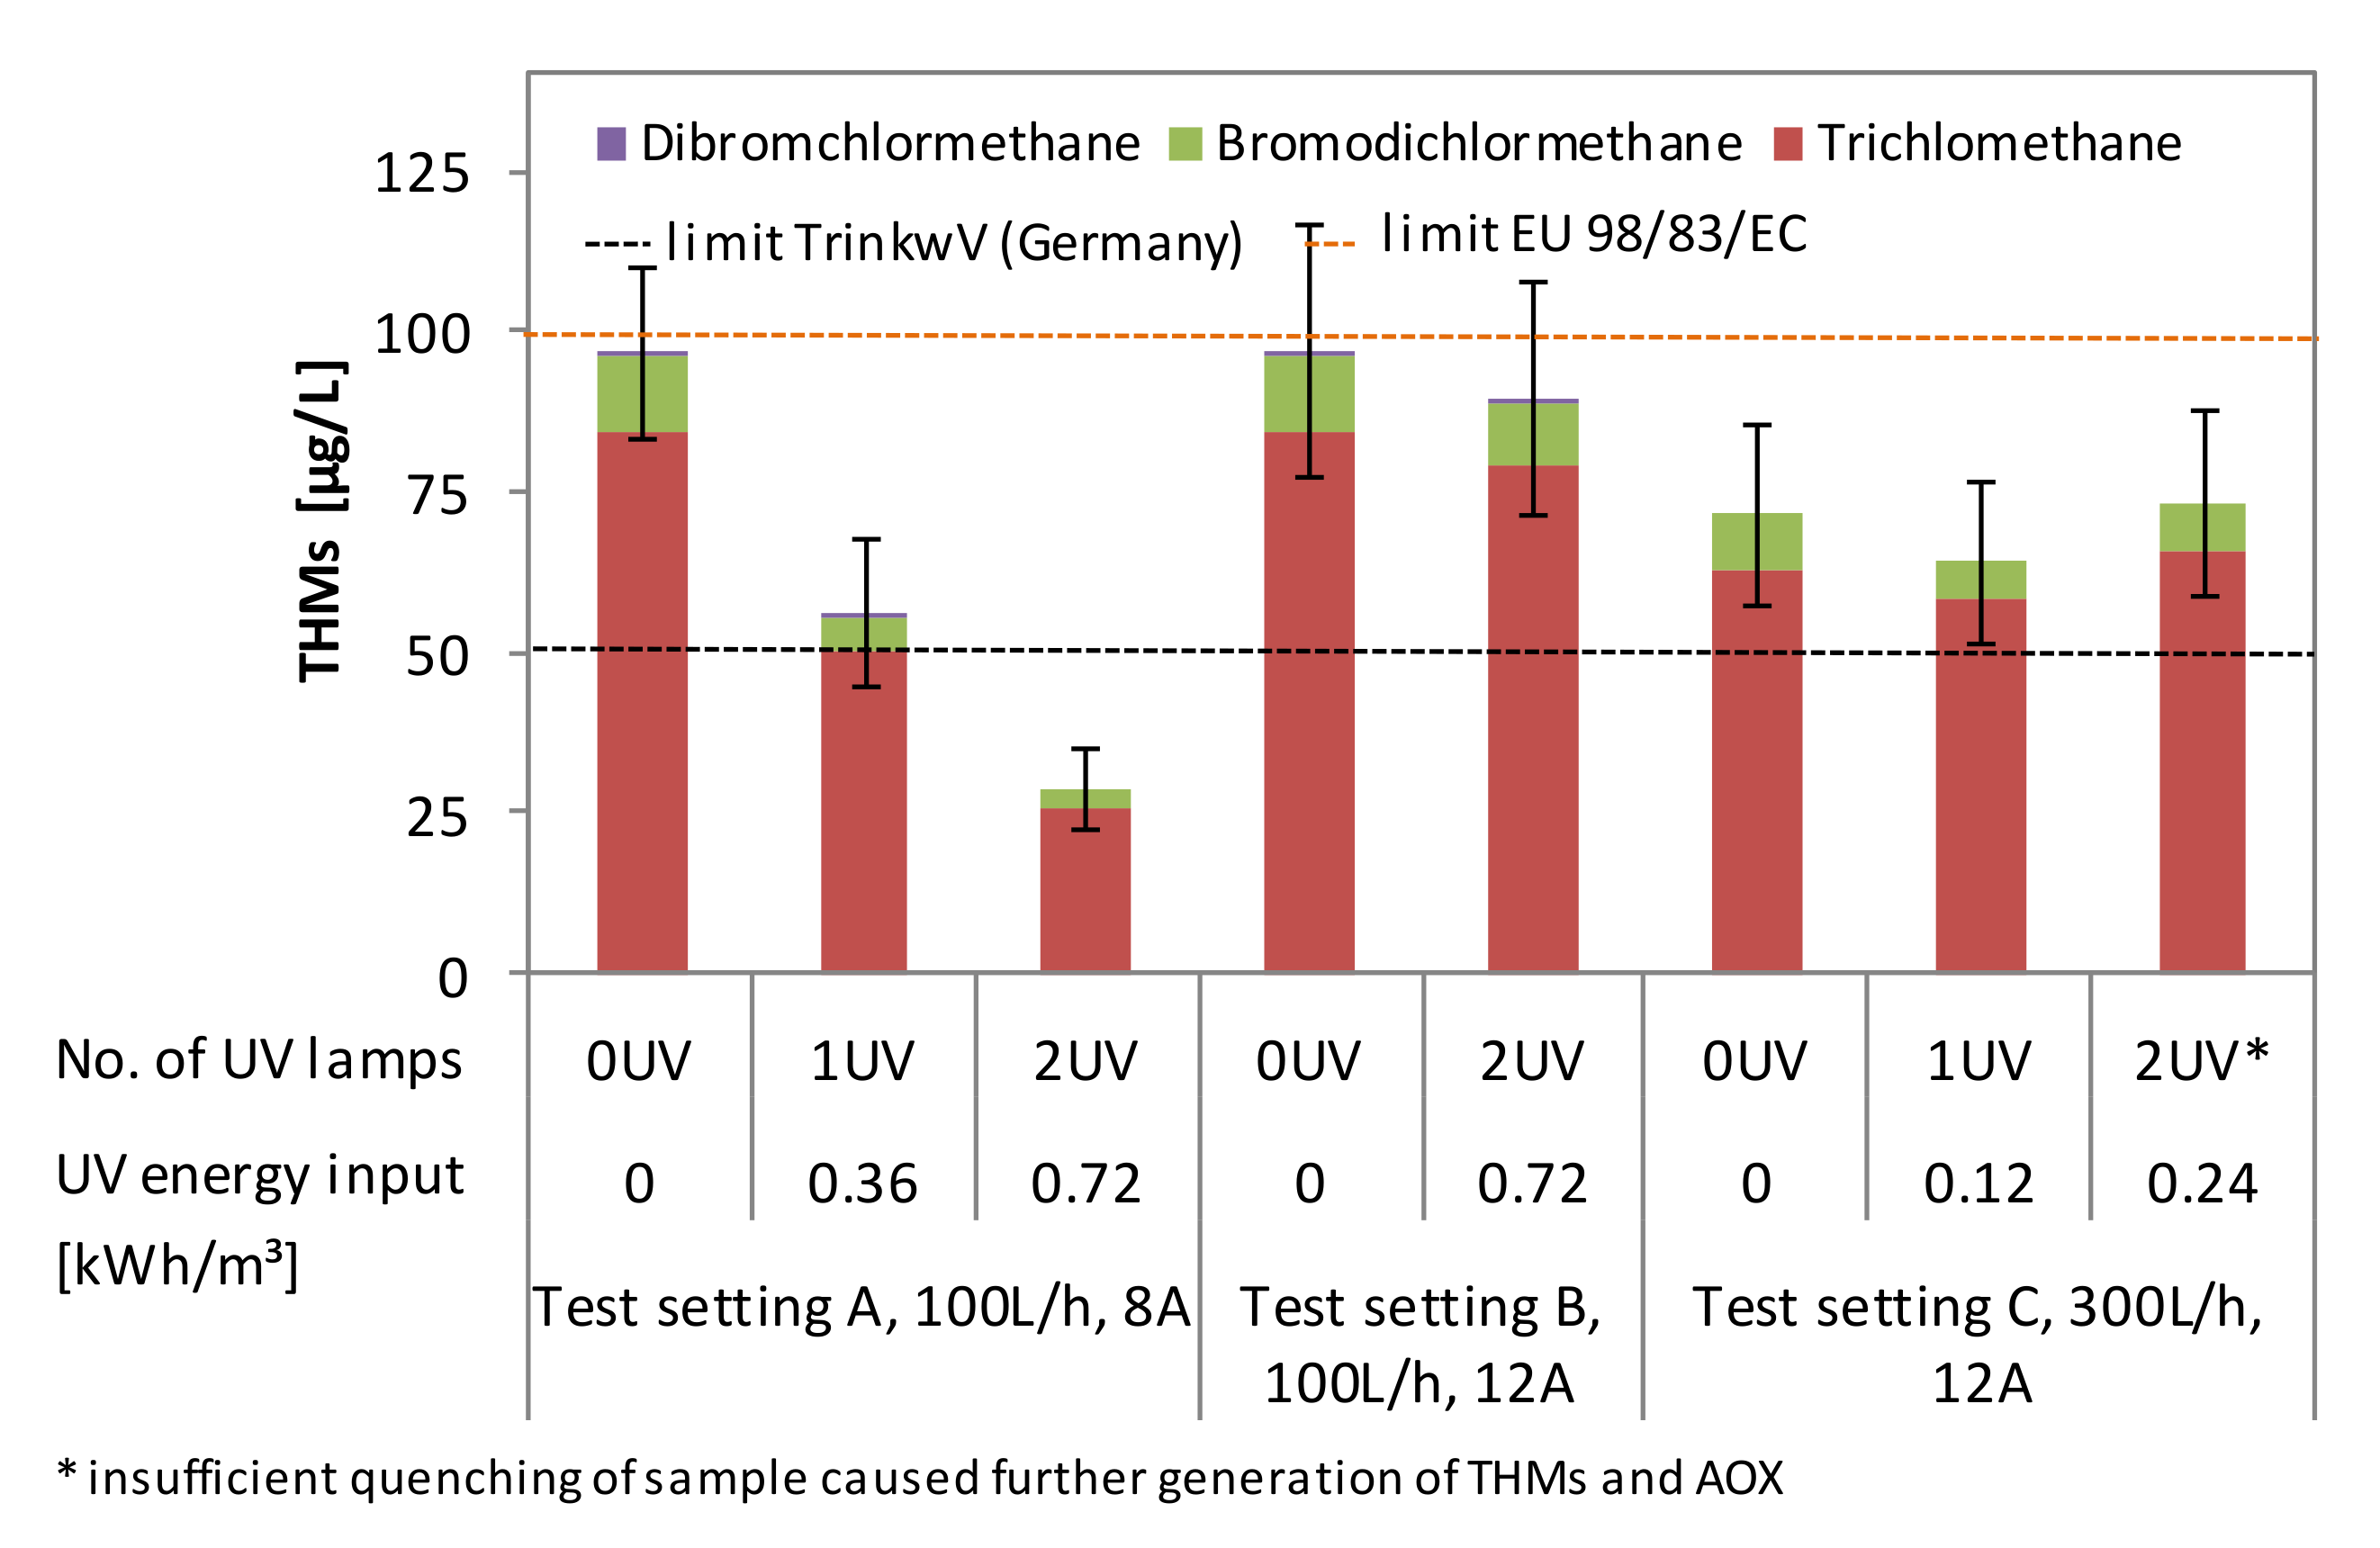
Figure 12 shows that DBPs measured as THMs have been formed after ECl2 and for THMs the strict German threshold of 50 µg/L could not be adhered to for the majority of the tested settings. However, it was always possible to adhere to the EU guideline values of < 100 µg/L. The EU guideline values could always be maintained (Table 3). During the trials with UV applied the formation of THM was substantially lower compared to trials without UV radiation. Less THMs were formed because smaller amounts of chlorine were available after photolysis. During test setting A with 2 UV lamps the THM formation made up only 47% compared to the trial without UV radiation, by which the German guideline limits could be maintained. DBP formation is therefore related to residual chlorine levels rather than the AOP itself. This is confirmed by other studies where no significant increase of organic DBP formation during the application of UV/Cl2 was found and most organic DBPs formed were related to the application of chlorine itself [49,50]. Also [24] found no significant quantities of THMs in UV/Cl2 when adding 6 mg/L of chlorine prior to the UV lamp, using simulated wastewater with a DOC of 46 mg/L (COD ~120 mg/L). In this study, residual chlorine was completely quenched after the UV lamp.
To prevent excessive THM formation it is therefore suggested to closely monitor the residual chlorine concentration directly after the UV lamps and reduce the concentration whenever required by increasing the UV radiation or the flow rate. The field test data in Figure 9 indicate that residual chlorine concentrations around 0.2 mg/L, as required by many drinking water guidelines, seems to be promising to meet strict German guidelines for THMs.
From an operational perspective such chlorine levels must be monitored by integrating online probes into the algorithm controlling the chlorine production.

3.4. Energy Efficiency

Figure 13a,b and Table A1 (in Appendix A) show the EEO values achieved for the degradation of the analyzed substances under the given conditions differentiating between the energy input into the chlorine production by means of ECl2 and photolysis of chlorine through UV radiation.
For test setting A the EEO for oxipurinol and gabapentin increased from 0.38 to 0.84 and from 0.42 to 0.95 kWh m−3 order−1 by increasing the energy input for chlorine photolysis from 0 to 0.72 kWh/m3. This increase is based on the fact that the additional energy input of the UV lamps does not substantially contribute to the degradation, as those substances are readily degraded by ECl2 alone as shown in Figure 10a. In contrast to that, the chlorine photolysis substantially reduced the EEO for benzotriazole, iomeprol, 5-methylbenzotriazole, and 4-methylbenzotriazole during all test settings. In test setting A the EEO for e.g., 5-methylbenzotriazole was reduced from 35.6 to 2.7 kWh m−3 order−1 with an energy input for chlorine photolysis caused by the UV lamps of 0.72 kWh/m3 (2 UV). For benzotriazole the EEO was reduced from 26.5 to 2.3 kWh m−3 order−1 with the same energy input. During test setting B the UV lamps reduced the EEO for benzotriazole from a rather theoretical value of 52.5 without UV lamps to 1.9 kWh m−3 order−1 with an UV energy input of 0.72 kWh/m3 (2 UV). This shows the positive effect of adding a minor quantity of additional energy in the form of UV light into the setting in order to substantially reducing the EEO.
Despite the substantial improvement of TOrC degradation through the photolysis of chlorine the achieved EEO values are higher compared to the literature reported EEO values for e.g., UV/H2O2 AOP. [24] reported an EEO for benzotriazole for H2O2/UV of 0.52 kWh m−3 order−1, neglecting hereby the energy required to produce and supply H2O2. However, even after removing the energy required for ECl2 from the UV/ECl2 AOP the resulting EEO for e.g., benzotriazole was still higher with 1.0 and 1.2 kWh m−3 order−1 for test settings A and B. Whether this was related to the different water qualities tested cannot be evaluated here. Due to the limited data available the EEO values calculated and the energy consumed can only be taken as an indication and further studies are required. A reduction of the energy demand by 30–70% by using UV/Cl2 instead of UV/H2O2 as estimated by [24] seems not likely with the settings examined in this work.

3.5. Operational Experience and Optimization

The long term UV/ECl2 trial was conducted over a period of 10 months during which 1023 m3 (3.4 m3/d) of water were treated. The system operated without any interruption caused by technical reasons. The only maintenance required was the manual cleaning of the quartz glass sleeves, from which deposits needed to be removed in a one-month interval, as those have reduced the UV dose. The components, and especially the electrolytic cells, did not show any sign of wear by the time the trial was finished. The concentration of total hardness found in Elbe river water (Table 2) have proven to be harmless with regards the formation of calcareous deposits in the cell surface with the selected polarity inversion intervals of three hours. In future tests these intervals should be extended. No chemicals for the operation and maintenance of the system were required.
Considering the high degradation rates of TOrCs, the comparably low formation of organic DBPs and the low EEO for the setting with a flow rate of 100 L/h, a current at the MOX of 8 A and the UV radiation of 2 × 36 W lamps (0.72 kWh/m3) was most promising and should constitute the base for further optimization. At this setting a total energy demand for the AOP process including pumping would sum up to 1.35 kWh/m3. In remote regions this energy can be supplied easily with renewable PV Energy systems as already shown in [55].

4. Conclusions

The photolysis of chlorine (UV/Cl2) was identified as promising AOP for the degradation of TOrCs present in drinking water sources. In the here presented work the chlorine required to run an UV/Cl2 AOP was produced by means of inline electrolysis from the natural chloride content of the water and by that substituted the external supply of chlorine, allowing the operation of an AOP without any additional need of chemicals.
For FAC concentrations between 1 and 18 mg/L an UV energy input of 0.48 kWh/m3 photolyzed 84% of the chlorine to form OH and Cl radicals. The degradation could be increased to 97% by doubling the UV energy input for the photolysis. The tests have further shown that the molar radical yield factor is about 64% and also very constant over the tested FAC range of 1–18 mg/L. In principle this allows to control the radical formation by adjusting the chlorine concentration simply through variation of the electric current at the MOX electrode.
By combining ECl2 with UV the degradation of benzotriazole and iomeprol can be increased from 5% to 89% and from 8% to 84%, respectively, compared to the application of ECl2 alone.
In most of the test settings the formation of organic DBPs measured as THMs have reached concentrations above the strict German guideline values for drinking water of 50 µg/L. EU guideline values could be adhered to with all of the tested settings. The formation of such DBPs was related to elevated residual chlorine concentrations after the photolysis of chlorine and can be controlled by reducing the residual chlorine concentrations to levels that are adequate for drinking water disinfection. This requires site specific adaption of the treatment process.
The calculated EEO values have found to be higher than literature values of alternative AOPs. The identified optimization potential should be considered to reduce the overall energy requirement of this technology. The main advantage of the here presented approach is the application of an effective AOP to degrade TOrC independent of any external chemical input. By that the UV/ECl2 AOP constitutes an alternative treatment approach especially for decentralized applications.
Further data and research is required to confirm the here presented results and the effect of the AOP on other TOrCs. Optimization potential is given by increasing the HRT in the UV reactors by adapting the reactor design.
Interesting for future application may also be further treatment of treated wastewater prior to its discharge into the environment.

Author Contributions

Conceptualization, methodology, investigation, P.O., F.-M.K., K.M., A.G., F.B., P.M. and T.G. (Tobias Gerhardt); writing—original draft preparation, P.O. and R.W.; writing—review and editing, P.O., T.G. (Thomas Grischek), F.-M.K., K.M. and T.G. (Tobias Gerhardt); supervision, T.G. (Thomas Grischek); funding acquisition, project administration, P.O. and F.-M.K. All authors have read and agreed to the published version of the manuscript.

Funding

This research was funded by the German Ministry of Education and Research (BMBF), program “KMU-Innovativ” grant no. 02WQ1395. The APC was funded by the Open Access Publication Fund of Hochschule für Technik und Wirtschaft Dresden, University of Applied Sciences, and the Deutsche Forschungsgemeinschaft (DFG, German Research Foundation)—432908064.

Conflicts of Interest

There are no conflicts to declare.

Appendix A

Table A1. EEO values achieved during field tests with Elbe river water considering ECl2 and UV/ECl2.
Field testLiterature values
EEO-(ECl2)
[kWh/(order·m³)]
Elimination
[%]
EEO-(ECl2 + UV)
[kWh/(Order·m³)]
Elimination
[%]
EEO-UV/Cl2
[kWh/(Order·m³)]
minmaxminmaxminmaxminmax
Benzotriazole 13.652.55%14%1.97.325%89%0.5[24]
4-Methyl-benzotriazole1.323.611%18%0.61.529%85%n.a.
5-Methyl-benzotriazole7.2213.91%11%0.91.624%83%n.a.
Iomeprol16.1996.20%29%1.79.337%83%n.a.
Gabapentin0.4≤0.894%≥98%≤0.41.4≥96%≥98%n.a.
Oxipurinol≤0.4≤0.787%≥97%≤0.3≤0.7≥97%≥97%n.a.

References

  1. Kümmerer, K. Pharmaceuticals in the Environment; Springer Berlin Heidelberg: Berlin/Heidelberg, Germany, 2008; ISBN 978-3-540-74663-8. [Google Scholar]
  2. Ternes, T.; Joss, A. (Eds.) Human Pharmaceuticals, Hormones and Fragrances. The Challenge of Micropollutants in Urban Water Management; IWA Publ: London, UK, 2008; ISBN 9781843390930. [Google Scholar]
  3. Houtman, C.J. Emerging contaminants in surface waters and their relevance for the production of drinking water in Europe. J. Integr. Environ. Sci. 2010, 7, 271–295. [Google Scholar] [CrossRef]
  4. Montes-Grajales, D.; Fennix-Agudelo, M.; Miranda-Castro, W. Occurrence of personal care products as emerging chemicals of concern in water resources: A review. Sci. Total Environ. 2017, 595, 601–614. [Google Scholar] [CrossRef] [PubMed]
  5. Mohapatra, S.; Huang, C.-H.; Mukherji, S.; Padhye, L.P. Occurrence and fate of pharmaceuticals in WWTPs in India and comparison with a similar study in the United States. Chemosphere 2016, 159, 526–535. [Google Scholar] [CrossRef] [PubMed]
  6. Tran, N.H.; Reinhard, M.; Gin, K.Y.-H. Occurrence and fate of emerging contaminants in municipal wastewater treatment plants from different geographical regions-a review. Water Res. 2018, 133, 182–207. [Google Scholar] [CrossRef]
  7. Kibuye, F.A.; Gall, H.E.; Elkin, K.R.; Ayers, B.; Veith, T.L.; Miller, M.; Jacob, S.; Hayden, K.R.; Watson, J.E.; Elliott, H.A. Fate of pharmaceuticals in a spray-irrigation system: From wastewater to groundwater. Sci. Total Environ. 2019, 654, 197–208. [Google Scholar] [CrossRef]
  8. Balakrishna, K.; Rath, A.; Praveenkumarreddy, Y.; Guruge, K.S.; Subedi, B. A review of the occurrence of pharmaceuticals and personal care products in Indian water bodies. Ecotoxicol. Environ. Saf. 2017, 137, 113–120. [Google Scholar] [CrossRef] [Green Version]
  9. Hellauer, K.; Mergel, D.; Ruhl, A.; Filter, J.; Hübner, U.; Jekel, M.; Drewes, J. Advancing Sequential Managed Aquifer Recharge Technology (SMART) using different intermediate oxidation processes. Water 2017, 9, 221. [Google Scholar] [CrossRef] [Green Version]
  10. Hirsch, R.; Ternes, T.; Haberer, K.; Kratz, K.-L. Occurrence of antibiotics in the aquatic environment. Sci. Total Environ. 1999, 225, 109–118. [Google Scholar] [CrossRef]
  11. Kolpin, D.W.; Furlong, E.T.; Meyer, M.T.; Thurman, E.M.; Zaugg, S.D.; Barber, L.B.; Buxton, H.T. Pharmaceuticals, hormones, and other organic wastewater contaminants in U.S. streams, 1999-2000: A national reconnaissance. Environ. Sci. Technol. 2002, 36, 1202–1211. [Google Scholar] [CrossRef] [Green Version]
  12. Schwab, B.W.; Hayes, E.P.; Fiori, J.M.; Mastrocco, F.J.; Roden, N.M.; Cragin, D.; Meyerhoff, R.D.; D’Aco, V.J.; Anderson, P.D. Human pharmaceuticals in US surface waters: A human health risk assessment. Regul. Toxicol. Pharmacol. 2005, 42, 296–312. [Google Scholar] [CrossRef]
  13. Avisar, D.; Levin, G.; Gozlan, I. The processes affecting oxytetracycline contamination of groundwater in a phreatic aquifer underlying industrial fish ponds in Israel. Environ. Earth Sci. 2009, 59, 939–945. [Google Scholar] [CrossRef]
  14. Ebele, A.J.; Abou-Elwafa Abdallah, M.; Harrad, S. Pharmaceuticals and personal care products (PPCPs) in the freshwater aquatic environment. Emerg. Contam. 2017, 3, 1–16. [Google Scholar] [CrossRef]
  15. Bolong, N.; Ismail, A.F.; Salim, M.R.; Matsuura, T. A review of the effects of emerging contaminants in wastewater and options for their removal. Desalination 2009, 239, 229–246. [Google Scholar] [CrossRef]
  16. Dolar, D.; Gros, M.; Rodriguez-Mozaz, S.; Moreno, J.; Comas, J.; Rodriguez-Roda, I.; Barceló, D. Removal of emerging contaminants from municipal wastewater with an integrated membrane system, MBR-RO. J. Hazard. Mater. 2012, 239–240, 64–69. [Google Scholar] [CrossRef] [PubMed]
  17. Snyder, S.A.; Adham, S.; Redding, A.M.; Cannon, F.S.; DeCarolis, J.; Oppenheimer, J.; Wert, E.C.; Yoon, Y. Role of membranes and activated carbon in the removal of endocrine disruptors and pharmaceuticals. Desalination 2007, 202, 156–181. [Google Scholar] [CrossRef]
  18. Yang, Y.; Pignatello, J.J.; Ma, J.; Mitch, W.A. Comparison of halide impacts on the efficiency of contaminant degradation by sulfate and hydroxyl radical-based advanced oxidation processes (AOPs). Environ. Sci. Technol. 2014, 48, 2344–2351. [Google Scholar] [CrossRef]
  19. Rosenfeldt, E.J.; Linden, K.G.; Canonica, S.; Gunten, U. von. Comparison of the efficiency of *OH radical formation during ozonation and the advanced oxidation processes O3/H2O2 and UV/H2O2. Water Res. 2006, 40, 3695–3704. [Google Scholar] [CrossRef]
  20. Fang, J.; Fu, Y.; Shang, C. The roles of reactive species in micropollutant degradation in the UV/free chlorine system. Environ. Sci. Technol. 2014, 48, 1859–1868. [Google Scholar] [CrossRef]
  21. Wang, W.-L.; Wu, Q.-Y.; Huang, N.; Wang, T.; Hu, H.-Y. Synergistic effect between UV and chlorine (UV/chlorine) on the degradation of carbamazepine: Influence factors and radical species. Water Res. 2016, 98, 190–198. [Google Scholar] [CrossRef]
  22. Xiang, Y.; Fang, J.; Shang, C. Kinetics and pathways of ibuprofen degradation by the UV/chlorine advanced oxidation process. Water Res. 2016, 90, 301–308. [Google Scholar] [CrossRef]
  23. Rott, E.; Kuch, B.; Lange, C.; Richter, P.; Kugele, A.; Minke, R. Removal of emerging contaminants and estrogenic activity from wastewater treatment plant effluent with UV/chlorine and UV/H₂O₂ advanced oxidation treatment at pilot scale. Int. J. Environ. Res. Public Health 2018, 15, 935. [Google Scholar] [CrossRef] [PubMed] [Green Version]
  24. Sichel, C.; Garcia, C.; Andre, K. Feasibility studies: UV/chlorine advanced oxidation treatment for the removal of emerging contaminants. Water Res. 2011, 45, 6371–6380. [Google Scholar] [CrossRef] [PubMed]
  25. Latimer, W.M. The Oxidation States of the Elements and Their Potentials in Aqueous Solutions, 2nd ed.; Prentice-Hall: New York, NY, USA, 1952. [Google Scholar]
  26. Watts, M.J.; Linden, K.G. Chlorine photolysis and subsequent OH radical production during UV treatment of chlorinated water. Water Res. 2007, 41, 2871–2878. [Google Scholar] [CrossRef] [PubMed]
  27. Baxendale, J.H.; Wilson, J.A. The photolysis of hydrogen peroxide at high light intensities. Trans. Faraday Soc. 1957, 53, 344. [Google Scholar] [CrossRef]
  28. Feng, Y.; Smith, D.W.; Bolton, J.R. Photolysis of aqueous free chlorine species (HOCl and OCl) with 254 nm ultraviolet light. J. Environ. Eng. Sci. 2007, 6, 277–284. [Google Scholar] [CrossRef] [Green Version]
  29. Kishimoto, N. State of the art of UV/chlorine Advanced Oxidation Processes: Their mechanism, byproducts formation, process variation, and applications. J. Wat. Environ. Tech. 2019, 17, 302–335. [Google Scholar] [CrossRef] [Green Version]
  30. Grebel, J.E.; Pignatello, J.J.; Mitch, W.A. Effect of halide ions and carbonates on organic contaminant degradation by hydroxyl radical-based advanced oxidation processes in saline waters. Environ. Sci. Technol. 2010, 44, 6822–6828. [Google Scholar] [CrossRef]
  31. Haaken, D.; Dittmar, T.; Schmalz, V.; Worch, E. Influence of operating conditions and wastewater-specific parameters on the electrochemical bulk disinfection of biologically treated sewage at boron-doped diamond (BDD) electrodes. Desalin. Water Treat. 2012, 46, 160–167. [Google Scholar] [CrossRef]
  32. Haaken, D.; Dittmar, T.; Schmalz, V.; Worch, E. Disinfection of biologically treated wastewater and prevention of biofouling by UV/electrolysis hybrid technology: Influence factors and limits for domestic wastewater reuse. Water Res. 2014, 52, 20–28. [Google Scholar] [CrossRef]
  33. Kraft, A. Electrochemical water disinfection: A short review. Platinum Metals Review 2008, 52, 177–185. [Google Scholar] [CrossRef]
  34. Kraft, A.; Stadelmann, M.; Blaschke, M.; Kreysig, D.; Sandt, B.; Schröder, F.; Rennau, J. Electrochemical water disinfection: Part I: Hypochlorite production from very dilute chloride solutions. J. Appl. Electrochem. 1999, 29, 859–866. [Google Scholar] [CrossRef]
  35. Buxton, G.V.; Subhani, M.S. Radiation chemistry and photochemistry of oxychlorine ions. Part 2. Photodecomposition of aqueous solutions of hypochlorite ions. J. Chem. Soc. Faraday Trans. 1972, 68, 958. [Google Scholar] [CrossRef]
  36. Asmus, K.D.; Moeckel, H.; Henglein, A. Pulse radiolytic study of the site of hydroxyl radical attack on aliphatic alcohols in aqueous solution. J. Phys. Chem. 1973, 77, 1218–1221. [Google Scholar] [CrossRef]
  37. Abdelraheem, W.H.; Nadagouda, M.N.; Dionysiou, D.D. Solar light-assisted remediation of domestic wastewater by NB-TiO2 nanoparticles for potable reuse. Applied Catalysis B Environ. 2020, 269, 118807. [Google Scholar] [CrossRef]
  38. LfULG, online data base iDA, Saxon State Authority for Environment, Agriculture and Geology. 2020. Available online: https://www.umwelt.sachsen.de/umwelt/infosysteme/ida/ (accessed on 5 August 2020).
  39. Bolton, J.R.; Bircher, K.G.; Tumas, W.; Tolman, C.A. Figures-of-merit for the technical development and application of advanced oxidation technologies for both electric- and solar-driven systems. Pure Appl. Chem. 2001, 2001, 627–637. [Google Scholar] [CrossRef]
  40. Bolton, J.R.; Stefan, M.I. Fundamental photochemical approach to the concepts of fluence (UV dose) and electrical energy efficiency in photochemical degradation reactions. Res. Chem. Intermed. 2002, 28, 857–870. [Google Scholar] [CrossRef]
  41. Monod, A.; Chebbi, A.; Durand-Jolibois, R.; Carlier, P. Oxidation of methanol by hydroxyl radicals in aqueous solution under simulated cloud droplet conditions. Atmos. Environ. 2000, 34, 5283–5294. [Google Scholar] [CrossRef]
  42. Nash, T. Colorimetric determination of formaldehyde under mild conditions. Nature 1952, 170, 976. [Google Scholar] [CrossRef]
  43. Payne, W.A.; Brunning, J.; Mitchell, M.B.; Stief, L.J. Kinetics of the reactions of atomic chlorine with methanol and the hydroxymethyl radical with molecular oxygen at 298 K. Int. J. Chem. Kinet. 1988, 20, 63–74. [Google Scholar] [CrossRef]
  44. Kraft, A.; Blaschke, M.; Kreysig, D.; Sandt, B.; Schröder, F.; Rennau, J. Electrochemical water disinfection. Part II: Hypochlorite production from potable water, chlorine consumption and the problem of calcareous deposits. J. Appl. Electrochem. 1999, 29, 895–902. [Google Scholar] [CrossRef]
  45. Jin, J.; El-Din, M.G.; Bolton, J.R. Assessment of the UV/chlorine process as an advanced oxidation process. Water Res. 2011, 45, 1890–1896. [Google Scholar] [CrossRef] [PubMed]
  46. Paufler, S.; Grischek, T.; Benso, M.; Seidel, N.; Fischer, T. The impact of river discharge and water temperature on manganese release from the riverbed during riverbank filtration: A case study from Dresden, Germany. Water 2018, 10, 1476. [Google Scholar] [CrossRef] [Green Version]
  47. Houk, L.L.; Johnson, S.K.; Feng, J.; Houk, R.S.; Johnson, D.C. Electrochemical incineration of benzoquinone in aqueous media using a quaternary metal oxide electrode in the absence of a soluble supporting electrolyte. J. Appl. Electrochem. 1998, 28, 1167–1177. [Google Scholar] [CrossRef]
  48. Johnson, S.K.; Houk, L.L.; Feng, J.; Houk, R.S.; Johnson, D.C. Electrochemical incineration of 4-chlorophenol and the identification of products and intermediates by mass spectrometry. Environ. Sci. Technol. 1999, 33, 2638–2644. [Google Scholar] [CrossRef]
  49. Wang, D.; Bolton, J.R.; Andrews, S.A.; Hofmann, R. Formation of disinfection by-products in the ultraviolet/chlorine advanced oxidation process. Sci. Total Environ. 2015, 518–519, 49–57. [Google Scholar] [CrossRef]
  50. Yang, X.; Sun, J.; Fu, W.; Shang, C.; Li, Y.; Chen, Y.; Gan, W.; Fang, J. PPCP degradation by UV/chlorine treatment and its impact on DBP formation potential in real waters. Water Res. 2016, 98, 309–318. [Google Scholar] [CrossRef]
  51. Bundesministerium für Justiz und Verbraucherschutz. Verordnung über die Qualität von Wasser für den menschlichen Gebrauch (Trinkwasserverordnung-TrinkwV). 2001. Gesetze im Internet. Available online: https://www.gesetze-im-internet.de/trinkwv_2001/BJNR095910001.html (accessed on 18 November 2020).
  52. European Commission. COUNCIL DIRECTIVE 98/83/EC of 3 November 1998 on the quality of water intended for human consumption. 1998. EUR-lex. Available online: https://eur-lex.europa.eu/legal-content/en/TXT/?uri=CELEX:52017PC0753 (accessed on 18 November 2020).
  53. IS 10500. Drinking Water—Specification; Indian Standard; Bureau of Indian Standards: New Delhi, India, (Second Revision); 2012; Law-resource; Available online: https://law.resource.org/pub/in/bis/S06/is.10500.2012.pdf (accessed on 18 November 2020)Law-resource.
  54. Guidelines for Drinking-Water Quality, 4th ed; World Health Organization: Geneva, Switzerland, Incorporating 1st Addendum; 2017; Available online: https://apps.who.int/iris/bitstream/handle/10665/44584/9789241548151_eng.pdf;jsessionid=592F2A53BA42E1A3A26CABA04706353E?sequence=1ISBN 978-9241549950.
  55. Otter, P.; Malakar, P.; Jana, B.; Grischek, T.; Benz, F.; Goldmaier, A.; Feistel, U.; Jana, J.; Lahiri, S.; Alvarez, J. Arsenic removal from groundwater by solar driven inline-electrolytic induced co-precipitation and filtration—A long term field test conducted in West Bengal. IJERPH 2017, 14, 1167. [Google Scholar] [CrossRef]
Figure 1. Pathway of chloride ions used for radical production (excerpt) in UV/ECl2 process.
Water 12 03275 g001
Figure 2. Lab test setting for performance evaluation of chlorine and radical formation.
Water 12 03275 g002
Figure 3. Pilot system tested with Elbe river water.
Water 12 03275 g003
Figure 4. Relation between current and FAC concentration (n = 9) (Q = 75 L/h, EC = 400 µS/cm, T = 19 ± 1 °C).
Water 12 03275 g004
Figure 5. Relation between chloride concentration and FAC concentrations (n = 9) (Q = 75 L/h, EC = 400 µS/cm, T = 19 ± 1 °C).
Water 12 03275 g005
Figure 6. Relation of chloride concentration (with charge specific FAC production rate and current efficiency (n = 9) (Q = 75 L/h, EC = 400 µS/cm, T = 19 ± 1 °C).
Water 12 03275 g006
Figure 7. Chlorine consumption by UV treatment in dependence of FAC (Q = 75 L/h, EC = 400 µS/cm, T = 19 ± 1 °C).
Water 12 03275 g007
Figure 8. Radical formation in dependence of FAC demand at different pH (Q = 75 L/h, EC = 400 µS/L, T = 19 ± 1 °C) (n = 26).
Water 12 03275 g008
Figure 9. FAC and total chlorine concentrations measured in three different settings during field tests with Elbe river water.
Water 12 03275 g009
Figure 10. Concentrations of tested TOrCs (a,b) and degradation percentages (c,d) concentrations measured in three different settings during field tests with Elbe river water.
Water 12 03275 g010
Figure 11. DOC concentrations measured in three different settings during field tests with Elbe river water.
Water 12 03275 g011
Figure 12. THM concentrations measured in three different settings during field tests with Elbe river water.
Water 12 03275 g012
Figure 13. EEOs for gabapentin and oxipurinol (a) and 4-methylbenzotriazole, 5-methylbenzotriazole iomeprol and benzotriazole (b) calculated from three different settings during field tests with Elbe river water.
Water 12 03275 g013
Table 1. Test matrix and energy requirements for the different field test settings of UV/ECl2.
PumpECl2UVECl2/UV
Test SettingFlow Rate (L/h)Energy Input (kWh/m3)Linear Flow Velocity (m/h)Current (A)Voltage (V)Current Density (mA/cm2)Energy Input
(kWh/m3)
No. of UV LampsEnergy Input (kWh/m3)Total Energy Input (kWh/m3)
A1000.074287.18.40.5700.000.64
10.360.99
20.721.35
B1000.0742129.512.61.1400.001.21
20.721.93
C3000.201261211.712.60.4700.000.67
10.120.79
20.240.91
Table 2. Analyzed TOrCs concentrations of UF Filtrate and relevant water quality parameters.
ParameterInitial Concentrations/ValuesDescription
TOrC1st and 2nd trial
Benzotriazole (ng/L) CAS 95-14-7410 and 440Corrosion inhibitor
4-Methylbenzotriazole (ng/L) CAS 29878-31-7190 and 170Benzotriazole derivative used as a corrosion inhibitor
5-Methylbenzotriazole (ng/L) CAS 136-85-682 and 80Antifreeze agent, corrosion inhibitor
Gabapentin (ng/L) CAS 60142-96-3230 and 250Anticonvulsant (Antiepileptic)
Iomeprol (ng/L) CAS 78649-41-9380 and 520X-ray contrast media
Oxipurinol (ng/L) CAS 2465-59-0850 and 930Active metabolite of Allopurinol (uricostatic)
Standard water quality parameters
pH8.1 and 7.9
Temperature (°C)18 and 25
DOC (mg/L)5.5 and 6.7
Nitrate (mg/L NO3) *13 ± 2.7
Nitrite (mg/L NO2)*0.043 ± 0.02
Ammonium (mg/L NH4) *0.082 ± 0.07
Total Hardness (mg/L CaCO3)67.5 ± 3.8
Chloride (mg/L)22.6 ± 3.7
* Elbe river data derived from [38] and calculated by authors.
Table 3. Selected guideline values concerning the formation of THMs during drinking water disinfection.
ParameterGermany [51]EU [52]India [53]WHO [54]
THM (µg/L)10 a/50 b100-
Bromoform (µg/L) 100100
Dibromochloromethane (µg/L) 100100
Bromodichloromethane (µg/L) 6060
Chloroform (µg/L) 200300
a At the end of treatment, b Point of use.
Publisher’s Note: MDPI stays neutral with regard to jurisdictional claims in published maps and institutional affiliations.