Article

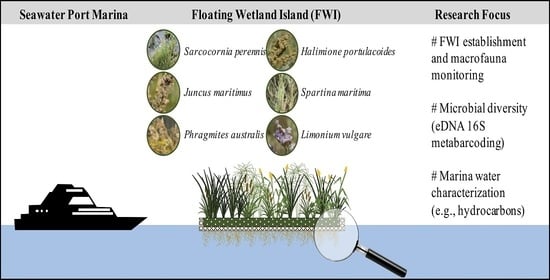
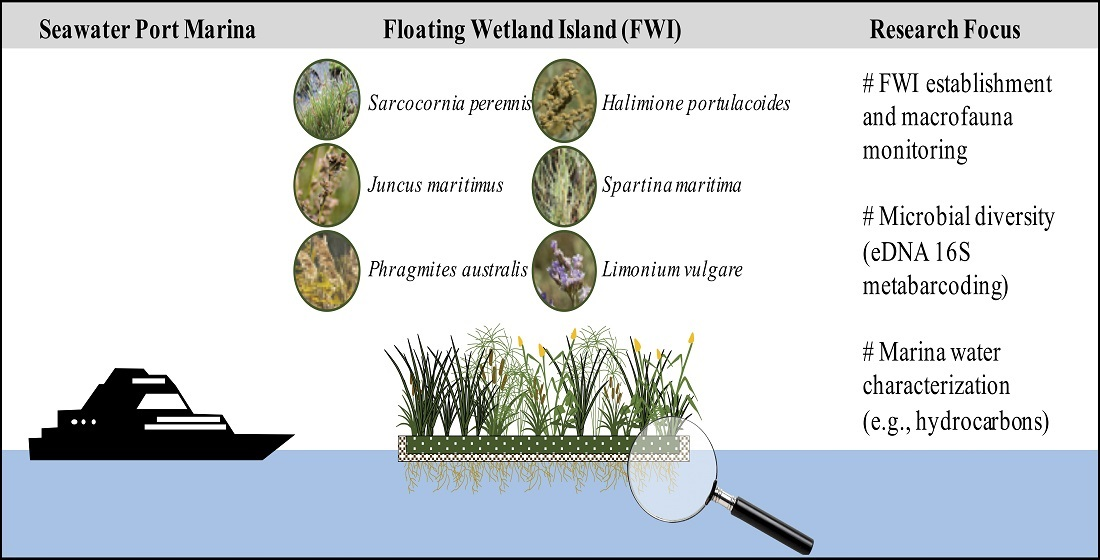
Floating Wetland Islands Implementation and Biodiversity Assessment in a Port Marina

by
Cristina S. C. Calheiros
1,*,†,
João Carecho
1,2,†,
Maria P. Tomasino
1,
C. Marisa R. Almeida
1,2 and
Ana P. Mucha
1,2
1
Interdisciplinary Centre of Marine and Environmental Research (CIIMAR/CIMAR), University of Porto, Novo Edifício do Terminal de Cruzeiros do Porto de Leixões, Avenida General Norton de Matos, S/N, 4450-208 Matosinhos, Portugal
2
Faculty of Sciences, University of Porto, Praça de Gomes Teixeira, 4099-002 Porto, Portugal
*
Author to whom correspondence should be addressed.
These authors contributed equally to this manuscript.
Water 2020, 12(11), 3273; https://doi.org/10.3390/w12113273
Submission received: 27 October 2020 / Revised: 16 November 2020 / Accepted: 18 November 2020 / Published: 21 November 2020
(This article belongs to the Special Issue Water Management: New Paradigms for Water Treatment and Reuse)

Abstract

:
Floating wetland islands (FWI) are considered nature-based solutions with great potential to promote several ecosystem services, such as biodiversity and water quality enhancement through phytoremediation processes. To our knowledge, the present work is the first to scientifically document the in-situ establishment of an FWI in a seawater port marina. The establishment and performance of a cork floating platform with a polyculture (Sarcocornia perennis, Juncus maritimus, Phragmites australis, Halimione portulacoides, Spartina maritima, Limonium vulgare) was evaluated. The diversity of organisms present in the FWI was undertaken based on the macrofauna assessment, taking into consideration marine water characterization, with a focus on hydrocarbons. Microbial communities were assessed based on metabarcoding approach to study 16S rRNA gene from environmental DNA retrieved from biofilm (from the planting media), marine biofouling (from the submerged platform) and surface marina water. S. perennis was the species with the highest survival rate and growth. The structure of the microbial community showed clear differences between those established in the FWI and those in the surrounding water, showing the presence of some bacterial groups that can be relevant for bioremediation processes (e.g., Saprospiraceae family). Concerning the macrofauna analysis, Mytilus sp. was the predominant taxa. To be of relevance, total petroleum hydrocarbons were detected at the marina up to ca. 6 mg/L. This study gives new insights into broadening FWI application to the saline environments of port marinas and to supporting a management strategy to promote several ecosystem services such biodiversity, species habitat, water quality enhancement and added aesthetic value to the marina landscape.

Graphical Abstract

1. Introduction

Coastal zones—such as those in Europe, Asia, Australia, and USA—are suffering urban expansion to an extent that more than 50% of the shoreline is transformed by engineering. Effects of the marine urbanization in relation to regional ecological consequences, connectivity changes, and water quality still lack comprehensive understanding. Marinas and harbors or ports are among the man-made structures that support maritime activities [1]. These sites may be characterized based on their location, structure, capacity, hydrology, and associated activities. Consequently, different anthropogenic pressures occur such as diesel spills during vessel refueling, hydrocarbon pollution from boat traffic, runoff from boat maintenance activities (cleaning and reparation operations) [2], etc. Several pollutants can thus be found, namely metals, biocides, and hydrocarbons [2,3]. The presence of pollutants within harbors and marinas affects the composition and function of microbial communities in water and sediments [2], as well as the macrofauna [4]. These artificial structures have an impact on the original environmental conditions and also in the faunal communities [5].
Efficient water management in marinas, to face the increase of maritime traffic and its consequences, is urgently needed. Moreover, there is a great need to find solutions for port marinas that promote water quality enhancement and biodiversity. Nature-based solutions (NBS) may contribute to this purpose because they are “inspired and supported by nature and use, or mimic, natural processes to contribute to the improved management of water. An NBS can involve conserving or rehabilitating natural ecosystems and/or the enhancement or creation of natural processes in modified or artificial ecosystems” [6]. Floating wetland islands (FWI) are examples of NBS that comprise the establishment of emergent vegetation in a floating platform that is applied to the surface of a water body. They intend to mimic the processes that occur in natural wetland systems but with plants being grown in hydroponic mode instead of being supported in a solid substrate [7]. Depending on the purpose of their implementation, several aspects must be taken into consideration such its functionality, durability, anchoring system, weight, buoyancy, and adequate plant species selection. To our knowledge, the inclusion of NBS, such as FWI, has not been explored deeply in the context of port marinas. This statement is supported by several recent reviews [7,8,9,10,11,12] mentioning FWI applications to a variety of non-saline water bodies such as rivers, ponds, lakes, reservoirs, and different types of wastewaters, and some saline aquaculture facilities. The main target pollutants in these studies were nitrogen, phosphorus, and organic matter. Some potential for the removal of metals and other pollutants (e.g., pesticide, herbicides) was also shown. Although, with no detailed results reported, small-scale floating wetlands have been installed in the Baltimore harbor in the past, with the intention to further amplify the investment in this technology [13]. Also, Sanicola et al. [14] carried out a mesocosms trial to identify which of the plant species would be most suitable for use in an FWI to treat stormwater runoff in a saline canal from a residential area, suggesting the use of Phragmites australis and Sarcocornia quinqueflora plants for nitrogen reduction, and the use of Isolepis nodosa and Baumea juncea plants for phosphorus reduction. The possible application of FWI in seawater marina to support a strategy of biodiversity promotion as well as water quality enhancement requires a proper selection and establishment of the plant species and structural resilience of the platform in this harsh environment, where salinity, tidal influence, and waves have to be considered.
The present research aimed to investigate the establishment of an FWI, made of cork agglomerate, in a seawater marina integrated in a commercial seaport. Specific objectives comprised performance evaluation of the FWI in terms of:
(i)
resistance of the platform to the environmental conditions (salinity, tides, and waves);
(ii)
vegetation establishment and development;
(iii)
biotic (micro and macro) communities’ identification and establishment.
To support this approach, the water body of the seawater port marina under study was characterized in terms of physicochemical parameters such organic matter, nutrients, and hydrocarbon contents, as well as water microbial diversity.

2. Materials and Methods
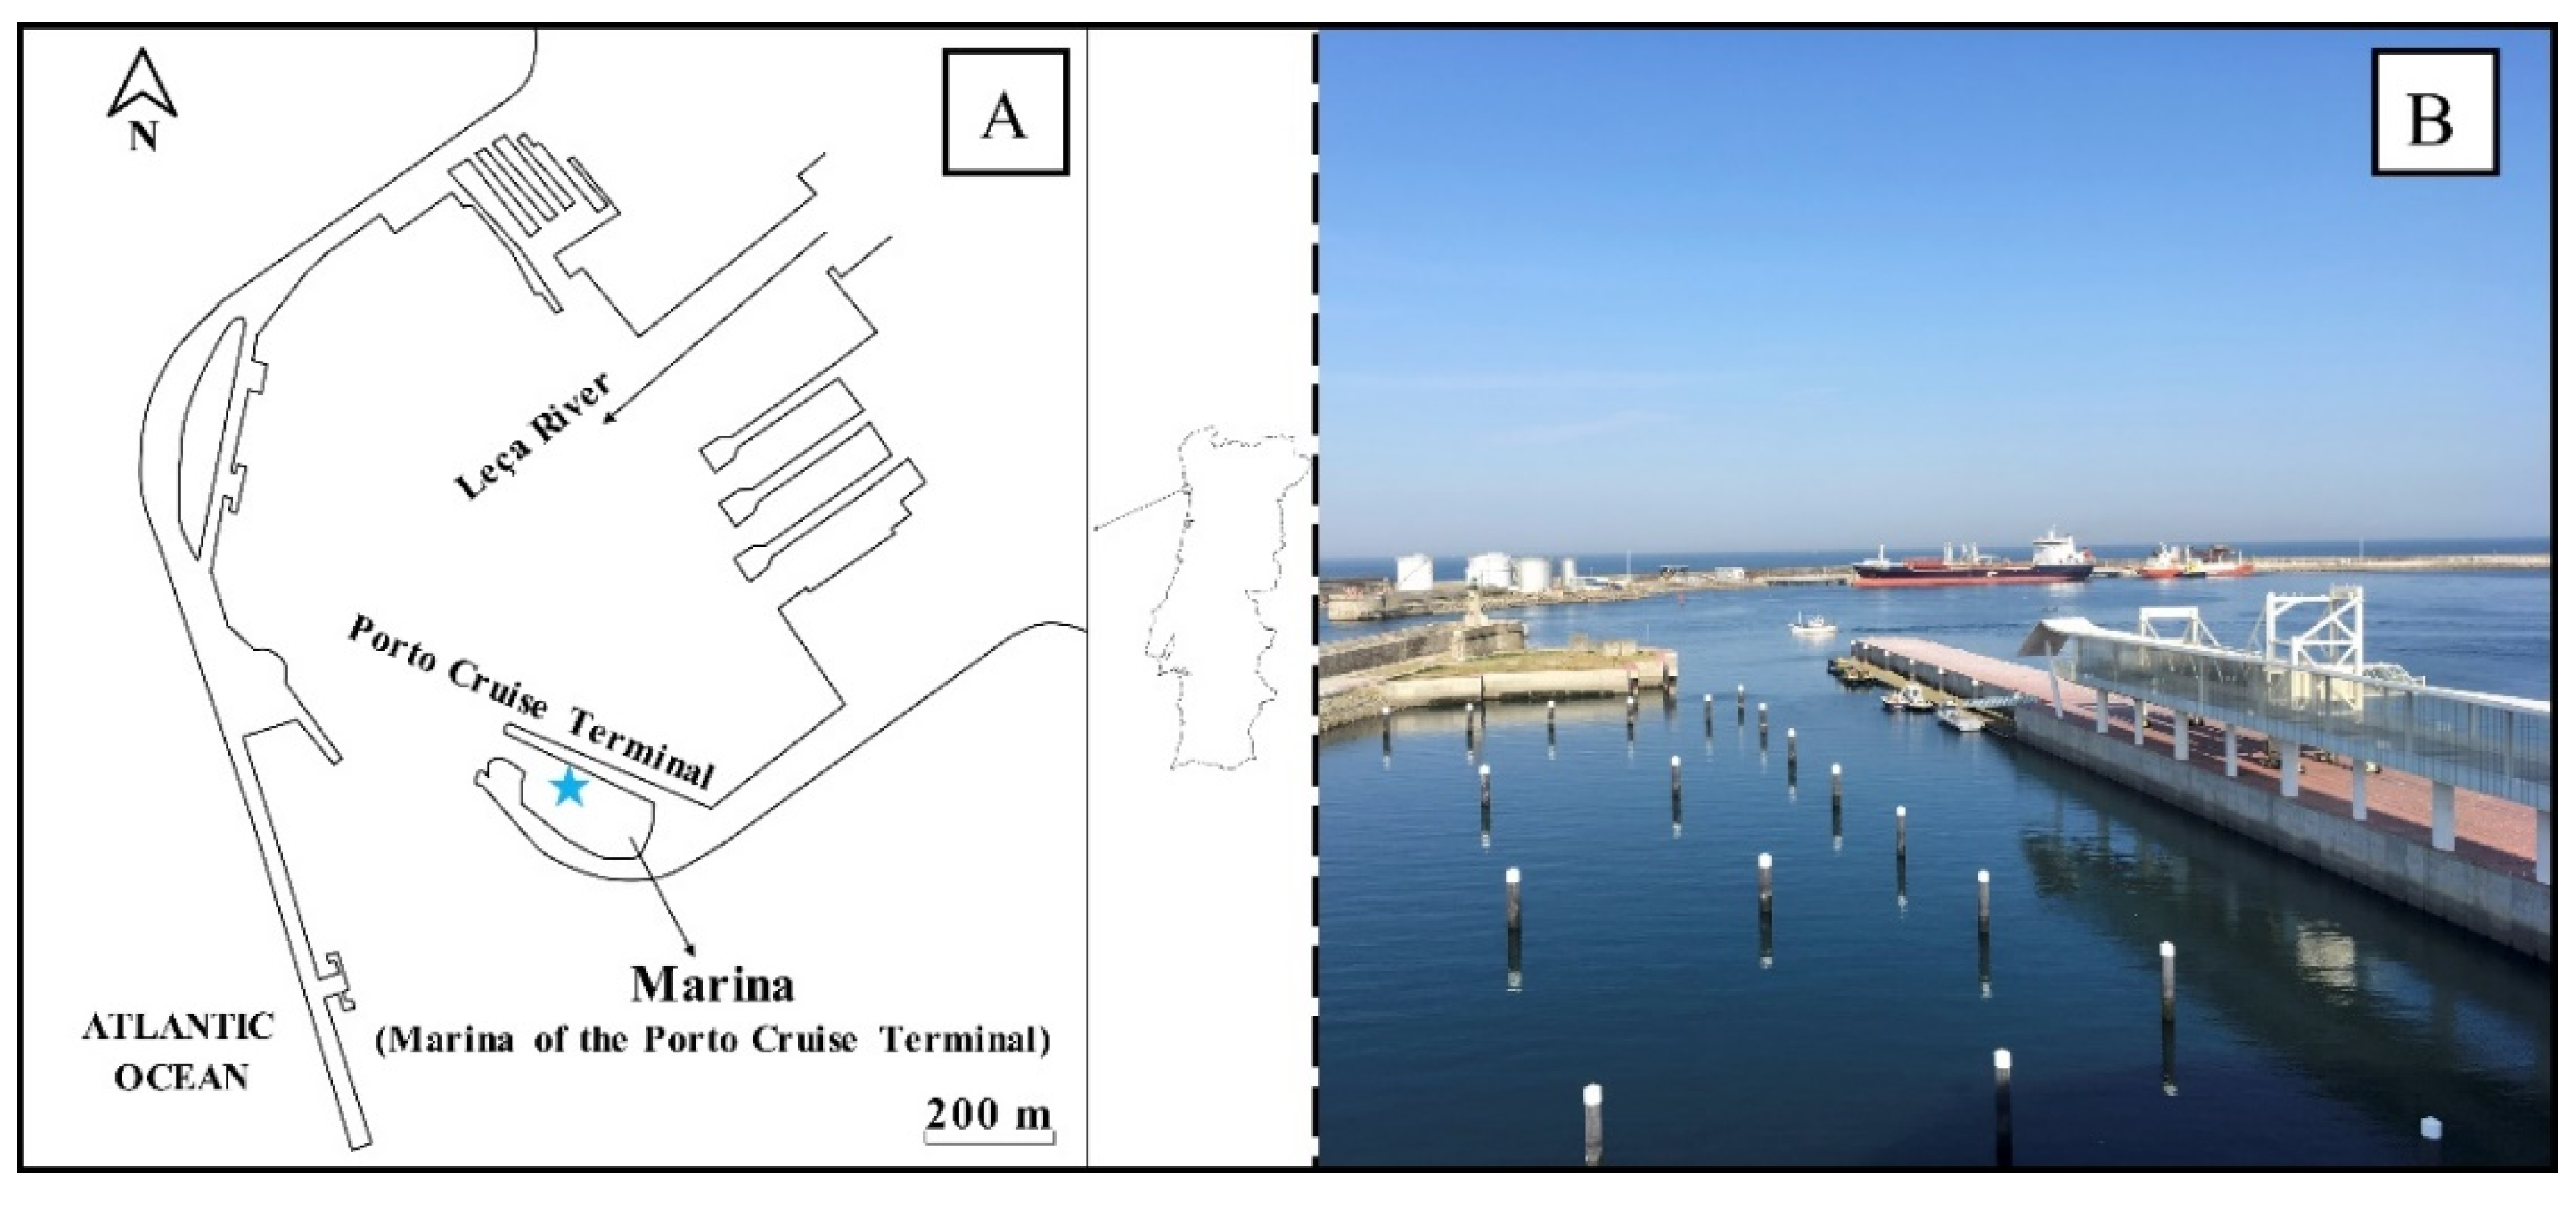
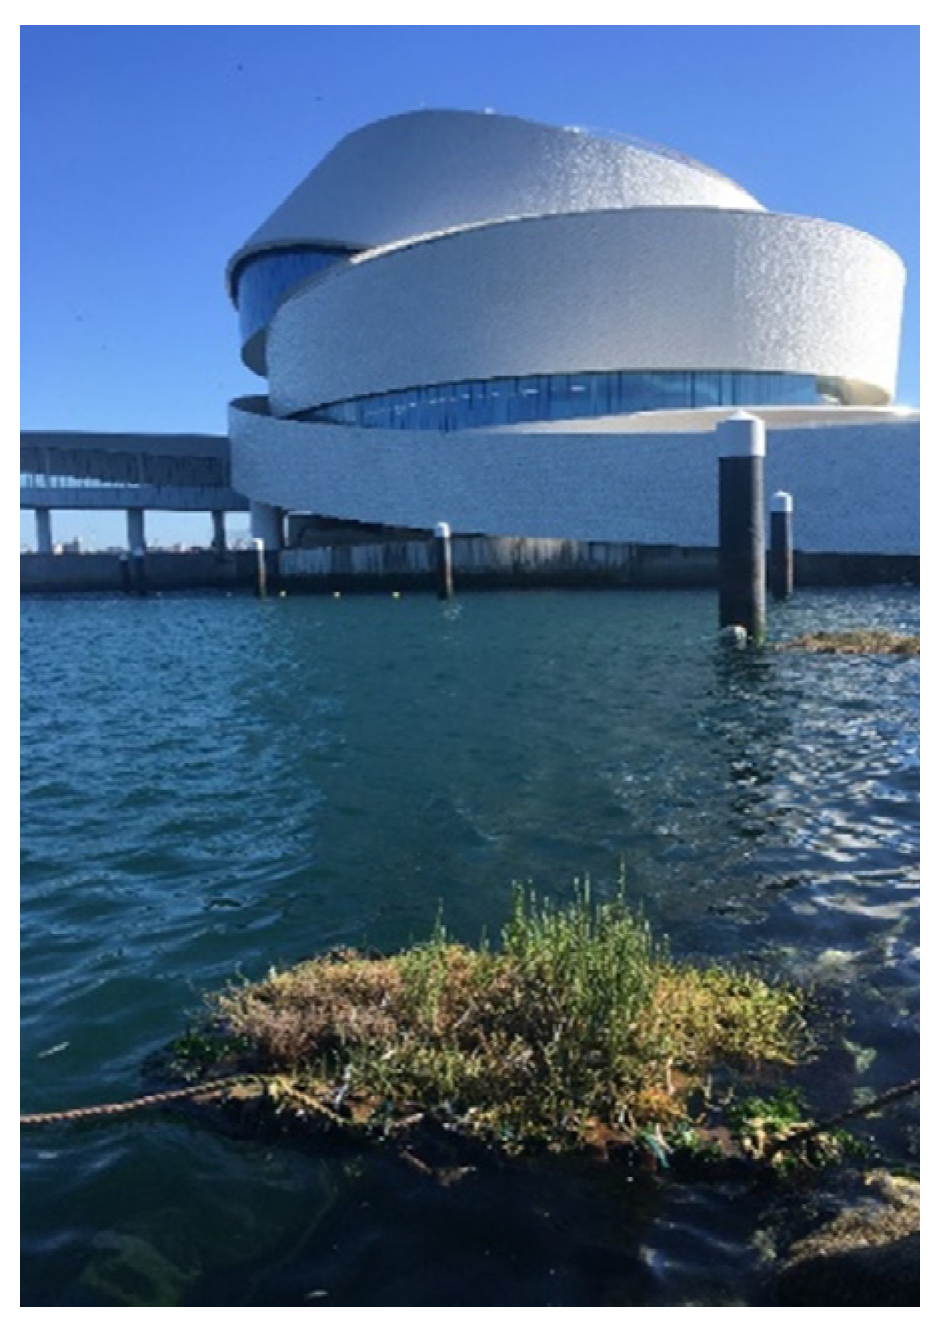
2.1. Study Area

An FWI was set up next to the pier of the Marina of the Porto Cruise Terminal in Matosinhos (41°10′41.13″ N; 8°42′13.99″ W), the largest seaport in NW Portugal (APDL-Administração dos Portos do Douro e Leixões SA). This marina is situated in the south jetty, between the Porto Cruise Terminal and the outer pontoon of the Leixões Port and has a surface water area of 2 ha (Figure 1). The marina is positioned at the port entrance, being influenced by the traffic of cargo ships, fishing boats, and cruise ships that pass by near the respective section in the port. Moreover, cruise ships parked on the other side of the pier where the FWI was implemented. During the experiment, 91 cruise ships parked at the Porto Cruise Terminal (according to APDL: http://www.apdl.pt/cruzeiros/previsaochegada.jsp?lang.pt). The area of the Marina is also influenced by tides from the Atlantic Ocean and by the river mouth (Leça river) that flows through the Port.

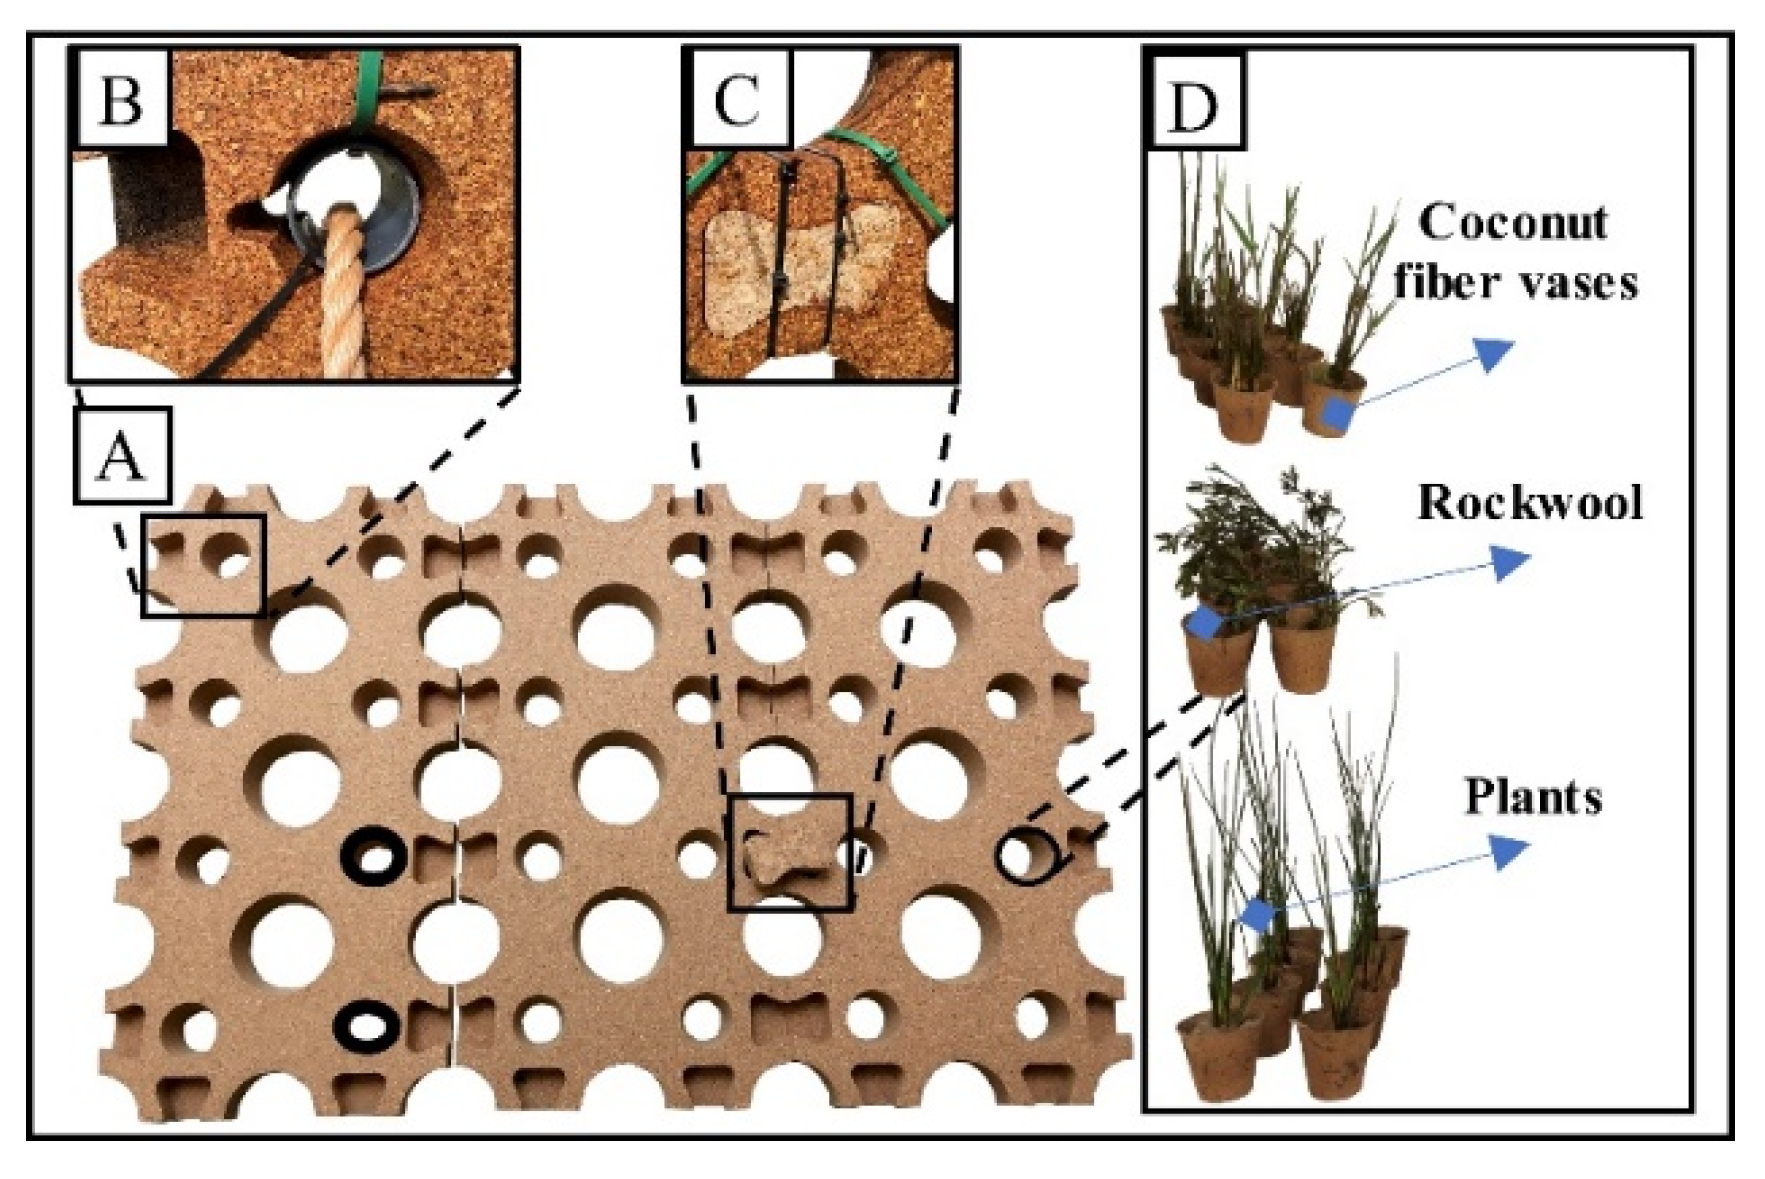
2.2. FWI Implementation and Maintenance

The pilot FWI was implemented on February 2018 and was under study for 16 months. The FWI system had three modules which were interconnected (Figure 2A). Each module (Cork Floating Island®, Supplier: Bluemater, S.A., Porto, Portugal) had the following technical characteristics: cork agglomerate (density of 0.2), frustoconical holes of two different sizes (8 cm and 16 cm diameter for the small and the larger types, respectively), size of 100 × 50 × 10 cm (l × w × h), capacity to support until 16 kg/m2 of plants and up to 24 plants/m2, according to the manufacturer [15].
The anchoring system was composed of two cables, each with a weight attached at the end, passed through a hole located in a corner of each side of the floating platform and tied to a metal structure on the top of the wall, allowing the FWI to accompany the tidal level fluctuations. Adjustable plastic clamps were used to reinforce the joints between the modules and between the holes and the vases (Figure 2B,C). Plant species selected (see Section 2.3) were placed in coconut fiber vase, filled with rockwool (Figure 2D). Vases were afterwards inserted into the holes of the platform in a random distribution of the plant species.
During the implementation, each hole held the same planting density (eight seedlings of the same size for each species tested). All the holes were enumerated for further monitoring.
Maintenance aimed to minimize human intervention, with minimum interference. Therefore, only a surface cleaning of detritus, mainly plastics, accumulated in the platform was periodically made.

2.3. Plant Selection, Planting, and Monitoring

For the process of plant selection, the following criteria, were used: (1) native to Portugal; (2) potential to survive in hydroponic mode with tolerance to variable salinity levels; (3) presence in the region of the experimental site; (4) perennial species and (5) possibility to form a polyculture.
Overall, six halophyte plants were selected: Juncus maritimus, Halimione portulacoides, Phragmites australis, Sarcocornia perennis, Limonium vulgare, and Spartina maritima. All plants were collected in the region nearby the marina, being watered with seawater during 24 h prior to their implementation in the FWI.
To monitor the health status of plants, an in-situ and non-destructive method was used to measure the chlorophyll fluorescence, based on pulse-amplitude modulated (PAM) measurements. Measurements were performed in four different plants of S. perennis, (three records for the same predefined plant) during July and September of 2018 and February and April of 2019 survey. Briefly, plants were placed in dark conditions for 25 min (covered by an opaque black cloth), after which a PAM chlorophyll fluorometry (Junior PAM-Heinz Walz GmbH, Germany), fitted with a 1.5 mm light guide plastic fiber and a blue led (445 nm) light source, was applied to the plant green tissues. The measurements were performed following the manufacturer’s instructions, using the standard default settings for rapid light curve (RLC) determination. The basic fluorescence yield (Fo) value was recorded after applying a modulated light that was sufficiently low (<0.1 μmol/m2·s) and the maximal fluorescence yield (Fm) was measured by applying a strong light pulse of 10,000 μmol/m2·s for 0.8 s. The parameters attained were automatically calculated by the WinControl-3 software (version 3.29; Walz) to quantify the characteristic parameters: maximum electron transport rate (ETRm) that reflects the photosynthetic capacity at light saturation conditions [16]; quantum efficiency of photosynthesis (α) that estimates the efficiency of light-harvesting complexes [17] and the Fv/Fm ratio that is defined as the maximum photochemical quantum yield of photosystem II if all the available reaction centers were open (lower values are associated with fewer open reaction centers available) [18].
During the experimental time, evaluation of the apparent health status of all the plants species was also visually performed, registering plant survival. The survival rate associated to each plant species, by the end of the experiment, was calculated as follows (Equation (1)):
S u r v i v a l   r a t e   ( % ) = N u m b e r   o f   h o l e s   w i t h   a l i v e   p l a n t s   N u m b e r   o f   t o t a l   p l a n t e d   h o l e s   ×   100
It was considered that a plant died when the whole aerial parts turned brown or the whole plant started to slowly decompose after two months of persistent status.
Visual observations of the macrofauna present in the FWI system were performed and registered along the experimental time.

2.4. Water Sampling Procedure and Physicochemical Analysis

Although the setup of the FWI was in February 2018, an acclimation period of two months was considered, and sampling started in April 2018, ending in May 2019. Sampling survey occurred monthly, in the last days of each month. In October 2018, a new plantation was carried out to reinforce the existing plants. Therefore, no sampling was undertaken in that month nor on the following two (November and December 2018), considering this time period as an acclimation period for the plants.
Physicochemical parameters of the surface marina water (temperature, salinity, pH, and conductivity) were measured near the FWI, using a portable multi-parameter (MU 6100 L pHenomenal®, VWR). Air temperature and relative humidity were recorded with an OH503 logger (Greutor), and weather conditions were registered in every campaign.
Surface marina water samples (considered the first 20 cm below the water surface) were collected for further analysis. For nutrient determination (ammonia, nitrite, and phosphate ions) samples were filtrated through a WhatmanTM glass microfiber filter with a 1.2 μm pore size (GE Healthcare Life Sciences, UK) and analyzed following published optimized methodologies [19]. Nitrate ion was quantified by an adaptation of the spongy cadmium reduction technique [20]. Chemical oxygen demand (COD), used to estimate the amount of organic matter, was measured using Kits HI93754A-25 and HI93754B-25, LR: 0–150 mg/L and MR: 0–1500 mg/L, respectively, from Hanna Instruments (Limena, Italy). Total petroleum hydrocarbons (TPHs) and polycyclic aromatic hydrocarbons (PAHs) were determined according to previously optimized methods [21,22]. Selected PAHs were those considered by the United States Environmental Protection Agency as priority pollutants [23]: naphthalene (Nap), acenaphthylene (Acy), acenaphthene (Ace), fluorene (Fle), phenanthrene (Phe), anthracene (Ant), fluoranthene (Fla), pyrene (Pyr), benz[a]anthracene (BaA), chrysene (Chr), benz[b]fluoranthene (BbF), benz[k]fluoranthene (BkF), benz[a]pyrene (BaP), benz[g.h.i]perylene (BghiP), indeno[1.2.3-cd]pyrene (InP), and dibenz[a.h]anthracene (DahA).

2.5. Microbial Communities Sampling and Monitoring

2.5.1. Sampling Procedure

Samples from different matrices were collected in three seasons (summer 2018, winter and spring 2019), to access the microbial communities present in: (1) biofilm from the planting media; (2) marine biofouling from the submerged floating platform; and (3) surface marina seawater.
Biofilm from the planting media (mainly rockwool), around plant roots, was collected with sterilized forceps from each plant species. Marine biofouling developed in the floating platform (non-planted holes and under surface) was collected by scratching the surface with a sterilized bistoury blade. For each matrix (biofouling and biofilm) four subsamples (from the planting media and floating platform) were pooled together to form a composite sample. Surface marina seawater sample was additionally collected in a 5 L plastic bottle for microbial diversity assessment. Once in the laboratory, samples of biofilm and biofouling were preserved at −80 °C for DNA extraction. The 5 L of collected seawater were filtered through two SterivexTM (SVGV010RS, Merck Millipore, Portugal) filter with a 0.22 μm pore size with the assistance of a peristaltic pump; the two replicate filters per sample were sealed and stored at −80 °C for later environmental DNA extraction.

2.5.2. DNA Extraction, Quantification, and Sequencing

Environmental DNA (eDNA) was extracted from the FWI samples (biofilm from the planting media and biofouling from the floating platform) using the DNeasy PowerSoil Kit (Qiagen, Hilden, Germany) and from water samples (Sterivex filters) using the DNeasy PowerWater Sterivex Kit (Qiagen, Hilden, Germany) according to the manufacturer’s instructions. Concentration and quality of eDNA were measured by fluorometry using the Qubit fluorometric quantitation kit (Qubit dsDNA High Sensibility Assay Kit, Thermo Fisher Scientific Inc., Waltham, MA, USA). The extracted eDNA was then used for 16S rRNA gene sequencing and metabarcoding analysis targeting prokaryotic communities. The sequencing method includes the amplification of the 16S rRNA gene fragment (hypervariable V4–V5 region; ≈412 bp) using the forward primer 515YF (5′-GTGYCAGCMGCCGCGGTAA-3′) and reverse primer Y926R (5′- CCGYCAATTYMTTTRAGTTT-3′) [24] and the paired-end sequencing was carried out by an Illumina MiSeq® platform with the V3 chemistry, according to manufacturer’s instructions (Illumina, Inc., San Diego, CA, United States) at Genoinseq facilities (Cantanhede, Portugal). Raw reads were extracted from Illumina MiSeq® System in fastq format and quality-filtered with PRINSEQ version 0.20.4 [25] to remove sequencing adapters, reads with less than 100 bases and trim bases with an average quality lower than Q25 in a window of five bases. The forward and reverse reads were merged by overlapping paired-end reads with Adapter Removal version 2.1.5 [26] using default parameters.

2.5.3. Bioinformatics Analysis

Merged reads were further uploaded and processed by the automatic pipeline SILVAngs (Silva Next Generation Sequencing, https://ngs.arb-silva.de/silvangs/) of the SILVA rRNA gene database project (SILVAngs 1.3) for the taxonomic classification [27] using default settings. Specifically, each read was aligned using the SILVA Incremental Aligner (SINA v1.2.10 for ARB SVN (revision 21008)) against the SILVA SSU rRNA SEED and quality checked using pipeline′s default setting. After quality control steps, reads were dereplicated and clustered at 98% of similarity to generate operational taxonomic units (OTUs); the classification was done against SILVA SSU Ref dataset release 132 using blastn (2.2.30+; http://blast.ncbi.nlm.nih.gov/Blast.cgi) with standard settings [28]. Reads without any BLAST hits or reads with weak BLAST hits, remained unclassified and were labeled as ‘no relative’. Protocol detailed description is given in Bragança et al. [29].
Abundance tables at different taxonomic levels: higher (phylum) and lower level (genus) have been produced to show the relative abundance of each taxonomic group within each sample (the total number of sequences assigned to each taxonomic path). Undesirable lineages, ‘chloroplast’, ‘mitochondria’, and ‘eukaryota’ were excluded from the dataset.

2.6. Statistical Analyses

The statistical analysis was performed using PAST software (version 3.24; https://folk.uio.no/ohammer/past/) to analyze data at a 95% confidence level and significance between treatments was considered as statistically significant if the p-value <0.05. All the data subjected to statistical analyses were examined with Shapiro–Wilk test to confirm the existence of normal distribution and an evaluation of the homogeneity of variance assumption was performed by applying Levene’s test. When data presented normal distribution, a one-way analysis of variance (ANOVA) was performed and when statistically significant differences for ANOVA were found, a Tukey post-hoc test was executed. All data were expressed as mean ± standard deviation (SD). The alphabet letters labeled over the values represent the statistically significant/non-significant differences between or within treatments.

3. Results and Discussion

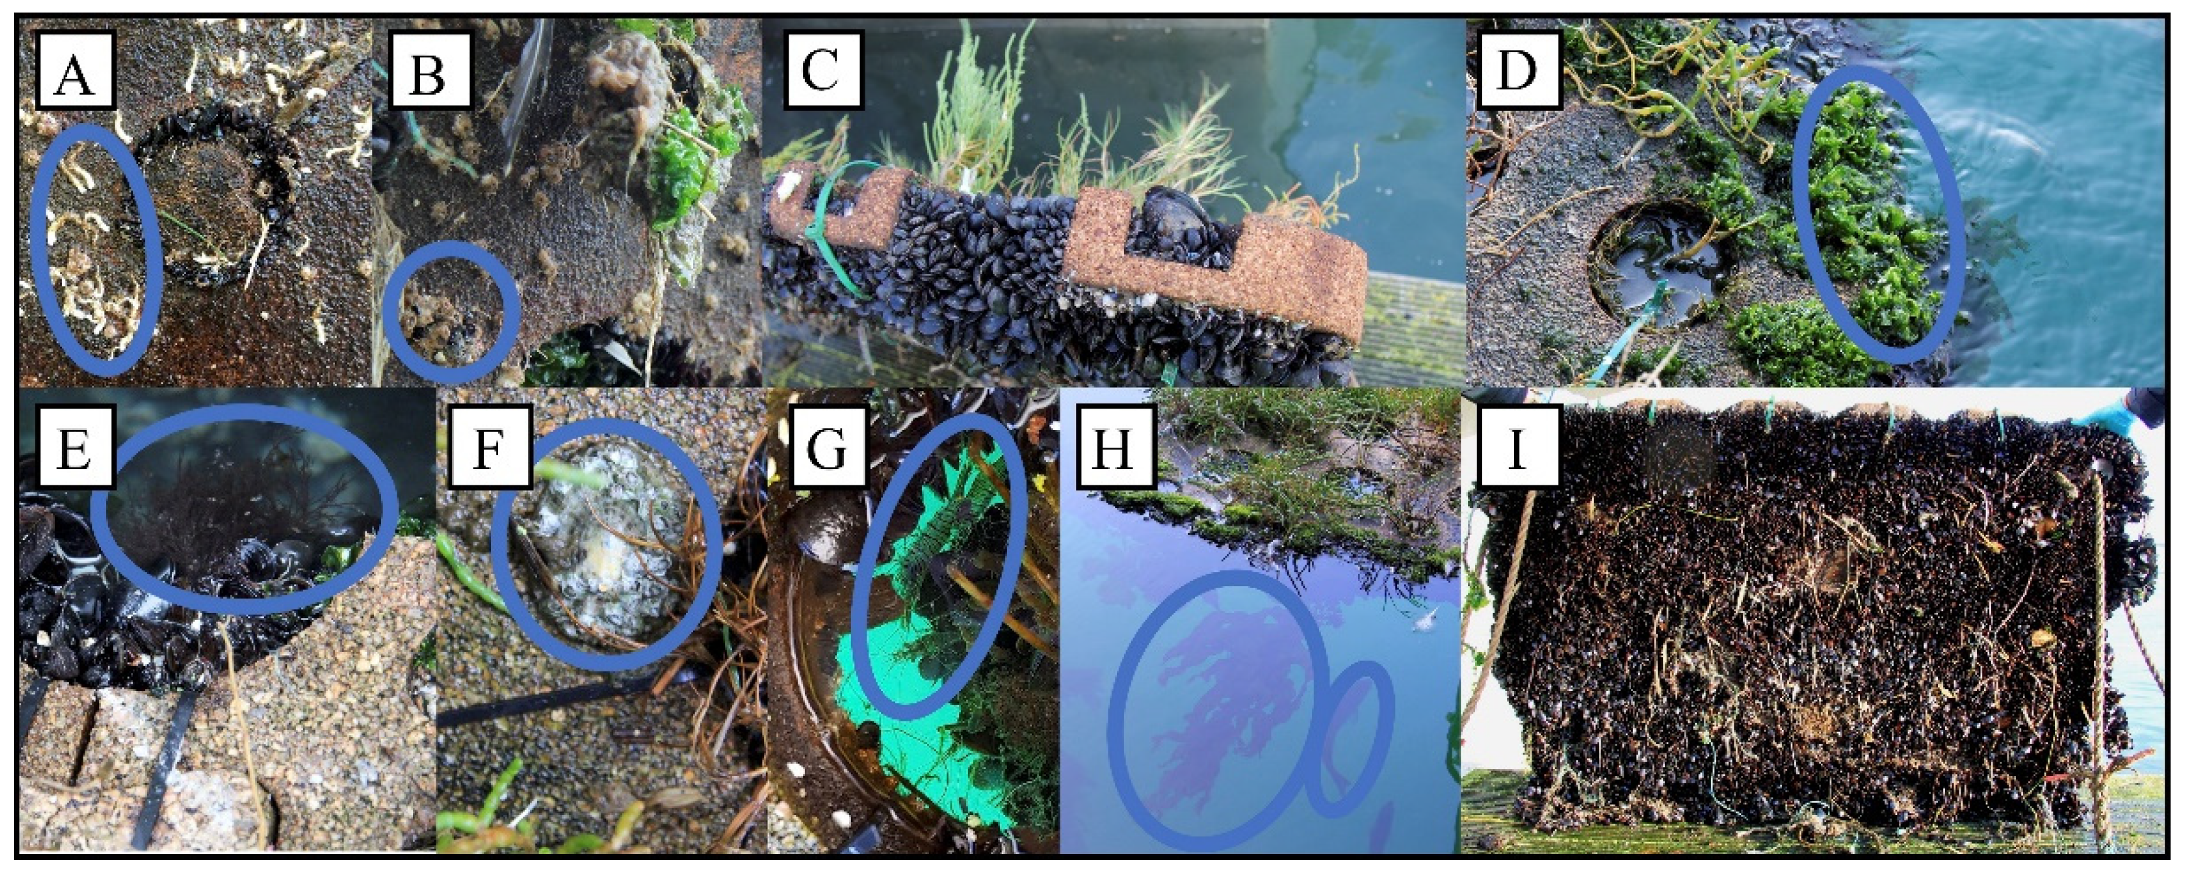
3.1. FWI Establishment and Macrofauna Monitoring

The FWI platform chosen for this study was made of cork, a natural material, with a negative carbon footprint considering that the cork sector is a net carbon sink, since along the entire life cycle more carbon is sequestered than emitted, having thus the potential to mitigate climate change [30]. This FWI preserved its structural integrity, along the studied period, when subject to the dynamics of the seawater port marina, facing various storms, tides, waves, currents, and other abiotic deteriorating factors such as salinity and direct sunlight (Figure 3).
Over time, successive colonization was observed on the floating platform by marine macrofauna (Figure 4). Initially, the first organisms colonizing the FWI (under surface) were members from the Polychaeta class and Chthamalus genus. At the end of this study, the floating platform was covered mainly by Mytilus sp. (under surface and holes) and by a variety of macroalgaes (on the boundaries and holes). The high proliferation of Mytilus sp. under FWI surface increased the weight of the platform and prevented the roots to develop through the water column. However, plant development did not seem to be affected since the planting media remained wet and they continued to develop. In the future, this may constitute a problem if the accumulated weight compromises the island′s buoyancy. In a similar application at Baltimore Inner Harbor, the same issue related to biofouling in an FWI was reported by Mccarty et al. [13].
The upper surface of the platform was, in general, dry (with exception of periodic flooding due to waves from the tides), receiving total light exposure, which may explain the lower colonization. However, over time, with the FWI sinking partially (due to the overall weight of the platform), this part received more water and organisms such as Ectocarpus sp. and Ulva sp. installed in a major proportion in that area. This was registered after 12 months of FWI implementation. Considering mobile organisms, Palaemon sp. was observed actively interacting with the detritus present in the non-planted holes and Mugil sp. was observed in the water body pecking below the FWI platform and in the surrounding water, possibly for feeding interest. In the same port where the FWI were set, Azevedo et al. [31] carried out a study focusing on the biofouling diversity development on stainless steel plates using a combined morphological and metabarcoding approach. They have identified several common colonizers similar to the ones found in the FWI, such as mussels, barnacles, and macroalgae. Other authors also mentioned the presence of several organisms in FWI implemented in freshwater ecosystems [32,33]. The biodiversity increment observed in the present study might be advantageous because some of these organisms, such as Ulva genus members, have the capacity to remove several pollutants [34], and mussels are ecosystem engineers, with capacity to form biodiversity enhancing reef-like structures [35].

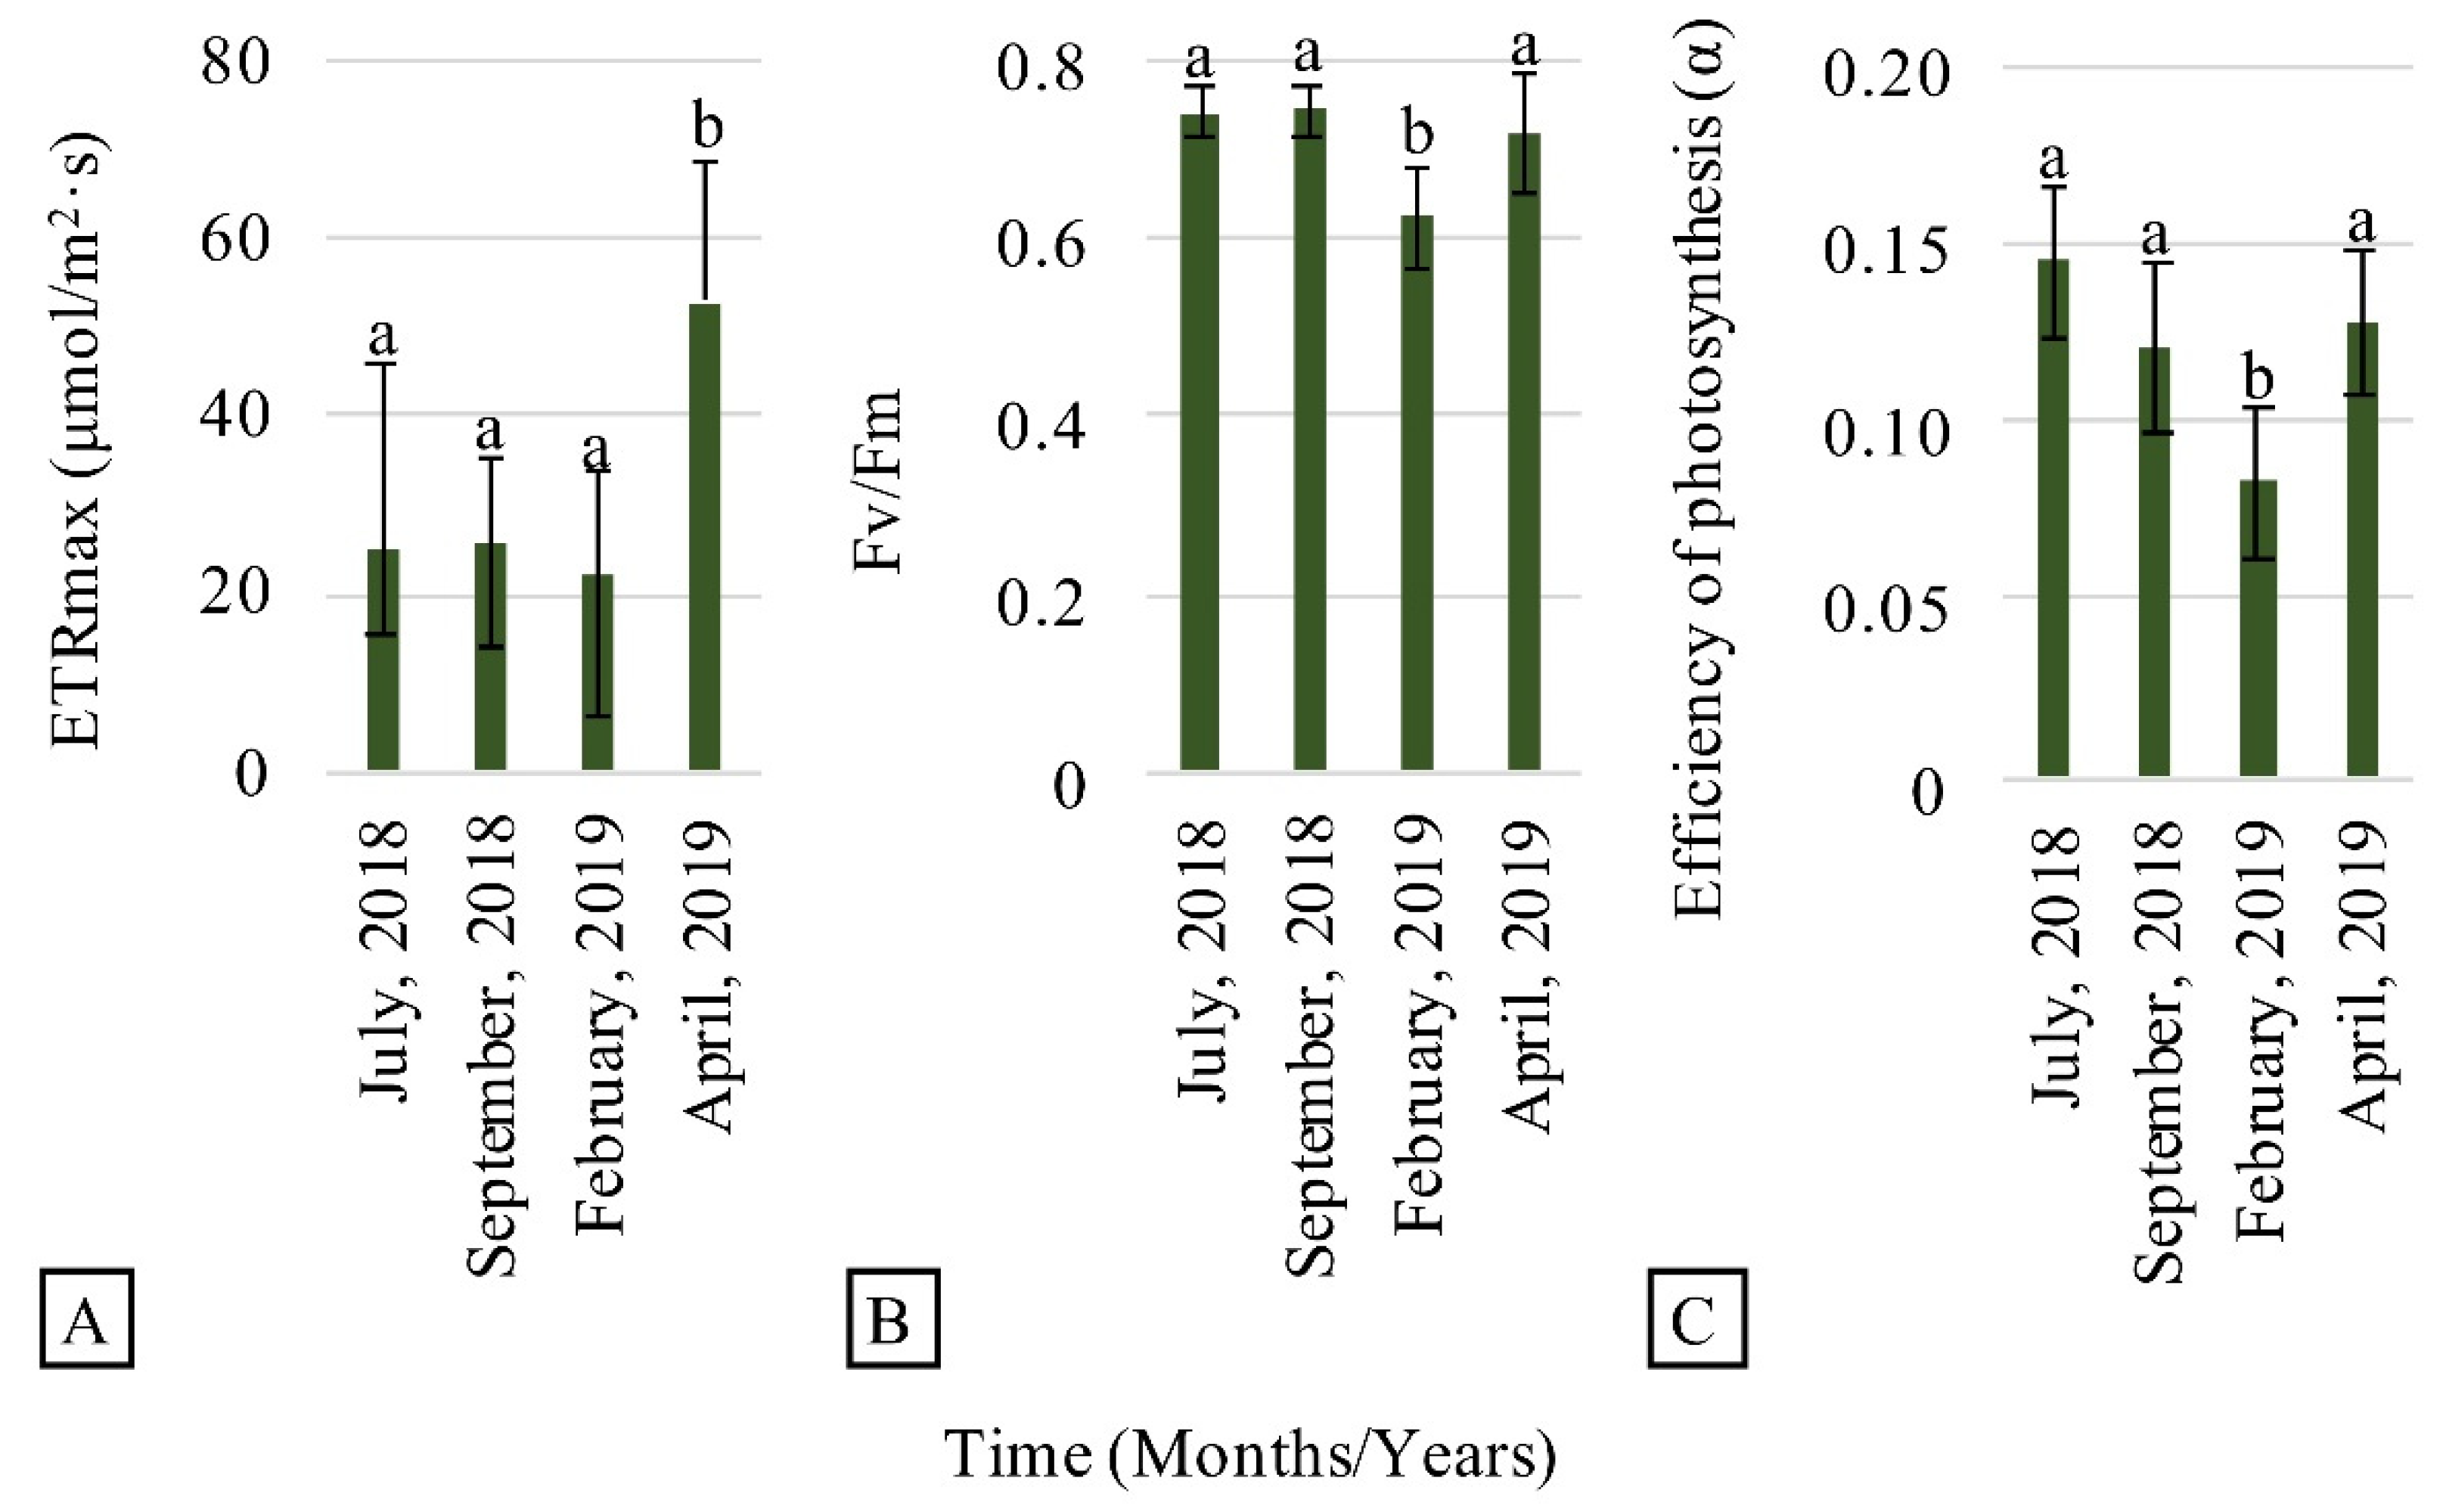
3.2. Evaluation of Plant Establishment and Development

One of the preliminary objectives was to evaluate which plant species would survive and establish under the tested conditions. For that, the plants were collected from an estuarine region nearby the port, having in consideration similar salinity levels [36]. From the six FWI plants initially planted, only two species survived: S. maritima and S. perennis. S. maritima exhibited resilience (67% of survival), although, the optimal growth for this species seems to occur at 20% of seawater [37]. Overall, S. perennis demonstrated the greatest potential among the other six plant species tested, presenting survival rates up to 88%. This marsh plant evidenced visual growth in such a way that it began to spread to the other holes of the FWI, particularly after 16 months of the implementation. This propagation tendency is characteristic of this perennial succulent species, with the subshrubs tending to merge, forming agglomerates and creating mats of 1 m or more in diameter [38]. The other plant species decayed rapidly, no specimens alive remaining after November 2018. Nevertheless, further studies with J. maritimus, H. portulacoides, P. australis, and L. vulgare would be of interest, to understand their low success of establishment, for instance, if it is related with the conditions of the marina, the sampling season or plant physiologic characteristics. Thus, the two more resistant and more promising plant species to cope with this environment, S. maritima and S. perennis, seem to be the most suitable species for future FWI applications in highly saline water bodies. Sanicola et al. [14] reported that a plant from the same genus (Sarcocornia quinqueflora) was the one with the better root biomass growth in saltwater (rather than in freshwater) among the other four wetland plant species tested in their FWI mesocosm studies. Moreover, Calheiros et al. [39] used Sarcocornia fruticosa for highly saline wastewater treatment, in a constructed wetland, where this species also demonstrated a high resilience.
PAM measurements were performed in S. perennis, which early showed the most promising survival rate (Figure 5). Results showed the highest and significantly different ETRm value in April of 2019, with high values for the other two parameters registered as well. On the other hand, in February of 2019 the lowest values of all the three parameters tested were registered, including significantly different Fv/Fm ratio and quantum efficiency of photosynthesis.
These results suggested a better photosynthetic performance in the months of higher temperature and higher number of daily light hours (Summer and Spring), considering that in the first PAM measurement (five months after the FWI implementation, July 2018), plants had already adapted to the environmental conditions. Thus, these results indicated the absence of major concerns, considering the photosynthetic performance. Nevertheless, no measurements were found, in the literature, for similar environmental conditions and plants species, to establish a direct comparison.

3.3. Seawater Port Marina Characterization

To have a characterization of the water body where the FWI were implemented, several physicochemical parameters were measured over time (Table 1). At each monthly sampling campaign, the air temperature and relative humidity ranged from 13.1 °C to 20.7 °C and from 26% to 71%, respectively.
Considering salinity and conductivity values, the water of the marina can be classified as highly saline [40]. COD values showed high variability over time, ranging between 135 and 630 mg O2/L in the marina water. Nutrient concentrations of the four inorganic ions measured were higher than the ones found in the coastal areas along the northwest Portuguese coast [41] and lower than those reported in a study monitoring coastal areas of the same region and relatively close to the present study area [42]. In the case of the marina, the waters are more confined, with lower hydrodynamic than coastal waters, and with the direct influence of the Leça river, as the marina is located on the river mouth. These facts may explain the nutrient concentrations and high COD values observed in the present study.
Regarding hydrocarbon levels, TPHs concentrations were often below the detection limit (<2 mg/L) but were also detected at a level of ca. 6 mg/L. This concentration was higher than the ones found in coastal areas influenced by shipping activities or near oil explorations of South Africa [43], Iran [44], Thailand [45], and China [46], where levels detected were up to 0.51 mg/L. The TPH methodology used gives mostly an estimation of total aliphatic hydrocarbons concentration which are generally the hydrocarbons more easily degraded. Therefore, their presence might indicate a continuous source of hydrocarbons. A more extensive survey of the marina water should be considered to evaluate in detail the presence of these hydrocarbons and possible relations with the traffic of boats, although this marina has been working at a low traffic intensity. Concerning PAHs, concentrations were below the detection limit in all water samples collected (detection limit: Nap < 1 ng/L; Acy < 8.6 ng/L; Ace < 4.4 ng/L; Fle < 5.0 ng/L; Phe < 4.3 ng/L; Ant < 3.4 ng/L; Fla < 10.0 ng/L; Pyr < 10.0 ng/L; BaA < 10.0 ng/L; Chr < 7.5 ng/L; BbF < 20 ng/L; BkF < 20 ng/L; BaP < 15.1 ng/L, BghiP < 32.9 ng/L; InP < 50.6 ng/L; DahA < 43.8 ng/L). Rocha et al. [42] detected PAHs in the water near by the present study area (between 48.5 and 60.3 ng/L), indicating that PAHs sources were both pyrogenic and petrogenic. A possible explanation for the detection of TPHs and no PAHs in the present study, can be related to the tendency of the latest for deposition and accumulation on sediment bed [47,48]. Since marinas are relatively confined areas, they can accumulate more fine sediments with associated organic matter which can adsorb these organic pollutants [47]. The water characteristics may have influenced the plant survival and growth to some extent, with the high salinity and availability of nutrients in the marina water body in consideration, because halophytes species differ greatly in terms of their salt tolerance [49]. The nutrients availability can be a restrictive factor for plant growth in saline habitats [50].

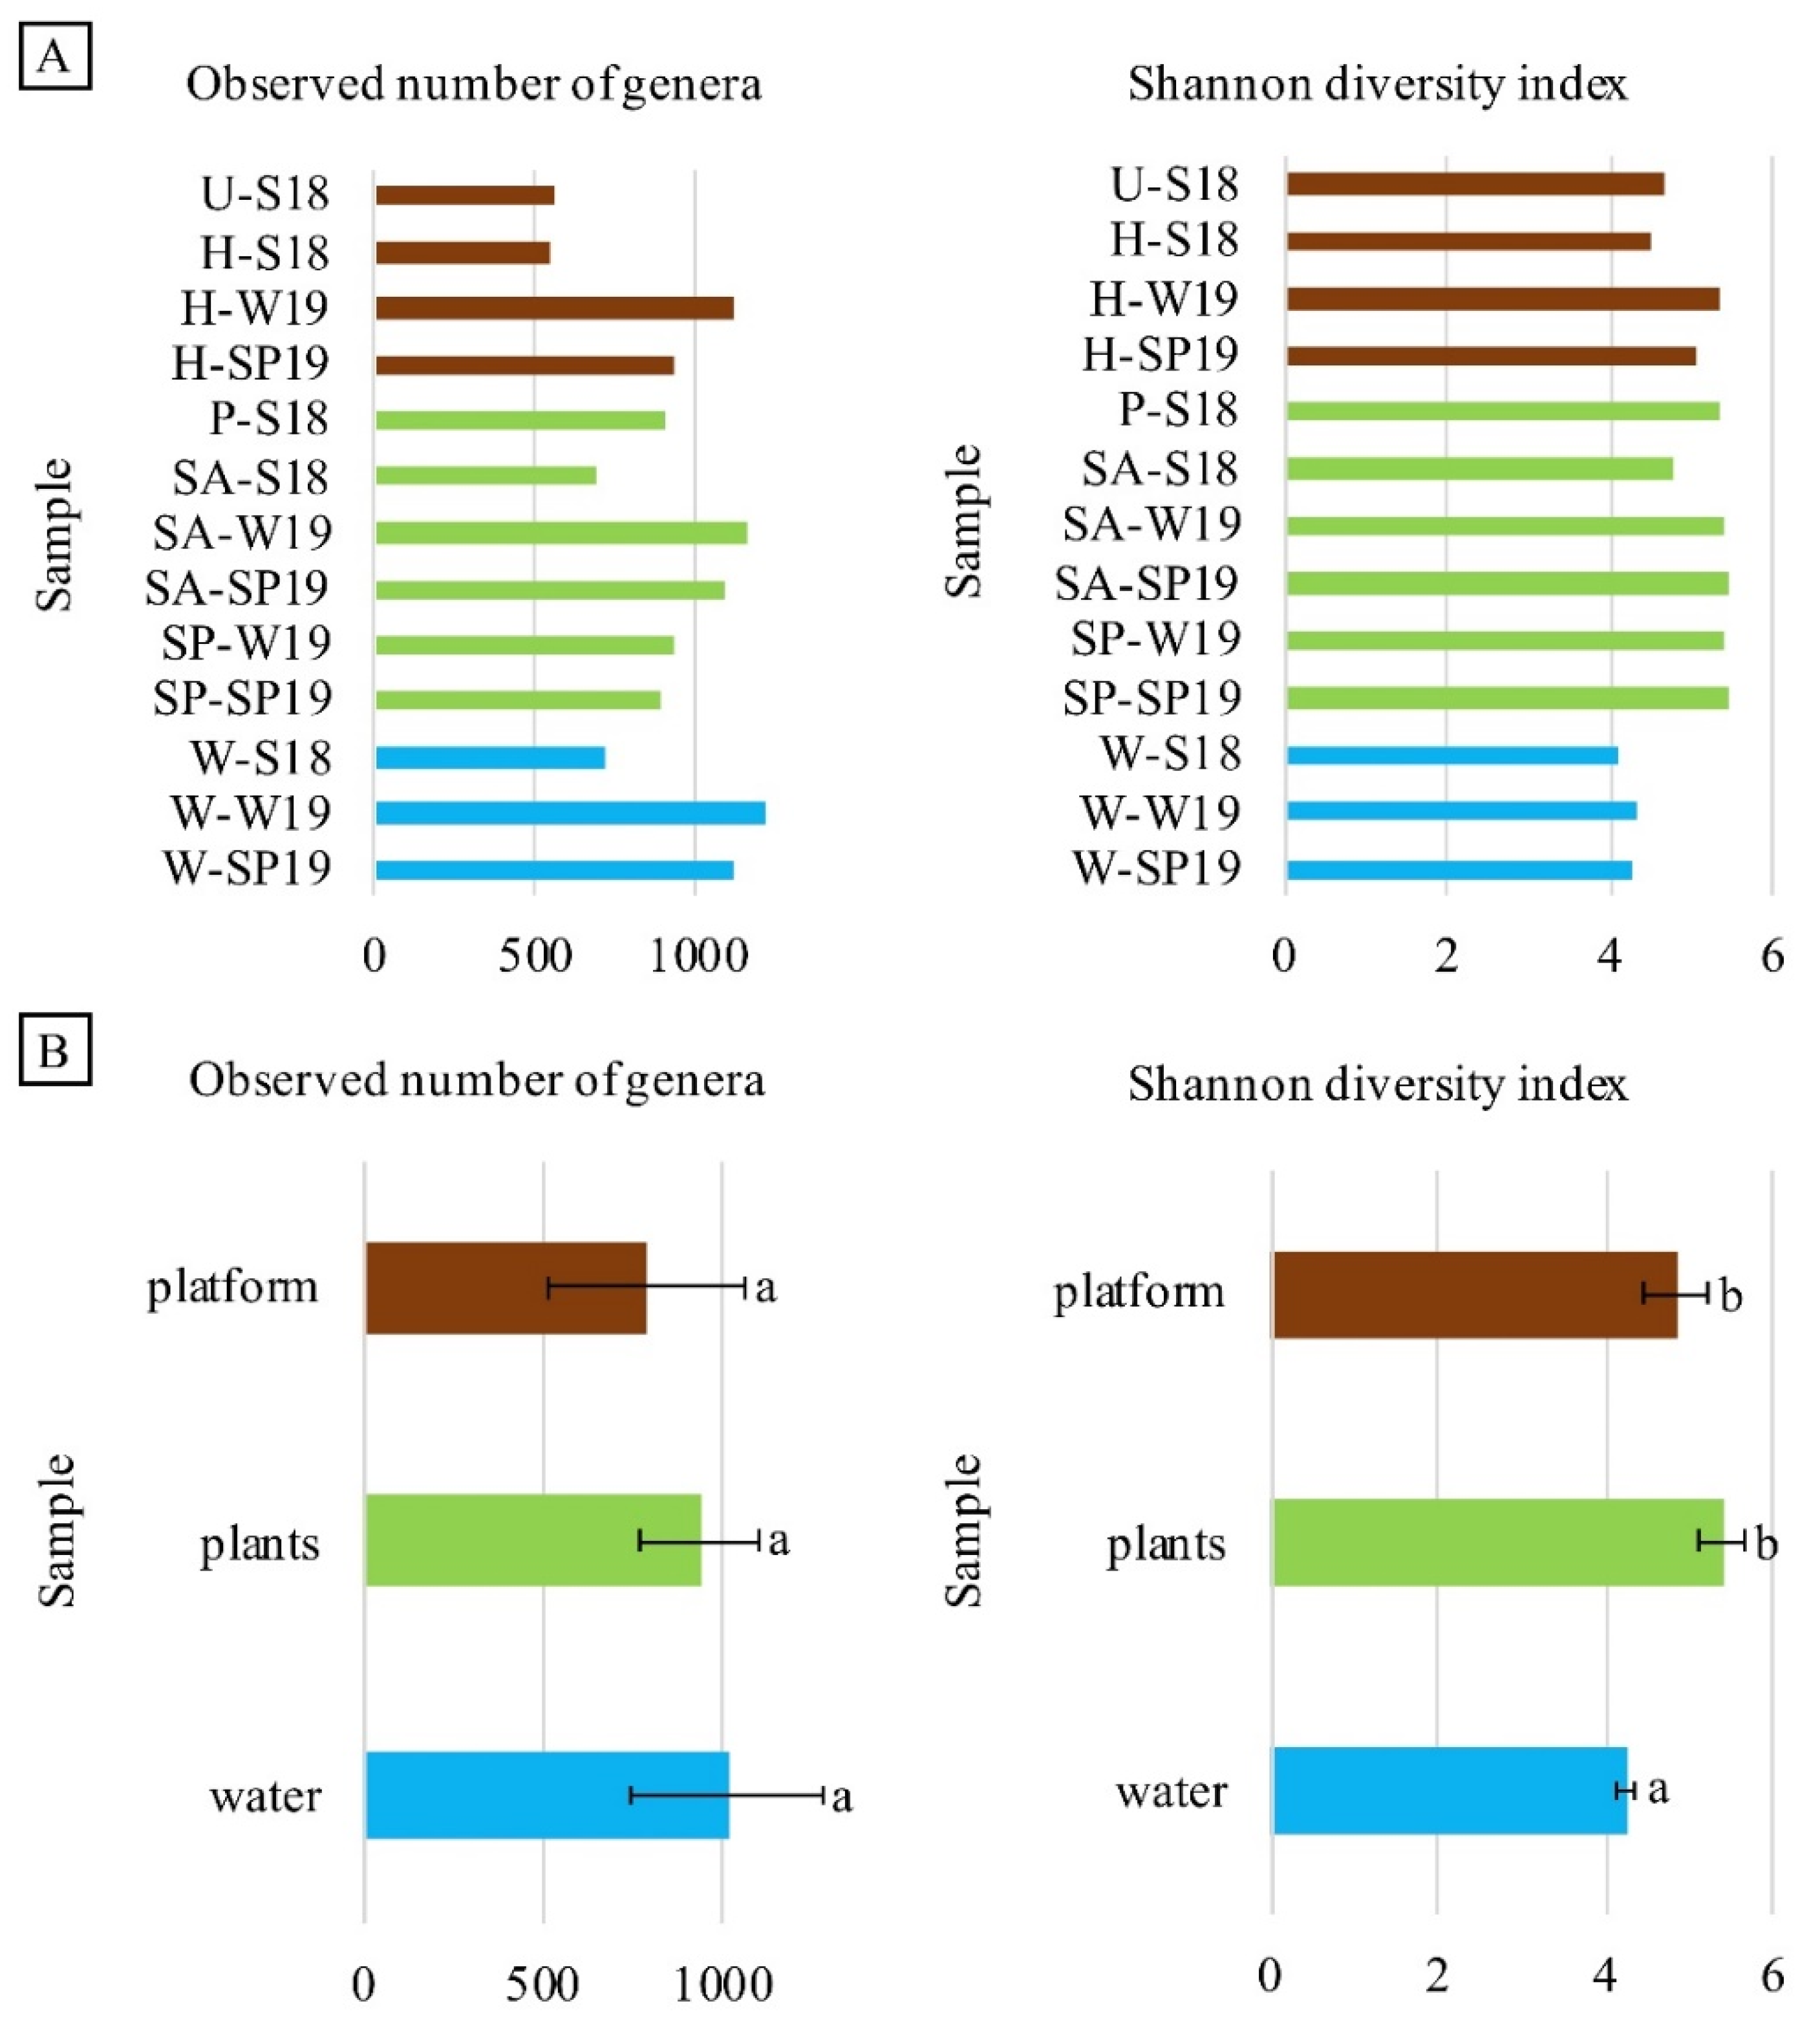
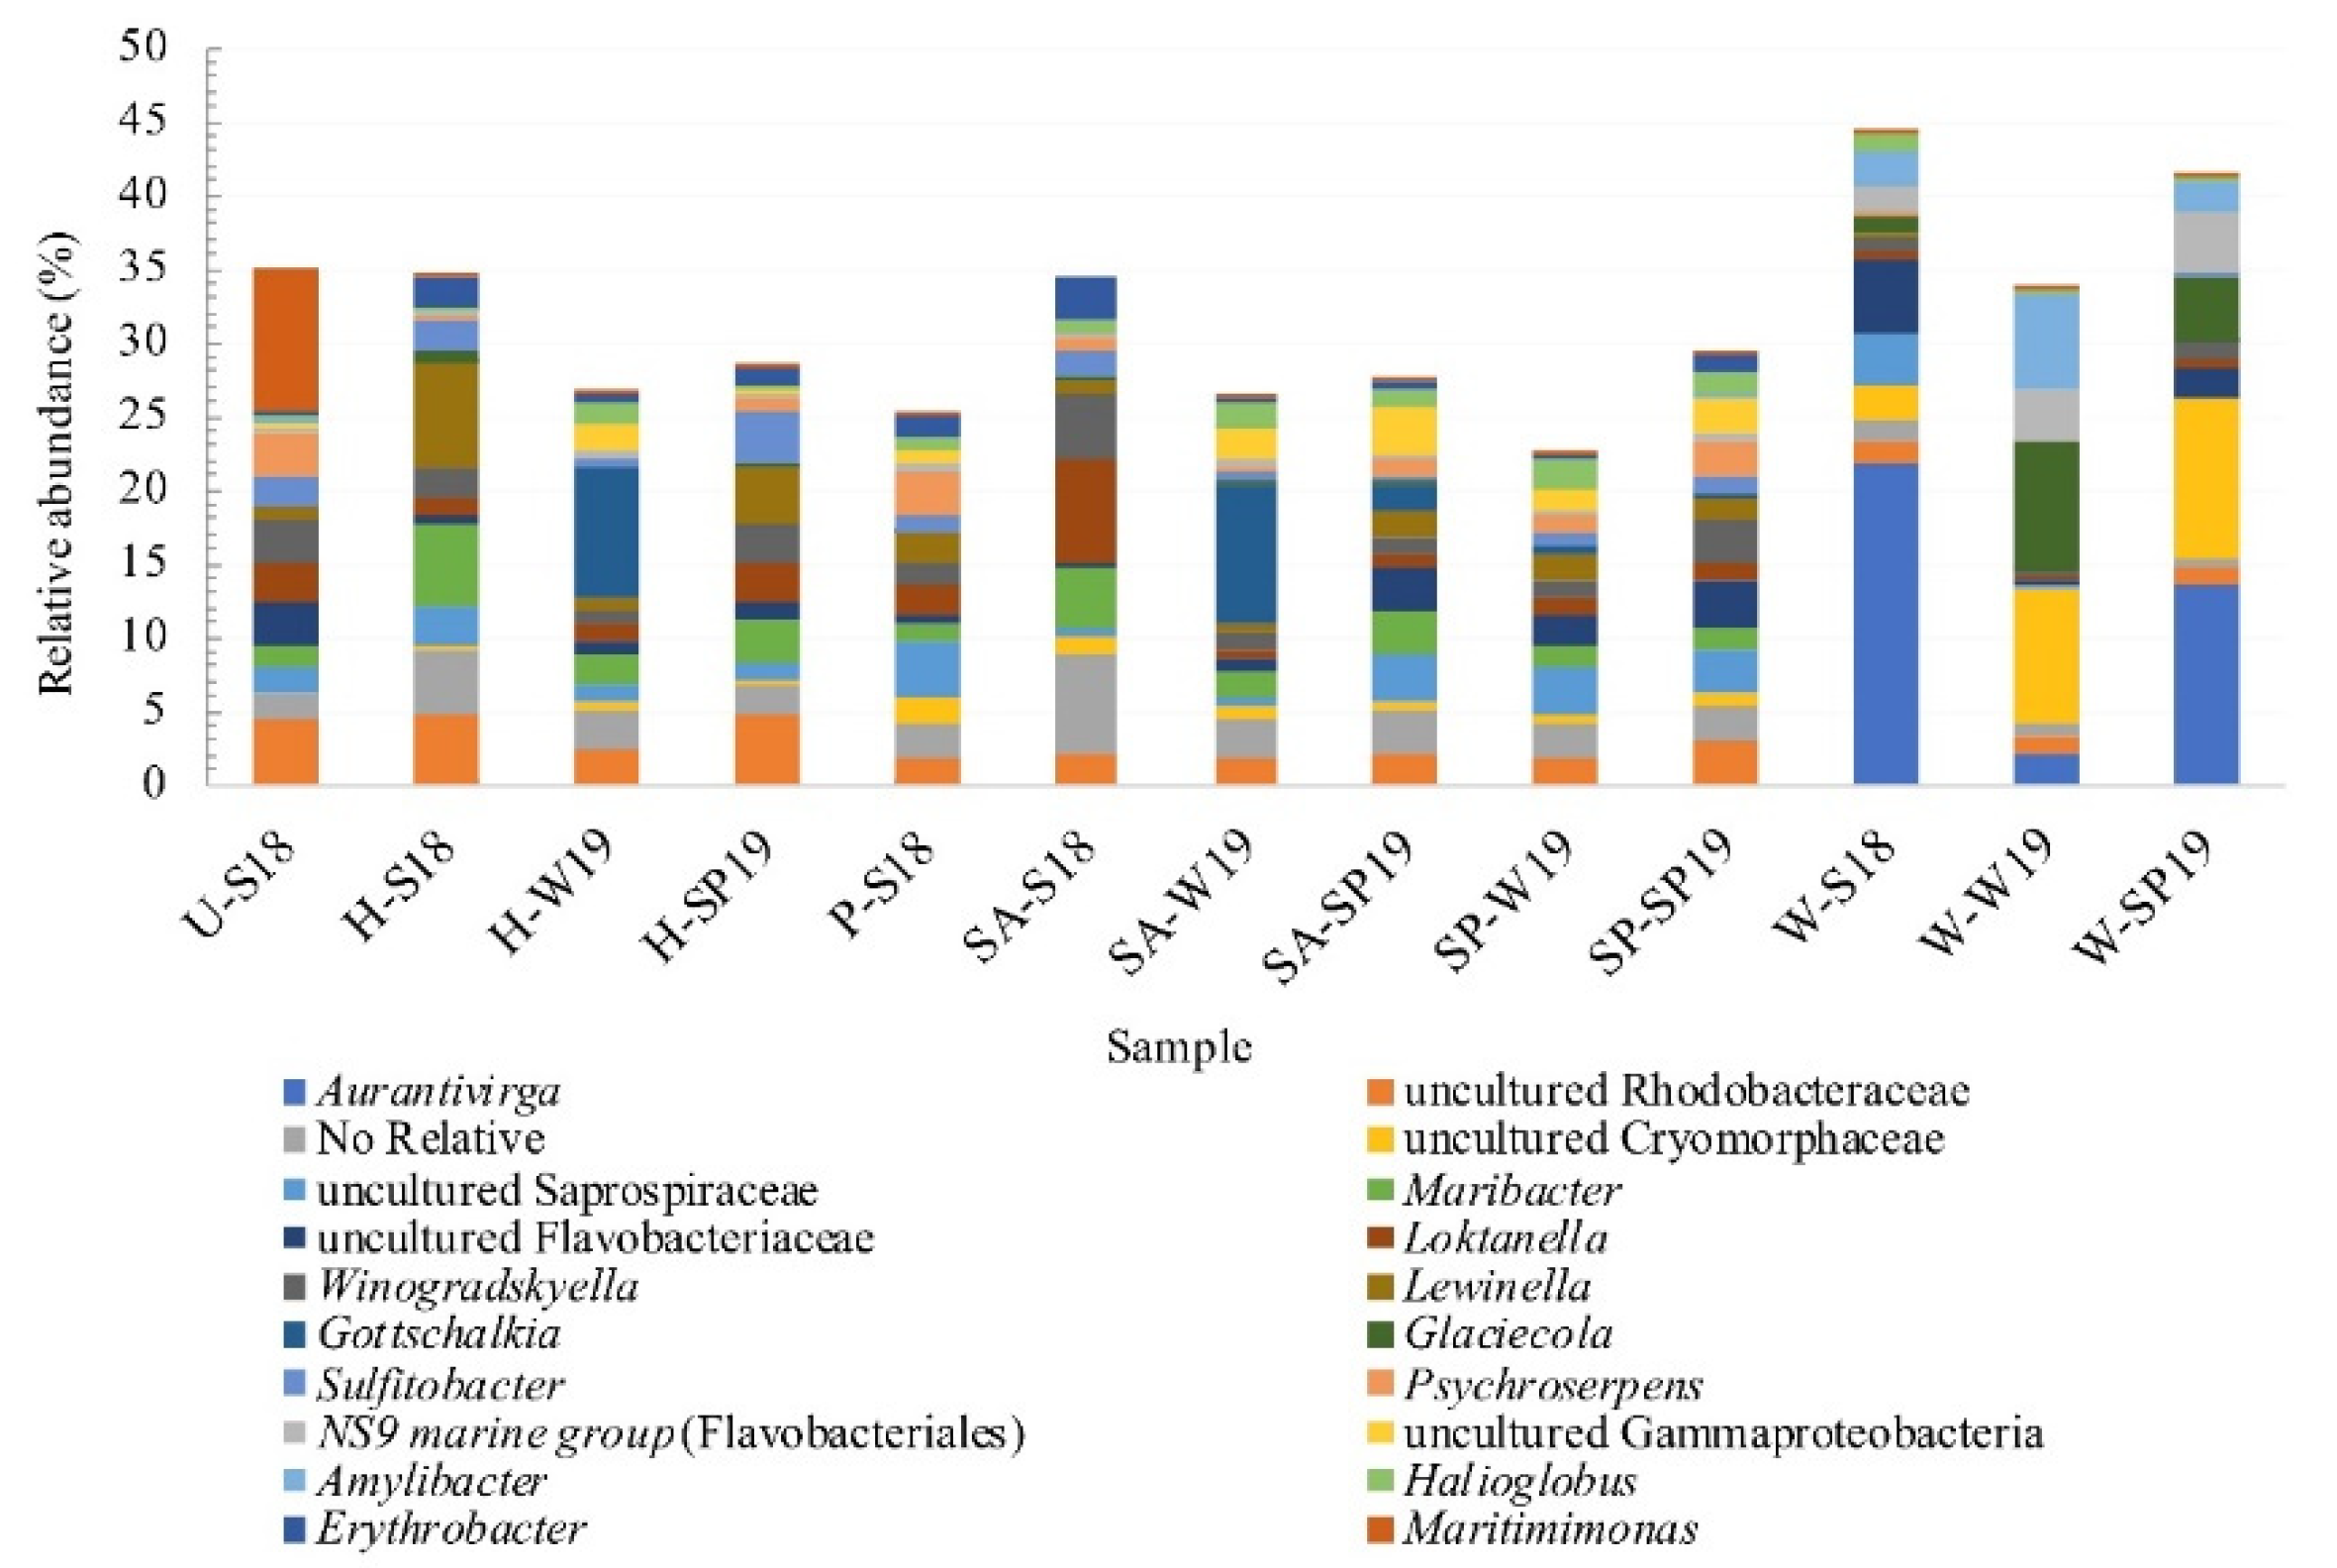
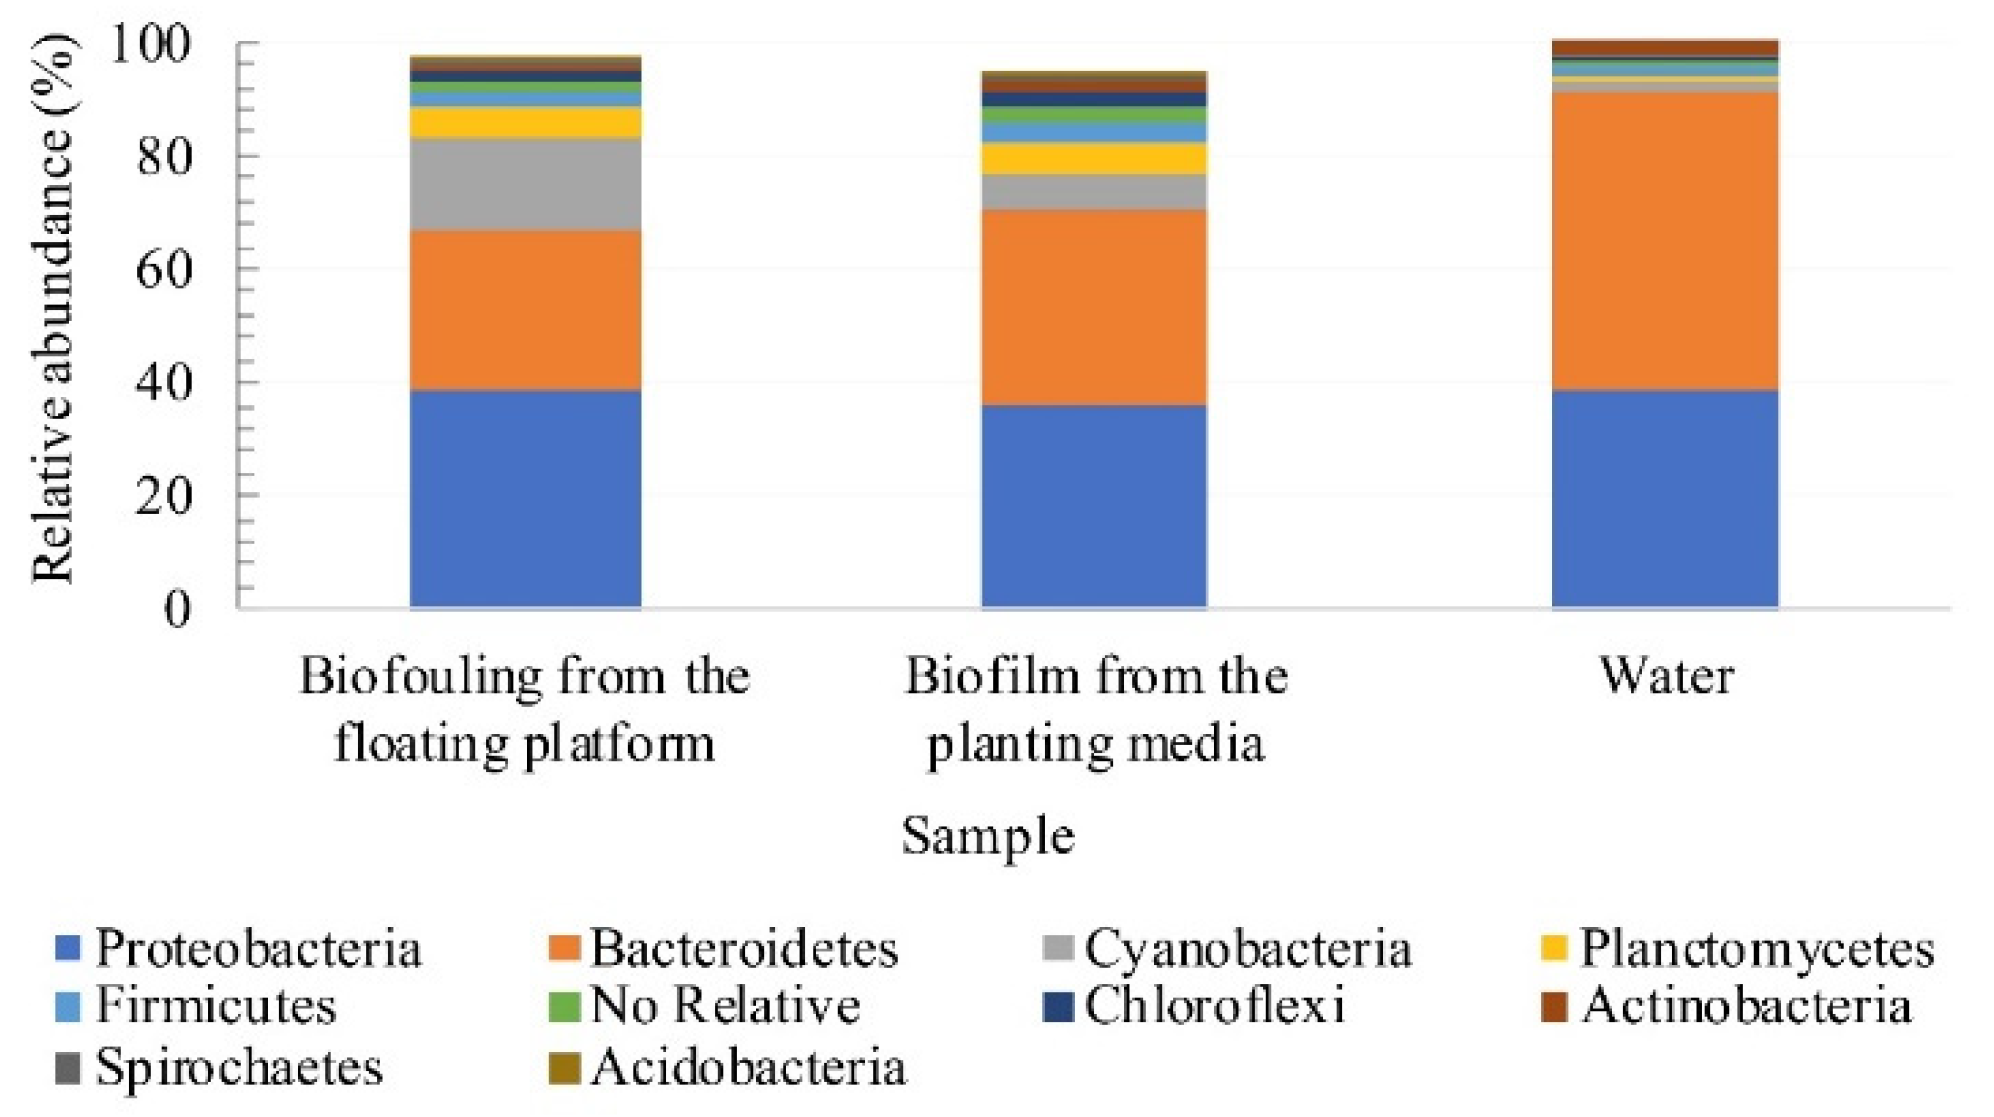
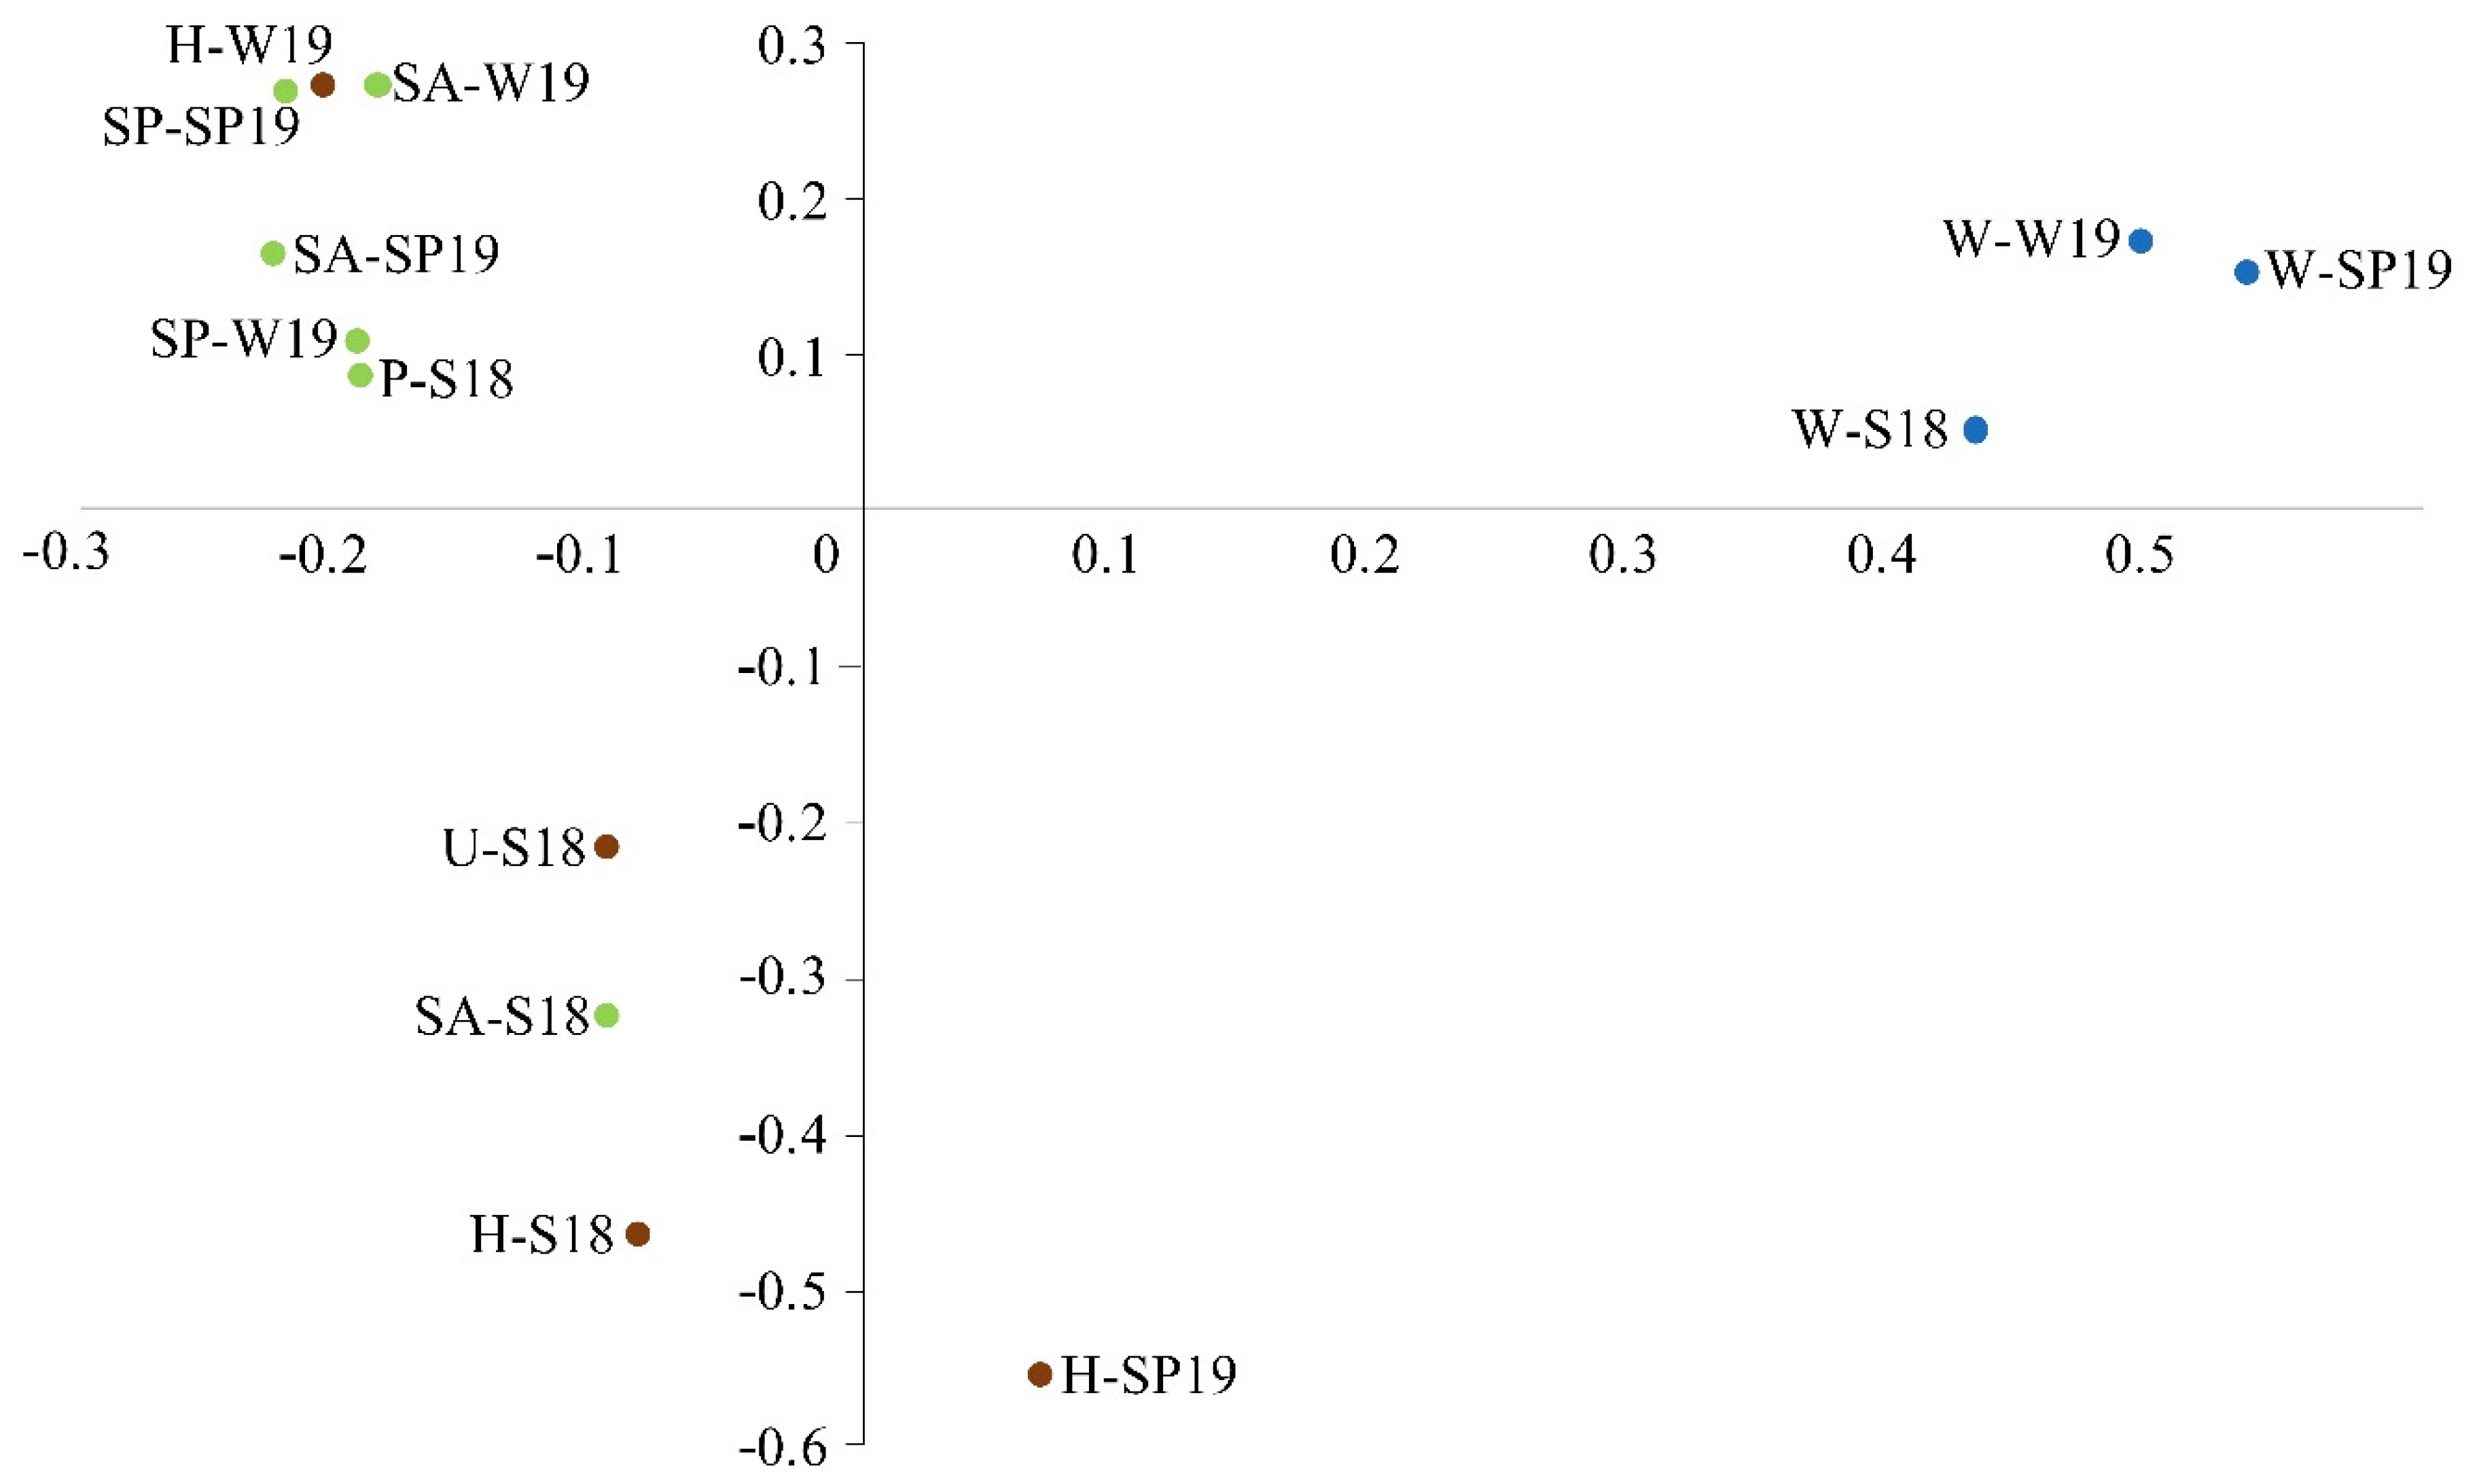
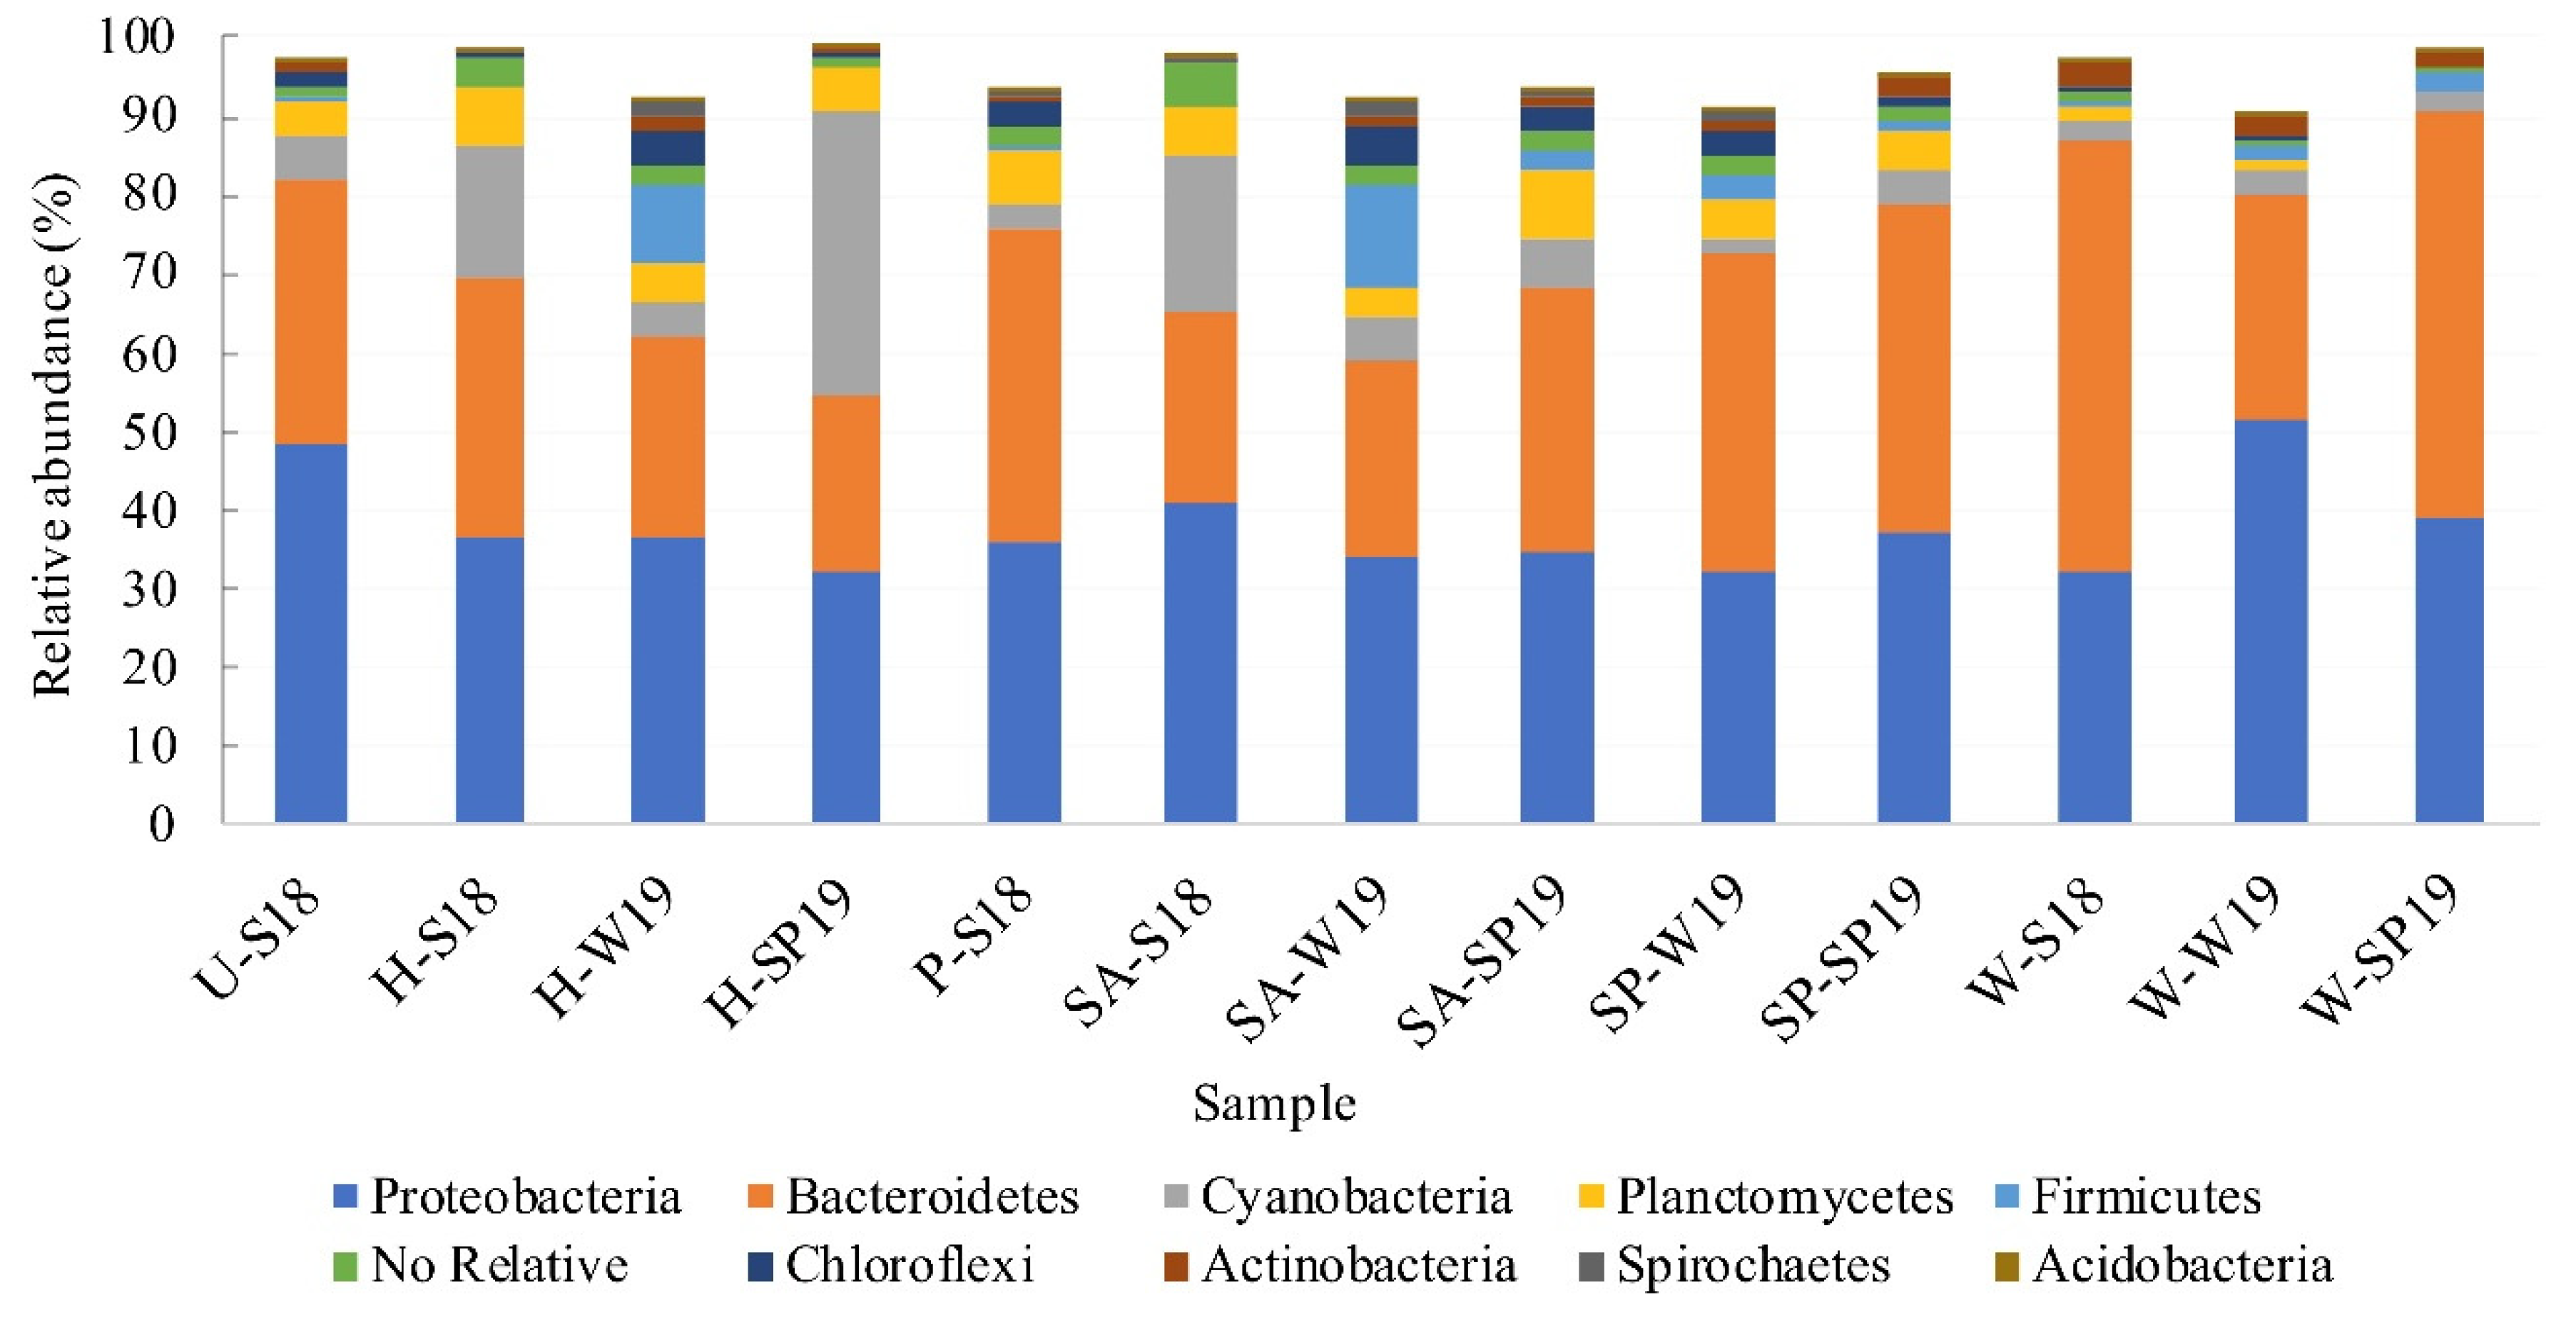
3.4. Assessment of Microbial Diversity in the FWI and Water

FWI samples of biofouling and biofilm were analyzed. The accumulation of organisms on submerged structures (e.g., pier), in marine environments context, often receives the designation of biofouling. However, this multi-stage process starts with biofilm formation [51]. Biofilm designation, in the context of FWI, is often attributed to the microbial development associated to the plant roots and its role on the water depurative process [7,52]. Therefore, both types of samples were considered. Water microbial diversity was also assessed.
A total of 764,759 of 16S rRNA gene sequences were generated by Illumina MiSeq sequencing for all the samples processed by SILVAngs analysis pipeline, which decreased to a total of 606,549 (79.31%) after quality filtering. From those, 593,753 (77.64%) were classified and 12,796 (1.67%) remained classified as ‘no relative’ reads (without any close relatives).
The analysis of alpha-diversity indices across all the samples (Figure 6A) showed a pattern within each type of samples in relation with the observed number of genera (ONG), with an increase from the Summer of 2018 to the Winter of 2019, followed by a decrease in the Spring of 2019 but with values still higher than the Summer of 2018, showing a possible seasonality. The lower value of ONG in Summer 2018 can be related to more intense maritime traffic that occurred in the study area. A previous study by Nogales and Bosch [2] mentioned shifts in the bacterial composition due to the impact of the activities of recreational coastal areas. However, other factors must be considered such as the natural colonization process, and the possible seasonality referred. Antunes et al. [53] also suggested that pioneer bacterial biofilm communities may face significant seasonal variations in the same location, when carrying out a study in the same port of the present study. They have stated that samples of biofilm retrieved from two different seasons had shown significant distinct taxonomic profiles and diversity patterns of the bacterial communities.
The Shannon diversity index remained stable over time for each type of sample. However, the highest values were detected for the biofilm from the planting media of S. perennis, presenting slight differences in comparison to the other plant species. Oliveira et al. [54] also reported a higher Shannon index in bacterial communities of S. perennis (subsp. perennis) rhizosphere comparing to H. portucaloides rhizosphere in natural sediments affected by hydrocarbons. When the same type of samples (biofouling from the floating platform, biofilm from the planting media, and water) was grouped (Figure 6B) and compared, no significant ONG differences were detected between groups. Shannon diversity varied significantly for the samples of biofilm from the planting media compared to the water samples and, although not significantly different, this index was also higher compared to the samples of biofouling from the floating platform.
Figure 7 shows the top 20 taxa across the dataset, which includes the genera from seven different families and the ‘no relative’ group: Flavobacteriaceae (Aurantivirga sp., uncultured representative, Maribacter sp., Winogradskyella sp., Psychroserpens sp., Maritimimonas sp.), Rhodobacteraceae (uncultured representative, Loktanella sp., Sulfitobacter sp., Amylibacter sp., Lentibacter sp.), Saprospiraceae (uncultured representative, Lewinella sp.) Alteromonadaceae (Glaciecola sp.), Halieaceae (Halioglobus sp.), Cryomorphaceae (uncultured representative), Gottschalkiaceae (Gottschalkia sp.). This top 20 also includes one taxon from the Flavobacteriales order and one taxon of Gammaproteobacteria class (unculture representative). Antunes et al. [53] when studying the biofilm growing on stainless steel surfaces in the same port, reported that the most abundant family found was Rhodobacteraceae, followed by Flavobacteriaceae, Halomonodaceae, and Alteromonodaceae families.
The average relative abundance of the main phyla for each type of samples (biofouling from the floating platform, biofilm from the planting media and water), is displayed in Figure 8, being the most abundant phyla Proteobacteria and Bacteroidetes (Appendix A Figure A1 shows the top 10 phyla found per sample analyzed). Cyanobacteria and Planctomycetes were also relevant phyla on biofouling and biofilm samples. Studies on biofouling growth on stainless steel plates in the same port marina as the present study, showed that the most abundant phyla were Cyanobacteria, Proteobacteria, Bacteroidetes, and Fusobacteria [31] as well as Proteobacteria, Bacteroidetes, Cyanobacteria, and Actinobacteria [53].
The beta-diversity analyzed through the principal coordinates analysis (PCoA) (Figure 9) showed a clear distinct communities’ composition developed in the biofouling and biofilm compared with the water. These differences were expected as the distinctness between water and marine biofilm communities have been already reported by other authors [55,56]. Based on these results, ANOSIM confirmed, statistically, a significant difference (R2 = 1, p = 0.012) between the water samples and the biofilm samples from the planting media as well between the water samples and the biofouling samples from the floating platform (R2 = 1, p = 0.027). On the other hand, ANOSIM between the biofouling samples from the floating platform and the biofilm samples from the planting media showed no significant difference (R2 = 0.28, p = 0.073).
Additionally, SIMPER analysis was performed to identify the taxa (at genus level) that most contributed to the differences between the two types of samples in comparison to the water samples (Appendix A Table A1 and Table A2). This analysis showed a higher relative abundance of Maritimimonas sp., Gottschalkia sp., Maribacter sp., and Lewinella sp. Results showed also a higher relative abundance of uncultured Saprospiraceae and Gammaproteobacteria classes in the case of the biofilm samples from the planting media. Previous studies reported the presence of the Maritimimonas genus, in high percentage, in biofilms developed on biocidal coatings [57] and plastic surfaces at harbor environments [58], suggesting a great resistance capacity. In the present study, this specie was found, mainly, in the under surface of the floating platform (Figure 7). The Gottschalkia genus is characterized by the ability to degrade purines. Interestingly, Gottschalkia genus members are classified as obligatory anaerobic [59], although, this genus was found in the floating platform (presenting aerobic conditions). Members affiliated to the Maribacter genus are, usually, found in association with macroalgae Ulva sp. [60,61]. Concerning Lewinella genus, this genus has been found in samples retrieved from marine environment [62]. With relation to the Saprospiraceae family, members are mostly isolated from marine environments (but also freshwater) and activated sludge, having shown capacity to breakdown complex organic compounds [63]. Therefore, this group of organisms can be important for bioremediation processes, being mainly present in the biofilm from the planting media in the present study. Finally, the Gammaproteobacteria class that contributed to the dissimilarity between water and the biofilm from the planting media, was previously found in other studies, in a high relative abundance associated with the rhizosphere of salt marsh plants as well [64].

4. Conclusions

The establishment of FWI in a seawater port marina demonstrated promising results for the possible application in full scale of this NBS, promoting several ecosystem services such biodiversity, species habitat, aesthetic improvement of the landscape, and potential for water quality enhancement.
The characterization of the marina water constitutes an important dataset for future comparison with other harbors/marinas in Europe and in other locations, important due to the lack of data. The experimental floating platform, made of cork agglomerate, showed resistance to the environmental harsh conditions of the port marina, along the tested period. However, some adjustments for robustness improvement and buoyancy could improve the system and should be taken into consideration in future work. Also, a longer monitoring period of the FWI would be important to acquire more knowledge concerning the life span and resilience of the platform. This study showed that the halophyte plants Sarcocornia perennis and Spartina maritima can be used in future FWI seawater applications.
The characterization of the microbial community revealed the presence of some bacterial groups that can be relevant for bioremediation processes. Overall, the knowledge gained about the microorganisms and macrofauna diversity developed on the FWI will be important for future applications of FWI for water quality improvement and biodiversity promotion.
This study gives new insights to broaden the FWI application to the saline environment of port marinas and to support a management strategy that benefit from the ecosystem services that this NBS provides.

Author Contributions

Conceptualization, C.S.C.C., A.P.M., and C.M.R.A.; Laboratory and field work, J.C. and C.S.C.C.; Data curation, J.C. and M.P.T.; Writing—original draft preparation, C.S.C.C. and J.C.; Writing—review and editing, C.S.C.C., J.C., M.P.T., A.P.M., and C.M.R.A.; Supervision, C.S.C.C., A.P.M., and C.M.R.A. All authors have read and agreed to the published version of the manuscript.

Funding

This research was partially supported by the project BIOREM—Bioremediation of hydrocarbon pollutants by autochthonous microorganisms in aquatic environment, PTDC/BTA-GES/32186/2017 and POCI-01-0145-FEDER-032186, supported by Fundo Europeu de Desenvolvimento Regional (FEDER) through COMPETE2020—Programa Operacional de Competitividade e Internacionalização (POCI) and FCT/MCTES, and by national funds through FCT—Foundation for Science and Technology within the scope of UIDB/04423/2020 and UIDP/04423/2020.

Acknowledgments

Authors would like to thank Bluemater, S.A for providing the Cork Floating Island®, and to “Administração dos Portos de Douro, Leixões e Viana do Castelo” (APDL) for the collaboration and all the support. Authors are thankful to Antonio de Sousa for bioinformatic analysis support and to Rosa Pinho, from Universidade de Aveiro, for plant species identification support.

Conflicts of Interest

The authors declare no conflict of interest. The funders had no role in the design of the study; in the collection, analyses, or interpretation of data; in the writing of the manuscript, or in the decision to publish the results.

Appendix A

Figure A1. Taxonomic profile of top 10 prokaryotic taxa at higher level (phylum) across all samples. Top 10 represents 91% of the total sequences dataset. Codes: biofouling samples from the floating platform (H = non-planted holes and U = Under surface); biofilm samples from the planting media (SP = Spartina maritima; SA = Sarcocornia perennis; and P = Phragmites australis) and water samples (W); S18 = Summer of 2018; W19 = Winter of 2019 and SP19 = Spring of 2019.
Water 12 03273 g0a1
Table A1. SIMPER analysis results displaying top 10 genera responsible for the dissimilarity and the contribution percentage for that dissimilarity between water samples and biofilm samples from the planting media
Taxa (Genera)Mean Abund. Plants (%)Mean Abund. Water (%)Contrib. (%)
Aurantivirga0.0428.905.11
Uncultured Cryomorphaceae4.8519.502.57
Glaciecola0.4213.002.10
Uncultured Saprospiraceae12.702.761.72
Amylibacter0.149.821.63
Gottschalkia8.950.011.56
Maribacter8.870.021.54
Lentibacter0.098.851.50
Uncultured Gammaproteobacteria8.650.151.36
Loktanella8.401.261.34
Table A2. SIMPER analysis results displaying top 10 genera responsible for the dissimilarity and the contribution percentage for that dissimilarity between water samples and biofouling samples from the floating platform
Taxa (Genera)Mean Abund. Platform (%)Mean Abund. Water (%)Contrib. (%)
Aurantivirga0.0328.907.34
Uncultured Cryomorphaceae0.9919.504.43
Glaciecola0.5313.002.92
Amylibacter0.359.822.25
Lentibacter0.138.852.11
NS9 marine group (Flavobacteriales)0.828.001.75
Maritimimonas8.570.011.73
Gottschalkia9.420.011.64
Maribacter7.020.021.61
Lewinella6.500.161.59

References

  1. Dafforn, K.A.; Glasby, T.M.; Airoldi, L.; Rivero, N.K.; Mayer-Pinto, M.; Johnston, E.L. Marine urbanization: An ecological framework for designing multifunctional artificial structures. Front. Ecol. Environ. 2015, 13, 82–90. [Google Scholar] [CrossRef]
  2. Nogales, B.; Bosch, R. Microbial communities in hydrocarbon-polluted harbors and marinas. In Microbial Communities Utilizing Hydrocarbons and Lipids: Members, Metagenomics and Ecophysiology. Handbook of Hydrocarbon and Lipid Microbiology; McGenity, T.J., Ed.; Springer: Cham, Switzerland, 2019; pp. 1–17. [Google Scholar] [CrossRef]
  3. Mali, M.; Dell’Anna, M.M.; Mastrorilli, P.; Damiani, L.; Piccinni, A.F. Assessment and source identification of pollution risk for touristic ports: Heavy metals and polycyclic aromatic hydrocarbons in sediments of 4 marinas of the Apulia region (Italy). Mar. Pollut. Bull. 2017, 114, 768–777. [Google Scholar] [CrossRef] [PubMed]
  4. Martinez-Llado, X.; Gibert, O.; Marti, V.; Diez, S.; Romo, J.; Bayona, J.M.; de Pablo, J. Distribution of polycyclic aromatic hydrocarbons (PAHs) and tributyltin (TBT) in Barcelona harbour sediments and their impact on benthic communities. Environ. Pollut. 2007, 149, 104–113. [Google Scholar] [CrossRef] [PubMed]
  5. Fernández-Romero, A.; Moreira, J.; Guerra-García, J.M. Marinas: An overlooked habitat for exploring the relation among polychaete assemblages and environmental factors. Mar. Pollut. Bull. 2019, 138, 584–597. [Google Scholar] [CrossRef]
  6. WWAP (United Nations World Water Assessment Programme)/UN-Water. The United Nations World Water Development Report 2018, Nature-Based Solutions for Water; UNESNO: Paris, France, 2018. [Google Scholar]
  7. Colares, G.S.; Dell’Osbel, N.; Wiesel, P.G.; Oliveira, G.A.; Lemos, P.; da Silva, H.Z.; Lutterbeck, F.P.; Kist, C.A.; Colares, L.T.; Machado, Ê.L. Floating treatment wetlands: A review and bibliometric analysis. Sci. Total Environ. 2020, 714, 136776. [Google Scholar] [CrossRef]
  8. Bi, R.; Zhou, C.; Jia, Y.; Wang, S.; Li, P.; Reichwaldt, E.S.; Liu, W. Giving waterbodies the treatment they need: A critical review of the application of constructed floating wetlands. J. Environ. Manag. 2019, 238, 484–498. [Google Scholar] [CrossRef]
  9. Shahid, M.J.; Arslan, M.; Ali, S.; Siddique, M.; Afzal, M. Floating wetlands: A sustainable tool for wastewater treatment. Clean Soil Air Water 2018, 46. [Google Scholar] [CrossRef]
  10. Pavlineri, N.; Skoulikidis, N.T.; Tsihrintzis, V.A. Constructed floating wetlands: A review of research, design, operation and management aspects, and data meta-analysis. Chem. Eng. J. 2017, 308, 1120–1132. [Google Scholar] [CrossRef]
  11. Chen, Z.; Cuervo, D.P.; Muller, J.A.; Wiessner, A.; Koser, H.; Vymazal, J.; Kästner, M.; Kuschk, P. Hydroponic root mats for wastewater treatment-a review. Environ. Sci. Pollut. Res. Int. 2016, 23, 15911–15928. [Google Scholar] [CrossRef]
  12. Yeh, N.; Yeh, P.; Chang, Y.-H. Artificial floating islands for environmental improvement. Ren. Sustain. Energy Rev. 2015, 47, 616–622. [Google Scholar] [CrossRef]
  13. McCarty, M.; Ceci, J.; Streb, C. A Case Study and Recommendation for Large Scale Floating. In Proceedings of the International Conference on Sustainable Infrastructure 2017, New York, NY, USA, 26–28 October 2017; Soibelman, L., Peña-Mora, F., Eds.; American Society of Civil Engineers (ASCE): New York, NY, USA, 2017; pp. 1–12, ISBN 9780784481219. [Google Scholar]
  14. Sanicola, O.; Lucke, T.; Stewart, M.; Tondera, K.; Walker, C. Root and shoot biomass growth of constructed floating wetlands plants in saline environments. Int. J. Environ. Res. Public Health 2019, 16, 275. [Google Scholar] [CrossRef] [PubMed] [Green Version]
  15. Amorim Cork Composites. Technical bulletin Cork Floating Island®. ACC.851. 2018. Available online: https://amorimcorkcomposites.com/media/5627/tb-cork-floating-island.pdf (accessed on 29 May 2020).
  16. Schreiber, U. Pulse-amplitude-modulation (PAM) fluorometry and saturation pulse method: An overview. In Chlorophyll a Fluorescence: A Signature of Photosynthesis; Springer: New York, NY, USA, 2004; pp. 279–319. [Google Scholar]
  17. Kirk, J.T. Light and Photosynthesis in Aquatic Ecosystems; Cambridge University Press: Cambrigde, UK, 1994; p. 59. [Google Scholar]
  18. Kitajima, M.B.W.L.; Butler, W.L. Quenching of chlorophyll fluorescence and primary photochemistry in chloroplasts by dibromothymoquinone. Biochim. Biophys. Acta (BBA) Bioenerg. 1975, 376, 105–115. [Google Scholar] [CrossRef]
  19. Caspers, H.; Grasshoff, K. Methods of Seawater Analysis; Grasshoff, K., Ehrhardt, M., Kremling, K., Eds.; Verlag Chemie: Deerfield Beach, FL, USA, 1983. [Google Scholar]
  20. Jones, M.N. Nitrate reduction by shaking with cadmium: Alternative to cadmium columns. Water Res. 1984, 18, 643–646. [Google Scholar] [CrossRef]
  21. Almeida, C.M.; Reis, I.; Couto, M.N.; Bordalo, A.A.; Mucha, A.P. Potential of the microbial community present in an unimpacted beach sediment to remediate petroleum hydrocarbons. Environ. Sci. Pollut. Res. Int. 2013, 20, 3176–3184. [Google Scholar] [CrossRef] [PubMed]
  22. Gonçalves, C.; Teixeira, C.; Basto, M.C.P.; Almeida, C.M.R. PAHs levels in Portuguese estuaries and lagoons: Salt marsh plants as potential agents for the containment of PAHs contamination in sediments. Reg. Stud. Mar. Sci. 2016, 7, 211–221. [Google Scholar] [CrossRef]
  23. Keith, L.H. The Source of U.S. EPA’s sixteen PAH priority pollutants. Polycycl. Aromat. Compd. 2014, 35, 147–160. [Google Scholar] [CrossRef]
  24. Parada, A.E.; Needham, D.M.; Fuhrman, J.A. Every base matters: Assessing small subunit rRNA primers for marine microbiomes with mock communities, time series and global field samples. Environ. Microbiol. 2016, 18, 1403–1414. [Google Scholar] [CrossRef]
  25. Schmieder, R.; Edwards, R. Quality control and preprocessing of metagenomic datasets. Bioinformatics 2011, 27, 863–864. [Google Scholar] [CrossRef] [Green Version]
  26. Schubert, M.; Lindgreen, S.; Orlando, L. AdapterRemoval v2: Rapid adapter trimming, identification, and read merging. BMC Res. Notes 2016, 9, 88. [Google Scholar] [CrossRef] [Green Version]
  27. Quast, C.; Pruesse, E.; Yilmaz, P.; Gerken, J.; Schweer, T.; Yarza, P.; Peplies, J.; Glockner, F.O. The SILVA ribosomal RNA gene database project: Improved data processing and web-based tools. Nucleic. Acids Res. 2013, 41, D590–D596. [Google Scholar] [CrossRef]
  28. Camacho, C.; Coulouris, G.; Avagyan, V.; Ma, N.; Papadopoulos, J.; Bealer, K.; Madden, T.L. BLAST+: Architecture and applications. BMC Bioinform. 2009, 10, 421. [Google Scholar] [CrossRef] [PubMed] [Green Version]
  29. Bragança, I.; Mucha, A.P.; Tomasino, M.P.; Santos, F.; Lemos, P.C.; Delerue-Matos, C.; Domingues, V.F. Deltamethrin impact in a cabbage planted soil: Degradation and effect on microbial community structure. Chemosphere 2019, 220, 1179–1186. [Google Scholar] [CrossRef]
  30. Demertzi, M.; Paulo, J.A.; Faias, S.P.; Arroja, L.; Dias, A.C. Evaluating the carbon footprint of the cork sector with a dynamic approach including biogenic carbon flows. Int. J. Life Cycle Assess. 2018, 23, 1448–1459. [Google Scholar] [CrossRef]
  31. Azevedo, J.; Antunes, J.T.; Machado, A.M.; Vasconcelos, V.; Leão, P.N.; Froufe, E. Monitoring of biofouling communities in a Portuguese port using a combined morphological and metabarcoding approach. Sci. Rep. 2020, 10, 13461. [Google Scholar] [CrossRef] [PubMed]
  32. Chang, Y.-H.; Ku, C.-R.; Yeh, N. Solar powered artificial floating island for landscape ecology and water quality improvement. Ecol. Eng. 2014, 69, 8–16. [Google Scholar] [CrossRef]
  33. Strosnider, W.H.; Schultz, S.E.; Strosnider, K.A.; Nairn, R.W. Effects on the underlying water column by extensive floating treatment wetlands. J. Environ. Qual. 2017, 46, 201–209. [Google Scholar] [CrossRef]
  34. Henriques, B.; Teixeira, A.; Figueira, P.; Reis, A.T.; Almeida, J.; Vale, C.; Pereira, E. Simultaneous removal of trace elements from contaminated waters by living Ulva lactuca. Sci. Total Environ. 2019, 652, 880–888. [Google Scholar] [CrossRef]
  35. Gutiérrez, J.L.; Jones, C.G.; Strayer, D.L.; Iribarne, O.O. Mollusks as ecosystem engineers: The role of shell production in aquatic habitats. Oikos 2003, 101, 79–90. [Google Scholar] [CrossRef]
  36. Dias, J.M.; Rodrigues, M.; Leandro, S.; Morgado, F.; Oliveira, A.; Queiroga, H. Caracterização Sinóptica dos Gradientes Ambientais na Ria de Aveiro. In Parte I: Salinidade e Temperatura. Actas das Jornadas da Ria de Aveiro; 2, 3 e 4 de Maio de 2011; Almeida, A., Alves, F.L., Bernardes, C., Dias, J.M., Gomes, N.C.M., Pereira, E., Queiroga, H., Serôdio, J., Vaz, N., Eds.; Universidade de Aveiro, CESAM – Centro de Estudos do Ambiente e do Mar: Aveiro, Portugal, 2011; pp. 141–150, (In Portuguese). ISBN 9789727893379. [Google Scholar]
  37. Naidoo, G.; Naidoo, Y.; Achar, P. Ecophysiological responses of the salt marsh grass Spartina maritima to salinity. Afr. J. Aqua. Sci. 2012, 37, 81–88. [Google Scholar] [CrossRef]
  38. Davy, A.J.; Bishop, G.F.; Mossman, H.; Redondo-Gómez, S.; Castillo, J.M.; Castellanos, E.M.; Luque, L.; Figueroa, M.E. Biological flora of the British isles: Sarcocornia perennis (Miller) A.J. Scott. J. Ecol. 2006, 94, 1035–1048. [Google Scholar] [CrossRef]
  39. Calheiros, C.S.; Silva, G.; Quiterio, P.V.; Crispim, L.F.; Brix, H.; Moura, S.C.; Castro, P.M. Toxicity of high salinity tannery wastewater and effects on constructed wetland plants. Int. J. Phytoremediat. 2012, 14, 669–680. [Google Scholar] [CrossRef] [PubMed]
  40. Rhoades, J.; Kandiah, A.; Mashali, A. The use of saline waters for crop production. In Food and Agriculture Organization Irrigation and Drainage Paper No 48; Food and Agriculture Organization: Rome, Italy, 1992; p. 133. [Google Scholar]
  41. Gouveia, V.; Almeida, C.M.R.; Almeida, T.; Teixeira, C.; Mucha, A.P. Indigenous microbial communities along the NW Portuguese Coast: Potential for hydrocarbons degradation and relation with sediment contamination. Mar. Pollut. Bull. 2018, 131, 620–632. [Google Scholar] [CrossRef] [PubMed]
  42. Rocha, M.J.; Dores-Sousa, J.L.; Cruzeiro, C.; Rocha, E. PAHs in water and surface sediments from Douro River estuary and Porto Atlantic coast (Portugal)-impacts on human health. Environ. Monit. Assess. 2017, 189, 425. [Google Scholar] [CrossRef] [PubMed]
  43. Adeniji, A.O.; Okoh, O.O.; Okoh, A.I. Petroleum hydrocarbon profiles of water and sediment of algoa Bay, eastern cape, South Africa. Int. J. Environ. Res. Public Health 2017, 14, 1263. [Google Scholar] [CrossRef] [Green Version]
  44. Akhbarizadeh, R.; Moore, F.; Keshavarzi, B.; Moeinpour, A. Aliphatic and polycyclic aromatic hydrocarbons risk assessment in coastal water and sediments of Khark Island, SW Iran. Mar. Pollut. Bull. 2016, 108, 33–45. [Google Scholar] [CrossRef]
  45. Wattayakorn, G.; Rungsupa, S. Petroleum hydrocarbon residues in the marine environment of Koh Sichang-Sriracha, Thailand. Coast. Mar. Sci. 2012, 35, 122–128. [Google Scholar]
  46. Li, Y.; Zhao, Y.; Peng, S.; Zhou, Q.; Ma, L.Q. Temporal and spatial trends of total petroleum hydrocarbons in the seawater of Bohai Bay, China from 1996 to 2005. Mar. Pollut. Bull. 2010, 60, 238–243. [Google Scholar] [CrossRef]
  47. Wang, D.G.; Alaee, M.; Byer, J.; Liu, Y.J.; Tian, C.G. Fugacity approach to evaluate the sediment-water diffusion of polycyclic aromatic hydrocarbons. J. Environ. Monit. 2011, 13, 1589–1596. [Google Scholar] [CrossRef]
  48. Abdel-Shafy, H.I.; Mansour, M.S.M. A review on polycyclic aromatic hydrocarbons: Source, environmental impact, effect on human health and remediation. Egypt. J. Pet. 2016, 25, 107–123. [Google Scholar] [CrossRef] [Green Version]
  49. Redondo-Gómez, S.; Wharmby, C.; Castillo, J.M.; Mateos-Naranjo, E.; Luque, C.J.; de Cires, A.; Luque, T.; Davy, A.J.; Figuero, M.E. Growth and photosynthetic responses to salinity in an extreme halophyte, Sarcocornia fruticose. Physiol. Plant. 2006, 128, 116–124. [Google Scholar] [CrossRef]
  50. Grigore, M.N.; Villanueva, M.; Boscaiu, M.; Vicente, O. Do halophytes really require salts for their growth and Development? An experimental approach. Not. Sci Biol. 2012, 4, 23–29. [Google Scholar] [CrossRef] [Green Version]
  51. Von Ammon, U.; Wood, S.A.; Laroche, O.; Zaiko, A.; Tait, L.; Lavery, S.; Inglis, G.; Pochon, X. The impact of artificial surfaces on marine bacterial and eukaryotic biofouling assemblages: A high-throughput sequencing analysis. Mar. Environ. Res. 2018, 133, 57–66. [Google Scholar] [CrossRef] [PubMed]
  52. Lucke, T.; Walker, C.; Beecham, S. Experimental designs of field-based constructed floating wetland studies: A review. Sci. Total Environ. 2019, 660, 199–208. [Google Scholar] [CrossRef] [PubMed]
  53. Antunes, J.T.; Sousa, A.G.G.; Azevedo, J.; Rego, A.; Leão, P.N.; Vasconcelos, V. Distinct temporal succession of bacterial communities in early marine biofilms in a Portuguese Atlantic Port. Front. Microbiol. 2020, 11. [Google Scholar] [CrossRef]
  54. Oliveira, V.; Gomes, N.C.; Cleary, D.F.; Almeida, A.; Silva, A.M.; Simoes, M.M.; Silva, H.; Cunha, A. Halophyte plant colonization as a driver of the composition of bacterial communities in salt marshes chronically exposed to oil hydrocarbons. FEMS Microbiol. Ecol. 2014, 90, 647–662. [Google Scholar] [CrossRef] [PubMed] [Green Version]
  55. Zhang, W.; Ding, W.; Li, Y.X.; Tam, C.; Bougouff, S.; Wang, R.; Pei, B.; Chiang, H.; Leung, P.; Lu, Y. Marine biofilms constitute a bank of hidden microbial diversity and functional potential. Nat. Commun. 2019, 10, 517. [Google Scholar] [CrossRef]
  56. Briand, J.F.; Djeridi, I.; Jamet, D.; Coupe, S.; Bressy, C.; Molmeret, M.; Le Berre, B.; Rimet, F.; Bouchez, A.; Blache, Y. Pioneer marine biofilms on artificial surfaces including antifouling coatings immersed in two contrasting French Mediterranean coast sites. Biofouling 2012, 28, 453–463. [Google Scholar] [CrossRef]
  57. Muthukrishnan, T.; Abed, R.M.; Dobretsov, S.; Kidd, B.; Finnie, A.A. Long-term microfouling on commercial biocidal fouling control coatings. Biofouling 2014, 30, 1155–1164. [Google Scholar] [CrossRef]
  58. De Tender, C.; Devriese, L.I.; Haegeman, A.; Maes, S.; Vangeyte, J.; Cattrijsse, A.; Dawyndt, P.; Ruttink, T. Temporal dynamics of bacterial and fungal colonization on plastic debris in the North Sea. Environ. Sci. Technol. 2017, 51, 7350–7360. [Google Scholar] [CrossRef]
  59. Poehlein, A.; Yutin, N.; Daniel, R.; Galperin, M.Y. Proposal for the reclassification of obligately purine-fermenting bacteria Clostridium acidurici (Barker 1938) and Clostridium purinilyticum (Durre et al. 1981) as Gottschalkia acidurici gen. nov. comb. nov. and Gottschalkiapurinilytica comb. nov. and of Eubacterium angustum (Beuscher and Andreesen 1985) as Andreesenia angusta gen. nov. comb. nov. in the family Gottschalkiaceae fam. nov. Int. J. Syst. Evol. Microbiol. 2017, 67, 2711–2719. [Google Scholar]
  60. Nedashkovskaya, O.I.; Kim, S.B.; Han, S.K.; Lysenko, A.M.; Rohde, M.; Rhee, M.S.; Frolova, G.M.; Falsen, E.; Mikhailov, V.V.; Bae, K.S. Maribacter gen. nov., a new member of the family Flavobacteriaceae, isolated from marine habitats, containing the species Maribacter sedimenticola sp. nov., Maribacter aquivivus sp. nov., Maribacter orientalis sp. nov. and Maribacter ulvicola sp. nov. Int. J. Syst. Evol. Microbiol. 2004, 54, 1017–1023. [Google Scholar] [CrossRef] [PubMed]
  61. Kessler, R.W.; Weiss, A.; Kuegler, S.; Hermes, C.; Wichard, T. Macroalgal-bacterial interactions: Role of dimethylsulfoniopropionate in microbial gardening by Ulva (Chlorophyta). Mol. Ecol. 2018, 27, 1808–1819. [Google Scholar] [CrossRef] [PubMed]
  62. Khan, S.T.; Fukunaga, Y.; Nakagawa, Y.; Harayama, S. Emended descriptions of the genus Lewinella and of Lewinella cohaerens, Lewinella nigricans and Lewinella persica, and description of Lewinella lutea sp. nov. and Lewinella marina sp. nov. Int. J. Syst. Evol. Microbiol. 2007, 57, 2946–2951. [Google Scholar] [CrossRef] [PubMed] [Green Version]
  63. McIlroy, S.J.; Nielsen, P.H. The family saprospiraceae. The Prokaryotes: Other Major Lineages of Bacteria and the Archaea; Rosenberg, E., DeLong, E.F., Lory, S., Stackebrandt, E., Thompson, F., Eds.; Springer: New York, NY, USA, 2014; pp. 863–889. [Google Scholar]
  64. Wang, M.; Chen, J.-K.; Li, B. Characterization of bacterial community structure and diversity in rhizosphere soils of three plants in rapidly changing salt marshes using 16S rDNA. Pedosphere 2007, 17, 545–556. [Google Scholar] [CrossRef]
Figure 1. (A) Schematic representation of the study area, (B) photo of the marina of the Porto Cruise Terminal. Floating wetland island location.
Water 12 03273 g001
Figure 2. Floating wetland island design: (A) Floating platform modules; (B) detail of the cable responsible for the anchoring system; (C) joints between modules; (D) plants setup.
Water 12 03273 g002
Figure 3. Floating wetland island in the marina of the Porto Cruise Terminal.
Water 12 03273 g003
Figure 4. Macrofauna found on or surrounding the floating wetland island: (A) Polychaeta; (B) Chthamalus sp.; (C) Mytilus sp.; (D) Ulva sp.; (E) Ceramium sp.; (F) Patella sp.; (G) Palaemon sp.; (H) Laminaria sp. (left elypse) and Mugil sp. (right elypse); (I) Mytilus sp.
Water 12 03273 g004
Figure 5. (A) Maximum electron transport rate (ETRm); (B) the Fv/Fm ratio and (C) the quantum efficiency of photosynthesis (α) registered for Sarcocornia perennis (mean ± SD, n = 4) for four different months of 2018 and 2019. The different letters placed on the bars show the statistically significant differences (p < 0.05) between months.
Water 12 03273 g005
Figure 6. Alpha-diversity metrics (Shannon diversity index and richness–observed number of genera): (A) across all the individual samples; (B) comparison between type of samples. Brown bars represent the biofouling samples from the floating platform (H = non-planted holes and U = Under surface), green bars represent the biofilm samples from the planting media (SP = Spartina maritima; SA = Sarcocornia perennis; and P = Phragmites australis) and blue bars represent the water samples (W); S18 = Summer of 2018; W19 = Winter of 2019 and SP19 = Spring of 2019. The different letters placed on the bars show the statistically significant differences (p < 0.05) between the type of samples.
Water 12 03273 g006
Figure 7. Taxonomic profile of top 20 prokaryotic taxa at lower level (genus) in each type of samples (biofouling from the floating platform, biofilm from the planting media and water). Top 20 represents 33% of the total sequences dataset. Codes: biofouling samples from the floating platform (H = non-planted holes and U = under surface); biofilm samples from the planting media (SP = Spartina maritima; SA = Sarcocornia perennis; and P = Phragmites australis) and water samples (W); S18 = Summer of 2018; W19 = Winter of 2019 and SP19 = Spring of 2019.
Water 12 03273 g007
Figure 8. axonomic profile of top 10 prokaryotic taxa at higher level (phylum) across all samples. Top 10 represents 91% of the total sequences dataset. Samples considered: biofouling samples from the floating platform; biofilm samples from the planting media and water samples.
Water 12 03273 g008
Figure 9. Principal coordinate analysis (PCoA) based on Bray–Curtis dissimilarity of all the samples analyzed: brown points represent biofouling samples collected from the floating platform; green points represent the biofilm samples from the planting media and blue points represent samples from the water. Codes: biofouling samples from the surface of the floating platform (H = non-planted holes and U = Under surface); biofilm samples from the planting media (SP = Spartina maritima; SA = Sarcocornia perennis; and P = Phragmites australis) and water samples (W); S18 = Summer of 2018; W19 = Winter of 2019 and SP19 = Spring of 2019.
Water 12 03273 g009
Table 1. Water characterization of the seawater marina of the Porto Cruise Terminal along the experimental time (2018/2019)
Date (year/month)Water Parameters
Temp.
(°C)
Cond.
(mS/cm)
Salinity
(ppt)
pHPO43−
(mg/L)
NH4+
(mg/L)
NO2
(mg/L)
NO3
(mg/L)
TPHs
(mg/L)
COD
(mg/L)
2018April15.447.430.78.030.090.140.051.35<d.l.135
May14.049.332.17.860.130.190.082.20<d.l.210
June15.347.330.47.930.110.070.051.00<d.l.270
July19.844.928.88.250.070.060.030.83<d.l.150
August18.546.630.08.210.100.050.030.38<d.l.210
September17.248.831.67.890.530.340.031.27<d.l.375
2019January13.851.833.58.370.12<d.l.0.041.316630
February13.151.733.38.330.110.160.040.935225
March13.554.235.18.090.130.140.041.36<d.l.435
April14.144.328.18.100.170.590.313.91<d.l.360
May15.249.732.07.970.310.680.223.03<d.l.330
June16.353.234.68.050.150.300.081.134375
Obs: d.l. detection limit: NH4+ = 0.01 mg/L; TPHs = 2 mg/L.
Publisher’s Note: MDPI stays neutral with regard to jurisdictional claims in published maps and institutional affiliations.

