Article

Experimental and Numerical Evaluation of Hydraulic Fracturing under High Temperature and Embedded Fractures in Large Concrete Samples

1
College of Water Resources Science and Engineering, Taiyuan University of Technology, Taiyuan 030024, China
2
Shanxi Academy for Environmental Planning, Taiyuan 030002, China
3
College of Construction Engineering, Jilin University, Changchun 130026, China
4
No.1 Institute of Geology and Mineral Resources of Shandong Province, Jinan 250014, China
*
Author to whom correspondence should be addressed.
Water 2020, 12(11), 3171; https://doi.org/10.3390/w12113171
Submission received: 14 September 2020 / Revised: 3 November 2020 / Accepted: 11 November 2020 / Published: 13 November 2020
(This article belongs to the Section Hydraulics and Hydrodynamics)

Abstract

:
In order to study the mechanism of hydraulic fracturing in enhanced geothermal systems, we analyzed the influence of high temperatures and embedded fractures on the initiation and propagation of hydraulic fractures using a laboratory test and numerical simulation. The analysis was conducted via large-scale true triaxial hydraulic fracturing tests with acoustic emission monitoring. Moreover, we discussed and established the elastic-plastic criterion of hydraulic fracturing initiation. The corresponding fracturing procedure was designed and embedded into the FLAC3D software. Then, a numerical simulation was conducted and compared with the laboratory test to verify the accuracy of the fracturing procedure. The influence of high temperatures on hydraulic fracturing presented the following features. First, multi-fractures were created, especially in the near-well region. Second, fracturing pressure, extension pressure, and fracture flow resistance became larger than those at room temperature. 3D acoustic fracturing emission results indicated that the influence of the spatial distribution pattern of embedded fractures on hydraulic fracturing direction was larger than that of triaxial stress. Furthermore, the fracturing and extension pressures decreased with the increase of embedded fracture density. For hydraulic fracturing in a high temperature reservoir, a plastic zone was generated near the borehole, and this zone increased as the injection pressure increased until the well wall failed.

1. Introduction

An enhanced geothermal system (EGS) is an engineered system that adopts artificial circulating water through an underground fractured hot dry rock (HDR) to economically extract the geothermal energy. HDR possess low porosity and permeability, containing large amounts of thermal energy that can be used for space heating and electricity generation [1,2]. However, obtaining an economical thermal fluid by relying solely on seepage through natural fracture or rock porosity due to low permeability is difficult. Therefore, to develop thermal energy from HDR, scientists have proposed many ideas to enhance HDR conductivity through artificial stimulation (e.g., heat, mechanical energy, chemistry, and explosion) to circulate water through a heat reservoir. EGS tests began in 1974 when a heat mining experiment was conducted on the HDR resource at Fenton Hill. This pioneering field test proved that the heat from HDR resources can be successfully exploited [3]. Inspired by the Fenton Hill test, many EGS projects were subsequently conducted in different parts of the world, including the United Kingdom (Rosemanowes), Germany (Falkenberg, Urach), France (Le Mayet, Soultz), Japan (Ogachi, Hijiori), Australia (Cooper Basin, Hunter Valley), the United States (Desert Peak, Coso), and South Korea (Pohang) [3,4]. In addition, some volcanic-hosted hydrothermal systems with high temperatures are also ideal selections for EGSs [5]. More than 25 deep wells drilled in geothermal fields such as the Geysers, Salton Sea, and on Hawaii (USA), Kakkonda (Japan), Larderello (Italy), Krafla (Iceland), Los Humeros (Mexico), and Menengai (Kenya). They have encountered temperatures in excess of 374 °C, and in some cases have encountered magma [6].
Reservoir stimulation and thermal extraction are two critical EGS technologies. The main method of reservoir stimulation is hydraulic fracturing. Understanding the regularity of hydraulic fracture initiation and extension is crucial when studying the geometry and permeability of the created fracture under different geological conditions, and such an understanding determines the heat exchange effect. There are many factors that affect hydraulic fracturing treatment; i.e., formation in situ stresses, fracturing fluid properties, proppant, pumping rate, reservoir fluid, and rock properties [7]. For predictive modeling, these factors are associated with many uncertainties [8]. Successful decision-making for execution of hydraulic fracturing projects requires a higher level of integration of technical, commercial, and uncertainty analyses. Quantification and understanding the associated risks and uncertainty provides grounds for determining whether a particular hydraulic fracturing job can be commercially feasible or not [9]. Hydraulic fracturing in deep formations is a complicated physical process because of the coupling of multiple physical fields [10,11]. Moreover, direct observation of the actual geometry of hydraulic fractures is difficult, and researchers can only indirectly analyze numerical models by adopting various assumptions and simplified conditions. Using a numerical model is appropriate, but large errors are frequently caused by the limited mechanism of fracture extension. Therefore, simulation experiments on hydraulic fracturing have become important means to understand the hydraulic fracture extension mechanism. Fracture simulation under the conditions of real formation using the scale law facilitates the monitoring of the actual physical process of fracture propagation and direct observation of the fracture shape. Therefore, understanding the hydraulic fracture propagation mechanism in a specific formation and establishing a realistic numerical model are important.
Jia et al. [12] conducted a detailed literature review of this issue. Several types of hydraulic fracturing tests are presently available. The first type is macroscopic testing of hydraulic fracture morphology. The French Petroleum Institute uses transparent materials, such as Plexiglas, as samples to observe the process and form of fractures directly [13]. Thiercelin et al. [14] used a high-speed camera to capture the crack expansion process and analyzed its expansion velocity. Luis [15] conducted a hydraulic fracturing test on large (0.762 m × 0.762 m × 0.914 m) Colton sandstone with high elastic modulus and low permeability. The length and height of the created fracture were directly measured after the test because the fracturing fluid was added with a red stain. Bauer et al. [16] provided a physics-based understanding of a shear stimulation phenomenon (hydroshearing) and its evolution during stimulation and conducted laboratory-based experimental and numerical analyses. The second type of test involves the effect of interfacial properties on the vertical extension of fractures. If a hydraulic fracture intersects with the interface, the fracture may pass, stay, or turn. Anderson [17] and Teufel et al. [18] studied fracture extension under different friction conditions and interfaces by using samples made of two types of materials. The third type of test involves the effect of layered media on the vertical expansion of fractures. Most studies that used this type of test, such as [15,19], focused on the influence of the difference in horizontal in situ stress, elastic modulus, and fracture toughness between the fracturing layer and interlayer on vertical fracture extension. The fourth type of test is the simulation study of multi-fracture propagation. Papadopoulos [20] used a cement sample to study the expansion and interaction of two fractures in the fracturing process. Daneshy [21] used a rock sample with a weak surface to study fracture extension. The results showed that the existence of a small closed weak surface (or crack) does not change the fracture trend, but the presence of a large open crack does. The fifth type of test involves research on the flow characteristics of the fracturing fluid in fractures. Oklahoma University built a large-scale fracture activity simulator to study the flow characteristics of the fracturing fluid in the seam [22]. The device can change the geometry of the fracture and uses laser and optical fiber technology to study small details. The research team accurately predicted the flow of the fracturing fluid and the migration of the proppant.
Although many experimental studies on hydraulic fracturing have been conducted, these studies focused on oil and gas extraction. The EGS reservoir possesses high temperature and high pressure compared with traditional oil fracturing. A high temperature and high pressure environment usually causes rocks to exhibit obvious plastic characteristics. In addition, water stimulation of the fractured network reservoir is the main method of HDR stimulation. Only a few experimental studies have been conducted on the effect of high temperature and fracture networks on fracking. Compared with a fracturing test on a small cylindrical sample, testing the hydraulic fracturing of large samples is more suitable for observing the 3D expansion process of a fracture combined acoustic emission (AE) technology.
In this study, firstly, the initiation and propagation criterions of hydraulic fracture based on the elastic-plastic mechanical theory are discussed and established. Secondly, the influence of high temperature and preset fractures on the initiation and propagation of hydraulic fractures was analyzed through a laboratory test. Then, a numerical fracturing procedure was designed and embedded into the FLAC3D software. Lastly, the numerical model is compared with the laboratory test to verify the accuracy of the fracturing procedure. The methodological flowchart is illustrated in Figure 1.

2. Initiation and Propagation Criterions of Hydraulic Fracture

Hydraulic fracturing can be divided into several processes: fracture was initiated from the borehole wall, the surrounding rocks were opened and moved, the hydraulic fracture was driven to the formation distance, and a residual aperture was left after the formation closed [10,11].

2.1. Hydraulic Fracture Initiation Criterion

Borehole fracturing with a long “cut window” can create a large artificial reservoir. Thus, the perforation case was not considered in this study. High temperature and high confining stress are the typical characteristics of EGS formations. The rock mechanical behavior in this condition exhibits a plastic characteristic [23,24,25].

2.1.1. Stress Distribution Patterns around the Borehole

Guo et al. [25] investigated the stress variations in hydraulic fracturing in high temperature formations. In this paper, several assumptions were set as follows: (1) the rock around the well is homogeneous and isotropic; (2) a circular borehole is considered a plane strain problem; (3) the chemical reaction between the rock and fracturing fluids is disregarded; and (4) the fracturing pattern is borehole fracturing.
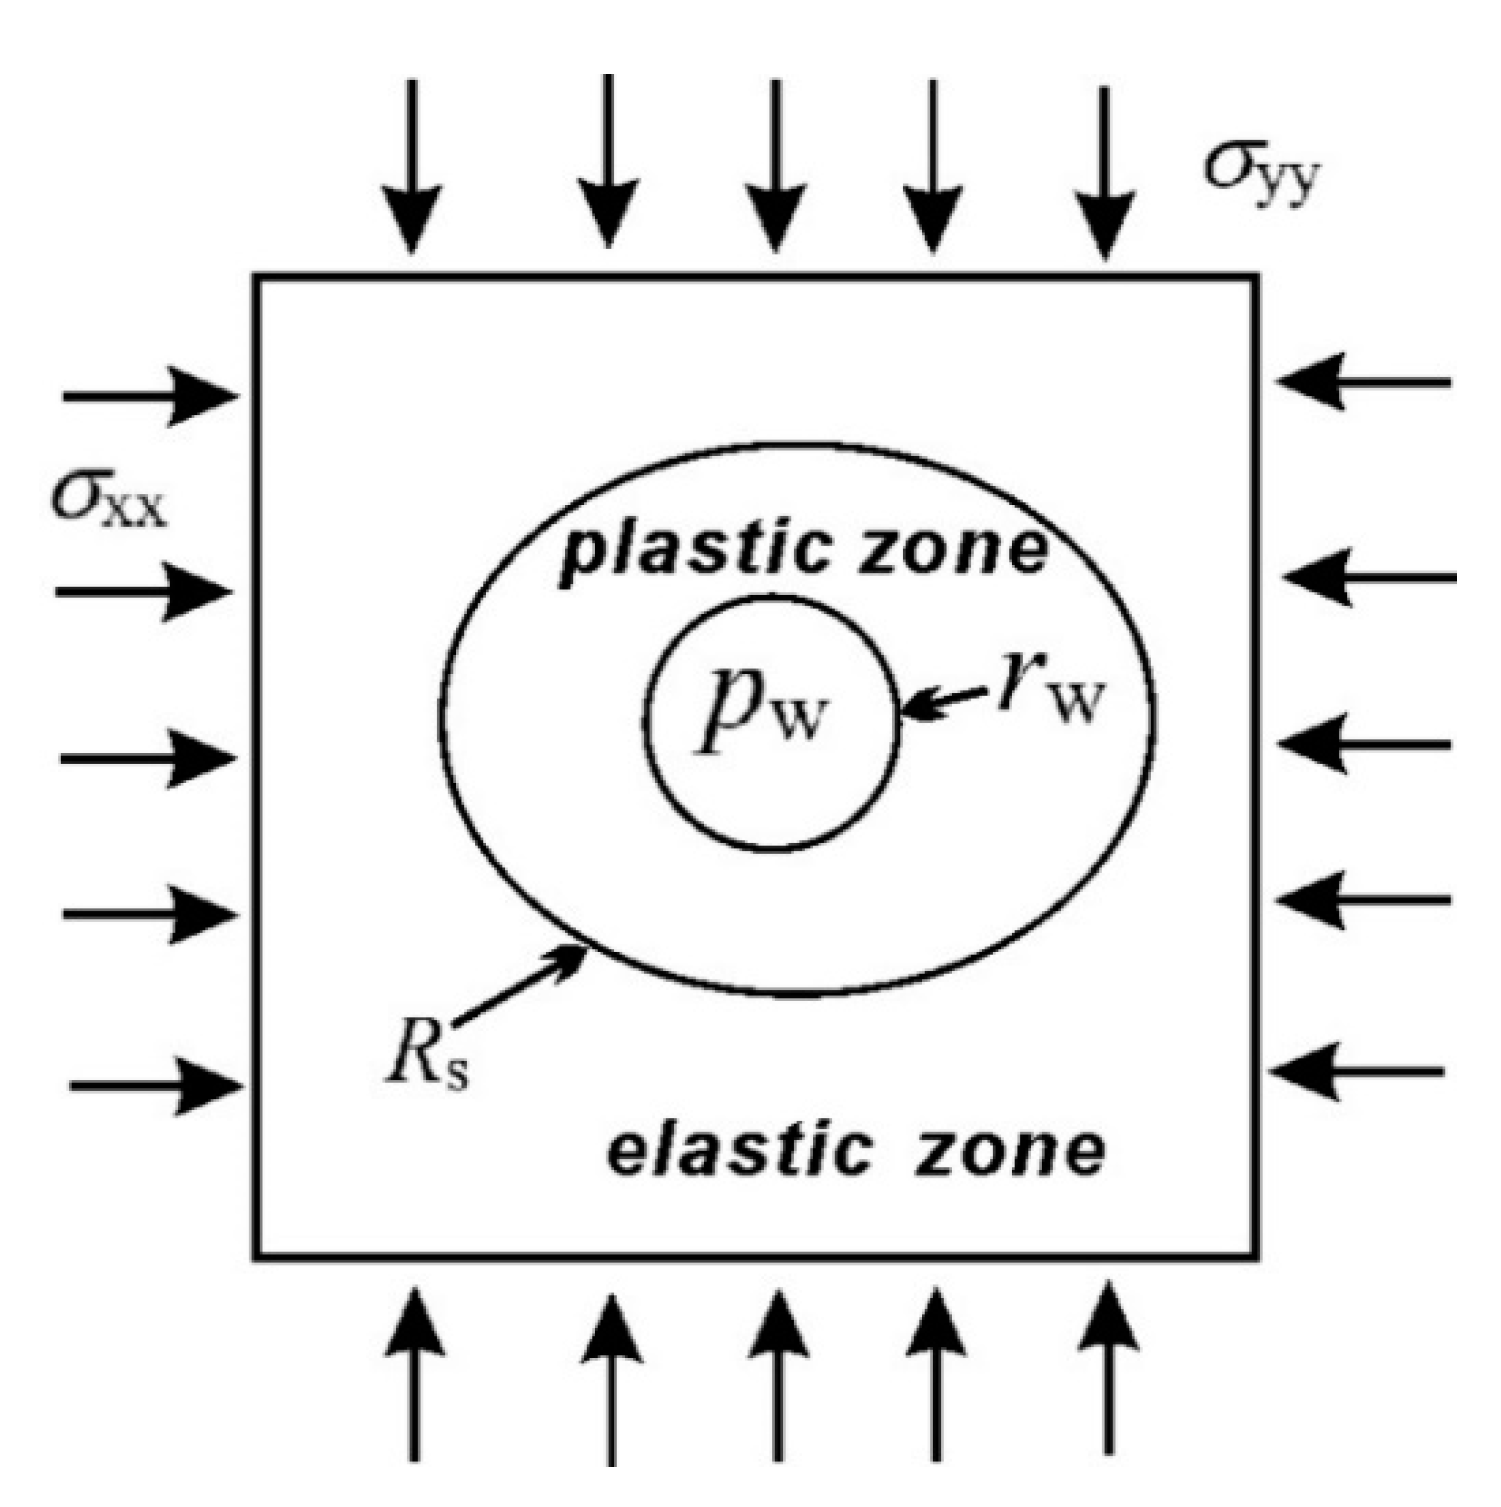
Figure 2 illustrates the stress zone variation around the borehole when high pressure fluids were injected. With continuous injection, the well expanded with the weakening borehole stress concentration, and a plastic zone was generated. The plastic zone also increased as the injection pressure increased until the well wall failed [25,26].
In consideration of the nonlinear deformation characteristics of rocks and the anisotropy of initial ground stress, an elastic–plastic well stress field distribution model using the total theory of plasticity was established as shown in Equations (1)–(4) [25,27].
σ r = { σ xx + σ yy 2 ( 1 R s 2 r 2 ) + σ xx σ yy 2 ( 1 4 R s 2 r 2 + 3 R s 4 r 4 ) cos 2 θ + R s 2 r 2 σ R s ,   r w R s r σ s 3 m ( R s r ) 2 m + B 1 , r w r R s
σ θ = { σ xx + σ yy 2 ( 1 + R s 2 r 2 ) σ xx σ yy 2 ( 1 + 3 R s 4 r 4 ) cos 2 θ + R s 2 r 2 σ R s , r w R s r σ s 3 m ( 1 m 2 ) ( R s r ) 2 m + B 1 ,   r w r R s
R s = { { p w 1 2 [ σ xx + σ yy 2 ( σ xx σ yy ) cos 2 θ 2 3 ( 1 m 1 ) σ s ] } 3 m σ s } 1 2 m r w
B 1 = 1 2 [ σ xx + σ yy 2 ( σ xx σ yy ) cos 2 θ 2 3 ( 1 m 1 ) σ s ] ,
where σxx and σyy are the maximum and minimum horizontal stresses, respectively, and θ is the well round angle. σRs is the radial stress at the edge of the plastic zone, Rs is the plastic zone radius, rw is the wellbore radius, r is the distance from the center of the well, pw is the water pressure inside the wellbore, σs is the yield stress, m is the stiffering exponent, and B1 is the integral constant.

2.1.2. Hydraulic Fracture Initiation Pattern

Given the variations in rock mechanical parameters and initial stress, two stress states (tensile and compressive) and two damage patterns (tensile and shear) may exist [25,28]. According to the linear elastic theory, when the injection begins, the well circumferential stress appears as tensile stress, and tensile damage occurs. However, tensile and shear damages may occur when the plastic zone is generated. Thus, three hydraulic fracture initiation patterns may exist based on the borehole rock stress state [28].
(1) Tensile damage (linear elastic state)
If the circum-well rock does not undergo plastic yield, tensile damage would occur when the minimum effective circumferential stress reaches the rock tensile strength.
(2) Tensile damage (plastic state)
When the circum-well rock undergoes plastic yield and tensile stress is not generated, the fracture initiation criterion is also the tensile damage.
(3) Shear damage (plastic state)
When the circum-well rock undergoes plastic yield and the circum-well stress state is compressive stress, shear damage occurs according to the Mohr–Coulomb criterion. The fracture is generated from the maximum horizontal stress point at the edge of the well.

2.1.3. Initiation Mode and Pressure

Based on the above discussions, the initiation mode and pressure can be determined as follows:
R s r w = { [ 2 3 ( 1 m 1 ) σ s + 2 p f eb ( 3 σ yy σ xx ) ] 3 m 2 σ s } 1 2 m
p f = { p f eb , R s / r w < 1 min ( p f pb , p f p τ ) , m > 0.5 , R s / r w 1 p f p τ , m 0.5 , R s / r w 1
{ p f eb = 3 σ yy σ xx α p s + σ t p f pb = 1 2 m 1 [ m ( 3 σ yy σ xx ) α p s + σ t 2 3 ( 1 m ) σ s ] p f p τ = N 1 N ( 2 m 1 ) [ m ( 3 σ yy σ xx ) 2 3 ( 1 m ) σ s + 1 N N α p s + σ 0 N ] N = 1 + sin ϕ 1 sin ϕ , σ 0 = 2 C cos ϕ 1 sin ϕ
where p f eb is the tensile initiation pressure when the circum-well rock does not undergo plastic yield. p f pb and p f p τ are the tensile and shear initiation pressures when the circum-well rock undergoes plastic yield, respectively. α is Biot coefficient, and σt is the tensile strength of rock.

2.2. Propagation Criteria of Hydraulic Fracture

After initiating from the borehole and being driven by the injection water, the hydraulic fracture continually ruptured the formation ahead of its tip zone and propagated forward into the far well region. Fracture length, height, and aperture changed simultaneously. To open the new formation, the required water pressure (PW) should be higher than the sum of minimum crustal stress (σh) and rock tensile strength (σt) [10,29]:
Pw > σt + σh
On the basis of linear elastic fracture mechanics, if the hydraulic fracture expands, the stress intensity factor (KI) around the fracture tip should be larger than its critical stress intensity factor (KIC, also known as fracture toughness):
KI > KIC
KIC can be obtained through a laboratory test. KI at any point around the fracture tip can be calculated as follows [29]:
K I = G 4 ( 1 ν ) ( 2 π r 1 ) 1 2 W ( r ) ,
where r1 is the distance between the fracture tip and the observed point and W(r) is the fracture aperture at the observed point.
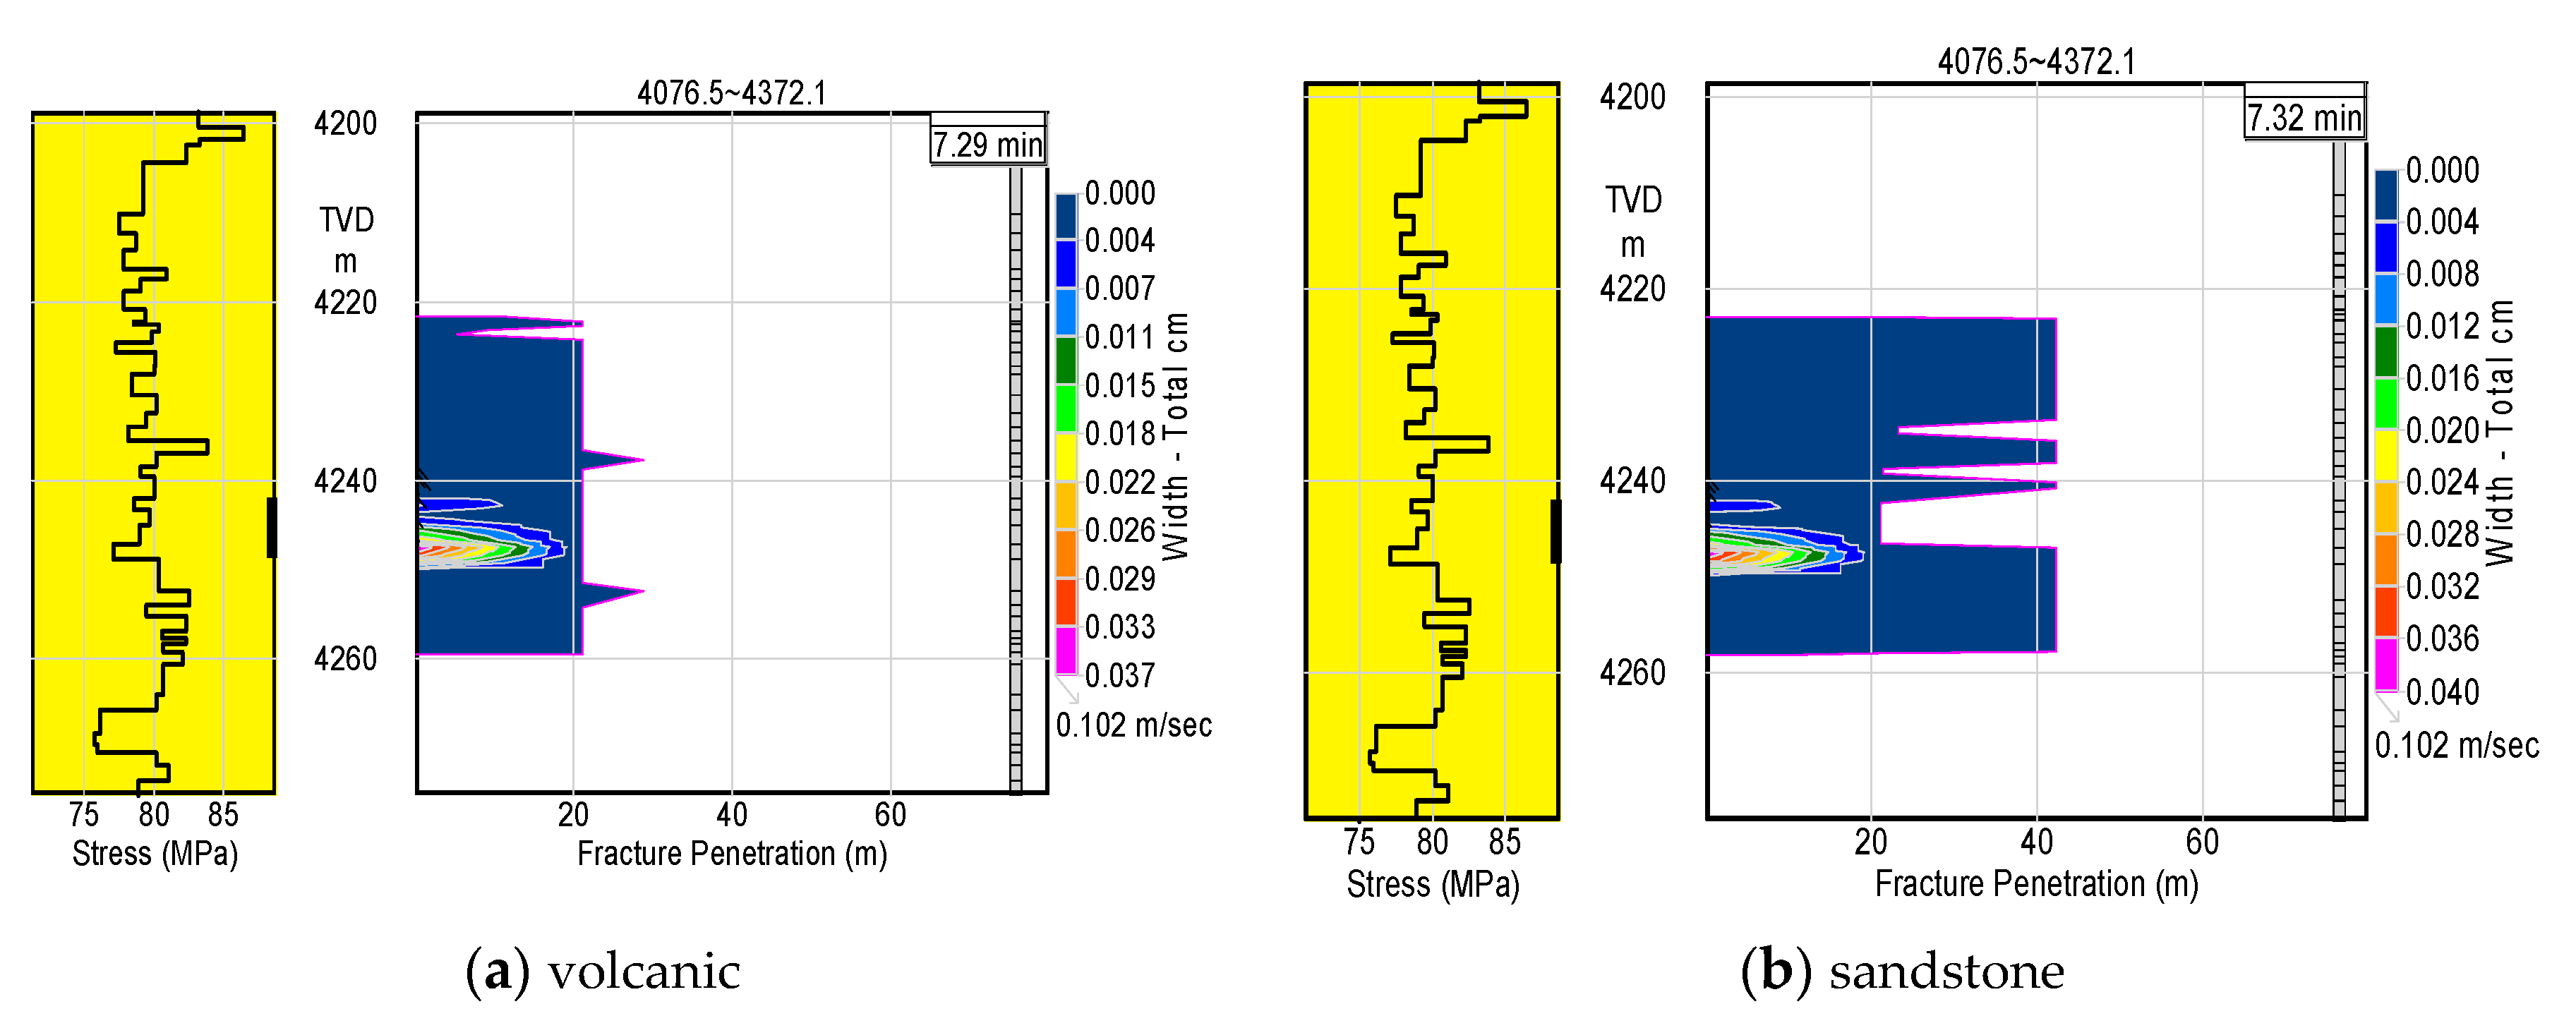
KIC exerts a large influence on the hydraulic fracture [11]. Figure 3 illustrates the difference in hydraulic fracture between volcanic and sandstone using the commercial fracturing software STIMPLAN [30]. The KIC of volcanic and sandstone were 7.0 and 1.0 MPa·m0.5, respectively. The length of the hydraulic fracture generated in the volcanic was nearly twice that of sandstone. Notably, the KIC of the formation rock is related to crustal stress and temperature of the in situ condition. In the process of hydraulic fracturing, the fracture will continue to extend forward only when both Equations (8) and (9) are met.

2.3. Mechanical Deformation of the Formation during Hydraulic Fracturing

The formation was opened by high pressure water and the two created fracture walls were pushed toward the sides. When the well was shut off, the high water pressure in the fracture gradually dissipated, and the walls eventually closed again. Given that the open fracture surface could not be completely smooth, a residual aperture remained after water fracturing [10,31]. Thus, the hydraulic fracture aperture value during the fracturing process was equal to the displacement sum of the two fracture walls [32].
Generally, a single bi-wing fracture is created in a tight rock formation, and a complex fracture network is generated in the naturally fractured layers. Thus, the development mechanism of the single fracture is the basis of the complex fracture network. In this study, the mechanical option in FLAC3D is used to describe rock deformation. However, its theory is based on continuum mechanics, which implies that the geometric model has no real fracture [31]. Zhou et al. [32] found that the stress redistribution patterns after tensile failure and those displayed by the linear elastic model with a change in σ3 are similar (Equations (11)–(14)). The Δσ3 should be replaced with the overloaded stress (σ3σt) at tensile failure.
σ 3 N = σ 3 O   +   Δ σ 3
σ 1 N = σ 1 O α 2 α 1 Δ σ 3
σ 2 N = σ 2 O α 2 α 1 Δ σ 3
Δ w = P f σ 3 α 1
where K is the bulk modulus (Pa), G is the shear modulus, ε is the strain, σ is the stress, Pf is the fluid pressure in the fracture, N denotes “new”, O denotes “old”, and α1 = K + 4G/3 and α2 = K − 2G/3 are elastic parameters.

2.4. Numerical Realization of Hydraulic Fracturing

In this study, a bi-wing fracturing code combined with the FLAC3D software is used to simulate the hydraulic fracture. The created fracture could be used as the water circulation channel in the EGS reservoir. The above initiation mode, pressure and propagation criteria of hydraulic fracture are programmed and inserted into the FLAC3D software. The mechanical option in FLAC3D is used to describe rock deformation and to calculate the fracture width. Relevant literature are [2,31]. The specific calculation process is as follows:
(1) The reservoir in situ stress direction was determined and the model x–z plane was made perpendicular to the minimum principal stress direction.
(2) The value of in situ stress and rock mechanical parameters was substituted into the fracture initiation criteria (Equations (5)–(7)) to distinguish the initiation pattern and obtain initiation pressure Pf.
(3) KI at the fracture tip was calculated based on Equation (10), and KIC and σt were obtained through reservoir core tests.
(4) A constant injection flow rate was adopted. For the injection elements, when PwPf, the fracture did not initiate, and its aperture was set to 0 mm.
(5) When Pw > Pf, the fracture was initiated. When Pw > σt + σh and KI > KIC, the element was transformed from “rock” to “fracture.” Its aperture was calculated using Equation (14) [33], and its permeability along the x − z plane was corrected to be Tw, which was calculated using Equation (15). When Pwσt + σh or KIKIC, the fracture did not extend, and its aperture was set to 0 mm.
Tw=(fw)2/(12μ),
where f is a parameter that reflects the influence of roughness on transmissivity, μ denotes viscosity, w and Tw indicate the aperture and permeability of the fracture, respectively.
(6) After fracturing, when Pw > Pf, the fracture aperture was calculated using Equation (15). When PwPf, the fracture aperture was set to be constant at 0.5 mm.

3. Large-Scale Hydraulic Fracturing Experiments

3.1. Experimental System

Experiments were conducted with the large-size true triaxial hydraulic fracturing experiment system for HDR proposed by the National High Technology Research and Development Program of China (863 Program) (NO. 2012AA052801). The main purpose of this system is to study the hydraulic fracturing law under different conditions to support EGS development in China. A large sample can provide more space for fracture extension to observe the extension law compared with a small sample. In addition, more than 20 embedded fractures can be arranged to study the effect of the fracture network on hydraulic fracture.
Figure 4 shows a schematic of the system. It consists of five main parts: fracturing bin, temperature control system, AE system, computer control system, and other ancillary devices.
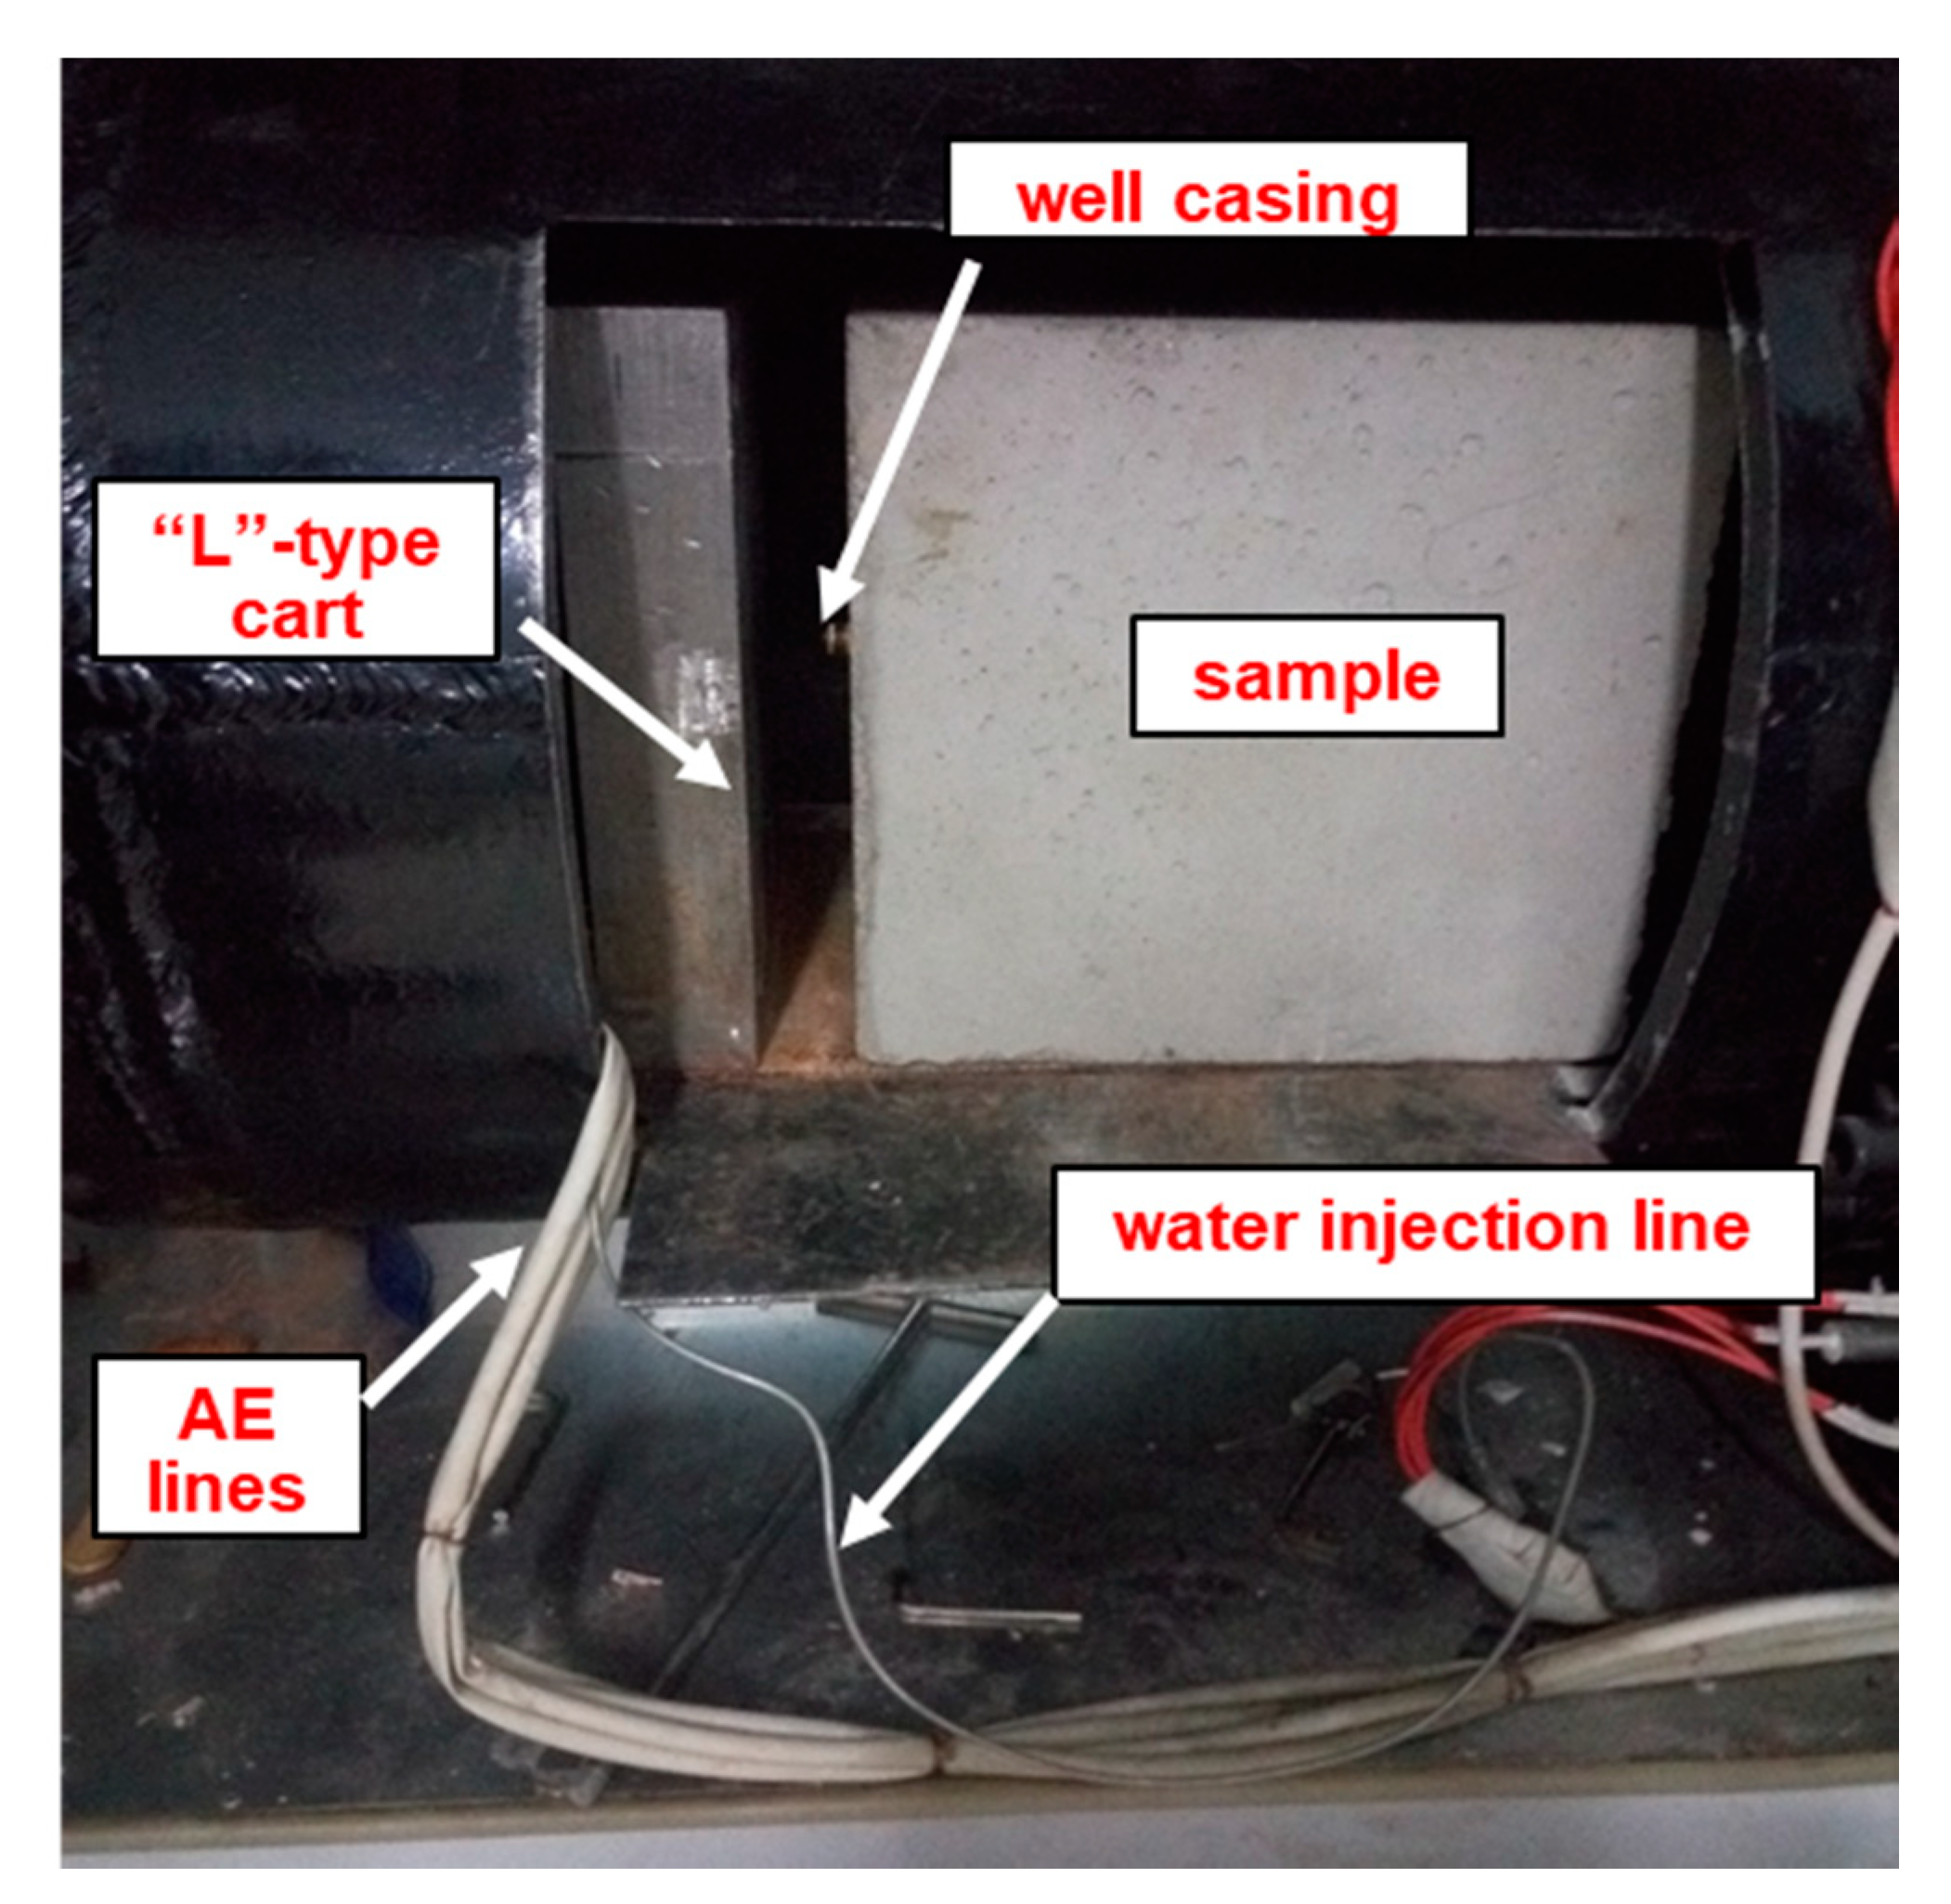
The fracturing bin consists of a sample load device, fracturing device, and injection pump. The sample load device is an “L”-type cart. The water injection point is a circular hole (diameter = 1.5 cm) in the middle of the cart side face. Water is injected through the circular hole into the well casing of the rock sample, as shown in Figure 5.
The fracturing device contains three active iron blocks to simulate true triaxial fracturing on the x, y, and z axes. Three force pumps push the iron block to compress the sample. The design pressure is 60 MPa. The y axis is parallel to the well casing.
An Isco pump was utilized as the injection pump. The maximum pump pressure is 70 MPa and the maximum flow rate is 60 mL/min. The variation curve of the injection pressure of the Isco pump is shown in the fracturing control system. The pump has two cavities (A and B) that can circulate water alternately to ensure continuous flow (constant rate or pressure) during the experiment. Water fracturing was adopted to avid contaminating the pump. The coloring agent and viscous fluid were loaded into coloring agent bins (volume = 2 L, as shown in Figure 4 front), which were arranged between the end of the water injection line and the “L” type cart.
The temperature control system controls the heating of the fracturing bin and incubator. The maximum temperature can reach 200 °C. Incubator heating was achieved by installing a heater strip in the upper part of the incubator. Heating of the fracturing bin was realized by embedding 24 heater probes into the eight corners of the bin (Figure 4 front). Incubator heating ensured that the environment temperature was equal to that of the sample (Figure 4 back).
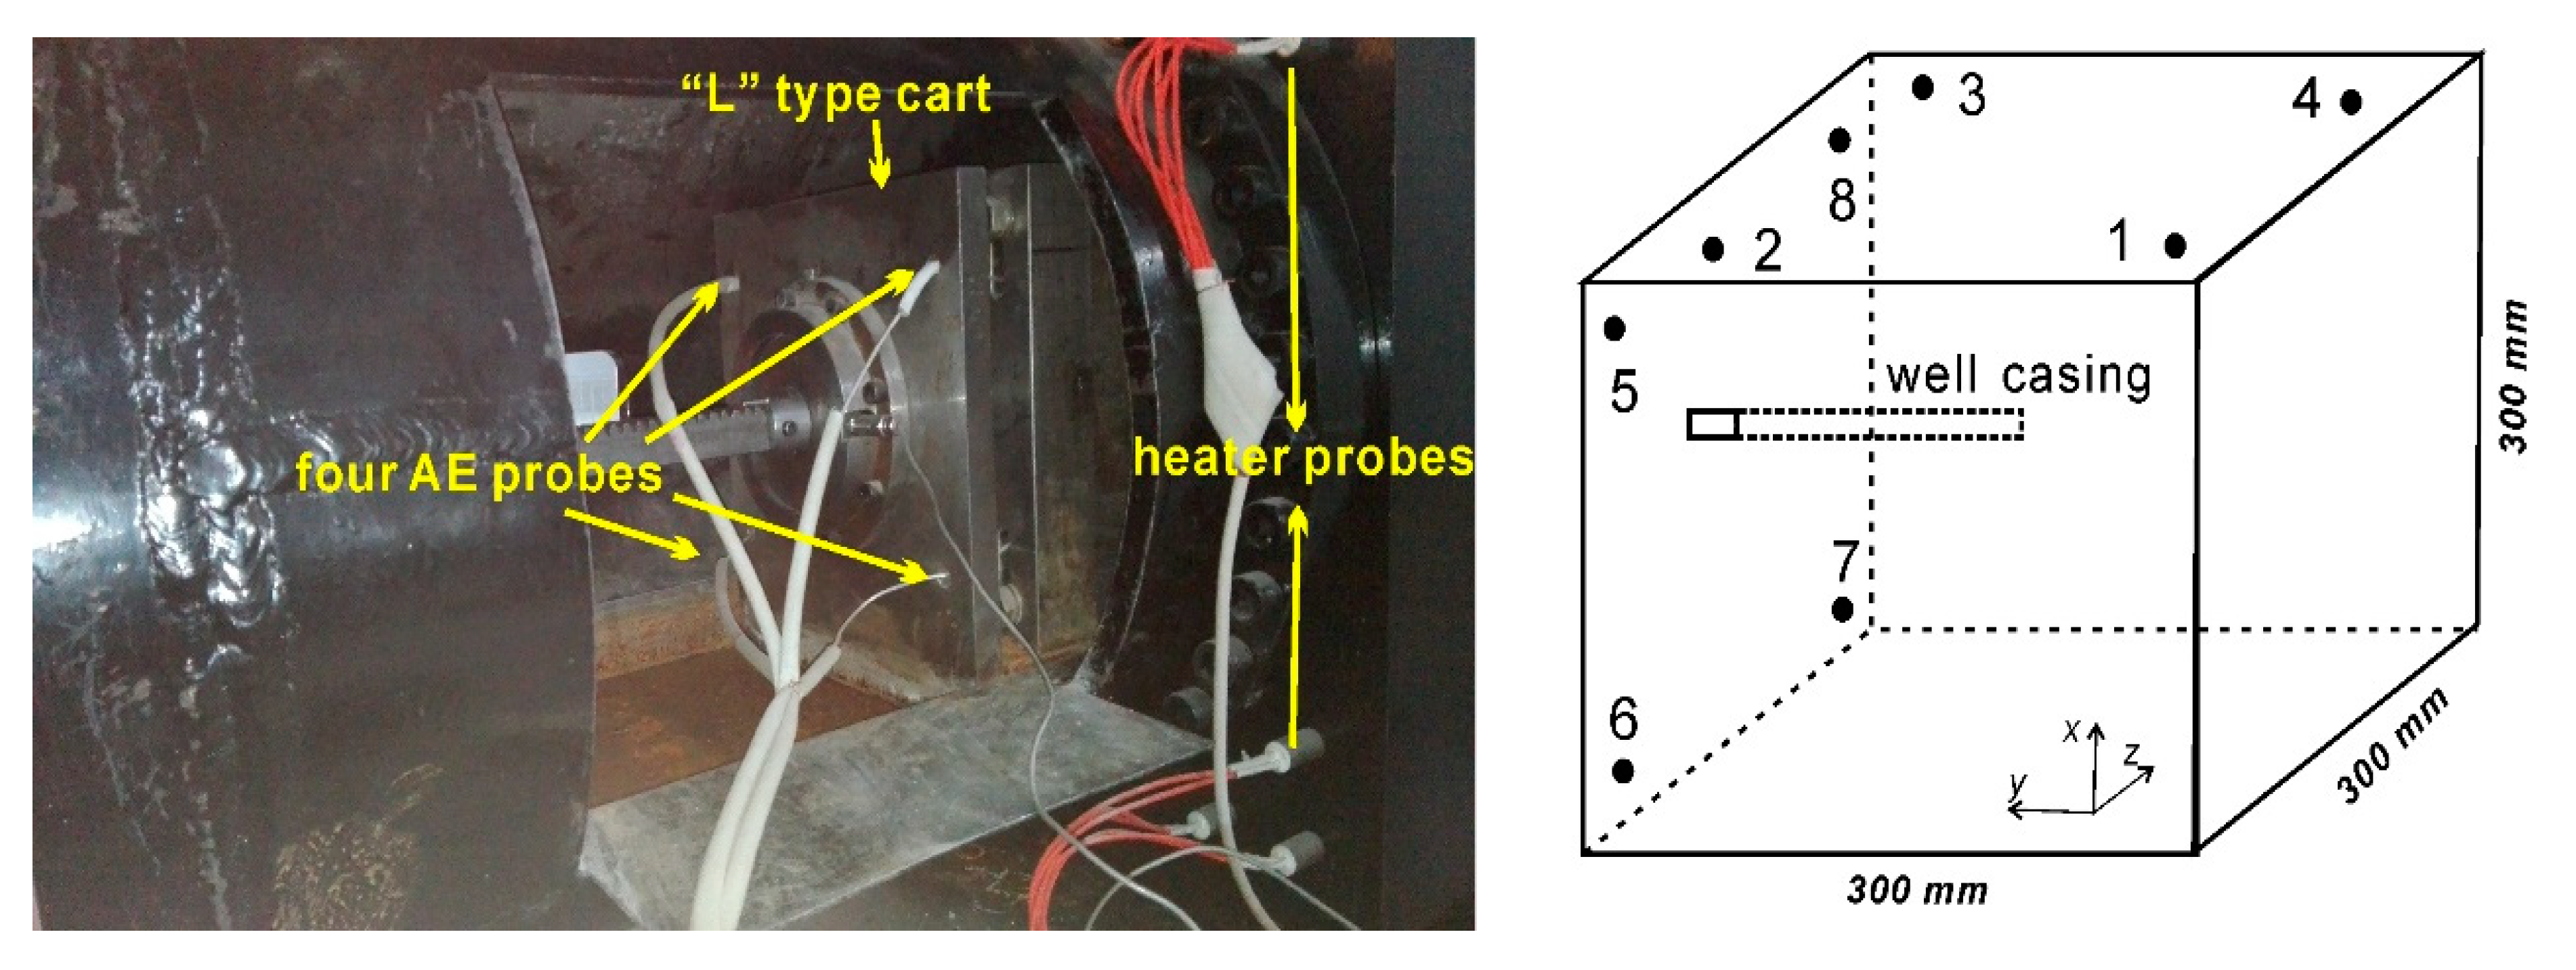
The AE system contained eight probes for real-time monitoring of the propagation process of hydraulic fracture. Four probes were set in the corners of the upper active iron block, and the remaining probes were set in the side corners of the “L”-type cart, as shown in Figure 6.
The computer control system consisted of 3D AE and fracturing control systems. The latter could automatically control the three confining pressures and display the fracture pressure variation in real time. Table 1 shows the main technical parameters of the equipment.

3.2. Experimental Design and Sample Preparation

In this experiment, all samples were artificially casted concrete samples. It was more conducive to embed multiple fractures than the rock samples. The experiment mold, which was provided by the manufacturer, was assembled with five iron plates. Each plate was approximately 8 mm thick, the internal dimension was about 300 mm × 300 mm × 300 mm, and the well casing was inserted in the middle of the bottom plate. A balloon filled with salt was used to simulate the bare hole at the bottom of the well casing. The researchers from the Department of Structural Engineering of Jilin University helped us finish the casting. The samples were casted with cement, fine sand, gravel, and water. Their mass ratio is 2.3:3.7:1.2:1, which could ensure a high strength of the sample. Moreover, stirrer and vibrating screen were used to enable the sample to be highly dense. Oil was utilized to lubricate all internal surfaces of the mold for easy demolding. The samples were maintained for 12 h at room temperature and subsequently demolded. Afterward, the samples were maintained for 28 d at 25 °C.
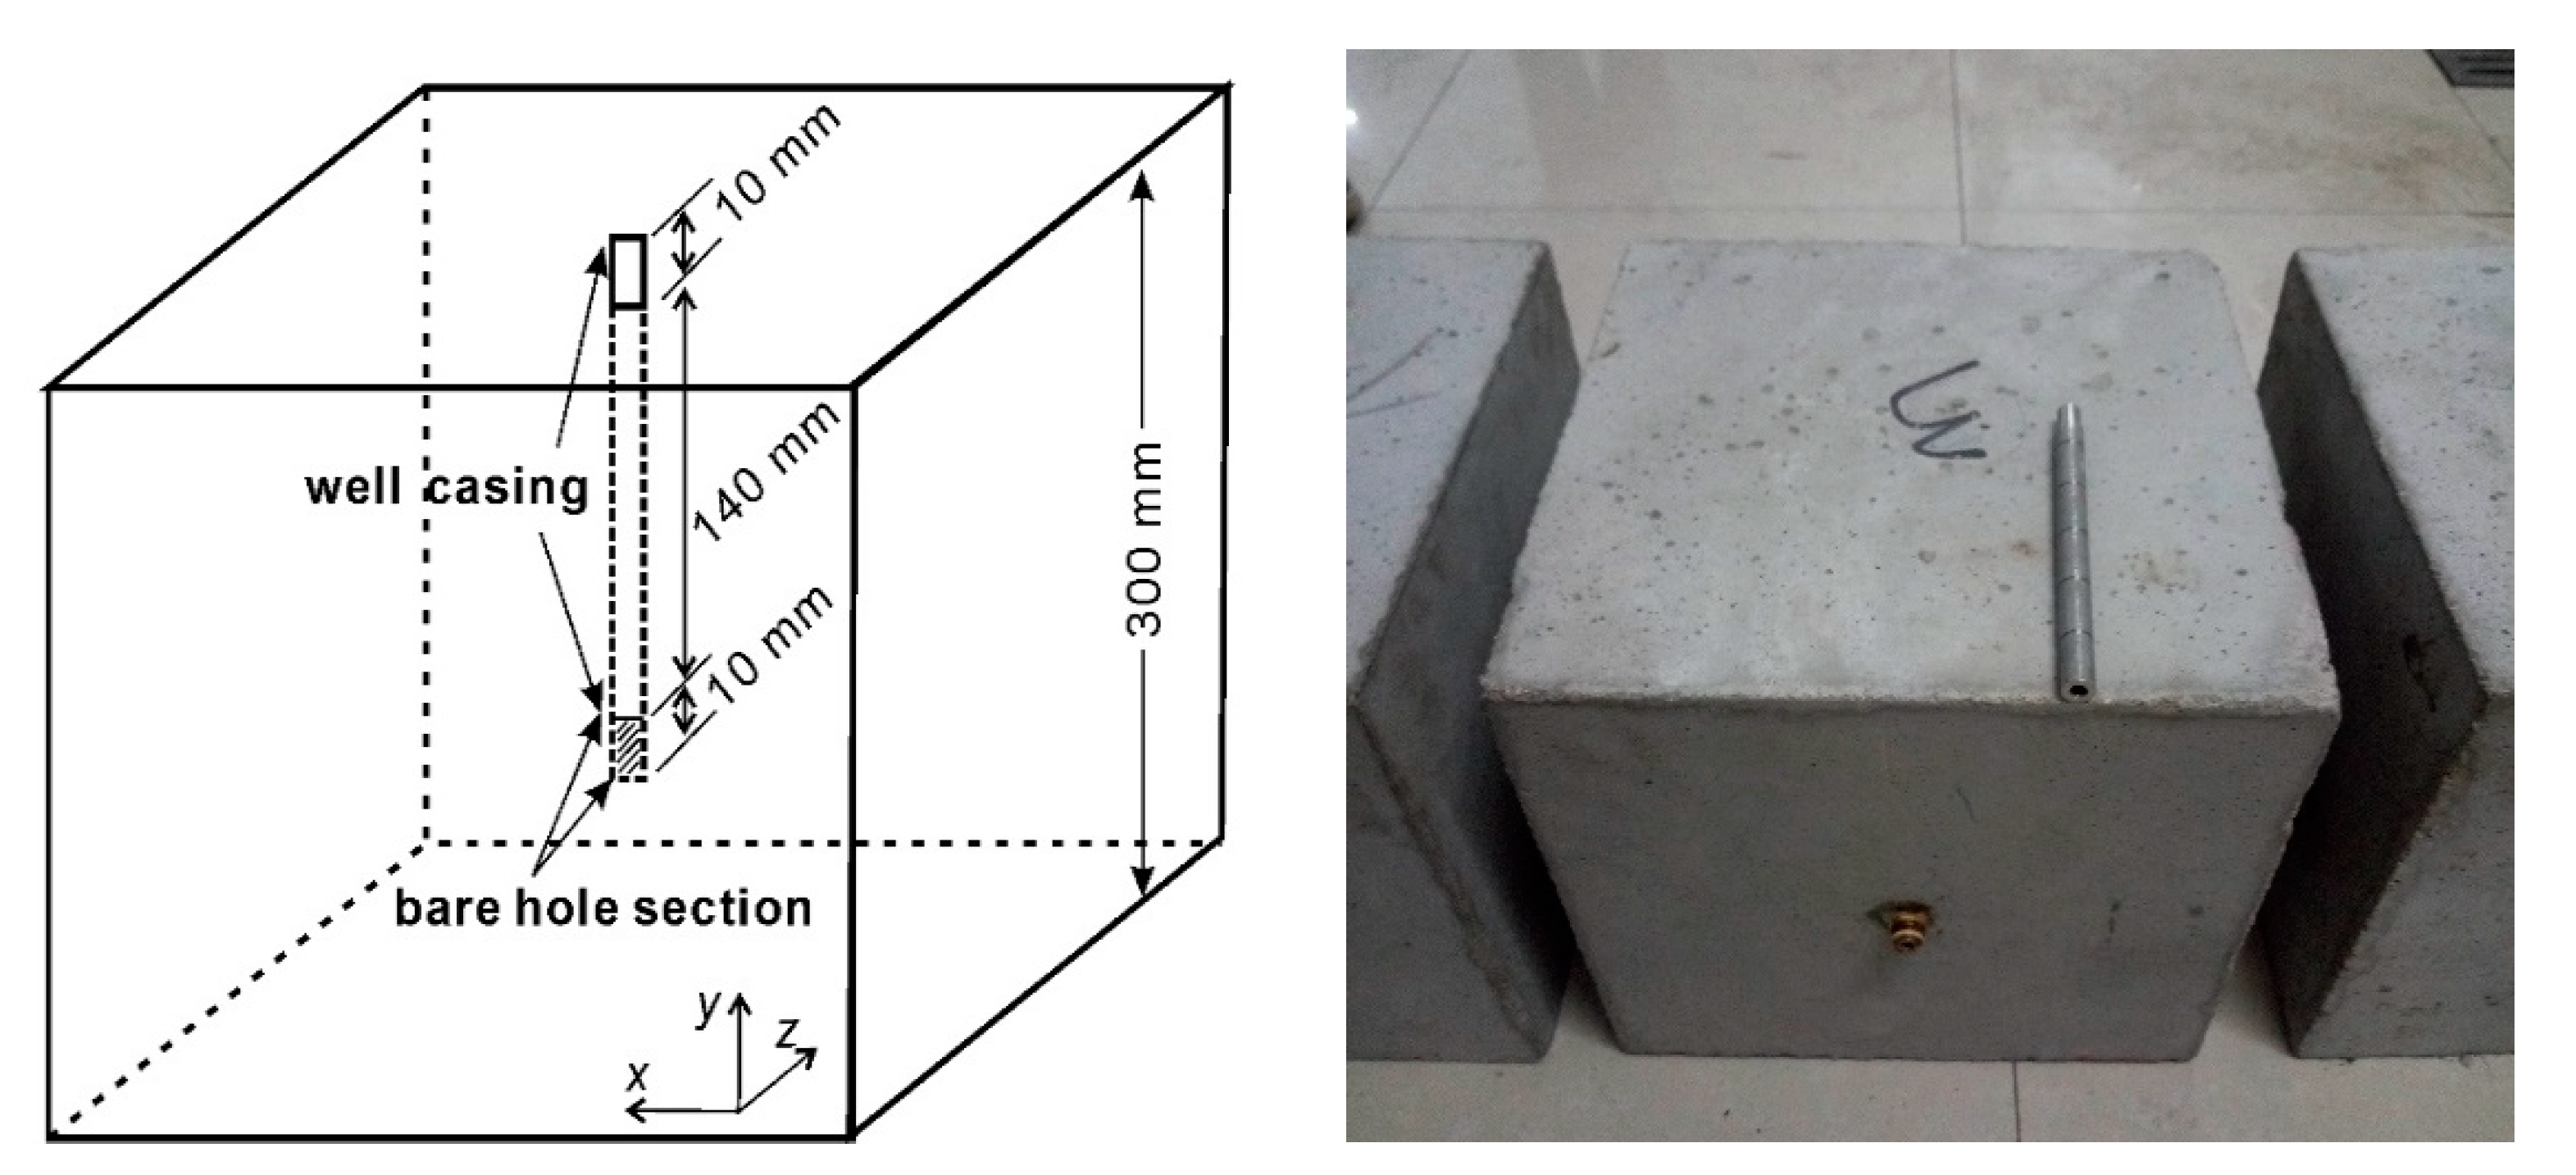
We casted three large concrete samples, including two homogeneous samples and one embedded fractures sample. The purpose was to study the hydraulic fracture extension law in homogeneous and naturally fractured samples, respectively. The three samples possessed a similar well casing and geometry. Generally, a section of bare hole would be left in the bottom of the EGS well to conduct water fracturing. At Soultz, for example, the GPK3 well has a completion depth of 5101 m and an open-hole section of 540 m at the bottom of the well [3]. In this experiment, the well casing was 150 mm long, 10 mm of which was extended outside the sample surface, and another 10 mm (bare hole section) was used to simulate bare hole fracturing (Figure 7).
The sample with embedded fractures used clipped cards to simulate fractures. The cards with a length of about 20–60 mm were clipped randomly and distributed randomly in the middle 200 mm layer of the sample (Figure 8, left). A total of 26 clipped cards were inserted at a horizontal interval of 20–120 mm (Figure 8, right).
It is expensive and laborious to test the physical and mechanical parameters on the large-size samples. Thus, we also casted 40 mini-size cylindrical concrete samples (diameter = 50 mm, height = 100 mm) simultaneously when preparing the large-sized samples. Mechanical tests were conducted on these mini-size samples to determine their density, porosity, permeability, Young’s modulus, Poisson’s ratio, cohesion, internal friction angle, tensile strength, and fracture toughness. The test parameters would support the following numerical analysis in Section 4.1.

3.3. Hydraulic Fracturing Test Scheme

The tests were divided into two groups. The first group included two homogeneous samples, one of which underwent hydraulic fracturing at room temperature (H1) and the other was subjected to the same procedure but at a high temperature (H2). The second group included one sample with embedded fractures (F1), which underwent only hydraulic fracturing at room temperature.
The difference between triaxial stresses has an important influence on the geometry and extending direction of the hydraulic fracture [8]. Generally, the suitable HDR formation lies in the deep part, where the vertical principle stress (σv) is usually larger than the horizontal principle stresses (σH and σh), except in areas with high horizontal tectonic stress [23]. Thus, a 3D simulation stress field was assumed with anisotropic compression in three directions (σv > σH > σh). Taking the formation at a depth of 4000 m as an example, we estimated the magnitude of the in situ stresses. If the rock density (ρrock), water density(ρwater), gravitational acceleration (g), and Poisson’s ratio (ν) were assumed to be 2600 kg/m3, 998 kg/m3, 9.8 N/kg, and 0.25, respectively, then σv = 100 MPa and σh = 60 MPa were calculated using the following equations [24]. σH = 80 MPa was adopted using the average of σv and σh.
Pw = ρwatergz
σV = ρrockgz
σ h = ν 1 ν ( σ V P W ) + P W
where Pw is pore water pressure; z is formation depth; σv, σH, and σh are the vertical, maximum horizontal, and minimum horizontal principal stresses, respectively.
In the laboratory, the device capacity could not hold such high pressures. Therefore, we reduced the ratio of in situ stresses by 10 times, and σv, σH, and σh in this experiment were set to 10, 8, and 6 MPa, respectively. Specific to the fracturing device, σy = 10 MPa, σz = 8 MPa, and σx = 6 MPa.
In high temperature fracturing, the sample was loaded into the fracturing bin and heated to 90 °C. Ice blocks were added to the water tank of the Isco pump to keep the injection water temperature constant at 0 °C, which could ensure the 90 °C temperature difference between the water and sample. In our previous tests, when the sample was heated to 150 °C, no water was observed after 90 min of hydraulic fracturing, and the fracture pressure curve remained flat. We inferred that the injection water was transformed into steam before penetrating the sample at a high temperature of 150 °C; thus, in this test, the sample was only heated up to 90 °C. We refer to 90 °C as a high temperature in this study to distinguish it from the room temperature case, although 90 °C generally belongs to the low-medium temperature region (90 °C–150 °C).
Table 2 shows the entire experiment scheme.
Both groups were tested according to the following steps.
(1)
The hydraulic fracturing computer system was initialized.
(2)
The sample was loaded into the fracturing bin, and the counterforce device was installed.
(3)
The three confining pressures were adjusted to 10, 8, and 6 MPa.
(4)
After 5 min, the AE system was initialized.
(5)
Water (mixed with red ink) was injected, and the initial injection rate was kept constant at 5 mL/min.
(6)
The fracturing pressure curve was observed and shut in when the curve began to decrease from the peak value. The main purpose of this process was to monitor the initiation pressure.
(7)
Shut in about 5 min, and the fracturing test was re-started at an injection flow rate of 1 mL/min. The main purpose of this process was to monitor the extension action of the hydraulic fracture.
(8)
On the basis of the variation of the location of AE points, we knew how far the fracture had extended. When the AE event points extend to the sample boundaries, or there was a sudden drop in the injection pressure curve, or there was water flowing out of the fracturing bin, it was supposed that the hydraulic fracture had reached the sample boundaries. Then, the injection was stopped, the three confined pressures were released, and the sample was removed.

3.4. Fracturing Test Results and Discussions

3.4.1. Pressure Variations

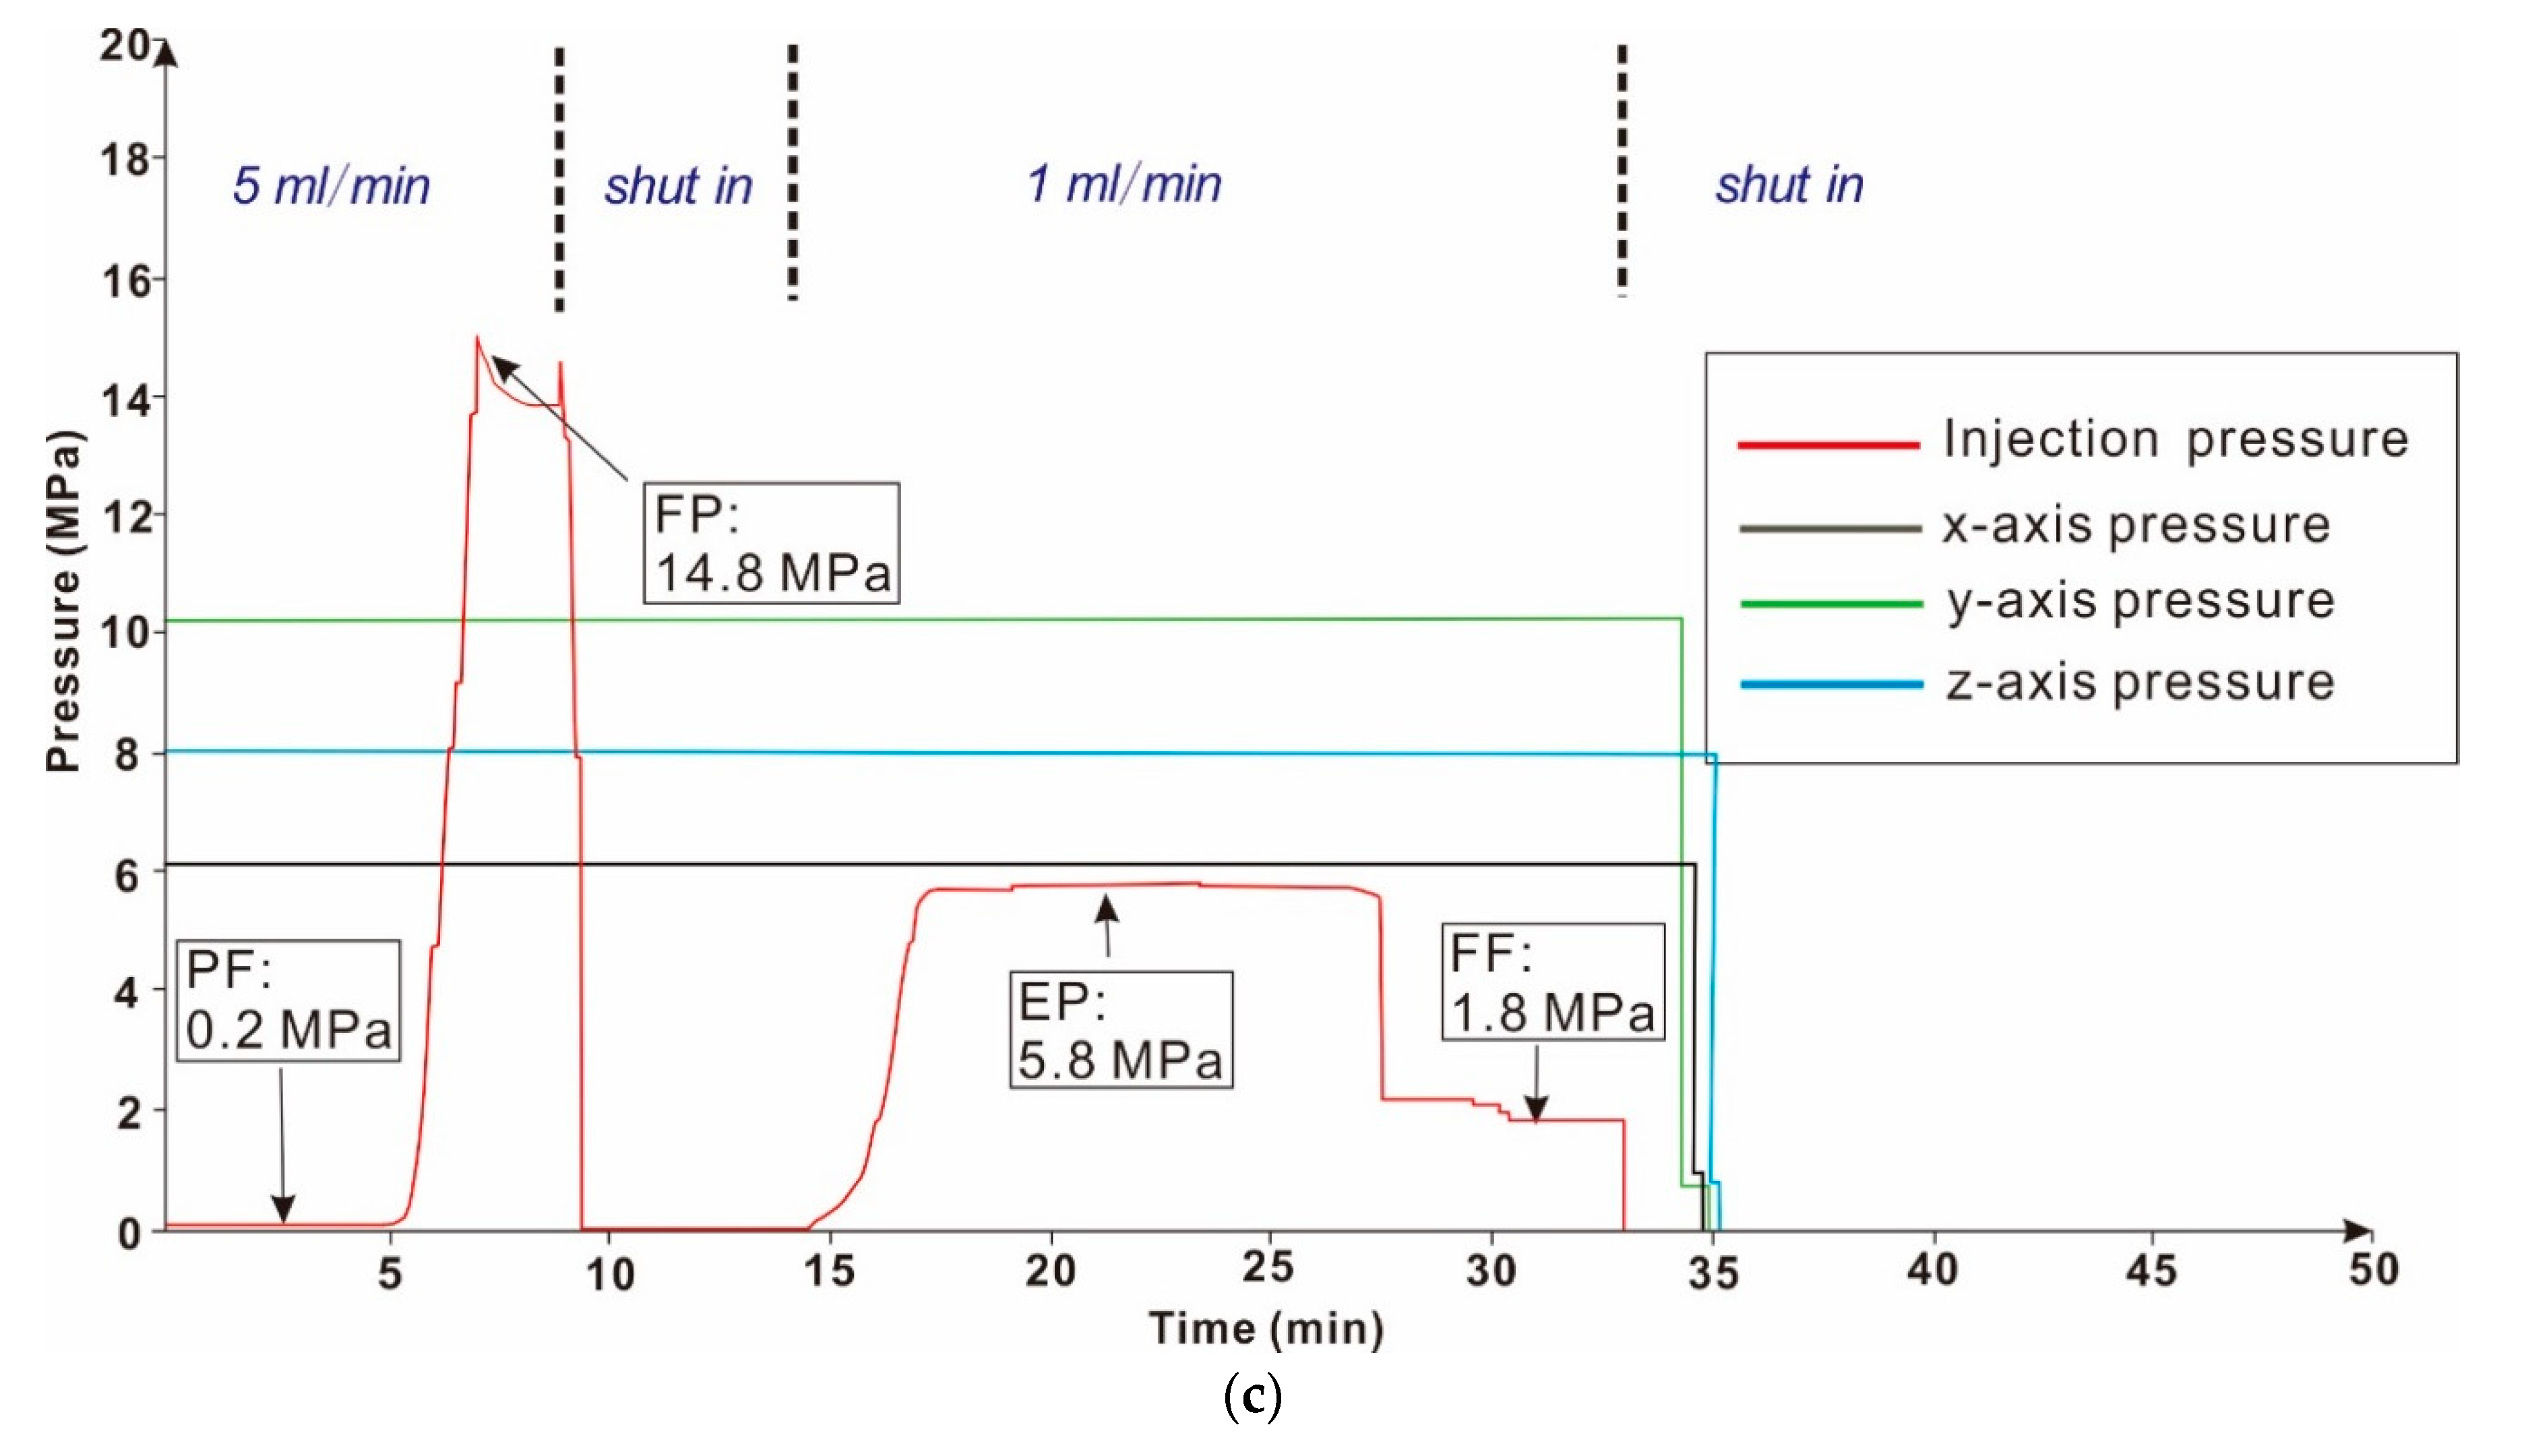
Figure 9 shows the pressure curve variations of H1, H2, and F1 during the tests. We obtained the following observations.
In the beginning of the injection (0–5 min), the pressure was maintained at 0.2 MPa, which indicated that the pipe friction (PF) was 0.2 MPa. Between 5 and 7 min, the increasing pressure indicated that the fluid was gradually filling the borehole and well casing section. According to fracturing mechanics, the peak value means that a fracture has initiated, and the fracturing pressure (FP) of H1, H2 and F1 were 15.3 MPa, 16.3 MPa, and 14.8 MPa, respectively.
After 5 min, the pump was restarted with a low flow rate of 1 mL/min. The injection pressure increased to a steady level, which indicated a stable propagation of the created fracture, and the extension pressure (EP) were 6.0 MPa, 7.8 MPa, and 5.8 MPa, respectively. After a while, the injection pressure suddenly decreased, indicating that the fracture had penetrated through the sample. Then, the injection pressure kept constant, which means that the flow resistance pressure on the fracture plane (fracture friction, FF) were 1.6 MPa, 3.6 MPa, and 1.8 MPa, respectively.
The results of the comparison of H1 and H2 indicated that the FP, EP, and FF increased with increasing temperature, which may be caused by two reasons. (1) During the heating period, the brittleness of the sample decreased, but its plasticity and elastic modulus increased. Therefore, FP and EP increased according to fracture mechanics theory. (2) The AE monitored in the 10 events appeared during the pre-heating period, indicating that new fractures were generated (see in Section 3.4.3). When low-temperature water was injected, additional fractures near the well casing were created because of thermal stress. Then, the hydraulic fracture connected these new fractures during the fracturing period, which led to high EP and FF.
A comparison of H1 with F1 revealed that FP and EP in H1 were higher than those in F1, which meant that FP and EP decreased with an increase in natural fracture density. The same result has been demonstrated by the fracturing curve of Soultz [34] and Desert Peak [35].

3.4.2. Hydrofracture Morphology

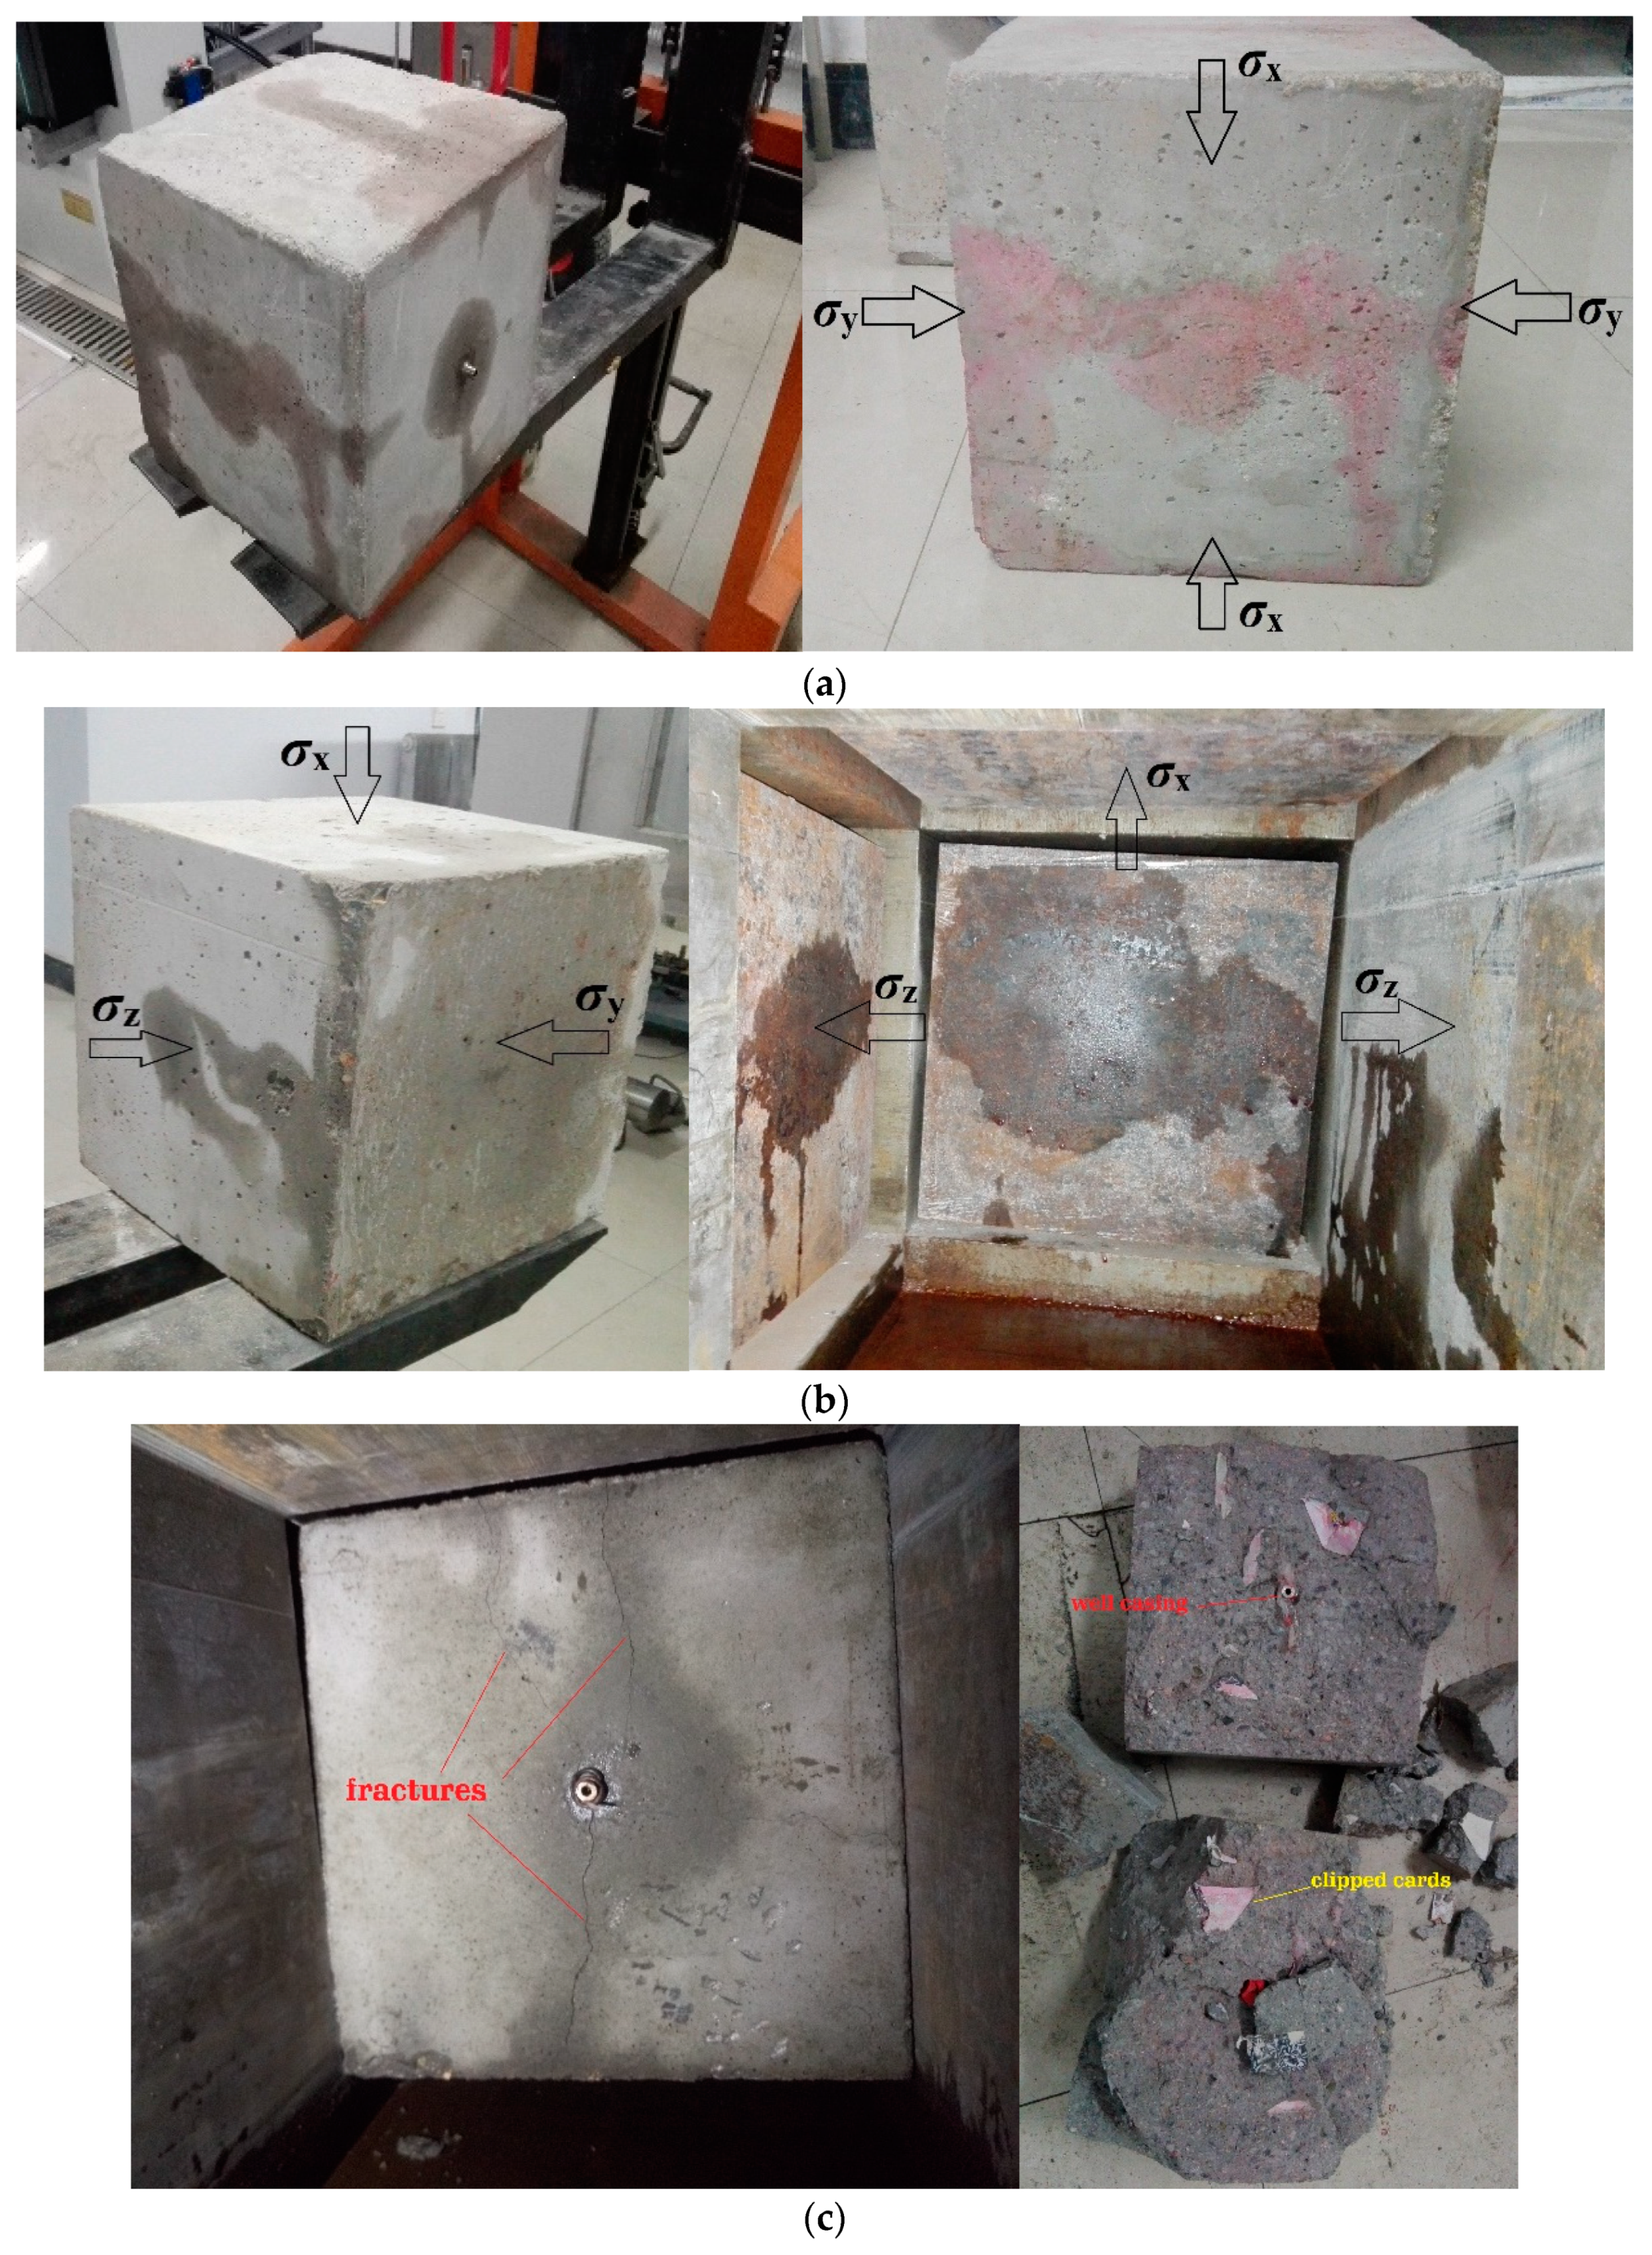
Figure 10 shows the fracture morphology of H1, H2 and F1 after tests. For the H1, a penetrating fracture was generated on the plane perpendicular to the x axis. An accompanying fracture about 150 mm long was also created on the top of the sample. The production of the associated fracture may be caused by the failure to achieve perfect homogeneity during the casting process. The development of the accompanying fracture was restricted when the horizontal crack penetrated through the rock.
For the H2, a penetrating fracture was generated on the plane perpendicular to the x axis. When the sample was taken out, the watermarks were observed only on the three plates in the horizontal direction. Thus, only a single horizontal fracture was created from the appearance of the sample. Besides, the created fracture direction of H2 is similar to that of H1, which indicated that the high temperature (90 °C) exerted little influence on the hydraulic fracture direction.
For the F1, after the test, the sample was stuck in the fracturing bin, but it was smooth when it was loaded. This is because the sample expanded after fracturing. Meanwhile, in the fractured sample, about four fractures (one horizontal and three vertical) were generated around the well casing (Figure 10c left). The sample was taken out, and it broke into two along the plane parallel to the y axis. Red ink was observed on the fracture surface (Figure 10c right). This phenomenon illustrated that the hydraulic fracture connected the natural fractures and penetrated through the entire sample, breaking it from the middle plane.

3.4.3. AE Results of the Fracturing Tests

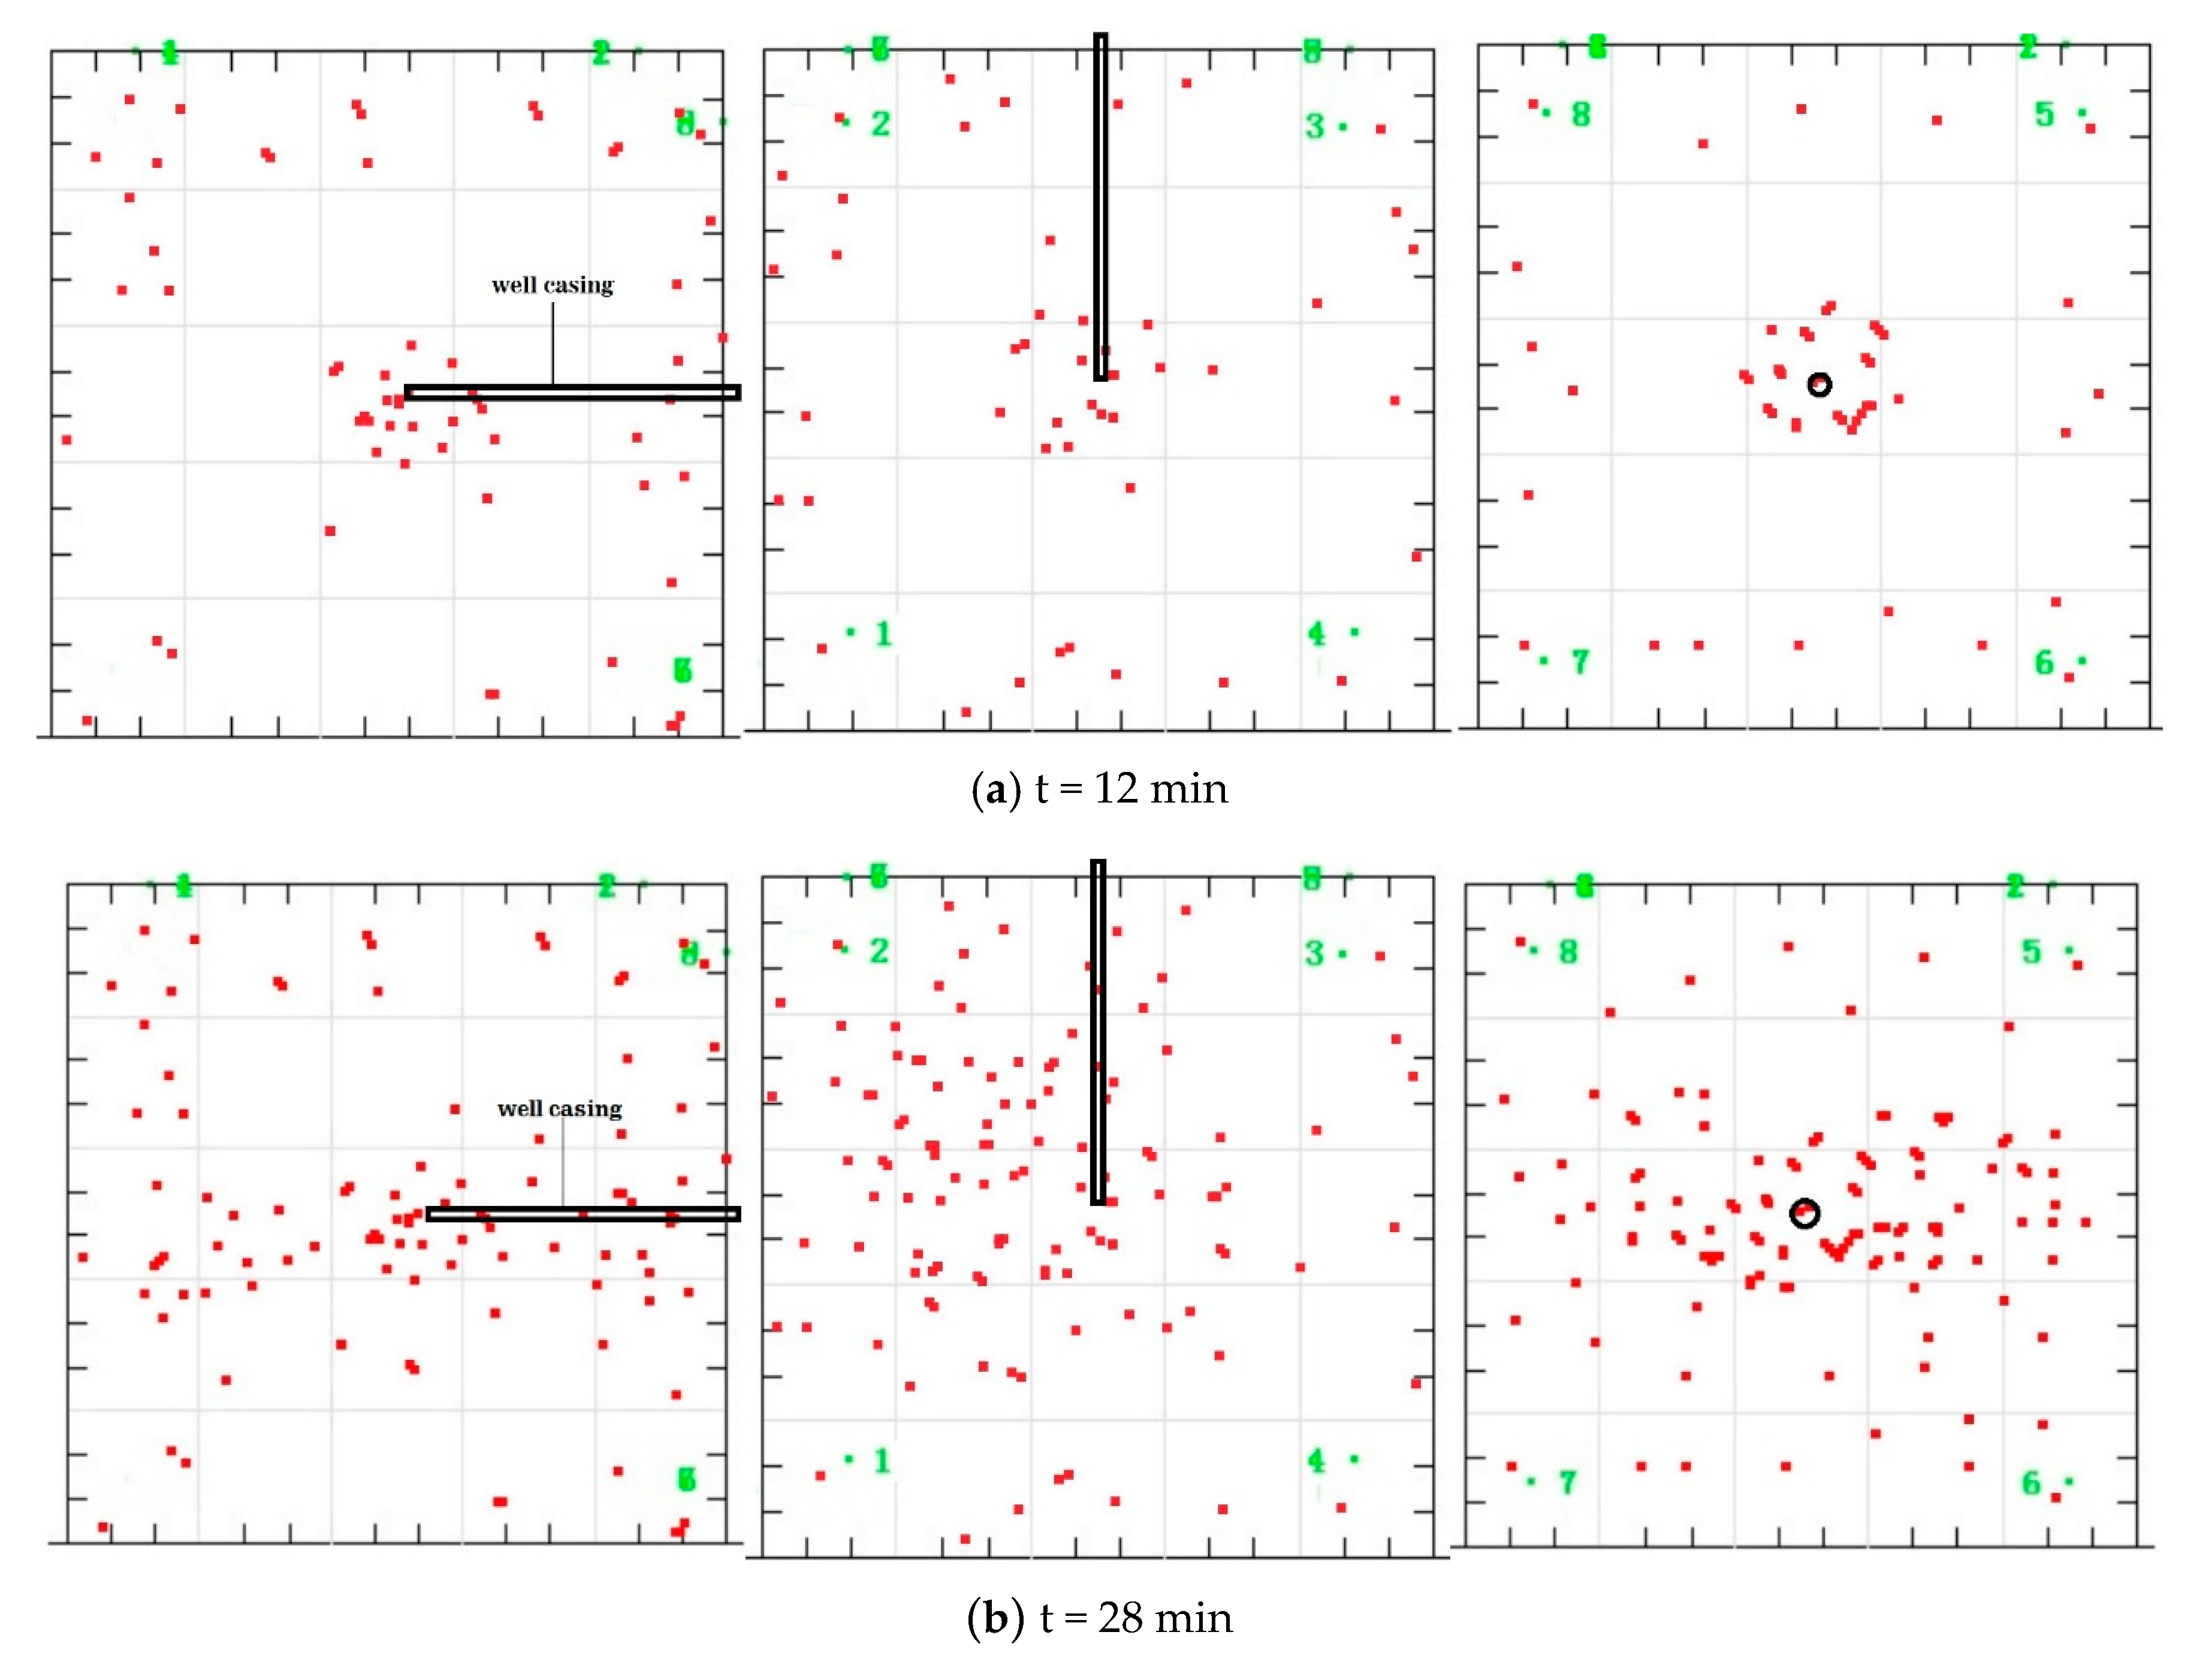
Figure 11 shows the AE results of the fracturing test of H1 at different times. At 12th min, the first water fracturing was just completed. At this time, AE points are mainly concentrated around the open hole. At 28th min, the hydraulic fracture just extends to the sample boundary, and the red points are intensely located on the plane perpendicular to the x axis. Because σx was the minimum principal stress in this test, it proves that the fracture propagated along the plane perpendicular to the minimum principal stress.
Figure 12 shows the AE results of the fracturing test of H2 at different times. The H2 sample was inserted into the fracturing bin and heated to 90 °C before fracturing. During this period, only 10 AE event points were observed. This phenomenon indicated that only a few micro-fractures were generated in the pre-heating period (5 °C–90 °C). Then, the hydraulic fracturing test was conducted in a constant high temperature environment (90 °C). From the 3D AE results of H2 at the 12th min, many red points were also observed in the vicinity of the well casing. Combined with the pressure curve, it was speculated that several new fractures were created in this area. At the 30th min, the hydraulic fracture has extended to the sample boundary. The fracture still propagated along the plane perpendicular to the minimum principal stress.
Figure 13 shows the AE results of the fracturing test of F1 at different times. At the 28th min, the hydraulic fracture just extended to the sample boundary. It can be seen that the red points are densely located on the plane perpendicular to the y axis, which is identical to the embedded fractures plane. However, σx was the minimum principal stress in this test; thus, compared with the fracture extension direction of H1 and H2, it illustrated that the spatial distribution pattern of the natural fractures exerted a larger influence on the hydraulic fracture direction than that of the triaxial stress in this case. Therefore, in the EGS reservoir, obtaining the initial characteristics of natural fractures such as density, size, geometry, and orientation is of great significance to the prediction of hydraulic fracture propagation.

4. Comparison of the Numerical Simulation with the Laboratory Test

4.1. Model Settings

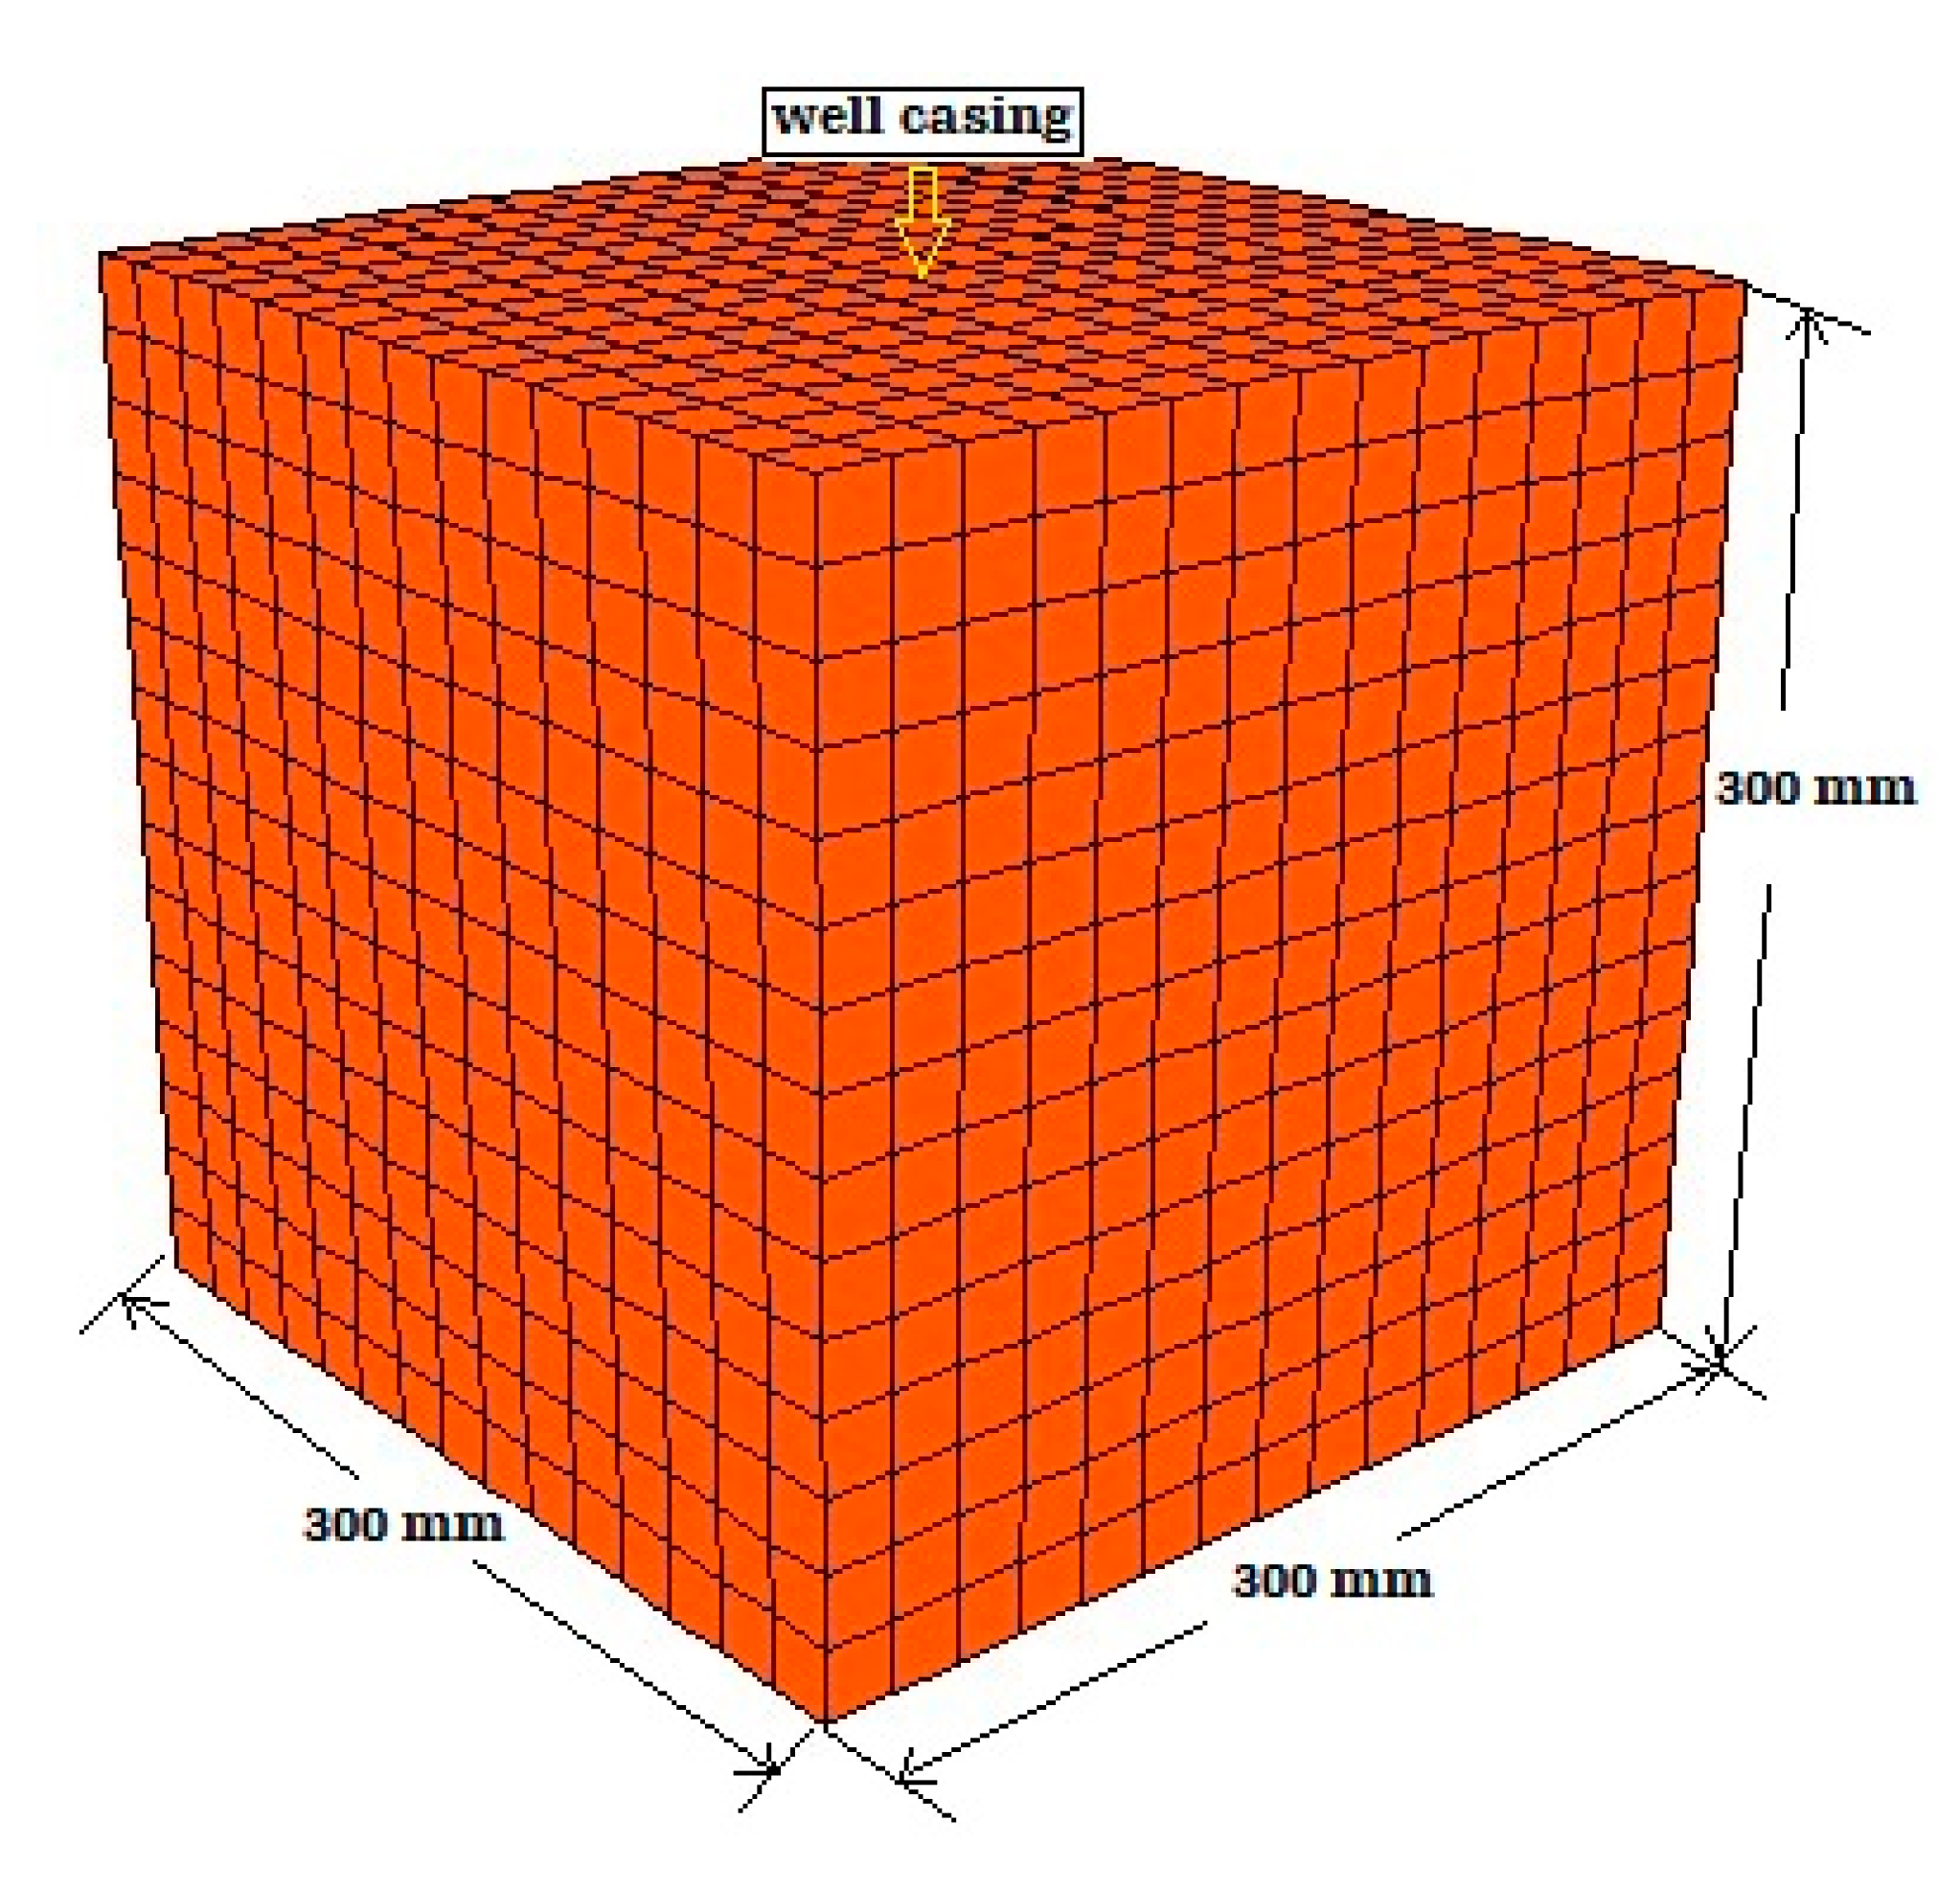
A numerical model was established using the FLAC3D based on the theory presented in Section 2, and its results were compared with the hydraulic fracturing results of H1. The cubic dimension of the numerical model was 300 mm × 300 mm × 300 mm. The grid number was divided into 15 × 15 × 15 (x × y × z) (Figure 14). The cell (ID = 1689) at the center of the cube model was set as the injection point. The upper surface was set free and the other faces were fixed. Table 3 lists the model parameters, which were obtained from the mechanical test results of the small cylindrical samples mentioned in Section 3.2. The initial stress field of the numerical model was setup the same as that of the experiment.

4.2. Numerical Simulation Results

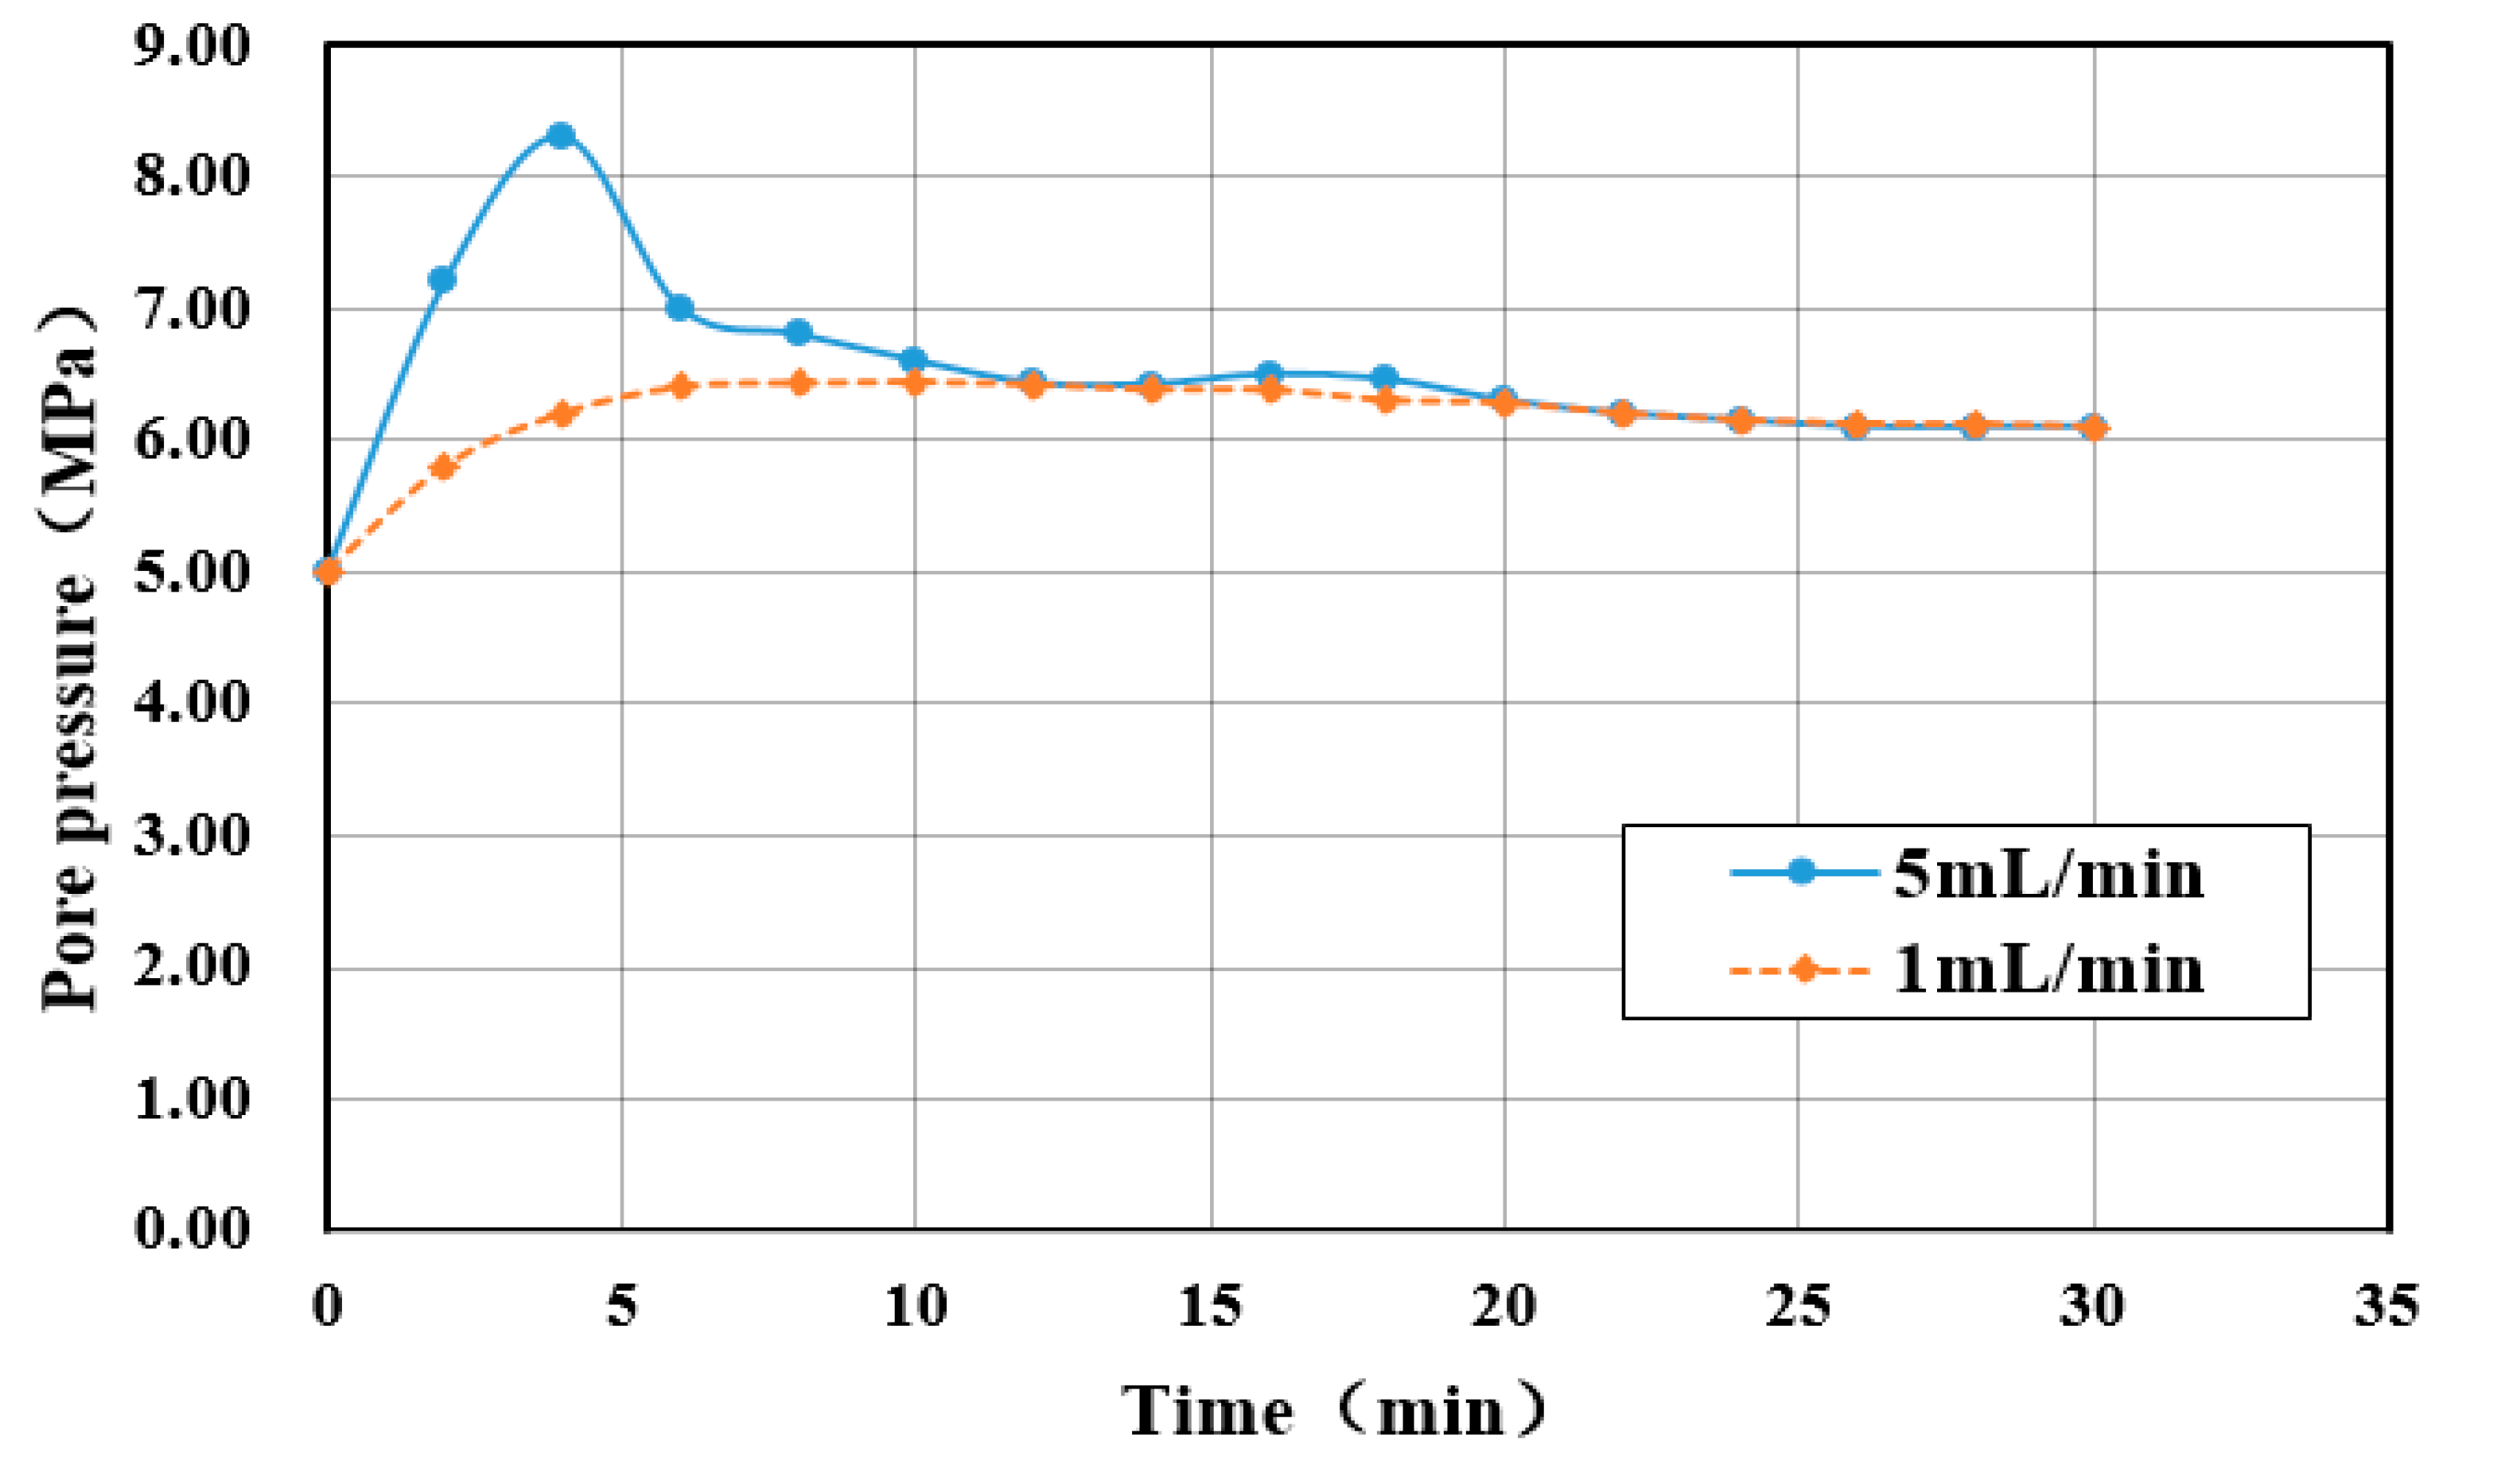
The test of H1 was divided into two parts: fracture initiation and propagation. Thus, the numerical simulation was also divided into two individual parts: (1) using a constant injection rate of 5 mL/min to implement the entire fracturing process and (2) closing the initiation part of the procedure and using 1 mL/min for the entire fracturing process.
Figure 15 illustrates the variation in hydraulic fracture aperture with time under 5 mL/min. The fracture initiated at 4 min and expanded outward in a circular form. At 10 min, the fracture shape began to be elliptical, and at 20 min, the fracture extended to the top and bottom surfaces of the model. This shape change was caused by the small scale of the model, and the boundary exerted a large influence on the fracture, which could be weakened in a large-scale field model.
Figure 16 illustrates the pore pressure variation with time in the two simulations. At 5 mL/min, the fracturing pressure was approximately 8.30 MPa. From 6–12 min, the pore pressure decreased to 6.32 MPa. From 12–18 min, the pore pressure was maintained stably at approximately 6.46 MPa, which indicated that the fracture was extending continuously. At 18 min, pore pressure decreased again because the fracture propagated to the model edge (Figure 15). Then, it decreased to 6.02 MPa at 30 min. At 1 mL/min, no peak point was found at the pressure curve. The pore pressure increased slowly to 6.32 MPa at 6 min, and it remained steady at 6–20 min. It decreased at 20 min and decreased to 6.02 MPa at 30 min. The simulated fracturing pressure and extended pressure were both lower than the results of the H2 test. Hence, we speculated that the initiation mode did not consider the pore-elastic effect, and micro-fractures were generated during the heating period. However, the propagation pressures of H1 and simulation were close, which proved the accuracy of the propagation criteria. Moreover, this procedure intuitively reflected the fracture geometry change during the propagation process.

5. Conclusions

In this study, the influence of high temperature and embedded fractures on the initiation and propagation of hydraulic fracture was analyzed through a laboratory test and numerical simulation. The integrated approaches led to the following conclusions.
(1)
The influence of high temperature on hydraulic fracturing showed the following features: many fractures were created, especially in the near-well region, and FP, EP, and fracture flow resistance became larger than that at room temperature. The reasons may be as follows. Sample brittleness decreased and plasticity increased with increasing temperature, which resulted in a high fracturing pressure. Moreover, the injected cold water (high temperature difference with the sample) generated many fractures because of thermal stress; numerous fractures led to large EP and flow resistance.
(2)
The 3D AE results of the fracturing process indicated that 3D stress and natural fractures significantly affected the extension direction of the hydraulic fracture. The spatial distribution pattern of natural fractures exerted a larger influence on the hydraulic fracture direction than that of triaxial stress. The fracturing pressure and EP of the sample decreased when natural fractures existed.
(3)
For hydraulic fracturing in the high temperature reservoir, a plastic zone was generated near the borehole, which increased as the injection pressure increased until the well wall reached failure. The hydraulic fracturing numerical simulation indicated that this hydraulic fracturing procedure can intuitively reflect the fracture geometry change during the propagation process.
Actual hydraulic fracturing is a complicated multi-physics coupling process. High temperature and fracture networks significantly influenced the created reservoir scale for EGS stimulation. In this paper, all used samples were artificially casted concrete samples. However, the microstructure, mineral composition, and mechanical parameters of rock samples were different from the concrete samples. Therefore, experiments using different kinds of rock samples during high temperature (>200 °C) hydraulic fracturing should also be considered in the future.

Author Contributions

Conceptualization, L.G.; data curation, Z.W. (Zihong Wang); methodology, L.G.; project administration, Z.W. (Zhichao Wang); resources, L.G.; software, Y.Z.; writing—original draft, H.J. All authors have read and agreed to the published version of the manuscript.

Funding

This work was supported by the Natural Science Foundation of China (No. 41807195); China Postdoctoral Science Foundation (No. 2019M661053 and 2020T130390); China Scholarship Council (No.201906935007); Scientific and Technological Innovation Programs of Higher Education Institutions in Shanxi (No. 2020L0116);Applied Basic Research Foundation of Shanxi Province (CN) (No. 201801D221049); National key Research and development program (No. 2018YFC0406406).

Conflicts of Interest

The authors declare no conflict of interest.

Nomenclature

Eyoung’s modulus, MPa
Gshear modulus, MPa
Tpermeability, m2
KIstress intensity factor, MPa·m0.5
KICfracture toughness, MPa·m0.5
ρdensity, kg/m3
vpoisson’s ratio
nporosity
σstress, MPa
σVvertical stress, MPa
σHmaximum horizontal stress, MPa
σhminimum horizontal stress, MPa
εstrain
θangle
ebelastic broken
pbplastic broken
PFpipe friction
FPfracturing pressure
EPextension pressure
FFfracture friction

References

  1. Lei, Z.H.; Zhang, Y.J.; Hu, Z.J.; Li, L.Z.; Zhang, S.Q.; Fu, L.; Yue, G.F. Application of Water Fracturing in Geothermal Energy Mining: Insights from Experimental Investigations. Energies 2019, 12, 2138. [Google Scholar] [CrossRef] [Green Version]
  2. Guo, L.L.; Zhang, Y.B.; Zhang, Y.J.; Yu, Z.W.; Zhang, J.N. Experimental investigation of granite properties under different temperatures and pressures and numerical analysis of damage effect in enhanced geothermal system. Renew. Energy 2018, 126, 107–125. [Google Scholar] [CrossRef]
  3. Tester, J.W.; Livesay, B.; Anderson, B.J.; Moore, M.C.; Bathchelor, A.S.; Nichols, K. The Future of Geothermal Energy: Impact of Enhanced Geothermal Systems (EGS) on the United States in the 21st Century; An Assessment by an MIT-Led Interdisciplinary Panel; MIT Press: Cambridge, MA, USA, 2006. [Google Scholar]
  4. Zeng, Y.C.; Su, Z.; Wu, N.Y. Numerical simulation of heat production potential from hot dry rock by water circulating through two horizontal wells at Desert Peak geothermal field. Energy 2013, 56, 92–107. [Google Scholar] [CrossRef]
  5. Arnorsson, S.; Axelsson, G.; Saemundsson, K. Geothermal systems in Iceland. Jokull 2007, 58, 269–302. [Google Scholar]
  6. Reinsch, T.; Dobson, P.; Asanuma, H.; Huenges, E.; Poletto, F.; Sanjuan, B. Utilizing supercritical geothermal systems: A review of past ventures and ongoing research activities. Geotherm. Energy 2017, 5, 16. [Google Scholar] [CrossRef] [Green Version]
  7. Quosay, A.A.; Knez, D.; Ziaja, J. Hydraulic fracturing: New uncertainty based modeling approach for process design using Monte Carlo simulation technique. PLoS ONE 2020, 15, e0236726. [Google Scholar] [CrossRef] [PubMed]
  8. Quosay, A.A.; Knez, D. Sensitivity Analysis on Fracturing Pressure Using Monte Carlo Simulation Technique. Oil Gas Eur. Mag. 2016, 42, 140–144. [Google Scholar]
  9. Parvizi, H.; Gomari, S.R.; Nabhani, F.N.; Monfared, A.D. Modeling the Risk of Commercial Failure for Hydraulic Fracturing Projects Due to Reservoir Heterogeneity. Energies 2018, 11, 218. [Google Scholar] [CrossRef] [Green Version]
  10. Basnet, C.B.; Panthi, K.K. Evaluation on the Minimum Principal Stress State and Potential Hydraulic Jacking from the Shotcrete-Lined Pressure Tunnel: A Case from Nepal. Rock Mech. Rock Eng. 2019, 52, 2377–2399. [Google Scholar] [CrossRef]
  11. Huang, J.; Fu, P.; Settgast, R.R.; Morris, J.P.; Ryerson, F.J. Evaluating a Simple Fracturing Criterion for a Hydraulic Fracture Crossing Stress and Stiffness Contrasts. Rock Mech. Rock Eng. 2019, 52, 1657–1670. [Google Scholar] [CrossRef]
  12. Jia, L.C.; Chen, M.; Sun, L.T.; Sun, Z.Y.; Zhang, W.; Zhu, Q.Q. Experimental study on propagation of hydraulic fracture in volcanic rocks using industrial CT technology. Pet. Explor. Dev. 2013, 40, 405–408. [Google Scholar] [CrossRef]
  13. Bouteca, M.J. 3D Analytical Model for Hydraulic Fracturing: Theory and Field Test; SPE-13276-MS; SPE: Richardson, TX, USA, 1984. [Google Scholar]
  14. Thiercelin, M.; Naceur, K.B.; Lemanczyk, Z.R. Simulation of Three-Dimensional Propagation of a Vertical Hydraulic Fracture; SPE-13861-MS; SPE: Richardson, TX, USA, 1985. [Google Scholar]
  15. Luis, A. Large Scale Hydraulic Fracturing Test on a Rock with Artificial Discontinuities. Ph.D. Thesis, Colorado School of Mines, Golden, CO, USA, 2007. [Google Scholar]
  16. Bauer, S.; Huang, K.; Chen, Q.; Ghassemi, A.; Barrow, P. Laboratory and numerical evaluation of EGS shear stimulation. In Proceedings of the 41st Workshop on Geothermal Reservoir Engineering, Stanford, CA, USA, 22–24 February 2016. SGP-TR-209. [Google Scholar]
  17. Anderson, G.D. Effects of friction on hydraulic fracture growth near unbonded interfaces in rocks. Soc. Pet. Eng. J. 1981, 21, 21–29. [Google Scholar] [CrossRef]
  18. Teufel, L.W.; Clark, J.A. Hydraulic fracture propagation in layered rock experimental studies of fracture containment. Soc. Pet. Eng. J. 1984, 24, 449–456. [Google Scholar] [CrossRef] [Green Version]
  19. Warpinski, N.R.; Clark, J.A.; Schmidt, R.A.; Huddle, C.W. Laboratory investigation on the effect of in-situ stress on hydraulic fracture containment. Soc. Pet. Eng. J. 1982, 22, 55–66. [Google Scholar] [CrossRef] [Green Version]
  20. Papadopoulos, J.M.; Narendran, V.M.; Cleary, M.P. Laboratory simulation of hydraulic fracturing. In Proceedings of the SPE/DOE Low Permeability Gas Reservoirs Symposium, Denver, CO, USA, 14–16 March 1983. SPE/DOE11618. [Google Scholar]
  21. Daneshy, A.A. Hydraulic fracture propagation in the presence of planes of weakness. In Proceedings of the SPE European Spring Meeting, Amsterdam, The Netherlands, 29–30 May 1974. SPE4852. [Google Scholar]
  22. Pater, C.J.; Beugelsdijk, L.J.L. Experiments and numerical simulation of hydraulic fracturing in naturally fractured rock. In Proceedings of the US Rock Mechanics Symposium, Anchorage, AK, USA, 25–29 June 2005. [Google Scholar]
  23. Zhou, H.W.; Xie, H.P.; Zuo, J.P. Developments in researches on mechanical behaviors of rocks under the condition of high ground pressure in the depths. Adv. Mech. 2005, 35, 91–99. [Google Scholar]
  24. Siratovich, P.; Heap, M.; Villeneuve, M.; Cole, J.; Kennedy, B.; Davidson, J.; Reuschlé, T. Mechanical behaviour of the Rotokawa Andesites (New Zealand): Insight into permeability evolution and stress-induced behaviour in an actively utilised geothermal reservoir. Geothermics 2016, 64, 163–179. [Google Scholar] [CrossRef]
  25. Guo, J.C.; He, S.G.; Deng, Y. Study of hydraulic fracturing initiation mode and initiation pressure of elastoplastic formation. Rock Soil Mech. 2015, 36, 2494–2500. [Google Scholar]
  26. Hossain, M.M.; Rahman, M.K.; Rahman, S.S. Hydraulic fracture initiation and propagation: Roles of wellbore trajectory, perforation and stress regimes. J. Pet. Sci. Eng. 2000, 27, 129–149. [Google Scholar] [CrossRef]
  27. Gao, H.; Zheng, Y.R.; Feng, X.T. Exploration on yield and failure of materials. J. Rock Mech. Eng. 2006, 25, 2515–2522. [Google Scholar]
  28. Shao, S.J.; Xu, P.; Chen, C.L. Several shear spatially mobilized planes and anisotropic strength criteria of soils. J. Geotech. Eng. 2013, 35, 422–435. [Google Scholar]
  29. Adachi, J.; Siebrits, E.; Peirce, A.; Desroches, J. Computer simulation of hydraulic fractures. Int. J. Rock Mech. Min. Sci. 2007, 44, 739–757. [Google Scholar] [CrossRef]
  30. StimPlan™/InjecPlan™ Version 6.00 [Computer Software]; NSI Technologies: Tulsa, OK, USA, 2015.
  31. F LAC3D Manual, Version 4.0; Itasca: Minneapolis, MN, USA, 2008.
  32. Zhou, L.; Hou, M.Z. A new numerical 3D-model for simulation of hydraulic fracturing in consideration of hydro-mechanical coupling effects. Int. J. Rock Mech. Min. Sci. 2013, 60, 370–380. [Google Scholar] [CrossRef]
  33. Zimmerman, R.W.; Kumar, S.; Bodvarsson, G.S. Lubrication theory analysis of the permeability of rough-walled fractures. Int. J. Rock Mech. Min. Sci. 1991, 28, 325–331. [Google Scholar] [CrossRef] [Green Version]
  34. Baria, R.; Baumgärtner, J.; Gérard, A.; Jung, R.; Garnish, J. European HDR research programme at Soultz-sous-Forets (France) 1987–1996. Geothermics 1999, 28, 655–669. [Google Scholar] [CrossRef]
  35. Chabora, E.; Zemach, E.; Spielman, P.; Drakos, P.; Hickman, S.; Lutz, S. Hydraulic stimulation of well 27-15, desert peak geothermal field, Nevada, USA. In Proceedings of the Thirty-Seventh Workshop on Geothermal Reservoir Engineering, Stanford, CA, USA, 30 January–1 February 2012. SGP-TR-194. [Google Scholar]
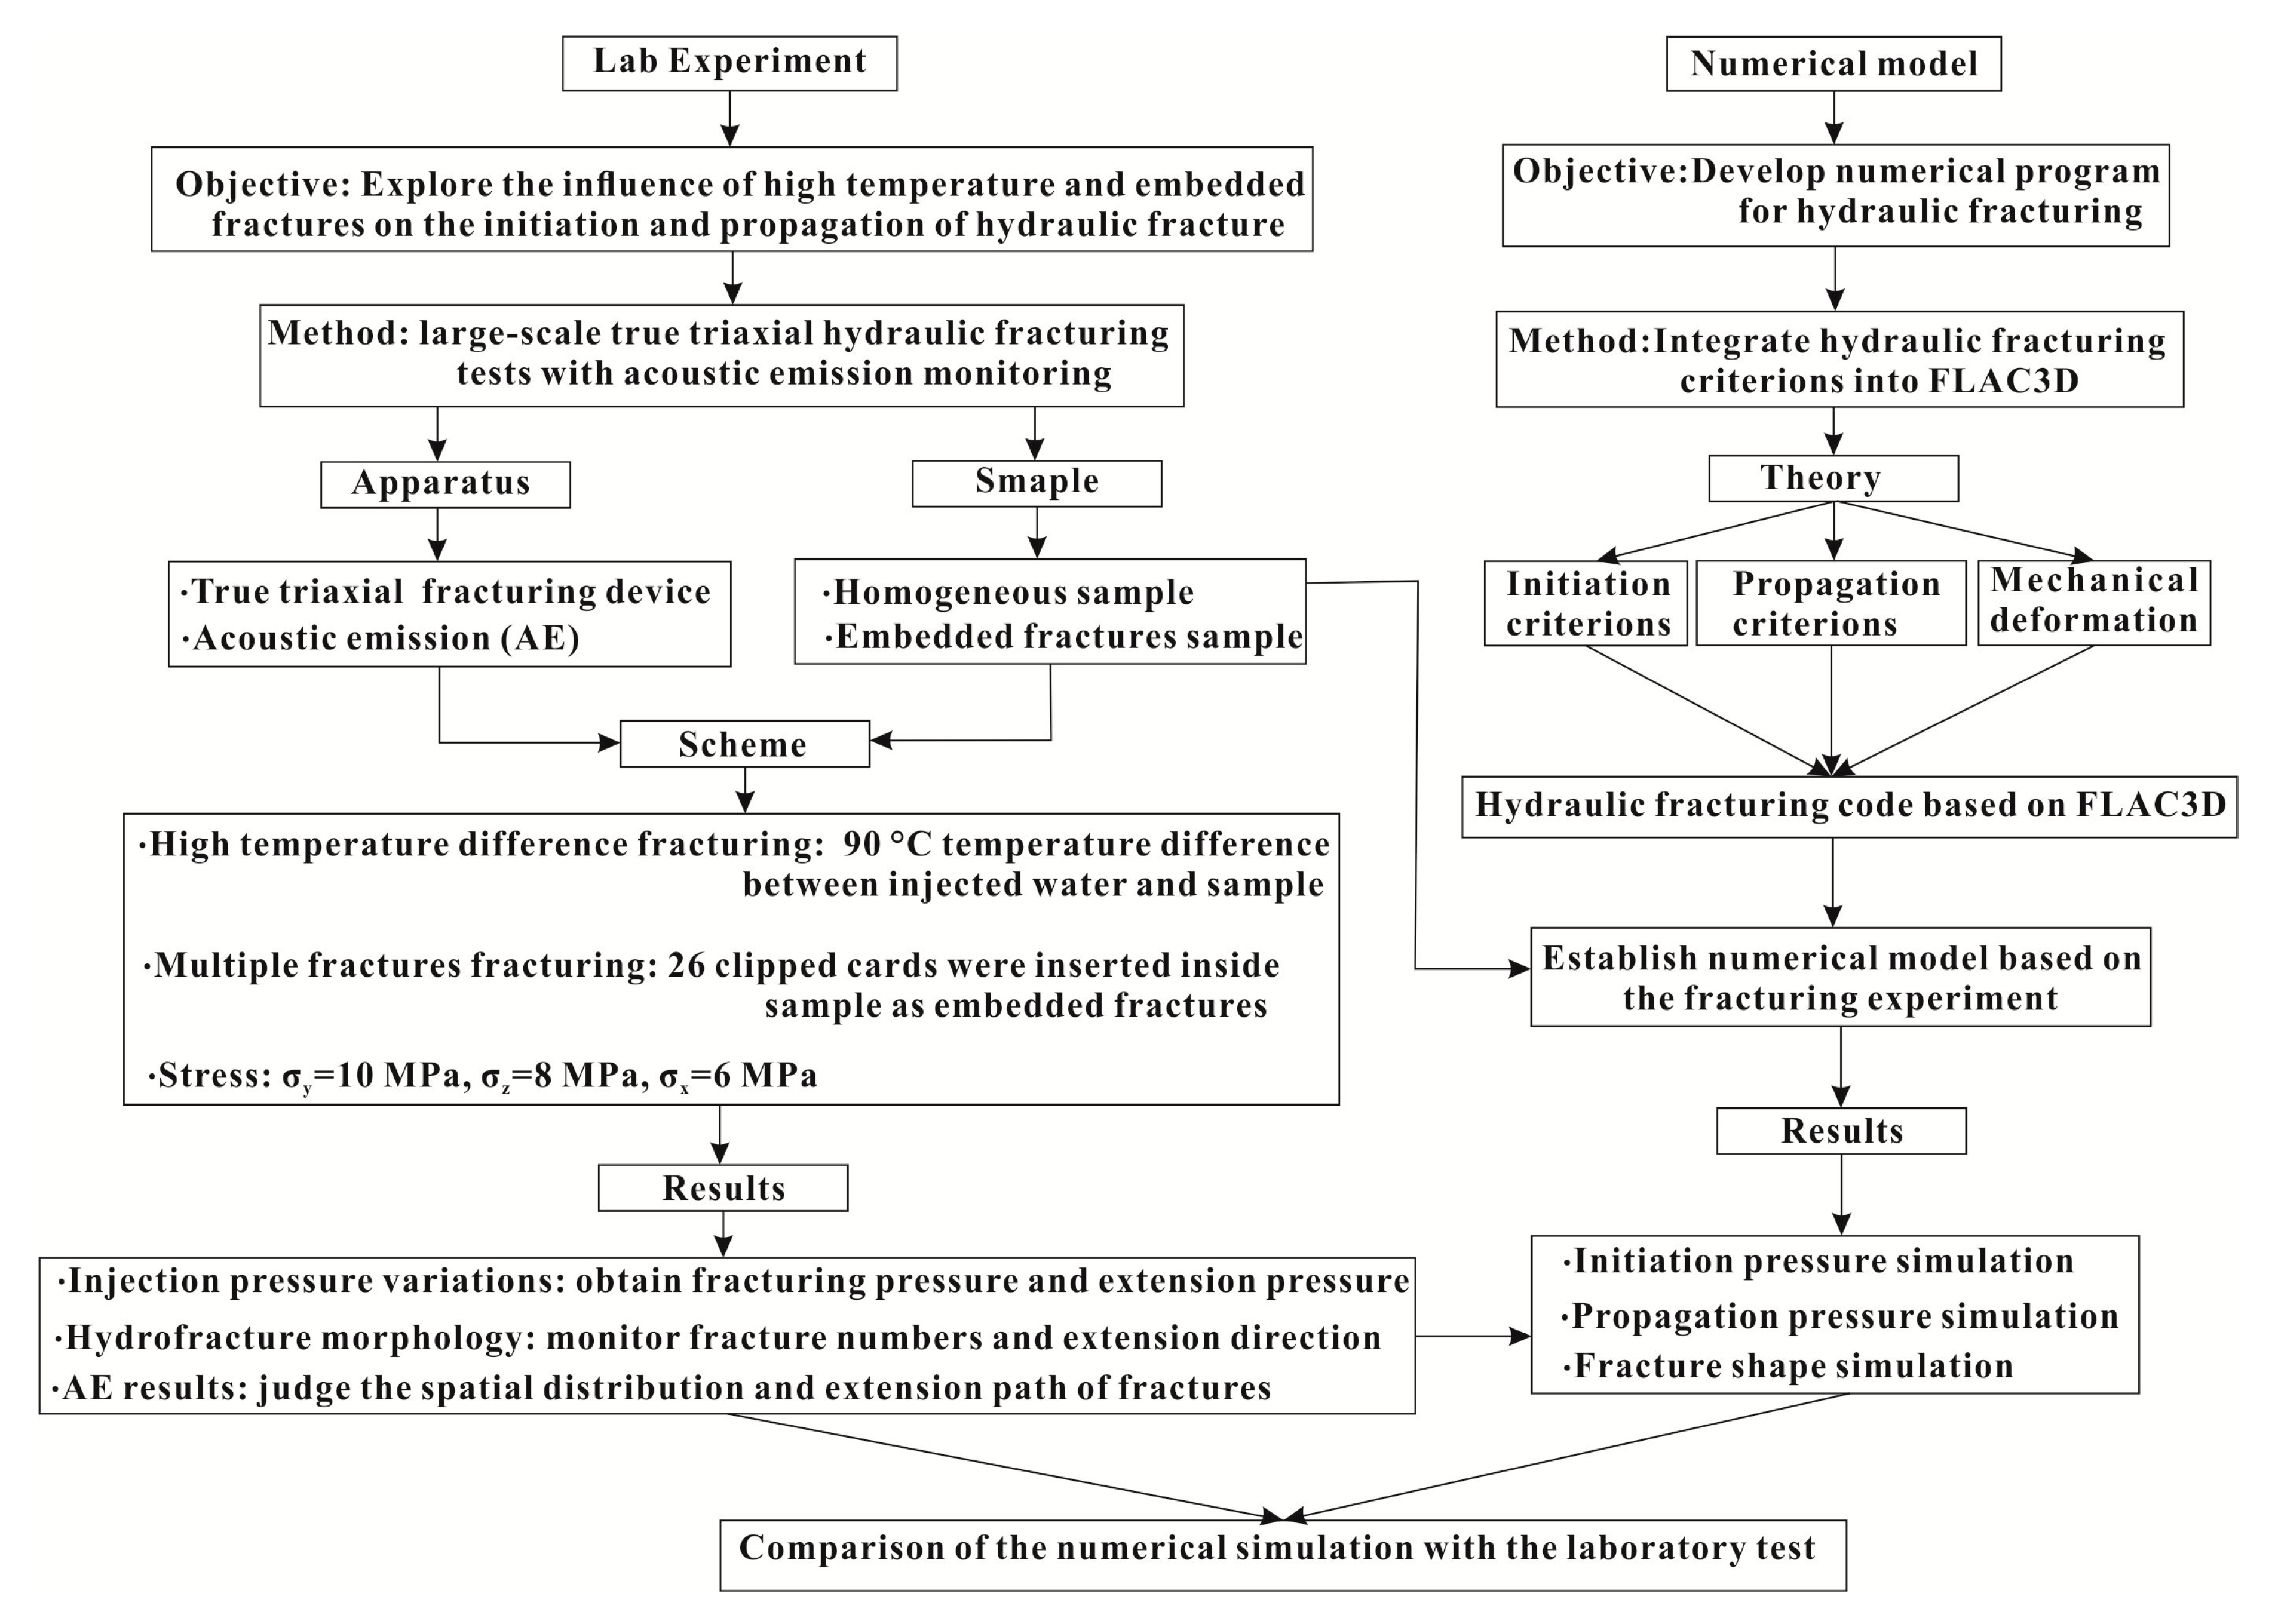
Figure 1. Methodological flowchart.
Water 12 03171 g001
Figure 2. Stress zone variation around the borehole when high pressure fluids are injected. Rs and rw are the radius of the plastic zone and borehole, respectively.
Water 12 03171 g002
Figure 3. Hydraulic fracture morphology in volcanic (a) and sandstone (b).
Water 12 03171 g003
Figure 4. Large-size true triaxial hydraulic fracturing experiment system. The front view (Front) and the back view (Back) of the instrument are shown in the figure.
Water 12 03171 g004
Figure 5. “L”-type cart.
Water 12 03171 g005
Figure 6. Four acoustic emission (AE) probes on the sides of the “L”-type cart (left) and schematic of the sample design (right, the numbers denote AE probes).
Water 12 03171 g006
Figure 7. Schematic of the sample (left) and casted large-size concrete samples (right).
Water 12 03171 g007
Figure 8. Schematic of the sample with embedded fractures (left) and the inserted clipped cards (right).
Water 12 03171 g008
Figure 9. Pressure curve variations of H1 (a), H2 (b), and F1 (c), during the test. PF is pipe friction, FP is fracturing pressure, EP is extension pressure, and FF is fracture friction.
Water 12 03171 g009aWater 12 03171 g009b
Figure 10. Fracture morphology of H1 (a), H2 (b), and F1 (c).
Water 12 03171 g010
Figure 11. AE results of the fracturing of H1 at t = 12 min (a) and t = 28 min (b).
Water 12 03171 g011
Figure 12. AE results of the fracturing of H2 at t = 12 min (a) and t = 30 min (b).
Water 12 03171 g012
Figure 13. AE results of the fracturing of F1 at t = 12 min (a) and t = 28 min (b).
Water 12 03171 g013
Figure 14. Schematic of the 3D geometry model.
Water 12 03171 g014
Figure 15. Hydraulic fracture apertures at t = 4 min (a), 10 min (b), 15 min (c) and 20 min (d) under 5 mL/min.
Water 12 03171 g016
Figure 16. Pore pressure variation with time in the two simulations.
Water 12 03171 g017
Table 1. Main technical parameters of the equipment.
The maximum fracturing pressure60 MPa
The maximum confining pressure32 MPa
Fracturing sample size300 mm × 300 mm × 300 mm
Operating temperature<200 °C
The maximum pump pressure70 MPa
Rated load18 kw
Table 2. Experiment scheme.
ParametersGroup 1Group 2
H1H2F1
σy (MPa)101010
σz (MPa)888
σx (MPa)666
Injection water temperature (°C)10010
Sample temperature (°C)109010
Table 3. Numerical simulation parameters.
ParametersValue
σzz (MPa)10
σxx (MPa)6
σyy (MPa)8
Density (kg/m3)2237
Porosity (%)1.5
Permeability (m2)5 × 10⁻¹⁷
Elastic module (MPa)1300
Passion’s ratio0.18
Cohesion (MPa)15
Internal friction angle (°)30
KIC (MPa·m0.5)0.54
Fluid viscosity (Pa·s)0.001
Initial pore pressure (MPa)6
Publisher’s Note: MDPI stays neutral with regard to jurisdictional claims in published maps and institutional affiliations.