Article

Characteristics and Mechanism of the Environmental Capacity Changes in Haizhou Bay, Northern Jiangsu, China from 2006 to 2016

1
School of Geography, Nanjing Normal University, Nanjing 210023, China
2
College of Marine Science and Engineering, Nanjing Normal University, Nanjing 210023, China
3
Third Institute of Oceanography, Ministry of Natural Resources, Xiamen 361005, China
*
Author to whom correspondence should be addressed.
Water 2020, 12(11), 2990; https://doi.org/10.3390/w12112990
Submission received: 20 August 2020 / Revised: 21 October 2020 / Accepted: 23 October 2020 / Published: 25 October 2020
(This article belongs to the Section Oceans and Coastal Zones)

Abstract

:
Haizhou Bay is an open bay located in northern Jiangsu Province, China. This study analyzes the changes in the coastline, coastal development, and water quality of Haizhou Bay between 2006 and 2016. The box model method and numerical simulation are adopted to calculate the environmental capacities of Haizhou Bay in 2006 and 2016, analyze changes to environmental capacity features, and assess the influencing factors over this period. The scenario analysis method is used to discuss the influencing mechanism and degree of influence of factors (e.g., the water quality difference inside and outside the bay, and sea reclamation) on the environmental capacity and calculate the contribution of each influencing factor. The changes in terrain triggered by sea reclamation and water quality from 2006 to 2016 reduced the total environmental capacity of Haizhou Bay, with an influencing ratio of 0.198:0.802. In other words, poorer water quality inside the bay reduces the environmental capacity by a degree of 4.05 times that of sea reclamation. This study can offer guidance on related future research aiming to protect the marine environment of Haizhou Bay and control the total amount of pollutants discharged into the sea.

1. Introduction

A bay is an area of sea that extends into the land, creating a curved coastline. As a transitional area between land and sea, bays are rich in resources such as marine life, ocean floor minerals, and marine oil or gas, and they are often used as ports for shipping and as tourist destinations because of their picturesque nature. However, coastal development inevitably harms the marine environment; for example, sea reclamation shortens the coastline. This leads to many changes to the coastal terrain, the characteristics of tidal movement, and the migration behavior of pollutants [1]. Sea reclamation also reduces the tidal prism (the tidal volume that a bay can carry) and the ability of seawater to remove pollutants, and it may even affect threatened bird habitats [2]. Moreover, bait and drugs for aquaculture may also pollute seawater. In the development and processing of coastal ports, sanitary sewage, ballast water, and accidental oil spills from ships at sea can degrade the quality of the marine environment [3,4]. In the process of expansion and development, urban civilizations will always have an impact on the surrounding hydrology and river landscape [5]. Land-sourced pollutants relating to upstream human activities flow into the sea through rivers, leading to grave threats to the marine environment of bays.
The world’s oceans can transfer, dilute, decompose, and purify a great many pollutants with their strong self-purification ability, but their carrying capacity for pollution is not infinite. Marine environmental capacity is defined as the maximum amount of pollutants allowed to enter the ocean within a certain period, which is the seawater quality standard required to maintain specific environmental functions in an area. Some researchers usually call it the total maximum allocated load (TMAL) [6]. The marine environment can be considered to be in good condition for self-purification so long as the total pollutants flowing into the sea do not exceed the pollutant-holding capacity. Otherwise, the marine environment and functions could be harmed or even permanently crippled [7].
Haizhou Bay is located at the northern end of Jiangsu Province in China, and it contains the most abundant marine resources in the province, covering marine fisheries, ports, and tourism. There are many kinds of high-density alongshore developments in Haizhou Bay, including pond culture, open-type culture, tourism and entertainment, industrial use, marine reclamation land, pollutant discharge, and dumping. Between 2006 and 2016, the area of marine reclamation land around Haizhou Bay was around 43.4 km2 for industrial use and urban construction. There are also some important ecological red line areas in Haizhou Bay, such as the Haizhou Bay National Marine Park and the Prawn National Germplasm resources protection zone, which have higher ecological requirements for the marine environment. According to the Bulletin on the Marine Environmental Quality of Lianyungang, Jiangsu Province, 2017, first- and second-class clean sea areas account for 60.18%. In terms of water quality distribution, the polluted areas are mainly along the shore. To guarantee sustainable development in the future, Haizhou Bay should be developed on the premise of coordinated development and marine environmental protection. An effective and rational method of marine environmental control is needed to determine the marine environmental capacity and control the total pollutants flowing into the ocean in a scientific manner.
A group of experts on the scientific aspects of marine environmental protection (GESAMP) formally defined the concept of environmental capacity in 1986: environmental capacity is the characteristics of the environment and the capacity of the environment to accommodate certain substances on the premise that it will not cause an intolerable impact on the environment [8]. The research on marine environmental capacity started earlier outside China. For example, Krom et al. estimated the environmental capacity of Haifa Bay on the Mediterranean coast of Israel [9]. Recently, scholars have focused on the impact of the deterioration of the marine environment on marine life and explored comprehensive measures for the management of marine ecology. For example, Trela et al. studied the comprehensive management of the Baltic Sea in Sweden [10]. Malcangio et al. decided to use a pumping system to improve the water quality of the port of Monopoli after assessing the natural conditions of the port’s water exchange [11]. Mali et al. utilized the data stemming from a five-year monitoring program of the Apulian coast to assess the environmental quality of the area [12]. Existing research on the marine environmental capacity in China has focused mainly on semi-enclosed bays such as Bohai Bay [13], Laizhou Bay [14], Beibu Gulf [15], and Jiaozhou Bay [16], but there has been little attention paid to open-type bays such as Haizhou Bay. Research on the change in environmental capacity has focused mostly on rivers and lakes [17,18], analyzing the influence of changes in water quality, flow, and water volume entering into lakes about environmental capacity [19,20]. Most studies calculate environmental capacities under different water quality and flow and then quantitively analyze how different factors influence environmental capacity without calculating their rates of contribution [21,22,23,24]. Studies of marine environmental capacity typically focus on how environmental capacity varies with water quality, hydrological conditions, and sea reclamation projects [25]. Reports on the influencing factors of environmental capacity are often made through qualitative analyses instead of a quantitative method [26,27]. Researchers in Europe and the United States have paid more attention to the marine ecological environment. The fields involved are mainly water eutrophication [28,29], heavy metal pollution [30], pollution from mariculture [31], wastewater treatment into the sea, etc. Some scholars pay more attention to the principles of environmental capacity assessment, prevention, and early warning [32,33].
We analyzed the changes in the coastline, coastal development, and water quality of Haizhou Bay between 2006 and 2016. A numerical simulation was used to calculate the environmental capacities of the bay in 2006 and 2016. The scenario analysis method was employed to discuss the influencing mechanism and degree of several factors (e.g., the water quality difference inside and outside the bay and sea reclamation) on the environmental capacity and calculate the rates of contributions of these influencing factors. The exploration of changes in environmental capacity and quantification of the influencing factors in this study can offer guidance for related future research aiming to protect the marine environment of Haizhou Bay and control the total amount of pollutants discharged into the sea. Correspondingly, this research may promote the balanced and sustainable development of economy and society in the sea area of Haizhou Bay and adjacent land area.

2. Materials and Methods

2.1. Overview of Haizhou Bay

Lianyungang Haizhou Bay is located in the northeast of China’s Jiangsu Province and the south of Shandong Province. It is the westernmost open bay in the south Yellow Sea. Haizhou Bay starts from Lanshan District in Rizhao City, Shandong Province in the north (Point A in Figure 1: 35°05′55″ N, 119°21′53″ E), and south (Point B in Figure 1: 34°45′25″ N, 119°29′45″ E) to Gaogong Island in Lianyungang District, Lianyungang City, Jiangsu Province. The coastline of Haizhou Bay in the study area is 130.3 km long (Figure 1).

2.2. Data Sources and Analytical Method

We collected American earth resources satellite (Landsat) images for 2006 and 2016 for an interpretation of remote sensing through ENVI (The Environment for Visualizing Images) to determine the coastline of the study area in the two years, so as to analyze the reclamation from 2006 to 2016. We collected 1:25,000 topographic maps of Haizhou Bay in 2006 and 1:20,000 topographic maps in 2016. According to the topographic maps of these two periods, the topographic erosion and sedimentation changes of Haizhou Bay were compared and analyzed. The ownership data of ocean development and utilization and ocean space planning in 2006 and 2016 were collected from the Ocean Management Department. The marine water quality data of Haizhou Bay in 2006 were from the marine water quality monitoring carried out by the Jiangsu Marine Environment Monitoring and Forecasting Center at Haizhou Bay. The marine water quality data of Haizhou Bay in 2016 were from the environmental quality report of Lianyungang Coastal Waters, which was issued by the Lianyungang Environmental Monitoring Center Station. ArcGIS was used for data processing and integration, information superimposition, and spatial analysis.

2.3. Research Methods

2.3.1. The Box Model Method

The main methods to calculate the marine environmental capacity include the share rate method, optimization method, model trial method, box model method, and GIS (Geographic Information System) method. The box model method is widely used in the environmental evaluation of bays and estuaries. In this method, the water body is considered as a homogeneously mixed box with uniformly distributed properties such as temperature and concentration. Any local change in the box leads to global influence immediately, and the box will be homogeneous again at once. On such an assumption, the variable quantity of substances in the box per unit of time can be expressed by the amount of substance coming in minus that coming out plus the produced amount via the internal biochemical reaction [34]. That is, the seawater outside the bay carries pollutants into the bay during the tidal period. At the same time, the water in the bay carries pollutants away from the bay. Add to that the amount of variation in the biochemistry of the pollutants in the bay. We can calculate the total change in the amount of matter in the bay per unit time via the following equation:
V C t = β Q i n C i n γ Q o u t C + S
where V is the water body volume (m3); C is the pollutant concentration of seawater in the box (mg/L); t is the tidal period (days); Cin is the mean concentration of the seawater outside the box (mg/L); Qin and Qout represent the water volume flowing into and out of the box per unit time, respectively (m3); β is the exchange fraction of internal seawater with external seawater; γ is the exchange fraction of external seawater with internal seawater; and S denotes the increase in substances produced via internal biochemical reactions per unit of time (kg).
The pollutant studied in this paper is the chemical oxygen demand (COD). From a conservative point of view, the chemical and biological processes are not considered in the calculation of COD environmental capacity; instead, only the physical processes of convection and diffusion are considered. The marine environmental capacity can be obtained by a simplified calculation of the box model.
Calculation method: the water body is regarded as an ideal box of isoconcentration, and C0 is the background concentration value of every internal point. Thus, pollutants will be homogeneously mixed the moment they enter the water body, and the marine environmental capacity can be calculated by
E C = ( C S C 0 ) d v
where EC is the environmental capacity (tons); v is the water body volume (m3); and C0 and CS are the background and the water quality standard values (mg/L), respectively [35].

2.3.2. Determination of the Calculation Boundary

The main function of the box calculation model is the determination of the calculation boundary. The ECG calculation result varies according to the scope enclosed by boundaries. Based on the analysis of the Haizhou Bay landform and terrain and their change trends, tidal dynamic field, water flux, and the present coastal development, the boundary that best separates the areas inside and outside the bay was delineated based on the following assumptions. First, the boundary cannot be disturbed by internal factors of the bay, and the submarine topography should be relatively stable. Second, the boundary should be perpendicular or parallel to the direction of the tidal hydrodynamic force here. Third, coastal development should be included.
Through a previous analysis of terrain change and the comparison between the submarine topography in 2006 and 2016, a few changes were found in the terrain outside the 16 m isobath, indicating that the terrain of areas deeper than 16 m are rarely disturbed by these influencing factors. Thus, the calculation boundary should be drawn deeper than the 16 m isobath.
Haizhou Bay is controlled by a rotary tidal wave that moves from north to south but exhibits a rectilinear current along the shore. When the tide rises, the open-side tide flows into Haizhou Bay from northeast to southwest (NE–SW). When the tide recedes, it runs off the bay from southwest to northeast (SW–NE). Except in the flank, there is a sharp incline between the tide and isobath or coastline, indicating that the tide mainly tends to flow back and forth between both sides. In this regard, the calculation boundary should be perpendicular or parallel to the direction of the tidal hydrodynamic force, namely in the NW–SE or NE–SW direction.
The coastal development of Haizhou Bay in 2016 was mainly carried out in the sea area 30 km from the coast and shallower than the 16 m isobath, 91.5% of which is used for aquaculture.
After consideration of factors such as terrain, tidal power, and coastal development, the perpendicular cross-sections were determined as the outer boundary. Cross-sections A and B are in the SE–NW and SW–NE directions, respectively. The boundary and the present coastline jointly define the scope of the ECG calculation (Figure 2).
The cross-sectional tidal flux is the product of the cross-sectional area and the flow velocity perpendicular to the cross-section. The tidal fluxes of cross-sections A and B were summed via Delft 3D and considered to represent the exchanged water body volume.

2.3.3. Calculation of Marine Environmental Capacity

The environmental capacity of the gulf (ECG) of Haizhou Bay comprises the static environmental capacity (ECS) and dynamic environmental capacity (ECD). The ECS is the difference between the standard and background values of still water quality, and the ECD is the change in tidal prism (water purification ability) from the tide rising and falling:
E C G = E C S + E C D .

Static Environmental Capacity (ECS)

The ECS shows the pollutant-carrying ability of seawater enclosed by the land and ocean boundaries in the research area. It can be obtained via calculation of the theoretical maximum environmental capacity, the used environmental capacity, and the remaining environmental capacity:
E C S = E C S b E C S d
where ECSb is the theoretical maximum ECG of Haizhou Bay under a given standard of water quality, and ECSd is the used ECG in the background condition.
ECSb is the product of the standard water quality of marine functional zoning and the water body volume, which is calculated as follows:
E C S b = C b × V x
V x = S × L
where Cb is the standard water quality of marine functional zoning—in this paper, it refers to the second-class seawater quality (mg/L); Vx is the water body volume in the box (m3); S is the sea area enclosed by the box boundary (m2); and L is the mean depth of seawater in the box (m). The water quality grade is based on the “Sea Water Quality Standard” (GB3097-1997). This is the National Standard of the People’s Republic of China, which contains the standards of various pollutants such as inorganic nitrogen, active phosphate, chemical oxygen demand (COD), and so on. We selected the COD parameter as a tracer of marine pollution in this study.
ECSd is the product of the present pollutant concentration in Haizhou Bay and the water body volume in the box, which is calculated as follows:
E C S d = C x × V x
where Cx is the present pollutant concentration of Haizhou Bay (mg/L).
Then, the remaining environmental capacity (ECS) can be expressed by Equation (4).

Dynamic Environmental Capacity (ECD)

ECD refers to the change in tidal prism from the rising and falling of the tide, namely the change in the exchange capacity of the water body. The exchanged seawater will leave Haizhou Bay through the tidal movements, carrying polluted water to somewhere far away from the land, where the water quality is good. In the next tidal rising, external clean seawater flows into Haizhou Bay. This circulation demonstrates the physical cleaning ability of seawater.
ECD is the product of the present pollutant concentrations inside and outside Haizhou Bay and the exchanged seawater volume, which are calculated as follows:
E C D = ( C x C w ) × V n
where Cw is the present pollutant concentration outside Haizhou Bay (mg/L), and Vn is the mean exchanged water body volume of Haizhou Bay (m3).
The basic assumption of theoretical maximum dynamic environmental capacity (ECDx) is that the water in the bay is already the upper limit of the control water quality standard, while the water outside the bay is clean and does not contain pollutants. The calculation method is the product of the pollutant concentration of the control water quality standard and the net tidal capacity, which is calculated as follows:
E C D x = C b × V n
where Cb is the standard water quality of marine functional zoning—in this paper, it refers to the second-class seawater quality (mg/L); and Vn is the mean exchanged water body volume of Haizhou Bay (m3).

2.3.4. Numerical Simulation Method

Based on the data of exchanged water body volume, the box model method was adopted to calculate the environmental capacity in accordance with the physical change of pollutants in the water body and indicate the physical diffusion ability of the water body. Delft 3D (numerical simulation software) was employed to create a hydrodynamic force model of the tide and simulate the tidal field of Haizhou Bay [36,37,38,39].

Model Grid and Parameter Setting

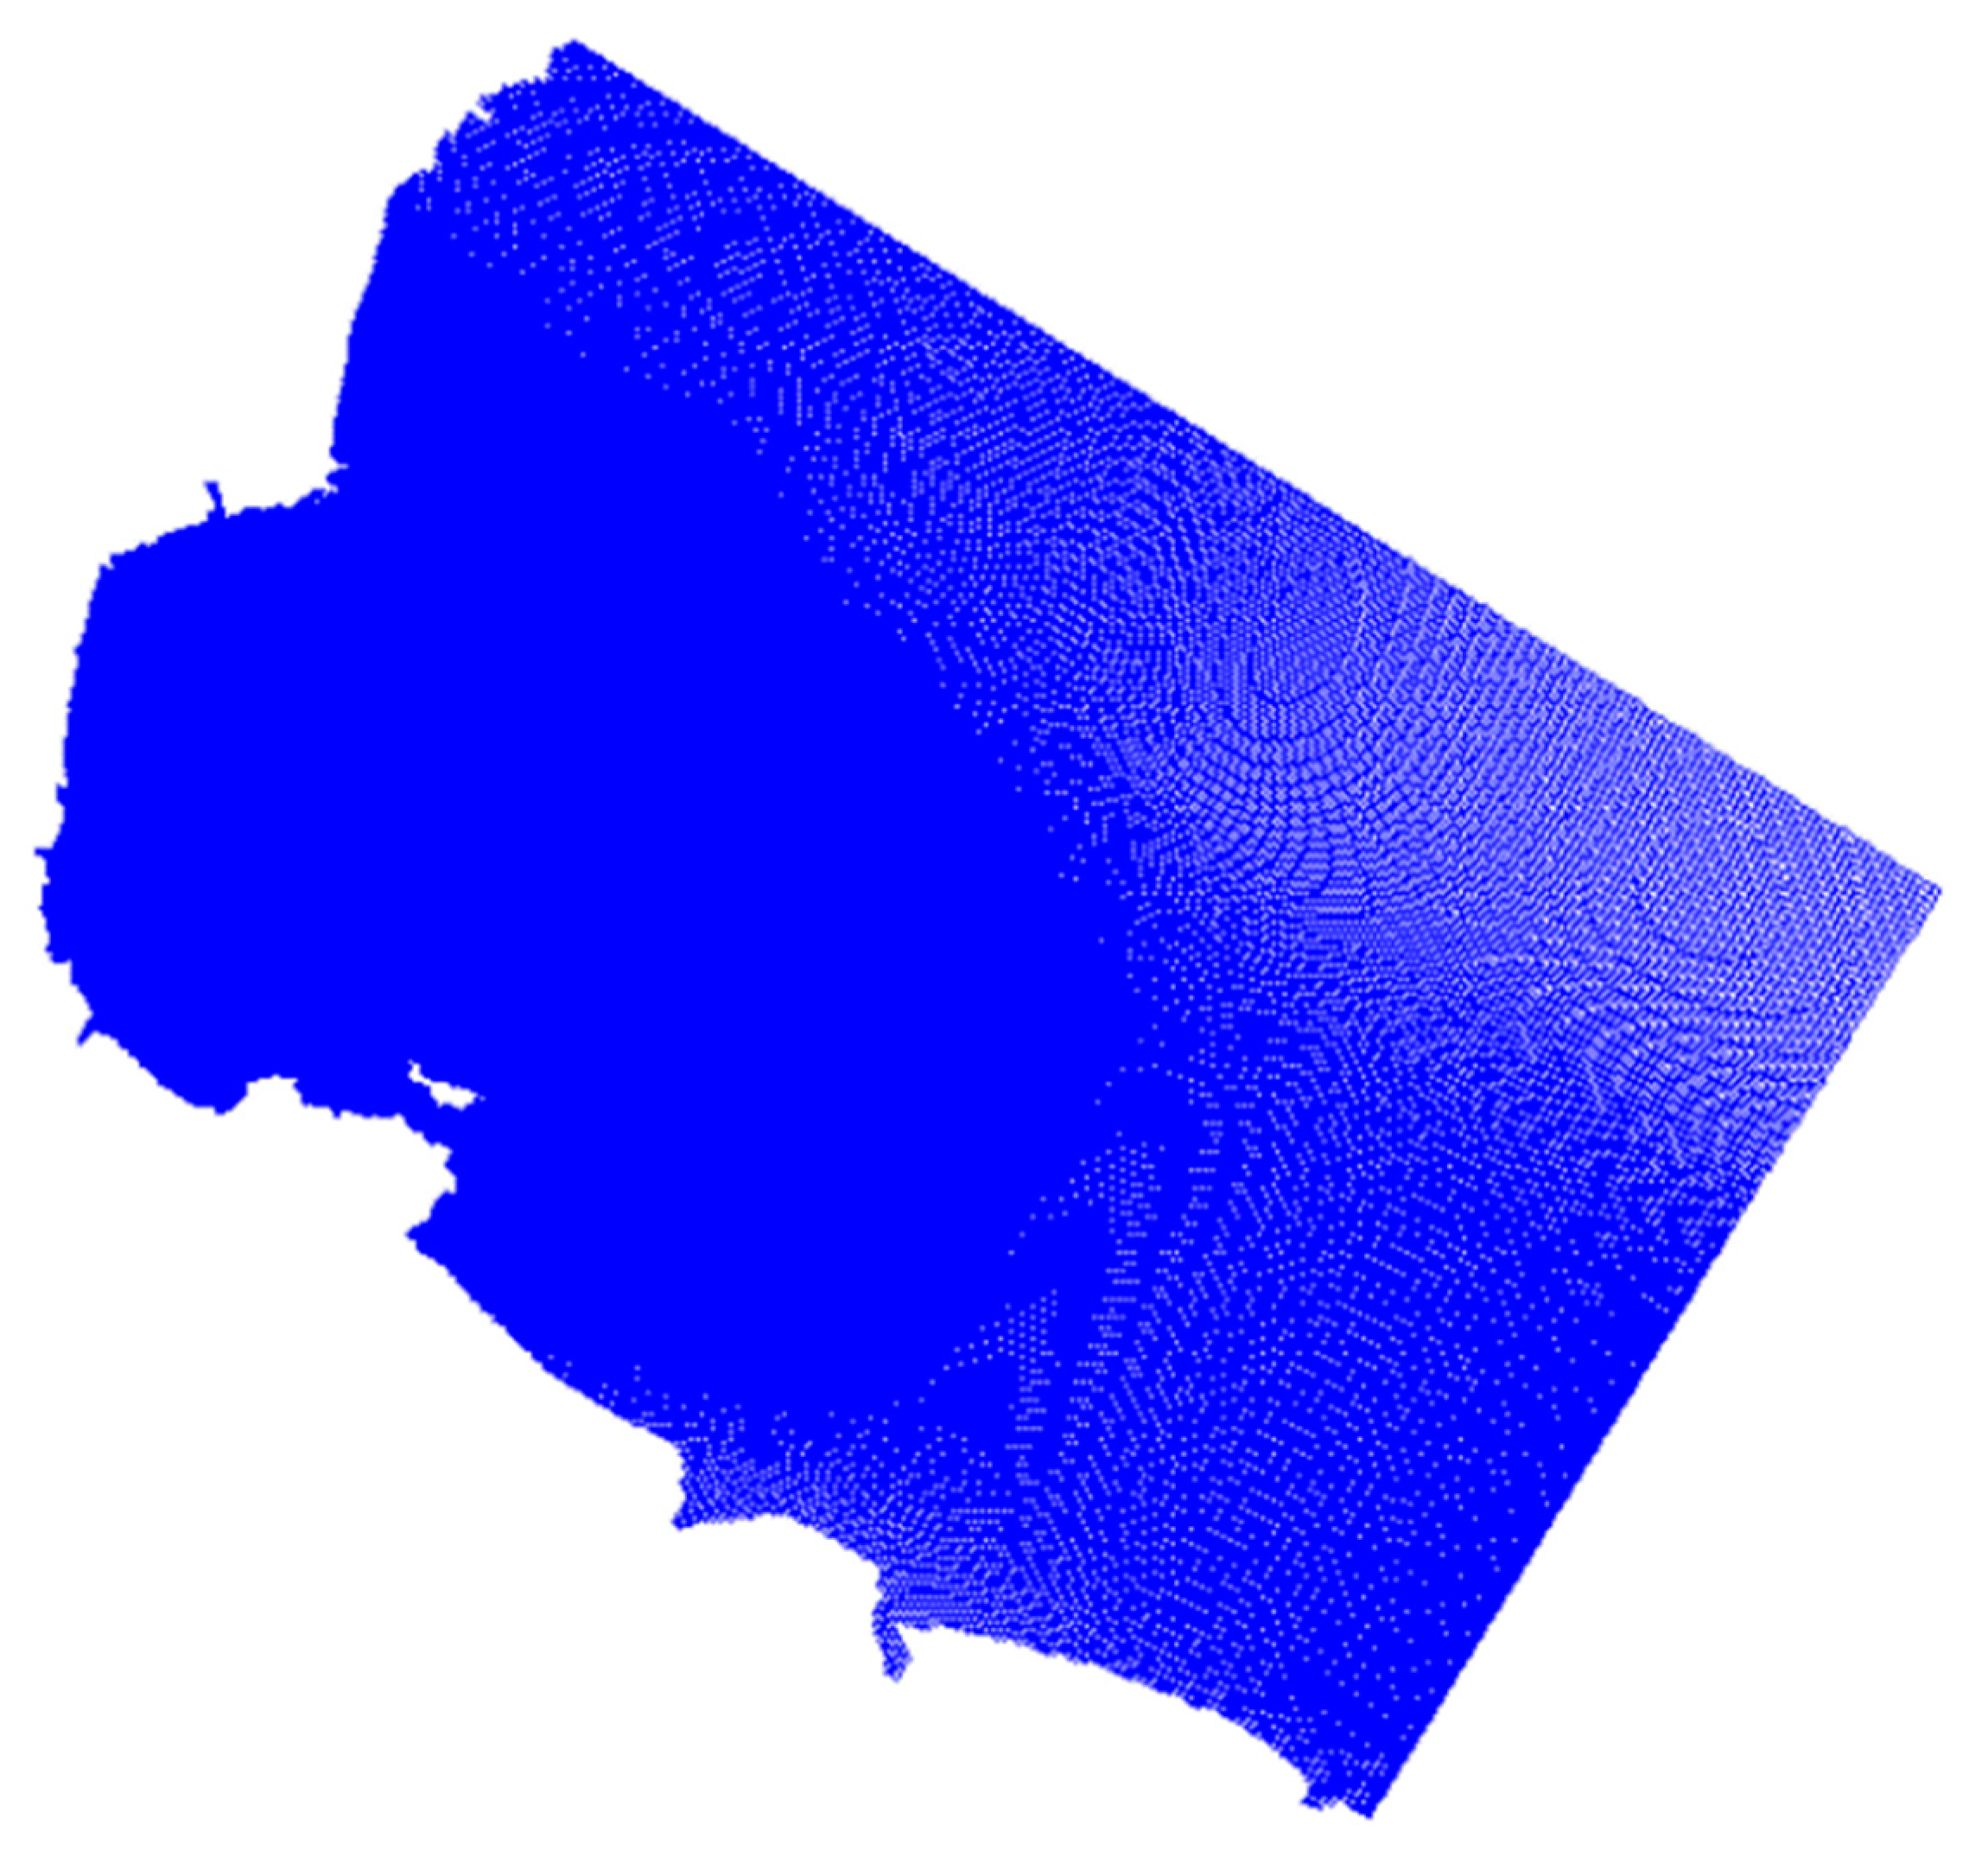
The Lianyungang area, spanning 113 km from north to south and 120 km from east to west, is taken as the scope for model calculation in this paper. Within this scope, the northwest and southwest boundaries are the fixed boundaries of Lianyungang. The northeast and southeast boundaries are the open boundaries of the sea area. The control method of boundary conditions is the tidal level control. Orthogonal grids are used to draw the model. There are 387,325 grid cells in the model. In the process of grid drawing, the sea area of Haizhou Bay is encrypted. The smallest grid cell is 82 m × 69 m. The Manning coefficient is 0.02. The water temperature is 5 °C. The annual average wind speed is 5.5 m/s, and the normal wind direction is east (Figure 3). For more details, please refer to [40].

Model Validation

The research focus of this paper is the change mechanism of Marine environmental capacity in Haizhou Bay from 2006 to 2016.Therefore, the calculation of the model and the validation of the model need to adopt the data matching the research period. In the simulation calculation of Marine environmental capacity in 2006, the coastline, seabed topography, and hydrological data in 2006 were used for the numerical simulation. In the simulation calculation of Marine environmental capacity in 2016, corresponding data of the study area in 2016 were used for numerical simulation. The calculated results of the model coincide well with the measured values of tidal current in 2006 and 2016. This means that the model better reflects the actual situation and can accurately predict the hydrodynamic characteristics of the sea area near Lianyungang.

Flow Field Diagram

Haizhou Bay is controlled by a rotary tidal wave that moves from north to south but exhibits a rectilinear current along the shore. When the tide rises, the open-side tide flows into Haizhou Bay from northeast to southwest (NE–SW). When the tide recedes, it runs off the bay from southwest to northeast (SW–NE). The calculation boundary is perpendicular or parallel to the direction of the tidal hydrodynamic force, namely in the NW–SE or NE–SW direction (Figure 4).

2.3.5. The Influencing Factors and Changes of Bay Environmental Capacity

Compared with 2016, due to the marine development activities in Haizhou Bay and the input of pollutants into the sea, the topography and seawater quality have changed, the tidal volume of Haizhou Bay has changed, and the marine environment capacity will also change.
We hope to study the impact of topography and water quality on the Marine environmental capacity of Haizhou Bay by means of quantitative calculation. So we assumed two computational boundaries and scenarios.
Scenario A (2006 terrain + 2016 water quality): The marine environmental capacity under the land-side boundary conditions and the topography of Haizhou Bay in 2006, and the background seawater quality condition in 2016.
Scenario B: The marine environmental capacity under the land-side boundary conditions and the topography of Haizhou Bay in 2016, and the background seawater quality condition in 2006 (2016 terrain + 2006 water quality).
Scenarios A and B assume that only one of the two variables, the topography and water quality, has changed in the decade between 2006 and 2016. We calculate the environmental capacity under the conditions of Scenario A and Scenario B by the box model method and the numerical simulation method.
After that, comparing the actual marine environmental capacity in 2006 and 2016 with the hypothetical scenario A and scenario B, the impact of topography or water quality on the environmental capacity could be quantified.
The difference between Scenario A and the 2006 environmental capacity reflects the water quality on the environmental capacity; the difference between the 2016 environmental capacity and Scenario A reflects the impact of topographic changes on the environmental capacity.
The comparison shows that the difference between environmental capacity in 2006 and Scenario B reflects the impact of topographic changes on environmental capacity, while the difference between Scenario B and the environmental capacity in 2016 reflects the impact of water quality on the environmental capacity.

3. Results

3.1. Changes in Natural Conditions

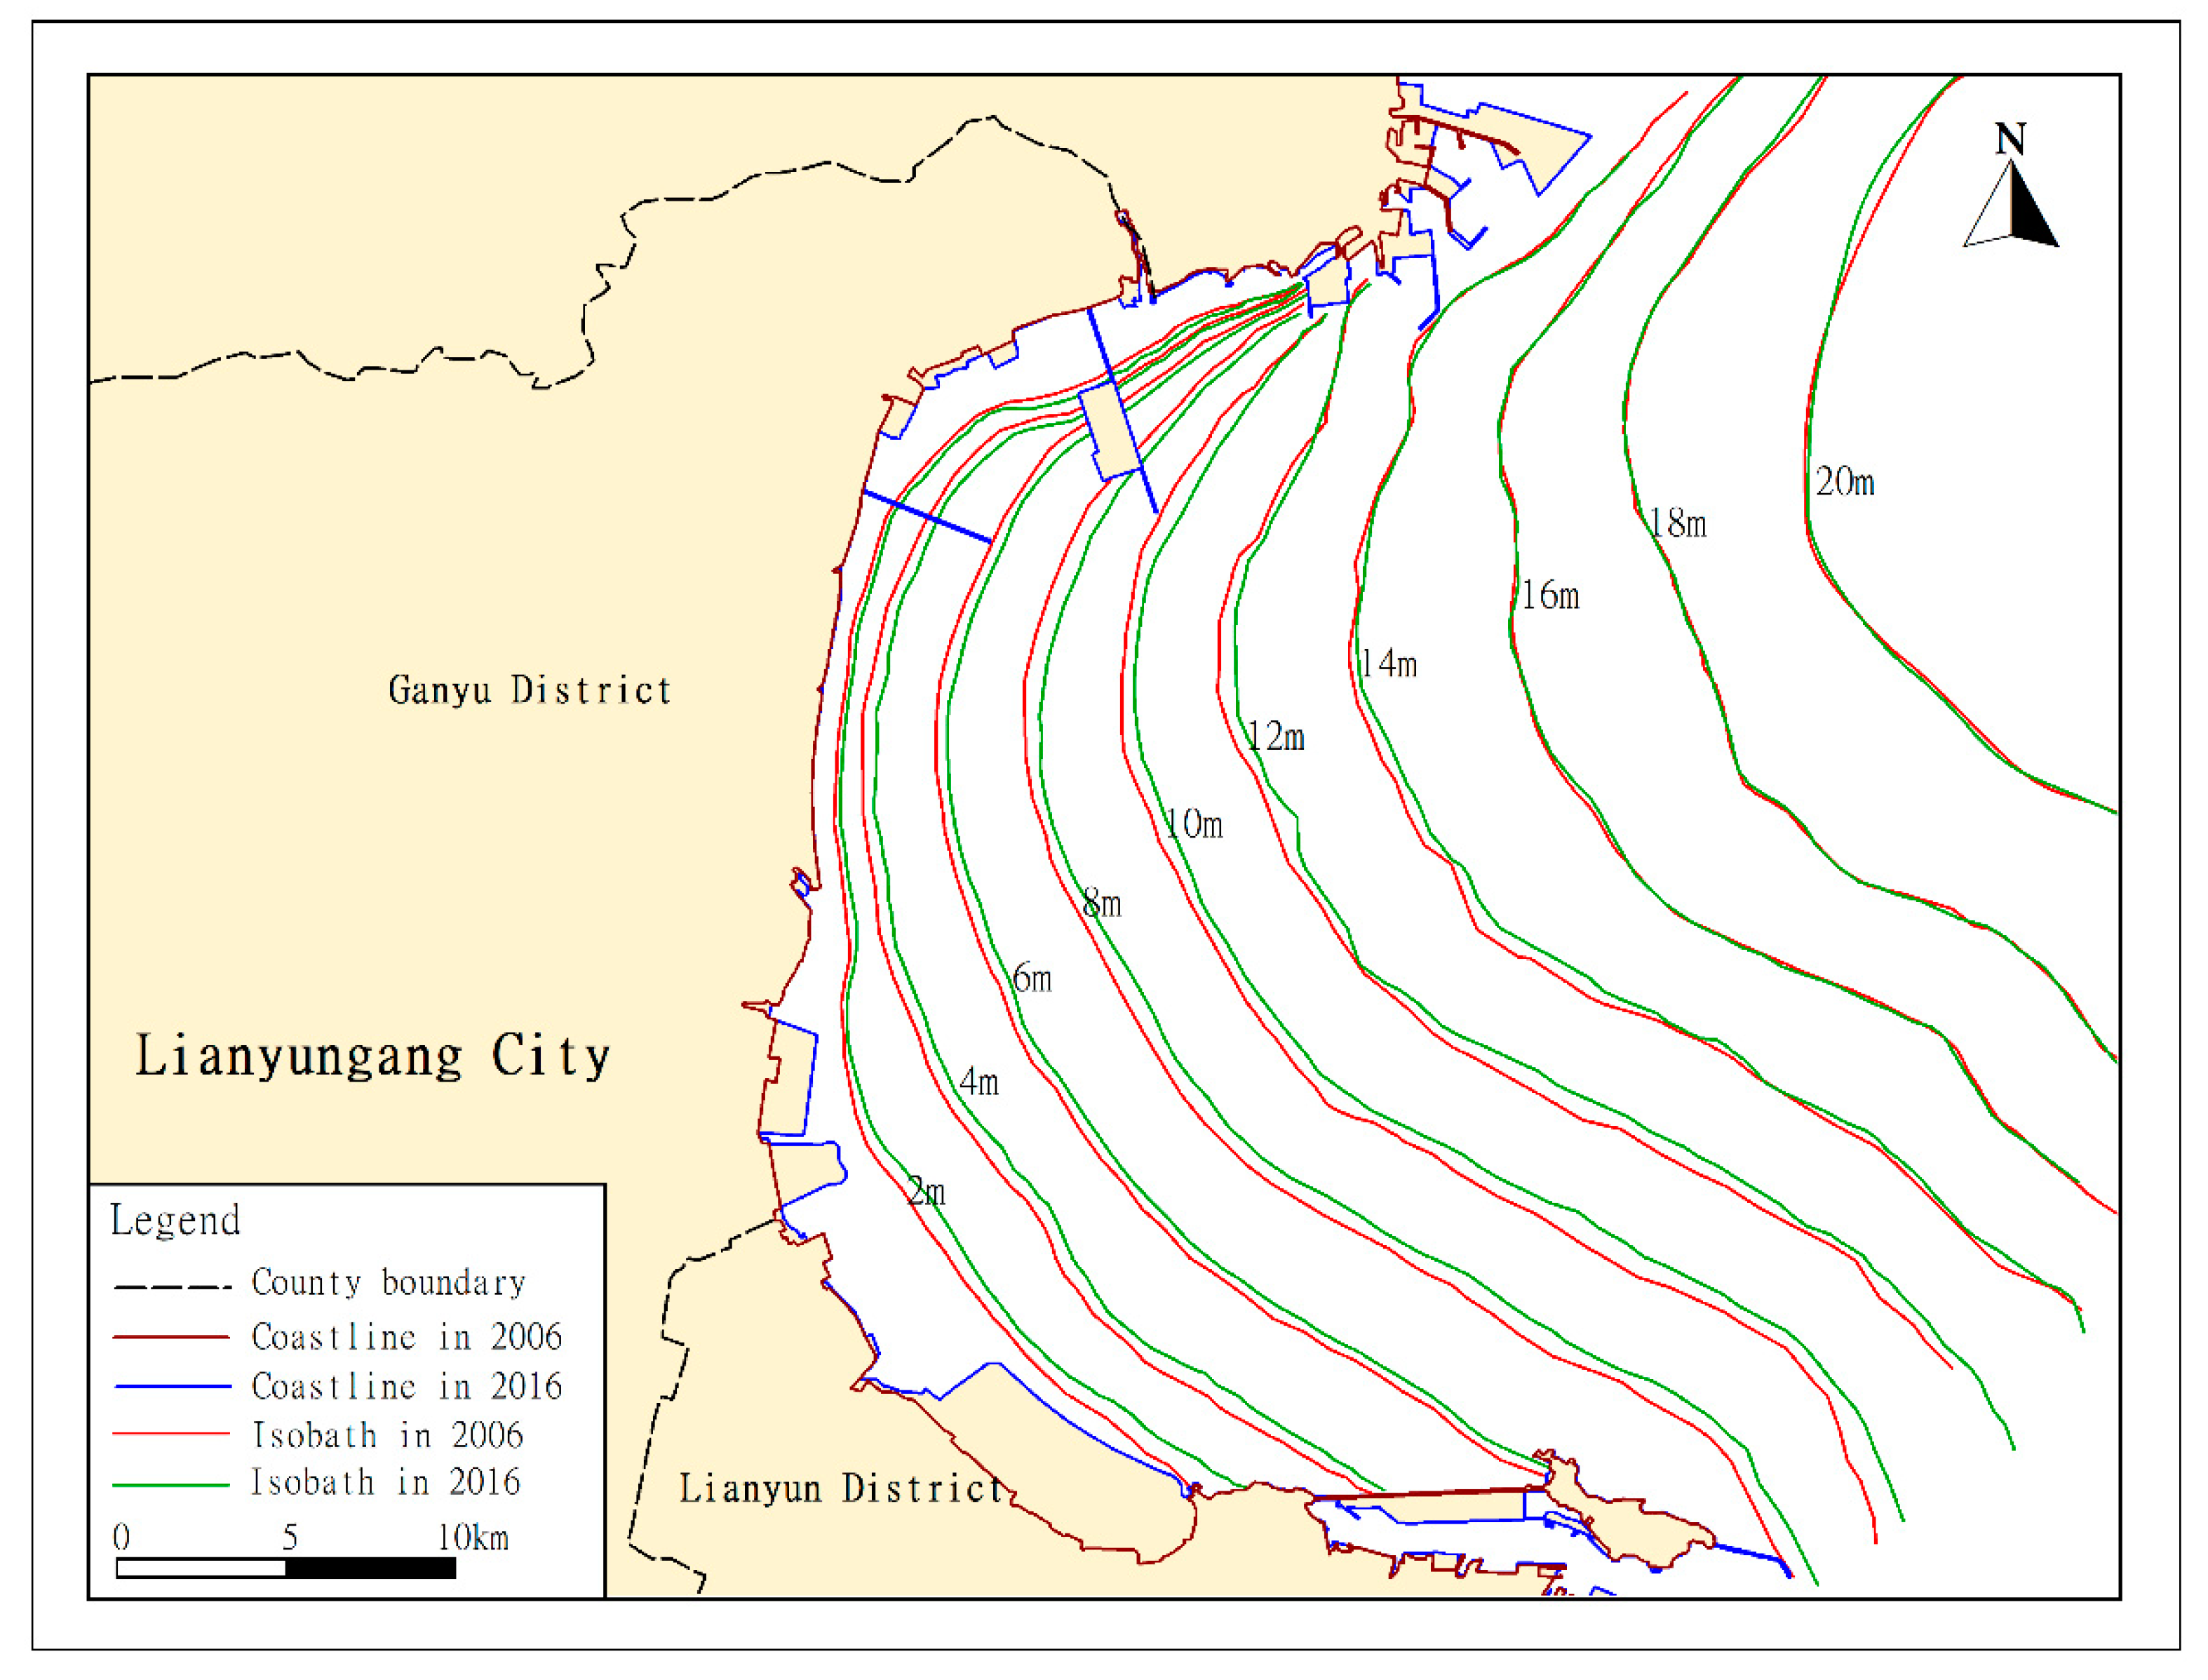
According to the measured topographic data of Haizhou Bay in 2006 and 2016, the isobath maps are drawn by ArcGIS, and the isobath lines of these two years are overlapped and analyzed. The comparative study of the Isobaths in 2006 and 2016 shows that the 16 m, 18 m and 20 m Isobaths are basically coincident. It can be inferred that the topographic change of Haizhou Bay deeper than 16m is smaller. But there’s a lot of topographic change in sea area shallower than 16 m. On average, the isobaths from 2 m to 14 m of Haizhou Bay moved outwards by 350 m from 2006 to 2016 (Figure 5). The changes in isobath show that the sea area above the 16 m isobath was still in the silting state, and the sea area below the 16 m isobath was basically stable.
In 2006, the mean concentrations of COD, labile phosphate, and inorganic nitrogen of Haizhou Bay met the standards of second-class seawater quality (Table 1). In 2016, the mean concentrations of COD and labile phosphate still met the standard, whereas that of inorganic nitrogen exceeded it. The mean concentrations of all three variables were all raised, and that of inorganic nitrogen had increased by 284.5%, signaling an overall tendency of the water quality of Haizhou Bay to worsen.
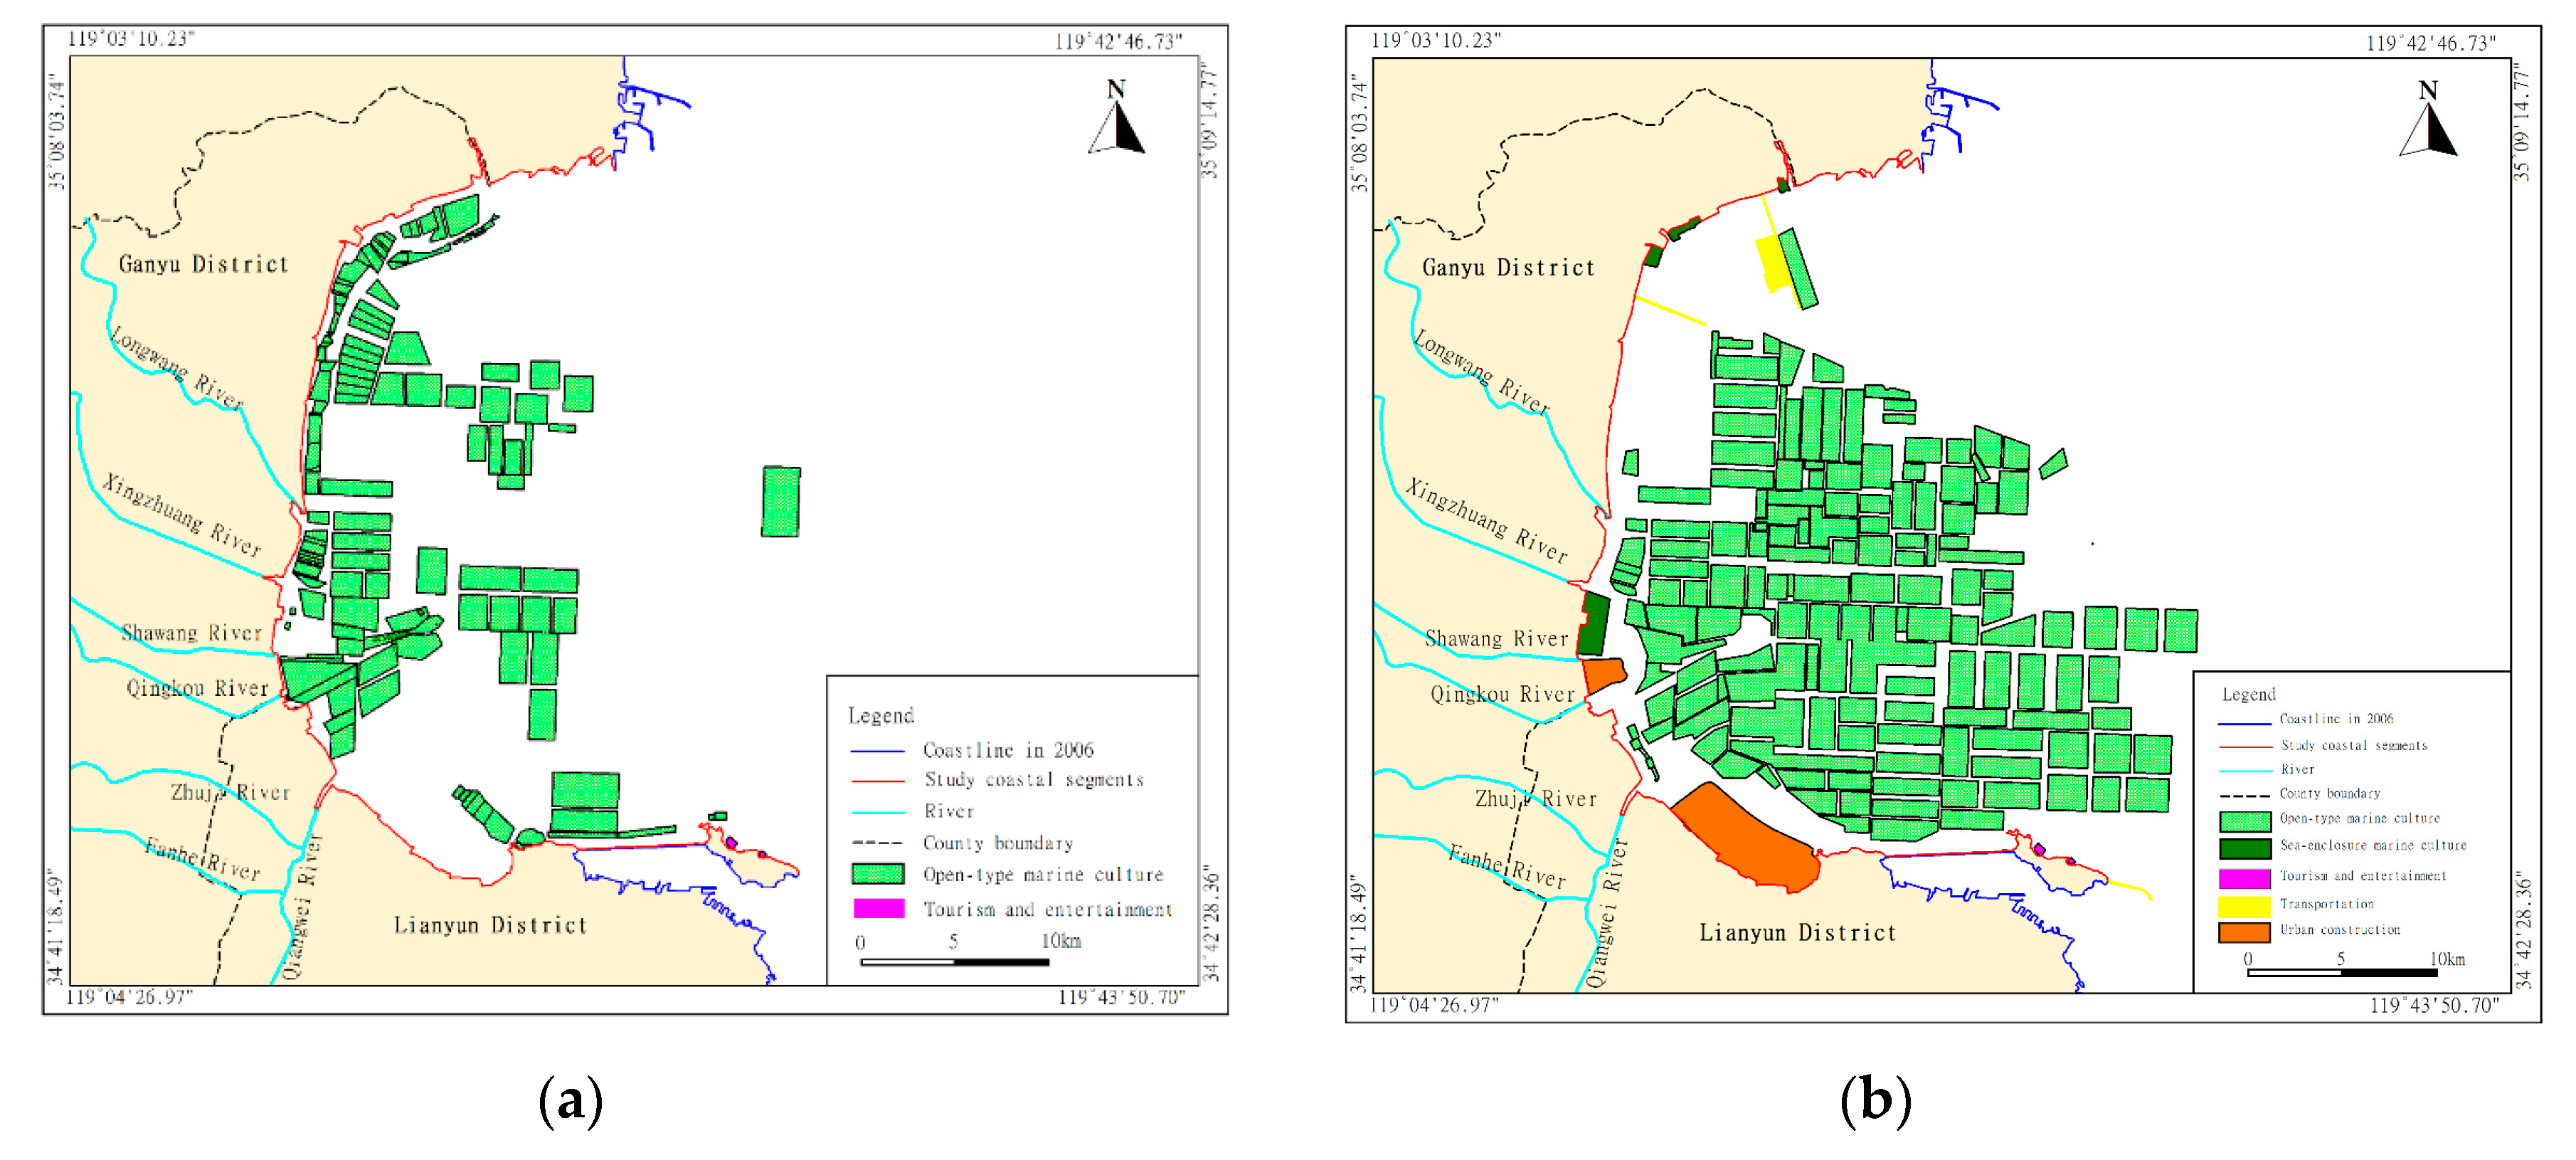
In 2006, 168.5 km2 of sea area was developed in the study area, 99.8% for open-type marine culture and 0.2% for tourism and entertainment (Figure 6a). In 2016, 414 km2 of sea area was developed in the study area: 91.5% for open-type marine culture, 1.6% for sea-enclosure marine culture, 0.1% for tourism and entertainment, 0.9% for communications and transportation, and 5.9% for urban construction (Figure 6b). The area of marine development and utilization in the study area increased by 1.5 times, and the sea area use types increased from two to five. The area of sea reclamation over these 10 years was 34.9 km2.
From 2006 to 2016, great changes occurred in the coastline, submarine topography, seawater quality, and coastal development of Haizhou Bay, threatening the environment and potentially strongly affecting the ECG.

3.2. ECG Calculation Results for 2006 and 2016

According to the data for Haizhou Bay’s terrain in 2006, L was 10.367 m, S was 101.034 million m2, and Vx was 10.474 billion m3. According to the data in the “Current Conditions and Assessment of Trends of Water Quality in the Offshore Water of Haizhou Bay” report published by the Marine Environmental Forecasting Center and Fishery Ecological Environment Monitoring Station of Jiangsu Province, the pollutant concentration of COD inside Haizhou Bay (Cx) and the pollutant concentration of COD outside Haizhou Bay (Cw) were 1.39 and 1.205 mg/L, respectively. According to the Marine functional zoning of Jiangsu Province (2005–2010), most of the studied areas were agricultural and fishery areas, which should meet the class II seawater quality standard. According to the “Sea water quality standard (GB 3097-1997)”, the concentration limit of COD class II water quality standard is 3 mg/L. Delft 3D software was used to calculate the average water exchange capacity of the study area. The model calculation time was from January 22nd to January 30th, in 2006. The spring tide and neap tide were included in the simulation period, and the daily average water exchange volume of the spring tide and neap tide was obtained. The mean exchanged water body volume of Haizhou Bay (Vn) was 5.91825 billion cubic m/day in 2006. The ECG calculation methods and equations revealed that ECSd was 14,559.13 tons and ECSb was 31,422.58 tons; thus, ECS was 16,863.45 tons and ECD was 1094.88 tons. Therefore, ECG was 17,958.33 tons in 2006 (Table 2).
According to the data for Haizhou Bay’s terrain in 2016, L was 10.413 m, S was 97.541 million m2, and Vx was 10.157 billion m3. According to the data in the “Report on Offshore Environmental Quality of Lianyungang of Jiangsu Province”, 2016, Cx and Cw were 1.63 and 1.40 mg/L, respectively. According to the Marine functional zoning of Jiangsu Province (2011‒2020), most of the studied areas were agricultural and fishery areas, which should meet the class II seawater quality standard. The concentration limit of COD class II water quality standard is 3 mg/L. The mean exchanged water body volume of Haizhou Bay (Vn) was 5.5575 billion cubic m/day in 2016. Through the ECG calculation methods and equations, ECSd was 14,555.82 and ECSb was 31,470.83 tons, so ECS was 13,915.01 tons and ECD was 1278.23 tons. Therefore, ECG was 15,193.25 tons in 2016 (Table 2).

3.3. Calculation Results for the Hypothetical Scenarios

Similarly, using the box model and numerical simulation method, we calculate the COD environmental capacity of Scenario A and Scenario B (Table 3).

4. Discussion

4.1. Practical ECG Change Between 2006 and 2016

Compared with 2006, the average COD concentration of pollutants in and outside Haizhou Bay increased in 2016, reflecting the deteriorating trend of marine water quality in the study area. In 2016, the area of the tank within the calculated boundary was reduced by 34.93 million square meters compared with that in 2006. In 2016, the volume of seawater in the tank decreased by 317.25 million cubic meters compared with 2006. This was mainly due to the implementation of the reclamation project in the last 10 years. The average water exchange volume in the gulf in 2016 was 360.75 million cubic meters per day less than in 2006. In 2016, the COD environmental capacity of the Haizhou Bay waters decreased by 2765.08 tons compared with 2006, the static environmental capacity decreased by 2948.44 tons, and the dynamic environmental capacity increased by 183.35 tons. On the whole, due to the implementation of the Haizhou Bay’s coastal reclamation project and the deterioration of the marine water environmental quality background, the marine environmental capacity of the Haizhou Bay decreased.
In 2016, compared with 2006, the static environmental capacity decreased by 2948.44 tons; the theoretical maximum static environmental capacity decreased by 951.75 tons, and the used static environmental capacity increased by 1996.69 tons. ECSd is influenced by seawater quality and water body volume. We assumed that the water body in Haizhou Bay was not polluted, namely a mean COD of 0 mg/L, and that its change was only influenced by sea reclamation projects. Under these circumstances, ECSb decreased by 951.75 tons. The environmental capacity of the bay decreased by 1996.69 tons due to the change of water quality between 2006 and 2016.
In 2016, compared with 2006, the theoretical maximum dynamic environmental capacity decreased by 1082.25 tons, and the dynamic environmental capacity increased by 183.35 tons. ECD is influenced by water quality changes inside and outside of the bay and the change in the net tidal prism. We assumed that the water quality change inside the bay was the poorest scenario of ideal ECD reduction (just meeting the standard of the second-class water quality), while that outside the bay was the best scenario (clean water), which represents the theoretical maximum of water pollution diffusion of unit net tidal prism). The mean COD was 3 mg/L inside the bay and 0 mg/L outside the bay, with a 3 mg/L difference, and the ECG reduction that only considered net tidal prism decline was 10.8225 million tons. However, water quality inside and outside the bay, and especially the difference between them, cannot be ignored because a greater difference leads to more diffuse pollutants in total. The actual changes in water quality inside and outside the bay, their difference, and the coastal change due to sea reclamation increased ECD by 183.35 tons from 2006 to 2016. In other words, although sea reclamation reduced the net tidal prism of the water body exchange by 360.75 million m3/d and the theoretical ECD by 10.8225 million tons, the difference of water quality inside and outside the bay cannot be considered negligible. The COD difference inside and outside the bay increased from 0.185 mg/L in 2006 to 0.23 mg/L in 2016, signaling a growth in the ability of the unit water body to exchange and transport pollutants. Hence, the decline in net tidal prism between 2006 and 2016 raised the ECD.
According to this analysis, ECD was influenced by the net tidal prism and the difference of water quality inside and outside the bay. The theoretical ECD merely shows the environment quality change (ideal maximum change) triggered by the changes in water depth, terrain, and the net tidal prism owing to factors such as sea reclamation; thus, it is limited to a theoretical discussion instead of a practical calculation of ECG. However, variations in the water quality difference can control ECG change and increase ECD, even under the overall degradation of water quality. Seawater deterioration may lead to the continuous increase in ECG instead of having no influence, because the degradation decreases ECSb, and the polluted water can enter the bay through water body exchange. In the long term, the water body quality outside the bay will worsen, diminishing the difference of water quality inside and outside the bay and further reducing the ECD.

4.2. ECG-Influencing Factors and Ratios

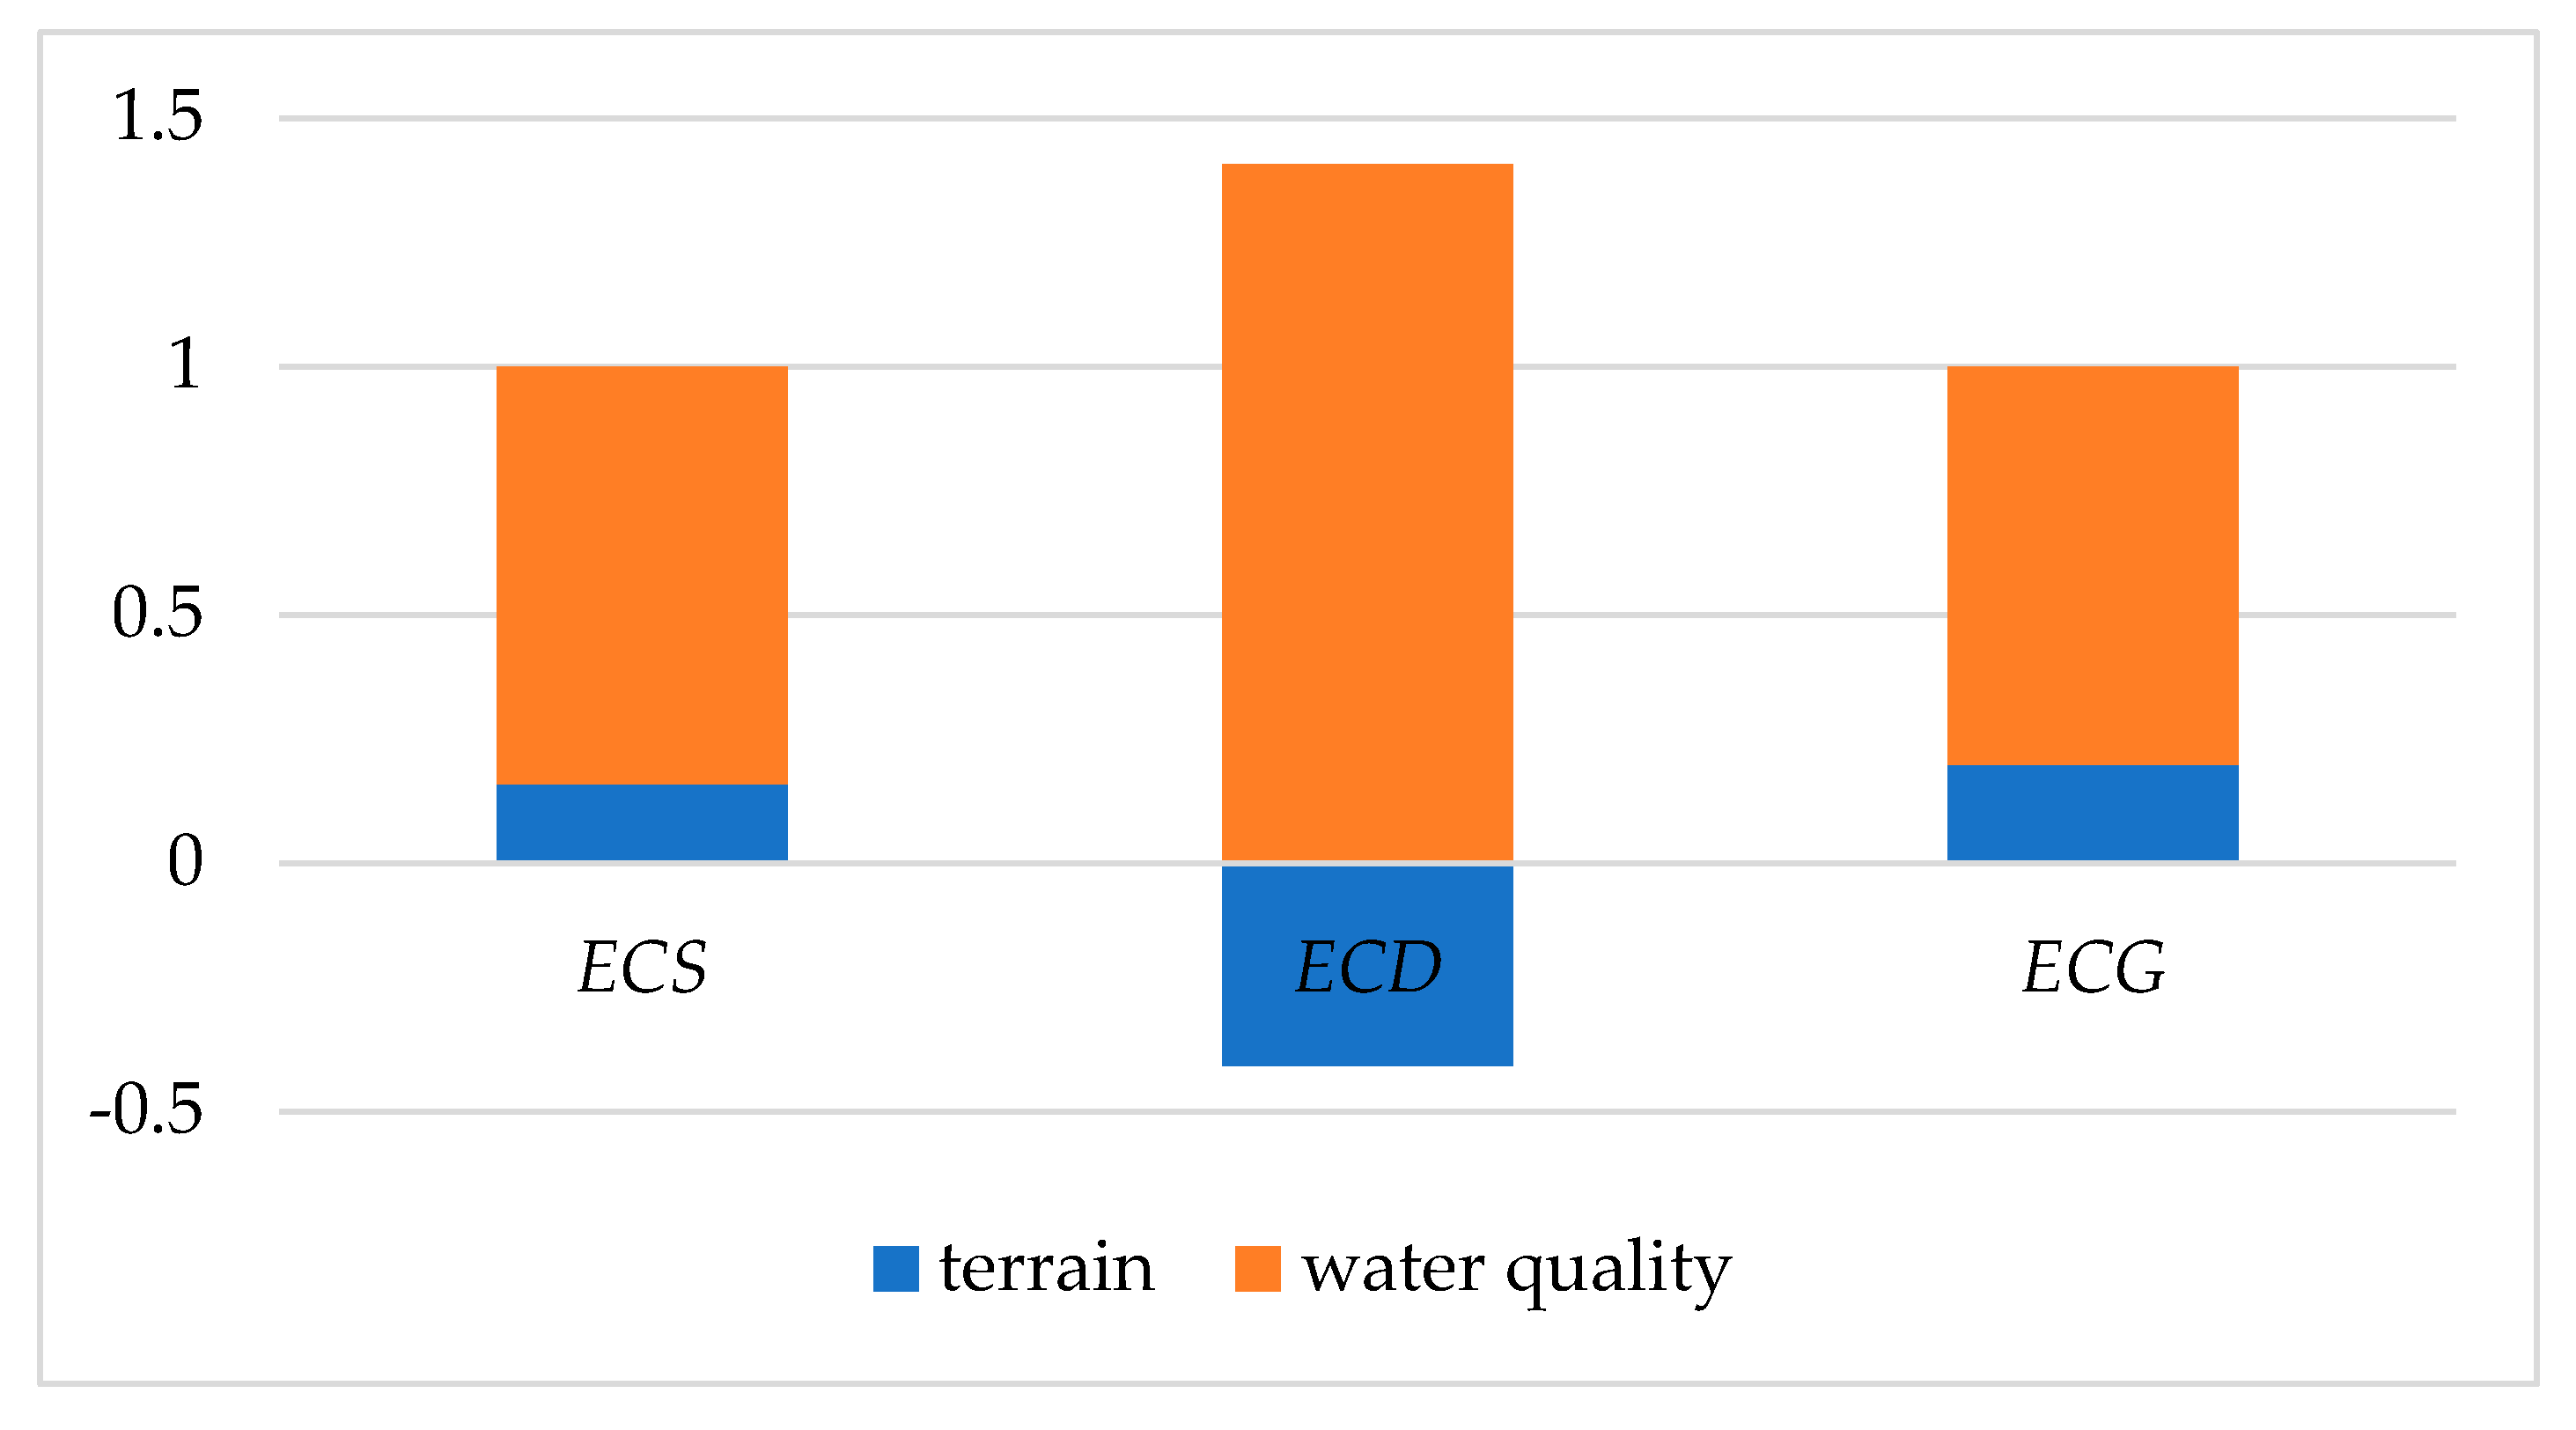
To further discuss the influence of changes in terrain and water quality on ECG in different factor combinations, their influencing ratios were analyzed in combinations #1 (terrain combined with water quality) and #2 (water quality combined with terrain). Based on different boundary conditions, how the changes in terrain caused by sea reclamation, water quality because of water quality variation, and differences in water quality inside and outside the bay influence the environmental capacity were examined according to #1 and #2 (Table 4, Figure 7). Considering that the theoretical maximum static environmental capacity and theoretical maximum dynamic environmental capacity are only affected by the change in net tidal capacity, and that there is a big gap between the theoretical maximum static environmental capacity and the actual environmental capacity, this part mainly discusses the topographic change caused by reclamation: the water quality change between inside and outside the bay on the static residual environmental capacity and dynamic environmental capacity; meanwhile, the environmental capacity of the bay is discussed according to paths 1 and 2.
The difference between Scenario B and the actual environmental capacity in 2006 reflects the impact of topographical changes on environmental capacity. The results show that the topographic change caused by reclamation resulted in a total reduction of 577.51 tons in the sea area compared with 2006, including 510.77 tons of static residual environmental capacity and 66.74 tons of dynamic environmental capacity. This shows that the reduction of the bay area and the weakening of water exchange capacity caused by reclamation activities lead to the reduction of static and dynamic environmental capacity. The difference between Scenario A and the actual environmental capacity in 2006 reflects the impact of water quality changes on environmental capacity. The calculation results show that the static residual environmental capacity decreased by 2513.8 tons due to the deterioration of water quality in the bay, while the dynamic environmental capacity increased by 266.32 tons per day due to the increase of water quality difference between inside and outside the bay. However, in terms of the total environmental capacity of the bay per day, there was still a decrease of 2247.48 tons, which shows that the deterioration of water environment quality was still the main reason for the decrease in environmental capacity.
The ECG changes of #1 and #2 conformed to the actual ECG changes from 2006 to 2016, indicating that both #1 and #2 can be adopted to precisely simulate the joint effect of changes in terrain and water quality on ECG and thus can be used for analysis.
In #1, the influencing ratios of terrain to water quality on ECG reduction, ECSb decline, and ECD change were 0.209:0.791, 0.173:0.827, and −0.364:1.364, respectively. In #2, the influencing ratios of terrain to water quality on ECG reduction, ECSb decline, and ECD change were 0.187:0.813, 0.147:0.853, and −0.453:1.453, respectively. This means that a calculation based on terrain changes (#1) will overstate the impact of terrain changes, while a calculation based on water quality changes (#2) will overstate the impact of changes in the water quality. Therefore, to comprehensively consider both factors, the mean of #1 and #2 was adopted in this calculation, and the ratio of terrain to water quality on ECG reduction, ECSb decline, and ECD change were 0.198:0.802, 0.16:0.84, and −0.408:1.408, respectively. As a result, the poorer water quality led to an ECG reduction 4.05 times that of sea reclamation, an ECSb decline by 5.25 times, and an ECD decline by 3.45 times that of sea reclamation in terms of absolute value.
In this study, only physical diffusion was considered, while biological and chemical factors were ignored. Thus, the true ECG is likely to be higher. Future studies should also include the combined influence of physical diffusion and biochemical decomposition on the environmental capacity.

5. Conclusions

From 2006 to 2016, the area of the tank within the calculated boundary decreased from 1010.34 km2 by 34.93 km2 to 975.41 km2, the seawater volume dropped by 0.317 25 km2; the mean exchanged water body volume of Haizhou Bay (Vn) decreased from 5.91825 billion m3/d by 360.75 million m3/d to 5.5575 billion m3/d; and the pollutant concentration of COD inside Haizhou Bay (Cx) increased from 1.39 to 1.63 mg/L, while the pollutant concentration of COD outside Haizhou Bay (Cw) increased from 1.205 to 1.40 mg/L.
The COD environmental capacity in Haizhou Bay was 17,958.33 tons in 2006 and 15,193.25 tons in 2016. In 2016, the COD environmental capacity of the Haizhou Bay waters decreased by 2765.08 tons compared with 2006, the static environmental capacity decreased by 2948.44 tons, and the dynamic environmental capacity increased by 183.35 tons.
The ratios of terrain to water quality on ECG reduction, ECSb decline, and ECD change were 0.198:0.802, 0.16:0.84, and −0.408:1.408, respectively. As a result, the rates of contributions of the two factors on ECG reduction, ECSb decline, and ECD change were 19.8% and 80.2%, 16% and 84%, and −40.8% and 140.8%, respectively. Poorer water quality led to an ECG reduction 4.05 times that of sea reclamation, ECSb decline 5.25 times that of sea reclamation, and ECD 3.45 times that of sea reclamation in absolute value, since a larger water quality difference increases ECG, whereas sea reclamation decreases ECG by diminishing the net tidal prism.
In view of the influencing factors of the sea area capacity of Haizhou Bay, in order to effectively protect the marine environment of Haizhou Bay, it is suggested that research be carried out on the control line of regional reclamation, with attention paid to the superimposed influence of reclamation on the marine environmental capacity and control of the reclamation scale. It is necessary to strengthen the management and control of the marine environment in Haizhou Bay, including the supervision of marine development activities and sewage discharge of rivers entering the sea. The total amount of pollutants discharged into Haizhou Bay should be controlled, and discharge standards should be strictly implemented to meet the discharge standards. We should strengthen the supervision of pollutant discharge from marine development activities. We should take necessary environmental protection measures to prohibit the direct discharge of pollutants in Haizhou Bay. We should control the pollution of mariculture wastewater, control the scale of aquaculture, and adopt ecological breeding methods to reduce the production and discharge of aquaculture wastewater. In order to improve the marine environment of Haizhou Bay and promote the social and economic sustainable development of Haizhou Bay, measures such as the control of the marine environment and the total amount of pollutants discharged from the sea must be taken.
The main innovation of this study is to expand the spatial and temporal boundaries of marine environmental capacity research. The marine environmental capacity of Haizhou Bay in 2006 and 2016 is calculated by a box model. The influencing factors of marine environmental capacity are analyzed, and the contribution rate of various influencing factors is calculated. This study explores the change and mechanism of marine environmental capacity and can provide a reference for other similar studies.

Author Contributions

L.S. and J.W. carried out the numerical simulation and cartography and analyzed the data; H.Z. provided support to the model setup and validation; L.S., J.W., H.Z., and M.X. discussed the results; the paper was written and edited by L.S. and J.W. the paper edited by L.S. and J.W. All authors have read and agreed to the published version of the manuscript.

Funding

This research was funded by a Jiangsu Provincial Marine Science and Technology Innovation Project, grant number HY2018-3.

Conflicts of Interest

The authors declare no conflict of interest.

References

  1. Heuvel, T.; Hillen, R.H. Coastline management with GIS in the Netherlands. Adv. Remote Sens. 1995, 4, 27–34. [Google Scholar]
  2. Muller, J.R.M.; Chan, Y.-C.; Piersma, T.; Chen, Y.-P.; Aarninkhof, S.G.J.; Hassell, C.J.; Tao, J.-F.; Gong, Z.; Wang, Z.B.; Van Maren, D.S. Building for Nature: Preserving Threatened Bird Habitat in Port Design. Water 2020, 12, 2134. [Google Scholar] [CrossRef]
  3. Yu, C.Y.; Liang, B.; Han, G.C.; Huo, C.L.; Zhang, Z.F.; Ma, M.H. Discussion on the procedure and method of Marine oil spill ecological damage assessment. Ocean Dev. Manag. 2015, 32, 92–96. [Google Scholar] [CrossRef]
  4. Pérez, P.; Fernández, E.; Beiras, R. Fuel toxicity on Isochrysis galbana and a coastal phytoplankton assemblage: Growth rate vs. variable fluorescence. Ecotoxicol. Environ. Saf. 2010, 73, 254–261. [Google Scholar] [CrossRef] [PubMed]
  5. O’Driscoll, M.; Clinton, S.; Jefferson, A.; Manda, A.; McMillan, S. Urbanization Effects on Watershed Hydrology and In-Stream Processes in the Southern United States. Water 2010, 2, 605–648. [Google Scholar] [CrossRef]
  6. Dong, Z.; Kuang, C.; Gu, J.; Zou, Q.; Zhang, J.; Liu, H.; Zhu, L. Total Maximum Allocated Load of Chemical Oxygen Demand Near Qinhuangdao in Bohai Sea: Model and Field Observations. Water 2020, 12, 1141. [Google Scholar] [CrossRef]
  7. Yang, J.W. Theory and Practice of Conducting Total-Quantity Control of Pollutants Discharge in the Near shore Sea Area. Mar. Inf. 2001, 24–26. [Google Scholar] [CrossRef]
  8. Pravdić, V.; Juračić, M. The environmental capacity approach to the control of marine pollution: The case of copper in the Krka River Estuary. Chem. Ecol. 1988, 3, 105–117. [Google Scholar] [CrossRef]
  9. Krom, M.D.; Hornung, H.; Cohen, Y. Determination of the environmental capacity of Haifa Bay with respect to the input of mercury. Mar. Pollut. Bull. 1990, 21, 349–354. [Google Scholar] [CrossRef]
  10. Trela, J.; Płaza, E. Innovative technologies in municipal wastewater treatment plants in Sweden to improve Baltic Sea water quality. E3S Web Conf. 2018, 45, 113. [Google Scholar] [CrossRef] [Green Version]
  11. Malcangio, D.; Melena, A.; Damiani, L.; Mali, M.; Saponieri, A. Numerical Study of Water Quality Improvement in a Port through a Forced Mixing System. In Water Resources Management IX; WIT Press: Southampton, UK, 2017; pp. 69–80. [Google Scholar]
  12. Mali, M.; Ungaro, N.; Cardellicchio, A.; Dell’Anna, M.M.; Romanazzi, G.; Mastrorilli, P.; Damiani, L. Long-term monitoring programs to assess environmental pressures on coastal area: Weighted indexes and statistical elaboration as handy tools for decision-makers. Ecol. Indic. 2019, 101, 838–850. [Google Scholar] [CrossRef]
  13. Zhang, W.L.; Liu, H.; Feng, J.F.; Zhu, L.; Liu, Y.; Ma, Z.H. Research on the Total Dissolved Inorganic Nitrogen Flux into the Bohai Bay. Environ. Monit. Chi. 2015, 31, 41–44. [Google Scholar] [CrossRef]
  14. Yu, Y.; Peng, C.S.; Yu, L.L.; Gu, Q.B.; Chang, J.M. Environmental capacity calculation of petroleum hydrocarbons in Laizhou Bay—The discharge optimization method based on the nonlinear programming. Mar. Environ. Sci. 2014, 33, 293–299. [Google Scholar] [CrossRef]
  15. Long, Y.X.; Chen, J.; Han, B.X. Research on Marine Environmental Capacity in the Beibu Gulf Economic Zone. Acta Sci. Nat. Univ. Sunyatseni 2014, 53, 83–88. [Google Scholar] [CrossRef]
  16. Zhang, X.Q.; Sun, Y.L. study on the environmental capacity in Jiaozhou Bay. Mar. Environ. Sci. 2007, 26, 347–350+359. [Google Scholar]
  17. Ge, S.F. Study on Water Environmental Capacity of Liaohe River in Jilin Province. Ph.D. Thesis, Jilin University, Changchun, China, 2012. [Google Scholar]
  18. Wang, W.P. Study on Simulation of the Water Environmental Capacity Change and Controlling Measures of the Total Amount Pollutants Discharge in Jiulong River Watershed. Ph.D. Thesis, Xiamen University, Xiamen, China, 2007. [Google Scholar]
  19. Ma, X.X.; Li, C.Y.; Shi, X.H.; Zhao, S.N.; Sun, B.; Zhu, Y.H. Environment Capacity of the Wuliangsuhai Lake. J. Irrig. Drain. 2019, 38, 105–112. [Google Scholar] [CrossRef]
  20. Ou, M.L. Study on Impact of Three Gorges Reservoir Operation on Variation Characteristics of Nitrogen and Phosphorus in Waters of Poyang Lake. Master’s Thesis, East China University of Technology, Nanchang, China, 2012. [Google Scholar]
  21. Sun, X.M.; Zhang, C.Z.; Shen, X.W. Total amount control of pollutant discharged into sea area around Changxingdao Island. Mar. Environ. Sci. 2009, 28, 399–402. [Google Scholar] [CrossRef]
  22. Tang, J.Y. Research of Volume Control and Emission Reduction of COD, Nitrogen, Phosphorus in Water of Pulandian Bay. Master’s Thesis, Dalian Maritime University, Dalian, China, 2016. [Google Scholar]
  23. Jiang, H.Z.; Cui, L.; Yu, D.T.; Gao, F.; Wu, L.G. Study on sea area Environmental capacity of Majiazui sewage Outlet on Changxing Island in Dalian. J. Appl. Oceanogr. 2017, 36, 202–209. [Google Scholar] [CrossRef]
  24. Chen, Y. Environmental Capacity and Total Quantity Control of Nitrogen and Phosphorus in the Northern Part of Liaodong Bay. Master’s Thesis, Shanghai Ocean University, Shanghai, China, 2017. [Google Scholar]
  25. Lin, L.; Liu, D.Y.; Liu, Z.; Gao, H.W. Impact of land reclamation on marine hydrodynamic and ecological environment. Haiyang Xuebao 2016, 38, 1–11. [Google Scholar] [CrossRef]
  26. Lan, D.D.; Liang, B.; Ma, M.H.; Yu, C.Y.; Bao, C.G.; Xu, Y. Application of Marine environmental capacity analysis in planning environmental impact assessment. Ocean Dev. Manag. 2013, 30, 62–65. [Google Scholar] [CrossRef]
  27. Wang, C.Y.; Wang, X.L.; Li, K.Q.; Liang, S.K.; Su, R.G.; Yang, S.P. The estimation of copper, lead, zinc and cadmium fluxes into the sea area of the East China Sea interferenced by terrigenous matter and their environmental capacities. Acta Oceanol. Sin. 2010, 32, 62–76. [Google Scholar] [CrossRef]
  28. Lucea, A.; Duarte, C.M. Nutrient (N, P and Si) and carbon partitioning in the stratified NW Mediterranean. J. Sea Res. 2003, 49, 157–170. [Google Scholar] [CrossRef]
  29. Dafner, E.V.; Mallin, M.A.; Souza, J.J.; Wells, H.A.; Parsons, D.C. Nitrogen and phosphorus species in the coastal and shelf waters of Southeastern North Carolina, Mid-Atlantic U.S. coast. Mar. Chem. 2007, 103. [Google Scholar] [CrossRef]
  30. Sunda, W. The relationship between cupric ion activity and the toxicity of copper to phytoplankton. J. Mar. Res. 1975. [Google Scholar] [CrossRef]
  31. Myers, R.A.; MacKenzie, B.R.; Bowen, K.G. What is the carrying capacity for fish in the ocean? A meta-analysis of population dynamics of North Atlantic cod. Can. J. Fish. Aquat. Sci. 2001, 58, 1464–1476. [Google Scholar] [CrossRef]
  32. Stebbing, A.R.D. Environmental capacity and the precautionary principle. Mar. Pollut. Bull. 1992, 24, 287–295. [Google Scholar] [CrossRef]
  33. Tedeschi, S. Assessment of the environmental capacity of enclosed coastal sea. Mar. Pollut. Bull. 1991, 23, 449–455. [Google Scholar] [CrossRef]
  34. Guo, L.B.; Jiang, W.S.; Li, F.Q.; Wang, X.L. Environmental Capacity Calculation of COD and PHs in the Bohai Sea. Period. Ocean Univ. Chi. 2007, 37, 310–316. [Google Scholar] [CrossRef]
  35. Zhu, J.; Wang, J.F.; Tian, Z.F.; Chen, Y.X. Marine environment capacity research progress and calculation methods. Water Sci. Eng. Technol. 2009, 8–11. [Google Scholar] [CrossRef]
  36. Putzu, S.; Enrile, F.; Besio, G.; Cucco, A.; Cutroneo, L.; Capello, M.; Stocchino, A. A Reasoned Comparison between Two Hydrodynamic Models: Delft3D-Flow and ROMS (Regional Oceanic Modelling System). J. Mar. Sci. Eng. 2019, 7, 464. [Google Scholar] [CrossRef] [Green Version]
  37. Garcia, M.; Ramirez, I.; Verlaan, M.; Castillo, J. Application of a three-dimensional hydrodynamic model for San Quintin Bay, B.C., Mexico. Validation and calibration using OpenDA. J. Comput. Appl. Math. 2015, 273, 428–437. [Google Scholar] [CrossRef]
  38. Rueda-Bayona, J.G.; Osorio, A.F.; Guzman, A. Set-up and input dataset files of the Delft3d model for hydrodynamic modelling considering wind, waves, tides and currents through multidomain grids. Data Brief 2020, 28, 104921. [Google Scholar] [CrossRef]
  39. Dai, P.; Zhang, J.-S.; Zheng, J.-H.; Hulsbergen, K.; Van Banning, G.; Adema, J.; Tang, Z.-X. Numerical study of hydrodynamic mechanism of dynamic tidal power. Water Sci. Eng. 2018, 11, 220–228. [Google Scholar] [CrossRef]
  40. Sun, L.; Wang, J.; Zhang, H.; Xu, M. The Characteristics and Mechanism of Changes in the Marine Environmental Capacity of the Estuaries of Haizhou Bay in Northern Jiangsu from 2006 to 2016. J. Mar. Sci. Eng. 2020, 8, 787. [Google Scholar] [CrossRef]
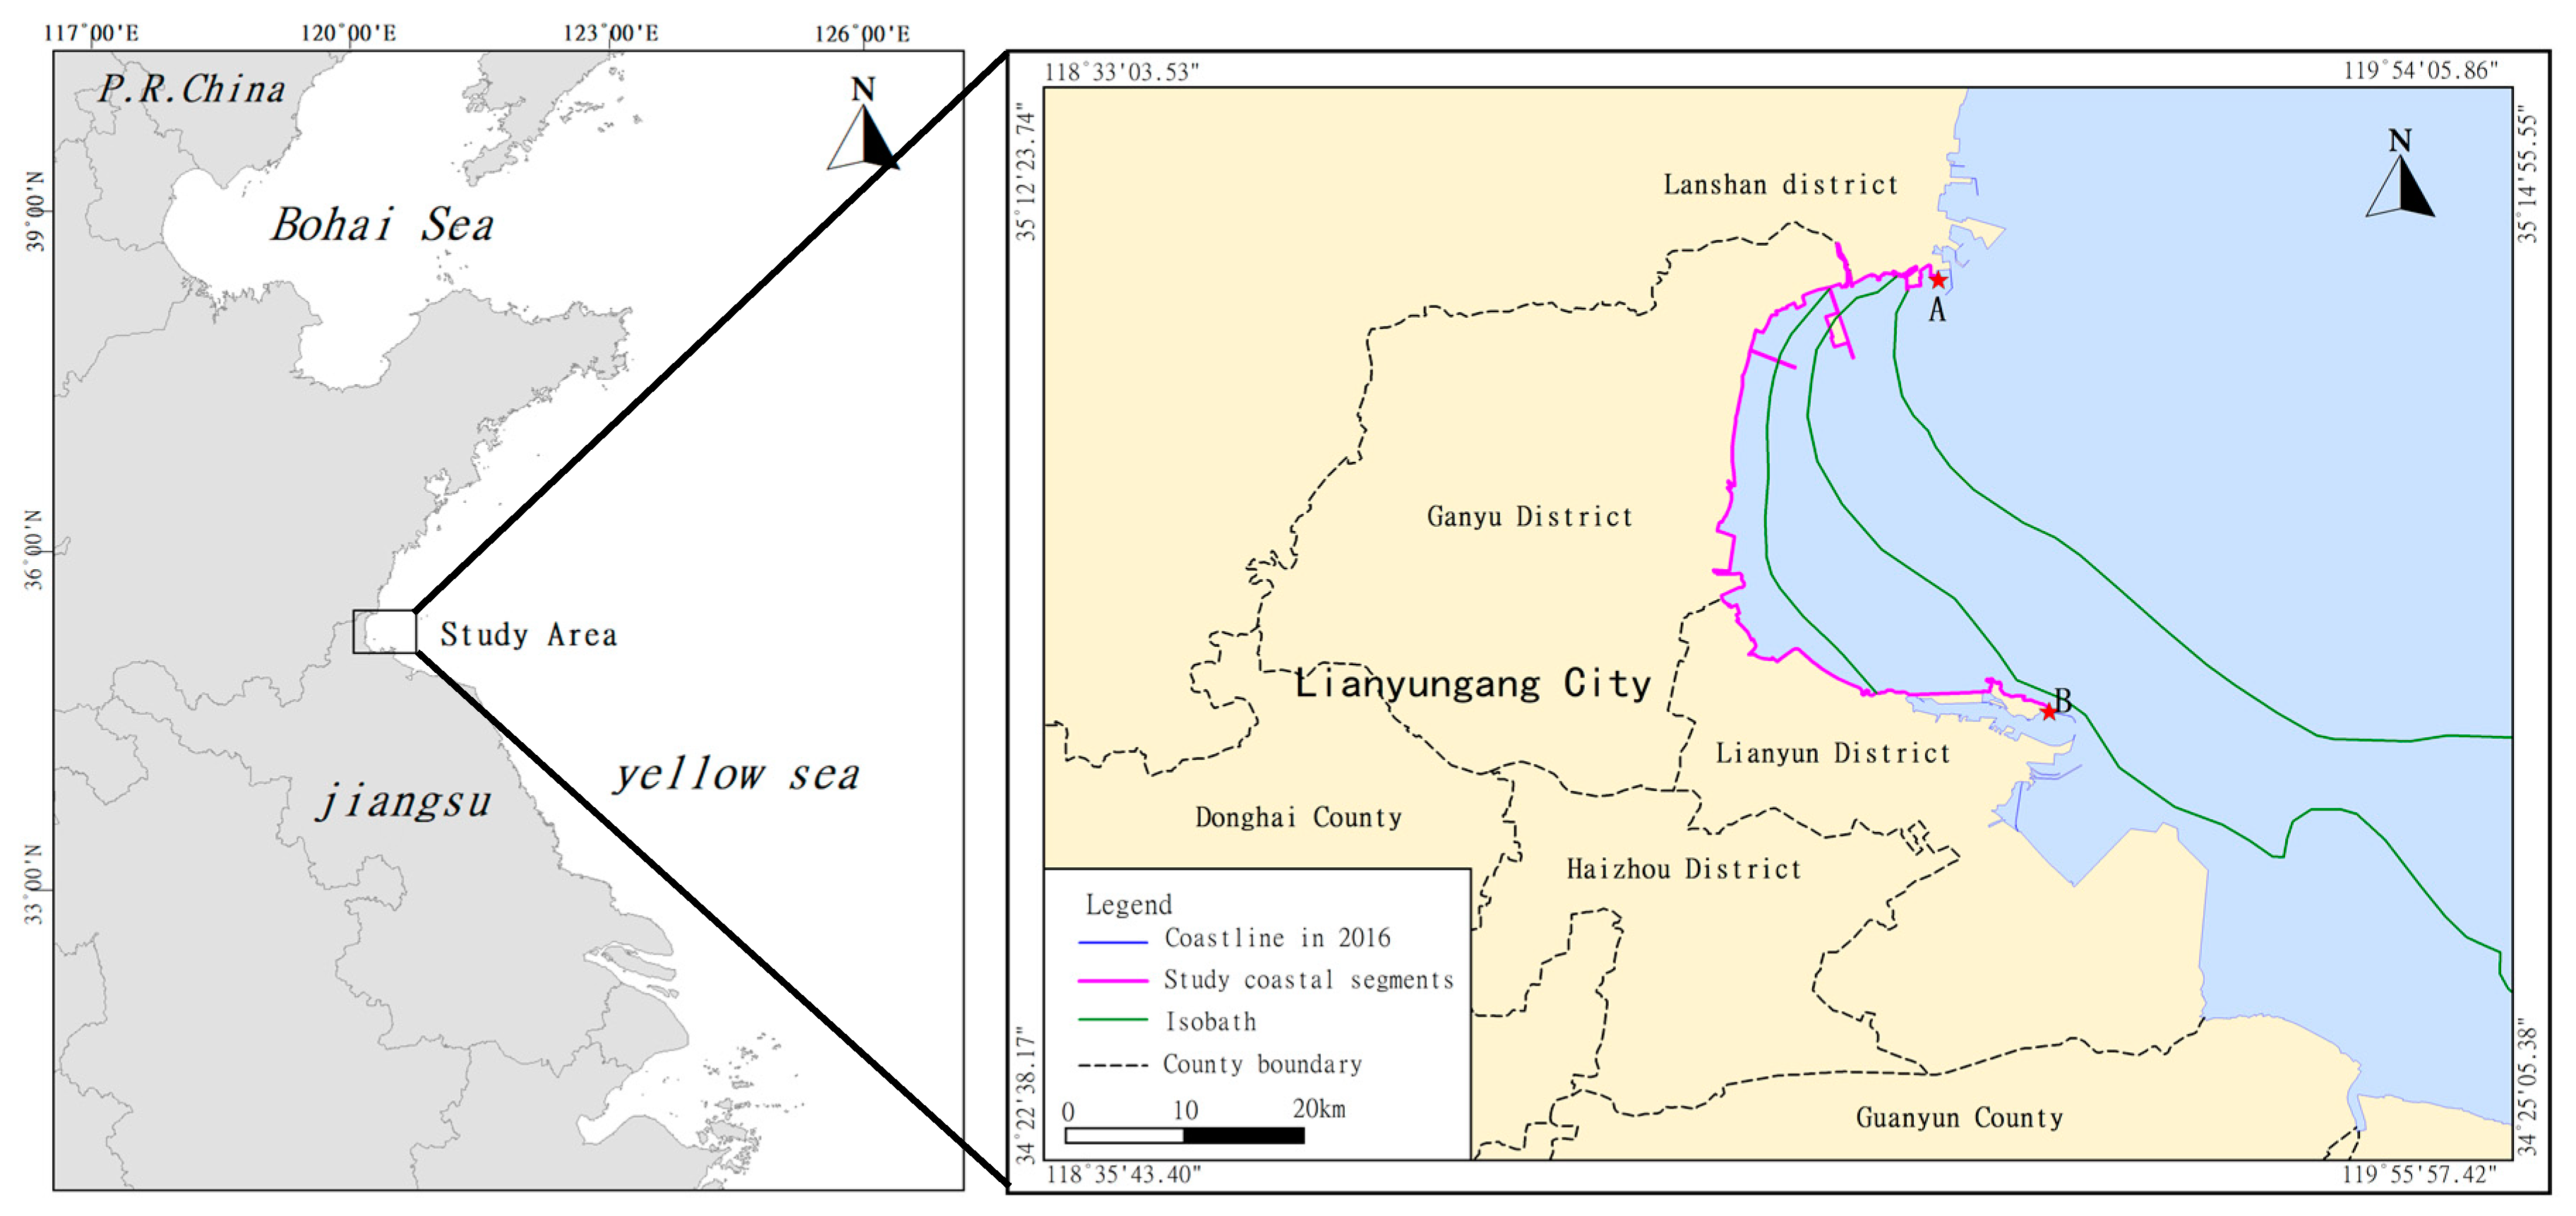
Figure 1. The location of the study area.
Water 12 02990 g001
Figure 2. Calculation range of marine environmental capacity in Haizhou Bay.
Water 12 02990 g002
Figure 3. Grids for numerical simulation calculation [40].
Water 12 02990 g003
Figure 4. Flow field diagram of Haizhou Bay in 2006 and 2016. (a) High tide flow field diagram of Haizhou Bay in 2006 (b) Low tide flow field diagram of Haizhou Bay in 2016. (c) High tide flow diagram of Haizhou Bay in 2016. (d) Low tide flow diagram of Haizhou Bay in 2016.
Water 12 02990 g004
Figure 5. Changes in coastline and isobath in Haizhou Bay from 2006 to 2016.
Water 12 02990 g005
Figure 6. Marine development and utilization of Haizhou Bay. (a) Marine development and utilization of Haizhou Bay in 2006; (b) marine development and utilization of Haizhou Bay in 2016.
Water 12 02990 g006
Figure 7. Comparison chart of comprehensive impact rate.
Water 12 02990 g007
Table 1. The mean concentrations of COD, labile phosphate, and inorganic nitrogen of Haizhou Bay in 2006 and 2016.
Chemical Oxygen Demand (mg/L)Labile Phosphate (mg/L)Inorganic Nitrogen (mg/L)
20061.390.00780.084
20161.620.020.31
second-class water quality standards30.030.3
Table 2. ECG parameters of 2006 and 2016.
ItemParameterDefinitionUnitSource or Equation200620162016–2006
ParameterCbThe standard water quality of marine functional zoningmg/LIt should meet the second-class standards stipulated in the Sea Water Quality Standard330
CxThe present pollutant concentration inside Haizhou Baymg/LCurrent Condition and Assessment of Trend of Water Quality in Offshore Water of the Haizhou Bay (2006); Report on offshore environmental quality of Lianyungang of Jiangsu Province, 20161.391.630.24
CwThe present pollutant concentration outside Haizhou Baymg/LCurrent Condition and Assessment of Trend of Water Quality in Offshore Water of the Haizhou Bay (2006); Report on offshore environmental quality of Lianyungang of Jiangsu Province, 20161.2051.400.195
SThe sea area enclosed by the box boundarymillion m3ArcGIS was used for calculation based on the coastline and boundary of 2006 and 2016101.03497.541−3.493
LThe mean depth of seawater in the boxmTopographic maps were used10.36710.4130.046
VxThe water body volume in the boxmillion m3Vx = S × L10.47410.157−0.317
VnThe mean exchanged water body volume of Haizhou Baybillion m3Delft 3D was used based on the boundary of 2006 and 2016 to calculate the daily mean exchanged water body volume of spring and neap tides5.918255.5575−0.36075
ECGECSbThe maximum ECG of Haizhou Bay in theory in the standard water qualitytonsECSb = Cb × Vx31,422.5830,470.83−951.75
ECSdThe used ECG in the background conditiontonsECSb = Cx × Vx14,559.1316,555.821996.69
ECDxTheoretical maximum dynamic environmental capacitytonsECDx = Cb × Vn17,754.7516,672.50−1082.25
ECSThe static environmental capacitytonsECS = ECSb − ECSd16,863.4513,915.0−2948.44
ECDThe dynamic environmental capacitytonsECD = (Cx − Cw) × Vn1094.881278.23183.35
ECGThe environmental capacity of the gulftonsECG = ECS + ECG17,958.3315,193.25−2765.08
Table 3. Chemical oxygen demand (COD) parameters in different scenarios.
ECSbECDxECSECDECG
Scenario A
(2006 terrain + 2016 water quality)
31,422.5817,754.7514,349.651361.2015,710.85
Scenario B
(2016 terrain + 2006 water quality):
30,470.8316,672.5016,352.681028.1417,380.82
Table 4. The influencing ratios of different combinations on static environmental capacity (ECS), dynamic environmental capacity (ECD), and environmental capacity of the gulf (ECG).
ECSECDECG
2016–2006−2948.44183.35−2765.08
1#-1 Scenario B—2006 (terrain)−510.77−66.74−577.51
1#-2 2016—Scenario B (water quality)−2437.67250.09−2187.57
(1#-1) + (1#-2)−2948.44183.35−2765.08
Influencing ratio (terrain/water quality)0.173:0.827−0.364:1.3640.209:0.791
2#-1 Scenario A—2006 (water quality)−2513.8266.32−2247.48
2#-2 2016—Scenario A (terrain)−434.64−82.97−517.6
(2#-1) + (2#-2)−2948.44183.35−2765.08
Influencing ratio (terrain/water quality)0.147:0.853−0.453:1.4530.187:0.813
Overall influencing ratio (terrain/water quality)0.16:0.84−0.408:1.4080.198:0.802
Publisher’s Note: MDPI stays neutral with regard to jurisdictional claims in published maps and institutional affiliations.