Article

In Situ Rates of Carbon and Nitrogen Uptake by Phytoplankton and the Contribution of Picophytoplankton in Kongsfjorden, Svalbard

Division of Polar Ocean Sciences, Korea Polar Research Institute, 26 Songdomirae-ro, Yeonsu-gu, Incheon 21990, Korea
*
Author to whom correspondence should be addressed.
Water 2020, 12(10), 2903; https://doi.org/10.3390/w12102903
Submission received: 20 August 2020 / Revised: 10 October 2020 / Accepted: 15 October 2020 / Published: 17 October 2020
(This article belongs to the Special Issue Marine Nitrogen Fixation and Phytoplankton Ecology)

Abstract

:
Rapid climate warming and the associated melting of glaciers in high-latitude open fjord systems can have a significant impact on biogeochemical cycles. In this study, the uptake rates of carbon and nitrogen (nitrate and ammonium) of total phytoplankton and picophytoplankton (<2 μm) were measured in Kongsfjorden in early May 2017 using the dual stable isotope technique. The daily uptake rates of total carbon and nitrogen ranged from 0.3 to 1.1 g C m−2 day−1, with a mean of 0.7 ± 0.3 g C m−2 day−1, and 0.13 to 0.17 g N m−2 day−1, with a mean of 0.16 ± 0.02 g N m−2 day−1. Microphytoplankton (20–200 μm) accounted for 68.1% of the total chlorophyll a (chl-a) concentration, while picophytoplankton (<2 μm) accounted for 19.6% of the total chl-a, with a high contribution to the carbon uptake rate (42.9%) due to its higher particulate organic carbon-to-chl-a ratio. The contributions of picophytoplankton to the total nitrogen uptake rates were 47.1 ± 10.6% for nitrate and 74.0 ± 16.7% for ammonium. Our results indicated that picophytoplankton preferred regenerated nitrogen, such as ammonium, for growth and pointed to the importance of the role played by picophytoplankton in the local carbon uptake rate during the early springtime in 2017. Although the phytoplankton community, in terms of biovolume, in all samples was dominated by diatoms and Phaeocystis sp., a higher proportion of nano- and picophytoplankton chl-a (mean ± SD = 71.3 ± 16.4%) was observed in the relatively cold and turbid surface water in the inner fjord. Phytoplankton production (carbon uptake) decreased towards the inner fjord, while nitrogen uptake increased. The contrast in carbon and nitrogen uptake is likely caused by the gradient in glacial meltwater which affects both the light regime and nutrient availability. Therefore, global warming-enhanced glacier melting might support lower primary production (carbon fixation) with higher degrees of regeneration processes in fjord systems.

1. Introduction

Marine phytoplankton play a critical role in global carbon and nitrogen cycling [1,2]. They uptake carbon dioxide from the atmosphere through photosynthesis and transform it into organic matter as well as uptaking nitrogen and other nutrients (e.g., phosphorous, silicate, trace metals), and they contribute approximately 50% of global primary production (carbon fixation) [3]. In marine systems, production depends on allochthonous inputs of nutrients (new production based on nitrate), while the remainder is mainly driven by the remineralization of nutrients (regenerated production; based on ammonium and urea) [4]. This distinction provides useful information for the proportion of the organic carbon exported out of the euphotic zone or into higher trophic levels because new production is assumed to be equivalent to the fraction of total production under steady-state conditions [5].
Climate change is expected to considerably influence the upper ocean in marine ecosystems, such as through rising temperatures and declining ice cover, altering the structure of phytoplankton communities, magnitudes of carbon, nitrogen, and export production, and the efficiency of the biological carbon pump [6,7,8,9,10]. Particularly, changes are more pronounced in the Arctic [11,12]. For example, patterns of increasing picophytoplankton (<2 μm) biomass and a decline in larger cells (2–20 μm) were found in the Canada Basin due to strong vertical stratification with a lower nitrate supply [11]. Although smaller phytoplankton is more competitive under low nutrient concentrations, picophytoplankton-dominated systems do not provide large carbon exports to the deep sea (carbon sequestration). Because picophytoplankton have a high surface-area-to-volume ratio and are more resistant (they do sink, form aggregates and such). As a result, picophytoplankton is considered a critical component of carbon and nitrogen cycling in high-latitude marine ecosystems and likely more important in warmer freshened ocean [11,13,14].
Our study area, Kongsfjorden, is located in the open fjords in western Spitsbergen and geographically belongs to the Arctic. The hydrological condition of this area is characterized by Atlantic water (T > 3 °C, S > 34.9), glacial meltwater, and Arctic water (T = 0.5–2 °C, S = 34.7–34.9) ([15,16,17] and references therein). The mixing process of these water masses influences the spatial and temporal variation in the food web [18,19]. Generally, phytoplankton biomass in Kongsfjorden begins to increase in early spring (March) and then decreases dramatically in late summer and early autumn [16,20]. The progress of the spring bloom is controlled by light and grazing pressure [21], and the primary production of phytoplankton can influence zooplankton production [22,23]. Therefore, knowing the local primary production and the contribution of the picophytoplankton fraction to the total primary production in the Arctic Ocean is useful for assessing the potential impacts caused by environmental changes, such as an intense ice melt season [12,24,25]. A number of studies have reported the composition of coupled pico- and nanoplankton communities (including heterotrophic bacteria) in water masses and/or phytoplankton bloom dynamics in Kongsfjorden [20,26,27]. Unfortunately, only a few in situ measurements of primary production have been conducted in Kongsfjorden [16,20,21,28]. Hence, the purposes of this study were (i) to investigate spatial variation in the phytoplankton community structure and the rates of carbon and nitrogen uptake and (ii) to estimate the contribution of picophytoplankton to the total biomass and carbon and nitrogen uptake rates during the spring period in Kongsfjorden, Svalbard.

2. Materials and Methods

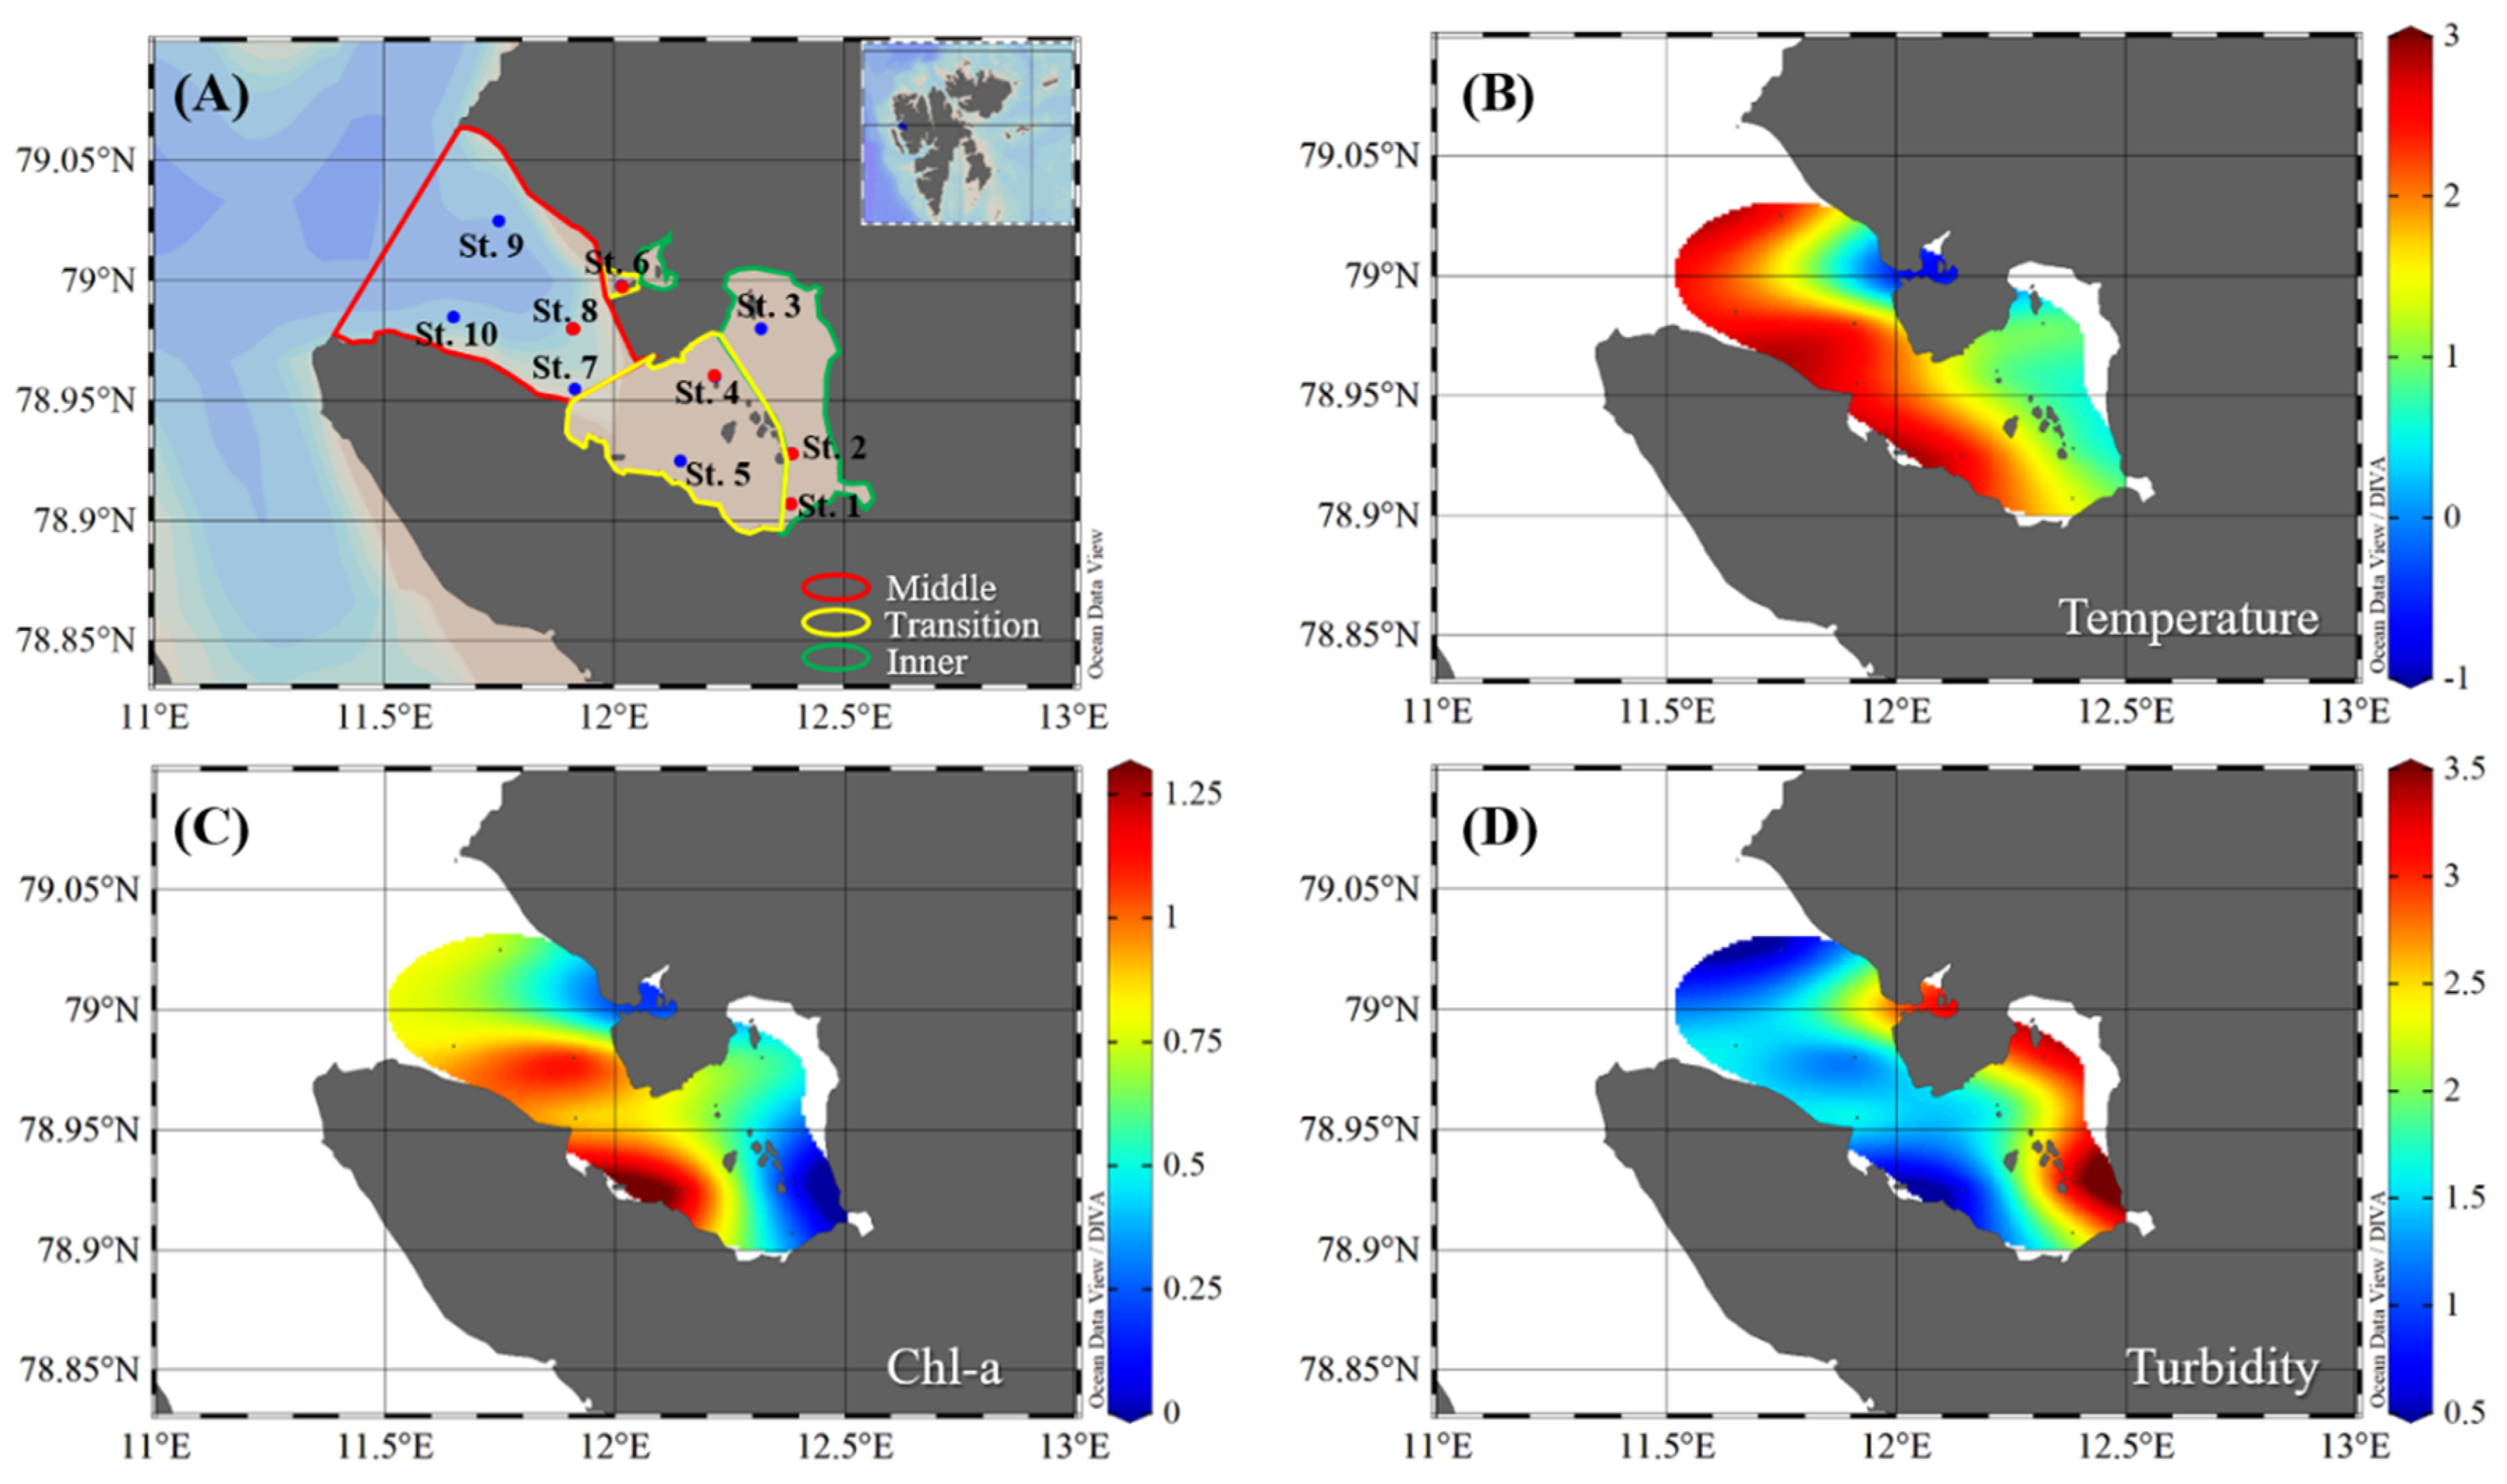
2.1. Study Area and Sampling

Kongsfjorden is a fjord in western Spitsbergen and is located on the Svalbard archipelago. All of the samples except for the carbon and nitrogen uptake rates were collected at a total of ten stations in Kongsfjorden from 4–8 May 2017 onboard the Teisten (Figure 1 and Table 1). Our sampling stations were divided into three zones based on species distribution, substrate and the overriding environmental gradient described by Hop et al. [16]: the inner zone (St. 1, St. 2, and St. 3), the transition zone (St. 4, St. 5, and St. 6), and the middle zone (St. 7, St. 8, St. 9, and St. 10) (Table 1). At each station, we used a conductivity-temperature-depth (CTD) system with a turbidity sensor and Niskin bottles to obtain the water temperature, turbidity, and water samples, respectively. The water samples for the nutrients, chl-a concentrations, and taxonomy were obtained using a Niskin sampler from the surface to a depth of up to 100 m (Table 1). The characteristics of each station are summarized in Table 1. To estimate the daytime uptake rate, daily solar irradiance (W m−2) data were obtained from the Baseline Surface Radiation Network (BSRN) for the sampling period. The daily solar irradiance was calculated using a 1 h resolution. One percent of the surface irradiance was defined as the euphotic zone, and different light levels were determined (100, 50, 30, 12, 5, and 1%) by a Secchi disc using the vertical attenuation coefficient (Kd = 1.7/Secchi depth) from Poole and Atkins [29]. The euphotic depth was measured only at experiment stations (St. 3, St. 5, St. 7, St. 9, and St. 10).

2.2. Major Inorganic Nutrient Analysis

The seawater samples for nutrients were collected in 250 mL acid-cleaned polythene bottles directly from CTD spigots without the use of a tube and filtered through a precombusted (450 °C, 4 h) glass fiber filter (GF/F, 47 mm in diameter, Whatman, Marlborough, MA, USA). The filtered seawater samples were preserved at approximately −20 °C until analysis in our laboratory. The major inorganic nutrients (nitrite and nitrate, ammonium, phosphate, and silicate) were measured using a 4-channel continuous AutoAnalyzer (QuAAtro, SEAL Analytical, Southampton, UK) with the settings recommended by the manufacturer’s manual. Standard curves were run with each batch of samples using freshly prepared standards that spanned the range of concentrations in the samples.

2.3. Chlorophyll a, Identification and Counts of Phytoplankton

Water samples (1 L) for measuring the total chl-a concentrations of phytoplankton were filtered using a 0.7 µm pore-size Whatman GF/F (47 mm) at all stations during the cruise. The phytoplankton in this study were divided into 3 categories: micro- (>20 µm), nano- (2.0–20 µm), and picophytoplankton (0.7–2.0 µm). For the size-fractionated chl-a concentrations, samples (1 L) were passed sequentially through 20 and 2 µm Nucleopore filters (47 mm, Whatman, UK) and 0.7 µm GF/F filters (47 mm). The chl-a concentrations were determined using a Trilogy fluorometer (Turner Designs, USA) after a 24 h extraction in 90% acetone at 4 °C [30].
To identify and count phytoplankton, aliquots of 125 mL were preserved with glutaraldehyde (final concentration: 1%). Phytoplankton net tows (20 µm mesh) were used to gather additional samples, which were preserved with glutaraldehyde (final concentration: 2%). Sample volumes of 50 to 100 mL were filtered through Gelman GN-6 Metricel filters (0.45 µm pore size, 25 mm diameter; Gelman Sciences, Inc., Port Washington, NY, USA). The filters were mounted on microscopic slides in a water-soluble embedding medium (HPMA, 2-hydroxypropyl methacrylate) in our laboratory. The HPMA slides were used for identification and estimation of the cell concentrations. Identification by light microscopy is time consuming and requires a high level of taxonomic skill but is still the most reliable method of microalgal identification [31]. Therefore, at least 300 cells were identified from each sample with an optical microscope (BX53TR-32FB3F0 microscope, Olympus, Inc., Tokyo, Japan) using a combination of light and epifluorescence microscopy at 400× magnification for microphytoplankton and at 1000× magnification for pico- and nanophytoplankton [32]. The genera were identified using the keys provided by Tomas [33]. The cell counts were converted into cell concentrations according to the method of Kang et al. [34].

2.4. Carbon and Nitrogen Uptake Experiments

The carbon and nitrogen uptake rates of phytoplankton were measured using 13C-15N dual isotope tracer techniques [14] at five in situ carbon and nitrogen uptake experiment stations (St. 3, St. 5, St. 7, St. 9, and St. 10; hereafter productivity stations). The samples were transferred into 1 L polycarbonate bottles wrapped with different neutral density screen films (LEE Filters, UK; Garneau et al. [35]) to simulate different light levels (100, 50, 30, 12, 5 and 1%) and then were enriched with 13C (H13CO3) and 15N (K15NO3 or 15NH4Cl) isotopes. The 13C and 15N enrichments made up approximately 5–10% of the total inorganic carbon and nitrogenous nutrients in the ambient water [4,36]. For phytoplankton incubation, the bottles containing isotopes were placed in incubators, surrounded by ambient seawater. After incubation (4–5 h), the samples were transferred into the laboratory and filtered onto precombusted (450 °C, 4 h) 25-mm GF/F (Whatman, 0.7 µm pore) filters to assess the carbon and nitrogen uptake rates of total phytoplankton. For the carbon and nitrogen uptake rates of small-sized cell (picophytoplankton) separations, the incubated samples were first filtered through 2-μm Nucleopore filters (47 mm) and then onto the GF/F filters (25 mm). The particulate organic carbon (POC) and nitrogen (PON) samples for the total phytoplankton and picophytoplankton were also obtained through the abovementioned filtration process. The filters were immediately stored at −80 °C until further analysis. The POC and PON concentrations and carbon and nitrogen isotope concentration were determined using a Finnigan Delta + XL mass spectrometer in the stable isotope laboratory at the University of Alaska Fairbanks, USA, after HCl fuming overnight to remove the carbonate. The carbon and nitrogen uptake rates were calculated according to Hama et al. [37] and Dugdale and Goering [4], respectively (Equation (1)).
Carbon   ( or   nitrogen )   uptake   rate = ( a i s a n s ) ( a i c a n s ) × P ( t ) t
where a i s is the 13C atom% of the POC in the incubated sample, a n s is the 13C atom% of the POC in the natural sample, P is the POC, a i c is the total dissolved inorganic carbon, and t is the incubation time period. Similarly, the nitrogen (nitrate or ammonium) uptake rates were calculated using the same equation, where P denotes the particulate organic nitrogen, and a i s and a n s are the 15N atom% of PON in the incubated and natural samples, respectively. a i c is the ambient dissolved inorganic nitrogen (nitrate or ammonium). The specific carbon (or nitrogen) uptake rates (photosynthetic rate; h−1) are defined as the nutrients taken up per unit of POC (PON) and per unit of time, and the absolute carbon (nitrogen) uptake rates (expressed in mg C (or N)·m−3·h−1) are the product of the specific carbon (nitrogen) uptake rate and the POC (or PON). The uptake rate of the large-size fraction (>2 µm; micro- and nanophytoplankton) was calculated by subtracting the picophytoplankton value from the total phytoplankton uptake rate. The water column-integral chl-a concentrations and hourly carbon and nitrogen uptake rates at each station were estimated using trapezoidal integrations of volumetric values from 100 to 1% light levels [38].

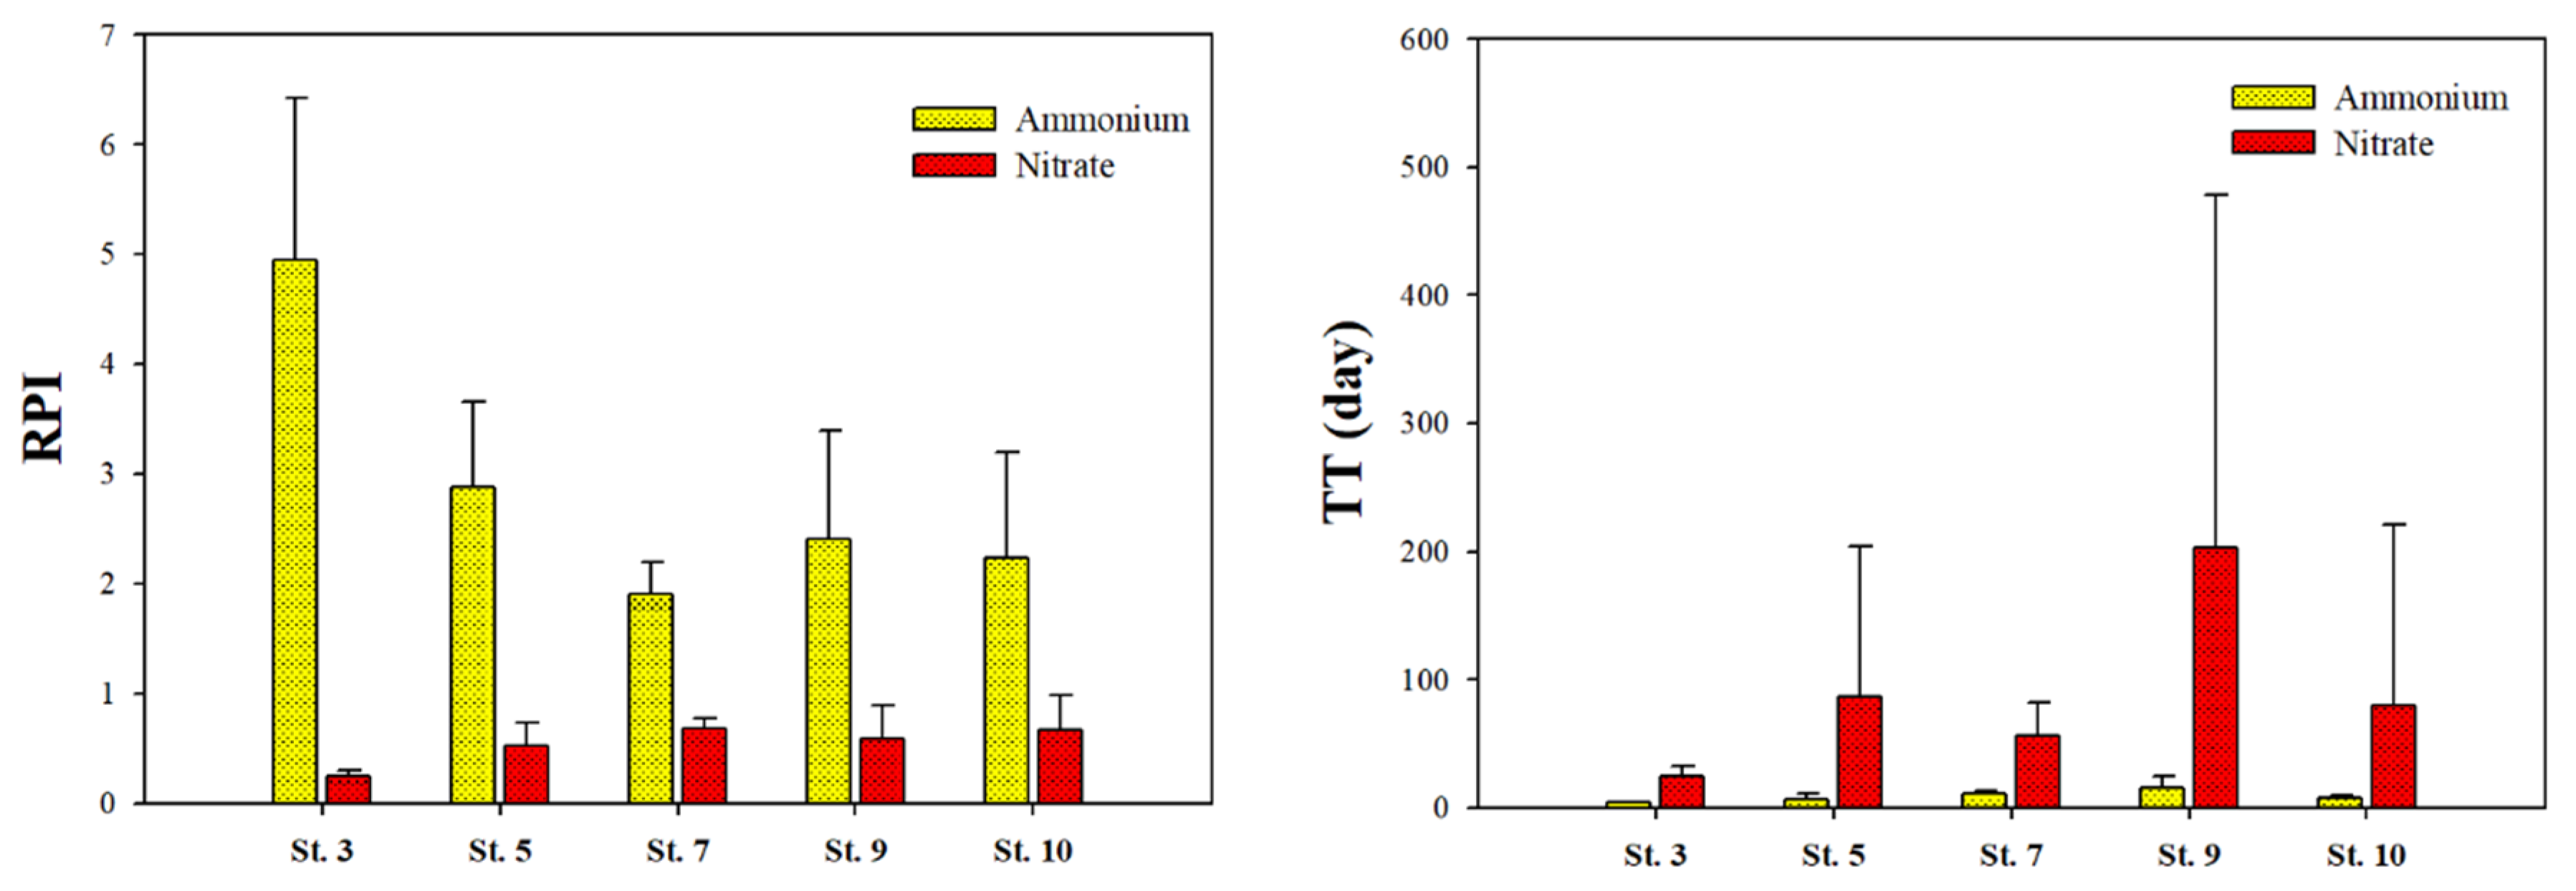
2.5. Relative Preference Index and Turnover Time of Picophytoplankton

To estimate the utilization of a nitrogen compound, the relative preference index (RPI) value and turnover times were calculated using the equations of McCarthy et al. [39] (Equation (2)) and Gu and Alexander [40] (Equation (3)), respectively. For example, the RPI and turnover time for nitrate were calculated as follows:
RPI nitrate = [ nitrate   uptake   rate ] / [ nitrogen   uptake   rate ] [ NO 3 ] / [ DIN ]
Turnover   time nitrate = [ NO 3 ] [ nitrate   uptake   rate ]
where the RPI nitrate of picophytoplankton is the nitrogen uptake rate in the combined nitrate and ammonium uptake rates for picophytoplankton. NO 3 and DIN are the ambient nitrate concentration and dissolved inorganic nitrogen concentration (nitrate + nitrite + ammonium), respectively. The turnover time for the nitrogen substrate in picophytoplankton was calculated by assuming the consumption of the substrate.

2.6. Statistical Analysis

A t test was used to determine whether there was a significant difference between the two independent groups. Correlations between the investigated variables were examined parametrically using Pearson’s correlation. Statistical analysis was performed with a significance threshold of p < 0.05.

3. Results

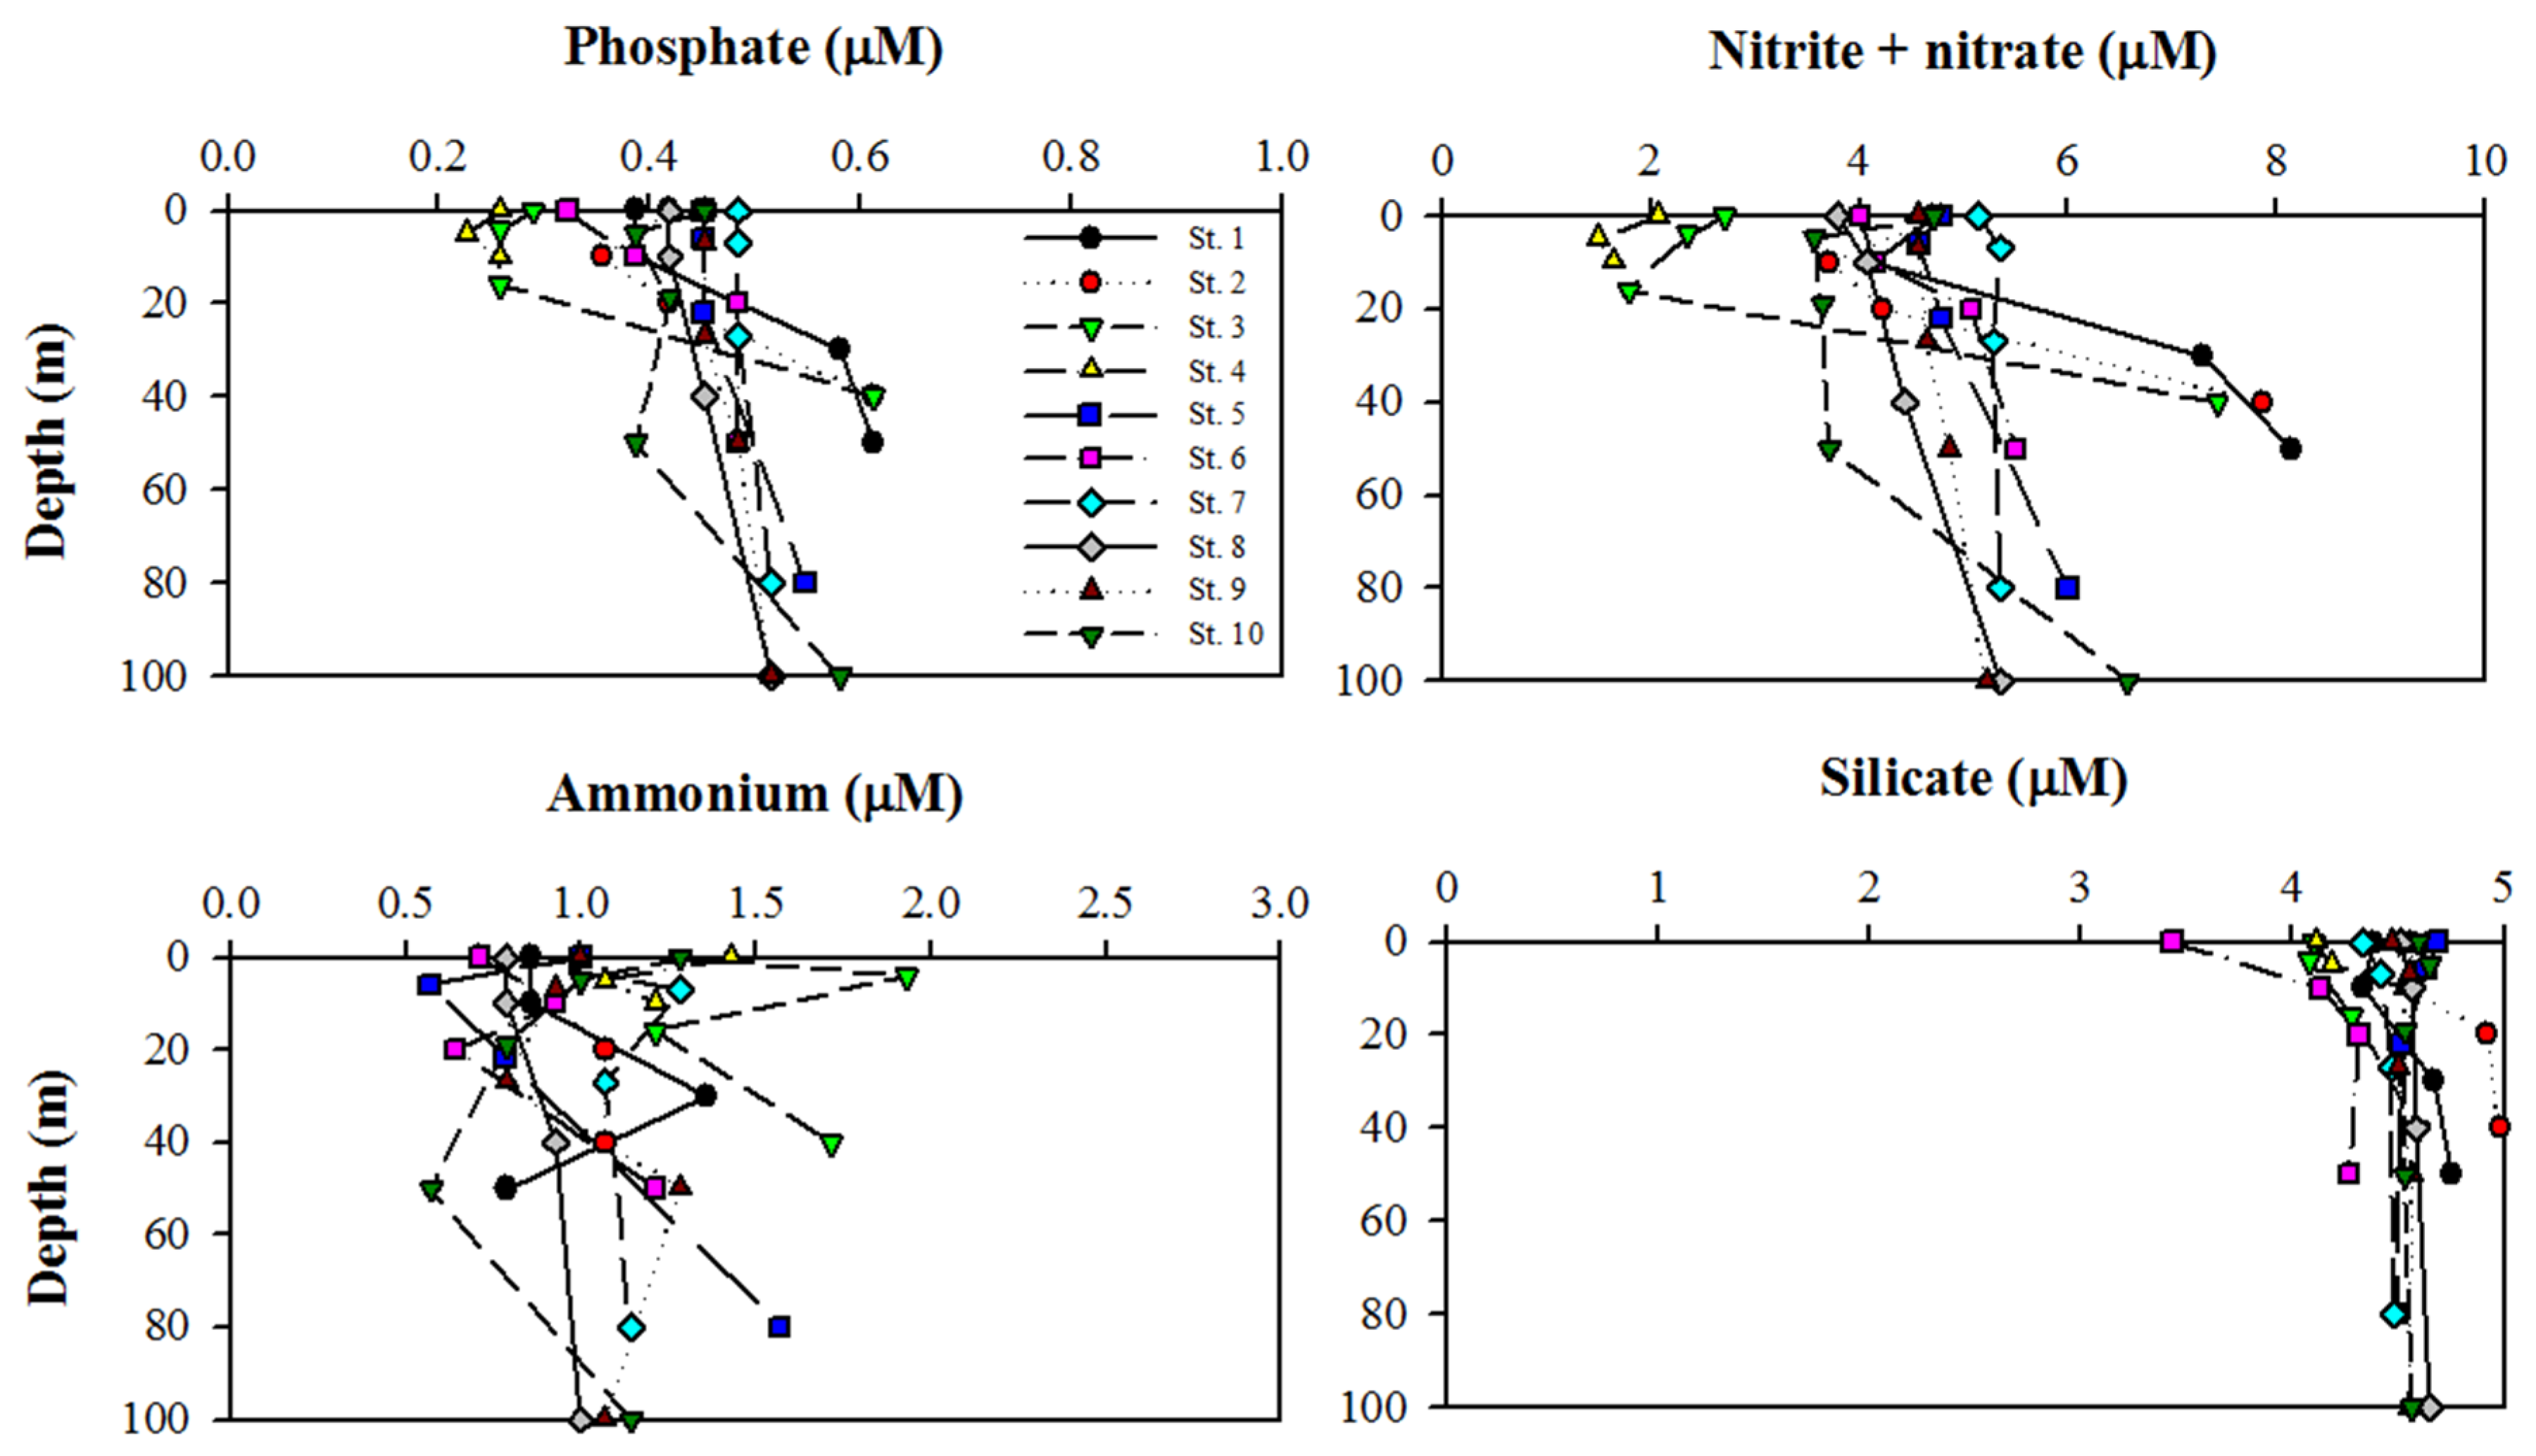
3.1. Physical and Nutrient Properties in Kongsfjorden

The stations experienced a gradient of influence from a primarily oceanographic influence to a primarily glacier influence towards the inner zone of the fjord. Water temperature ranged from −0.7 to 2.6 °C with an average of 2.0 °C (standard deviation (SD) = ± 0.8 °C) from the surface to depth of 100-m deep. The middle zone (mean ± SD = 2.4 ± 0.1 °C) of the fjord was composed of relatively warmer water than the inner zone (mean ± SD = 0.8 ± 0.7 °C). In particular, the cold water temperatures (<0 °C) observed in the surface water at St. 6 and in 30–50 m of St. 1, respectively, were related to the extent of input from the melting of land-based ice during the sampling period because sea ice was rare in the fjord (Figure 1B). Overall, warm water has been intruding into the fjord, and meltwater flows out the fjord in Kongsfjorden.
As observed for water temperature, there was a clear difference in nutrient concentration between the inner and remaining parts of the fjord. The phosphate and nitrite + nitrate concentrations were 0.2–0.6 µM and 1.5–8.1 µM from the surface to 100-m water depth, respectively (Figure 2). The silicate concentration ranged from 3.4 to 5.0 µM with a mean of 4.5 µM (SD = ± 0.3 µM) (Figure 2). Most of the concentrations of nitrite and nitrate, phosphate, and silicate gradually increased with depth in the inner zone and were nearly constant throughout the water in the transition and middle zones. However, ammonium did not show a specific trend and ranged from 0.6 to 1.9 µM with a mean of 1.0 µM (SD = ± 0.3 µM) (Figure 2).
During the survey period, the measured daily solar irradiance ranged from 24 to 543 W m−2, with a mean of 247.8 ± 146.4 W m−2; the variability and trend of the daily solar irradiance remained consistent except for on 4 May. At the productivity stations, the vertical light attenuation coefficient (Kd) ranged from 0.17 to 0.28 m−1 (mean ± SD = 0.22 ± 0.05 m−1), leading to a shift in depth from 16 m at St. 3 to 27 m at St. 7 and St. 9, with an average depth of approximately 22.2 m (SD = ± 4.9 m) (Table 1). The spatial distribution of turbidity (FTU) at the sampling stations is shown in Figure 1D. The turbidity ranged from 0.3 to 6.1 FTU, with an average of 1.1 ± 1.0 FTU at a 100-m depth. In near-glacier stations (St. 1, St. 2, St. 3, St. 4, and St. 6), turbidity exceeds 1.7 FTU at the surface and then decreases with a depth of ~20 m, whereas in the rest of stations (except St. 7; no vertical data) is low (mean of 0.5 FTU) throughout the water column (within 100-m depth) (data not shown). Therefore, the turbidity of the surface water was used to analyze the amount of inorganic particles from glacial runoff in this study.

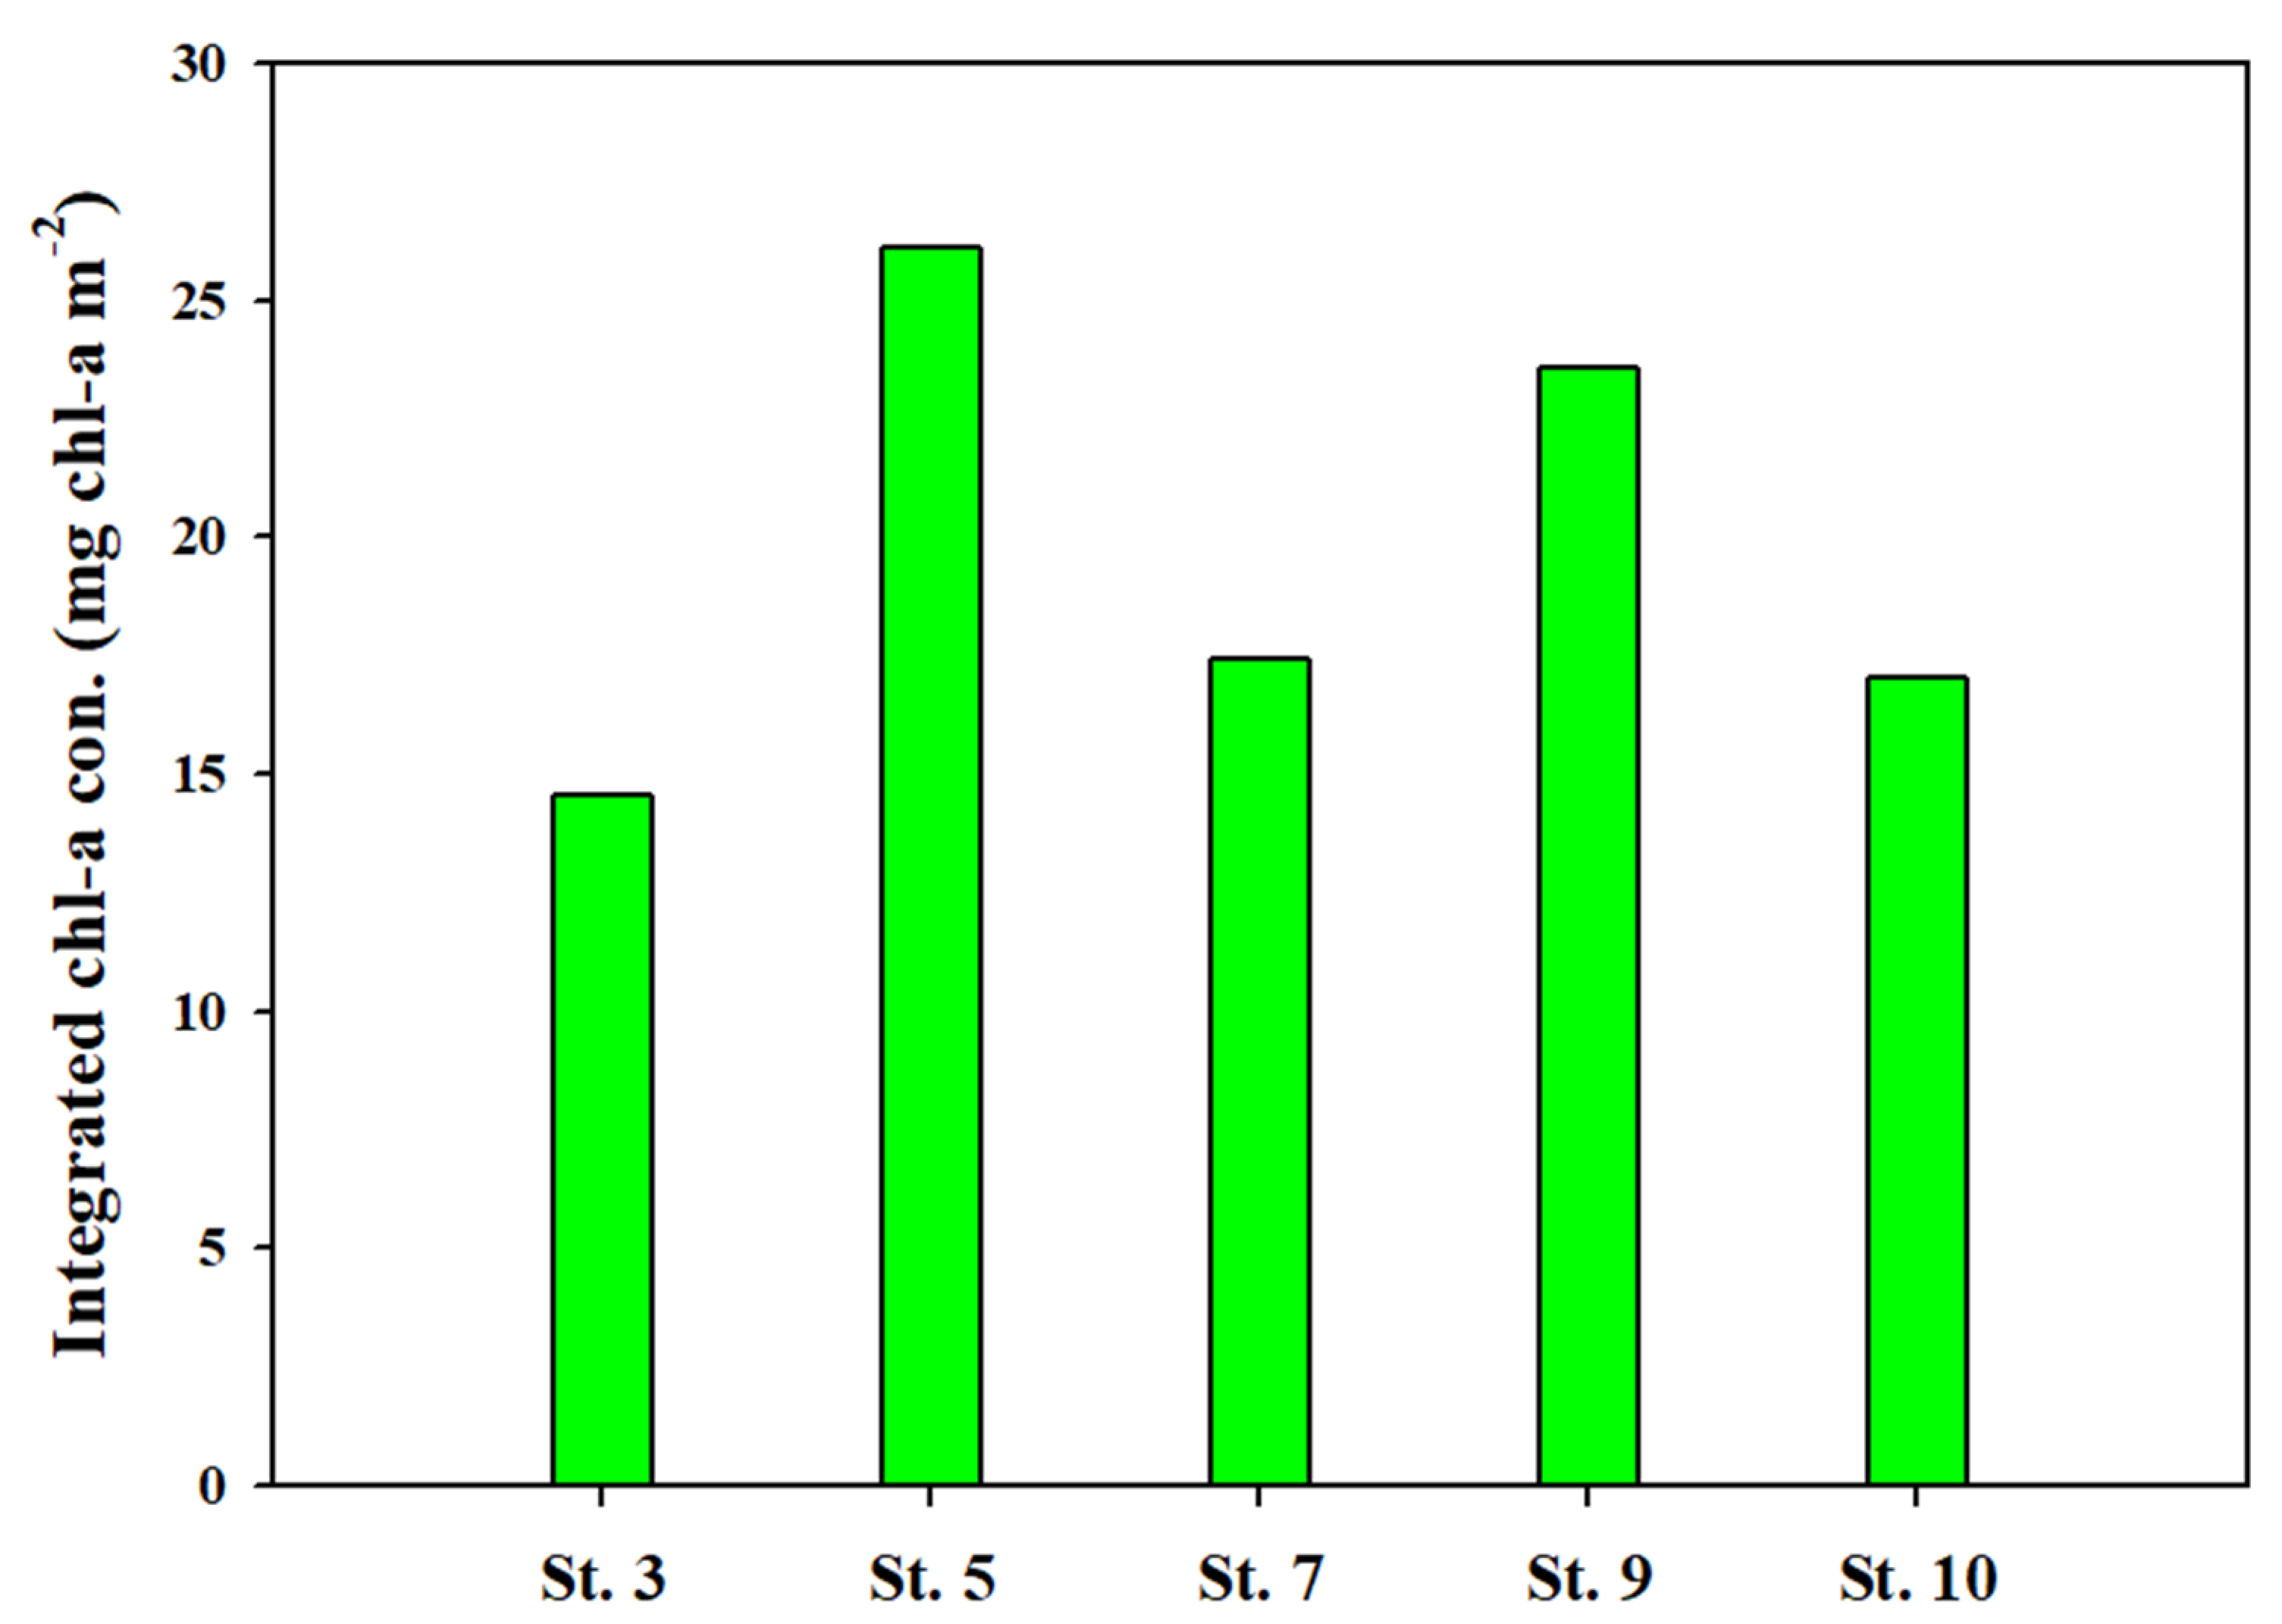
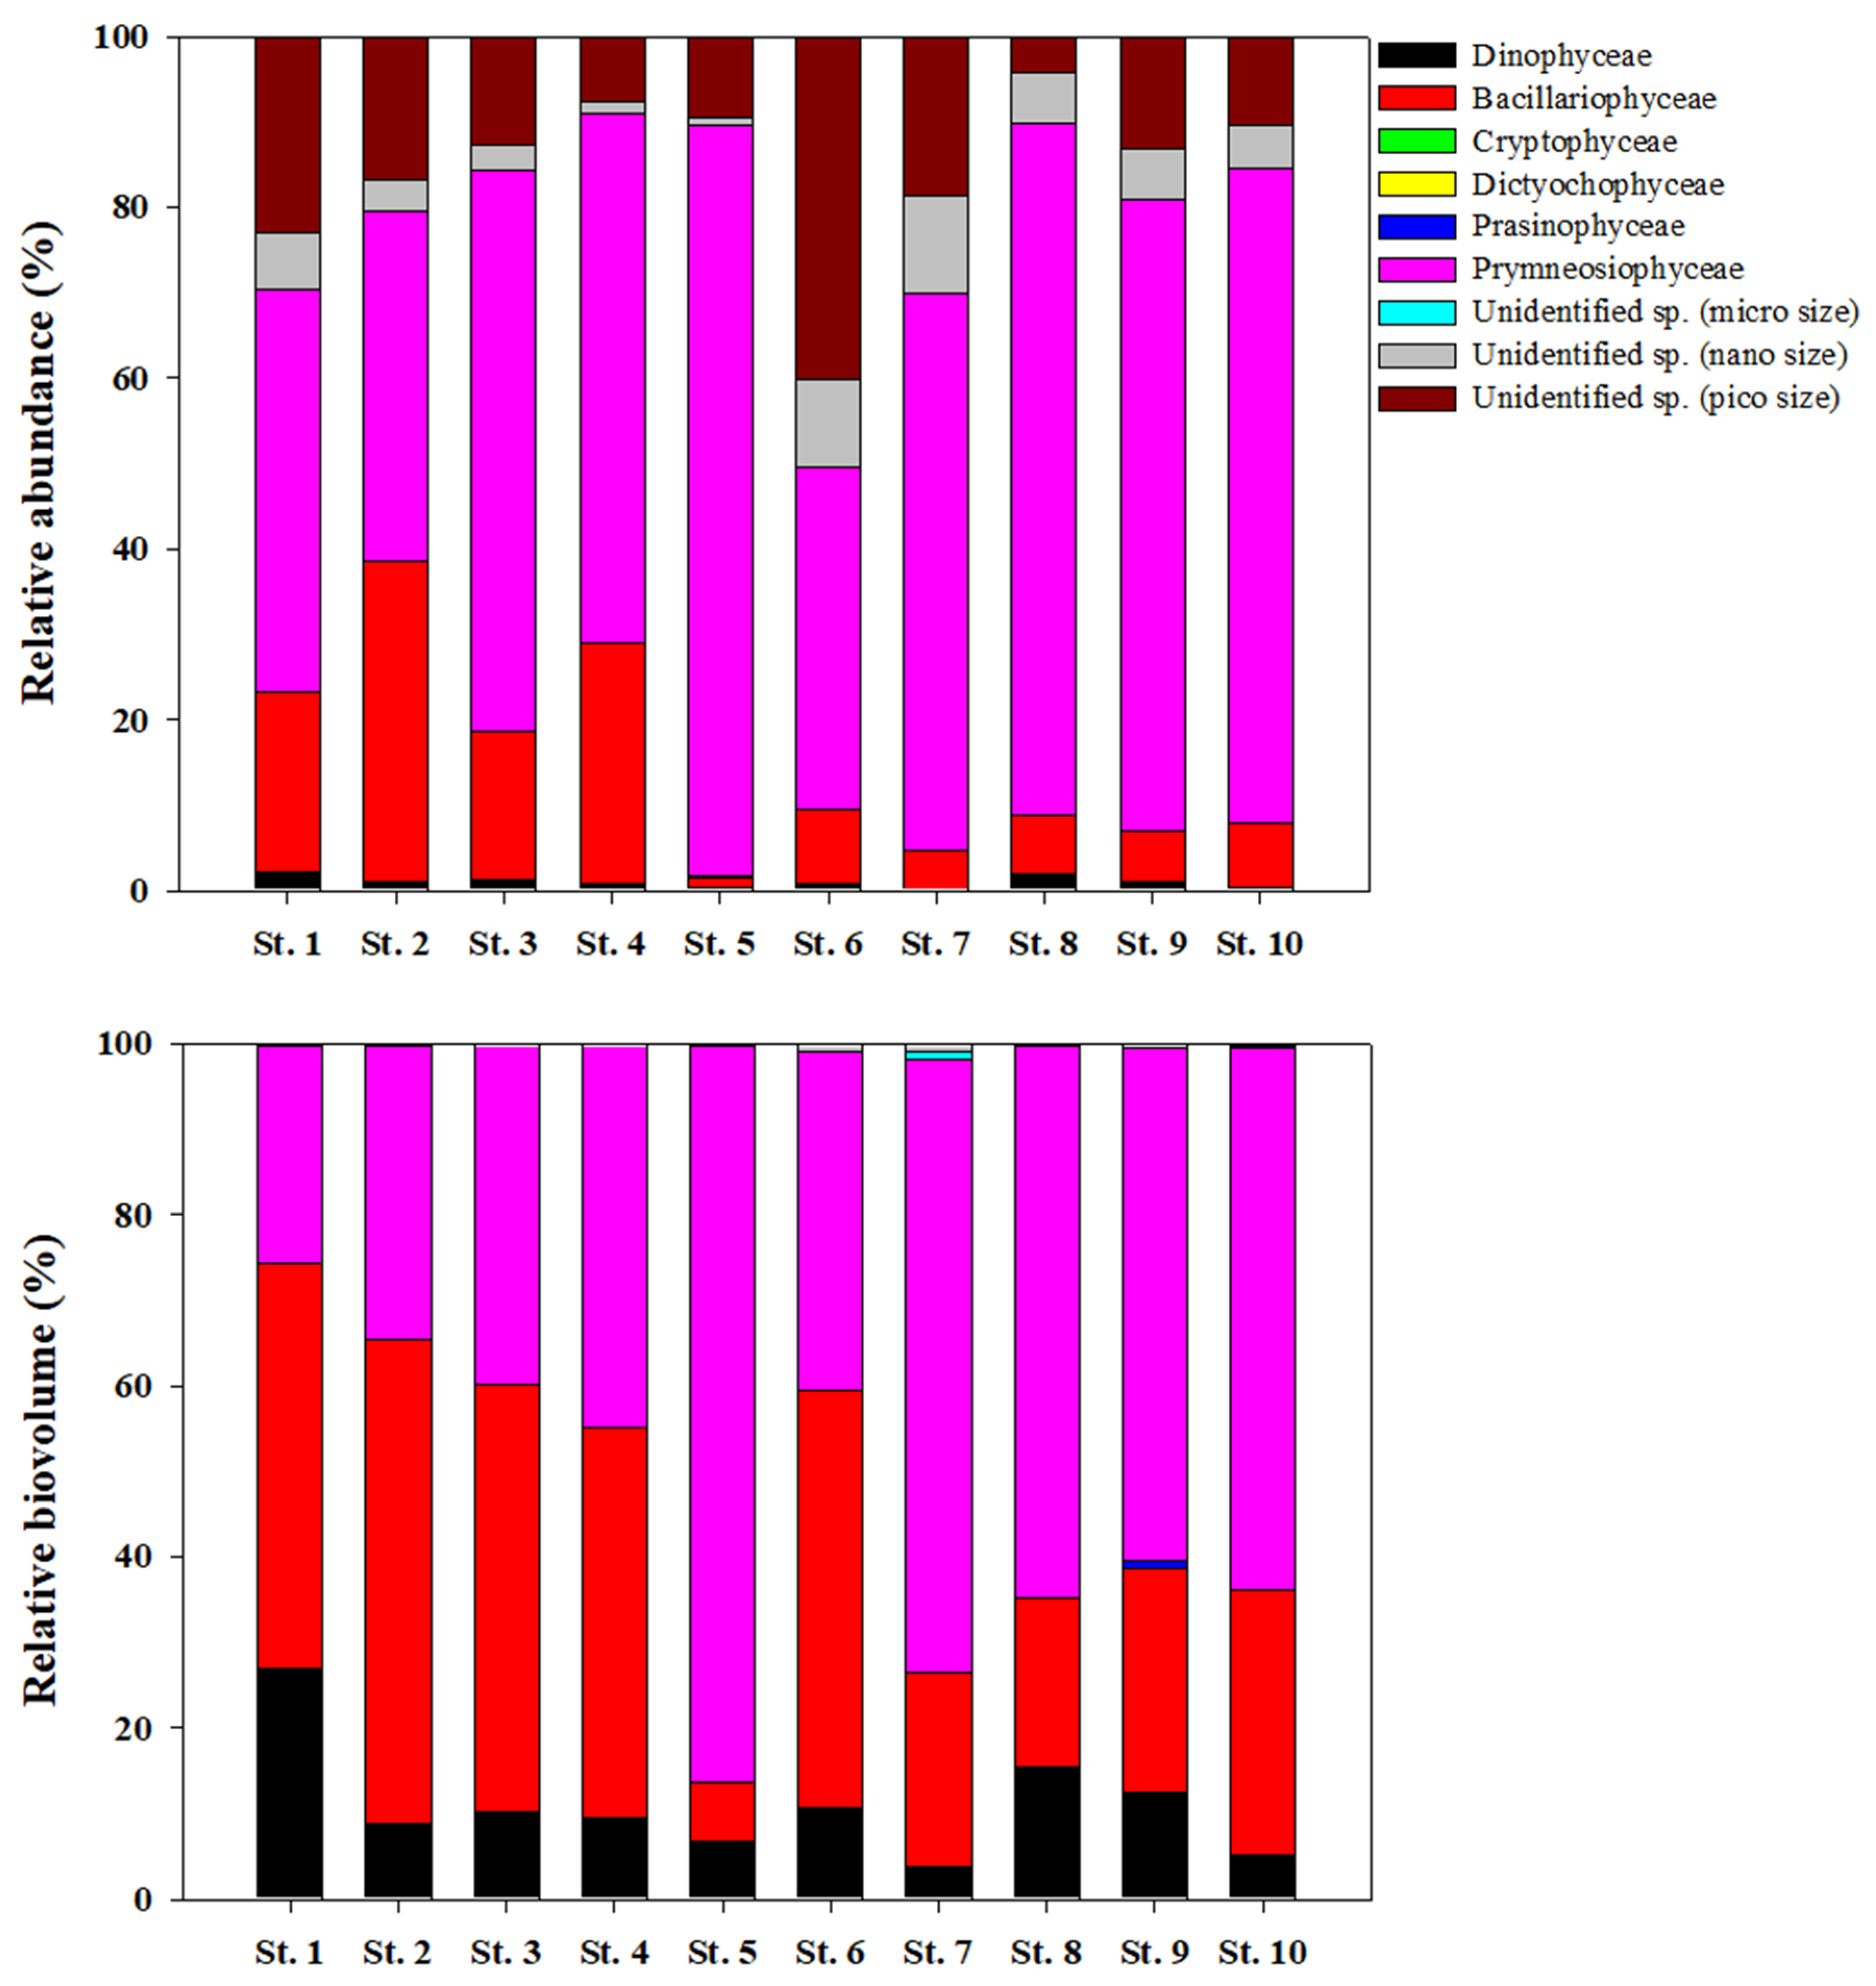
3.2. Chlorophyll a, Size Distribution, and Community of Phytoplankton

At a surface to depth of 100 m, the concentration of chl-a varied by an order of magnitude from high chl-a (0.09 to 1.52 mg m−3, with a mean of 0.80 ± 0.33 mg m−3). The phytoplankton community was dominated by microphytoplankton (20–200 µm), which accounted for 63.3% (SD = ± 16.0%) of the total chl-a concentration, followed by pico- (0.7–2.0 µm; mean ± SD = 20.5 ± 8.8%) and nanophytoplankton (2.0–20 µm; mean ± SD = 16.2 ± 8.8%) in Kongsfjorden (Table 2). The surface chl-a increased from 0.3 mg m−3 in the inner part to 0.9 mg m−3 in the middle part, which was accompanied by a relative increase in the micro- and decrease in nano- and picophytoplankton fractions (28.7 to 78.6%, 42.2 to 6.9%, and 29.1 to 14.5% from the inner to middle, respectively). In contrast, the other depths in Kongsfjorden showed that microphytoplankton were dominant, with a mean value of 65.3 ± 10.8%. The total chl-a concentration was integrated from the surface to a 1% light level and ranged from 14.6 to 26.1 mg chl-a m−2, with a mean of 19.7 mg chl-a m−2 (SD = ± 4.9 mg chl-a m−2) at the productivity stations (Figure 3). Among the productivity stations, St. 3 had the lowest microphytoplankton composition (<40%) at the surface (100% light level), while microphytoplankton was dominant throughout the euphotic zone.
The number of phytoplankton species ranged from 7 to 27 species, including unidentified micro-, nano-, and picophytoplankton within 100 m, and the cell abundance ranged from 1.9 × 10⁵ to 3.9 × 10⁶ cells L−1, with a mean of 1.6 × 10⁶ ± 8.8 × 10⁵ cells L−1 (data not shown). Diatoms (Bacillariophyceae) and Prymnesiophyceae (only Phaeocystis sp. were identified) dominated the phytoplankton community in the samples (Figure 4). The most abundant species were Phaeocystis sp. and the diatom Fragilariopsis cylindrus, with maximum cell concentrations of 3.1 × 10⁶ and 2.9 × 10⁵ cells L−1, respectively. At most stations, the diatoms and Phaeocystis sp. contributed approximately 88.3 and 77.9% of the total abundance and biovolume of phytoplankton, respectively (Figure 4). Notably, the unidentified picophytoplankton contributed up to 40.1% of the total phytoplankton abundance at St. 6 (Figure 4). The proportions of the total biovolume showed that the diatoms (mean ± SD = 51.2 ± 4.7%) were higher than those of Phaeocystis sp. (mean ± SD = 33.1 ± 7.3%) in the inner part of fjord, whereas the phytoplankton community was characterized by the prevalence of Phaeocystis sp. (mean ± SD = 64.8 ± 4.8%) in the middle part of fjord (Figure 4). However, in abundance, the Phaeocystis sp. was higher than diatoms at all stations of fjord. At the productivity stations, the diatom (Bacillariophyceae) was positively correlated between N/P (DIN to phosphate) and Si/P (silicate to phosphate) molar ratios (r = 0.59, p < 0.05 and r = 0.69, p < 0.001, n = 14, respectively), and a negative correlation existed between diatom abundance and temperature (r = −0.92, n = 14, p < 0.001) within the euphotic zone, while no relationship was found in Pheaocystis sp. (Prymneosiophyceae).

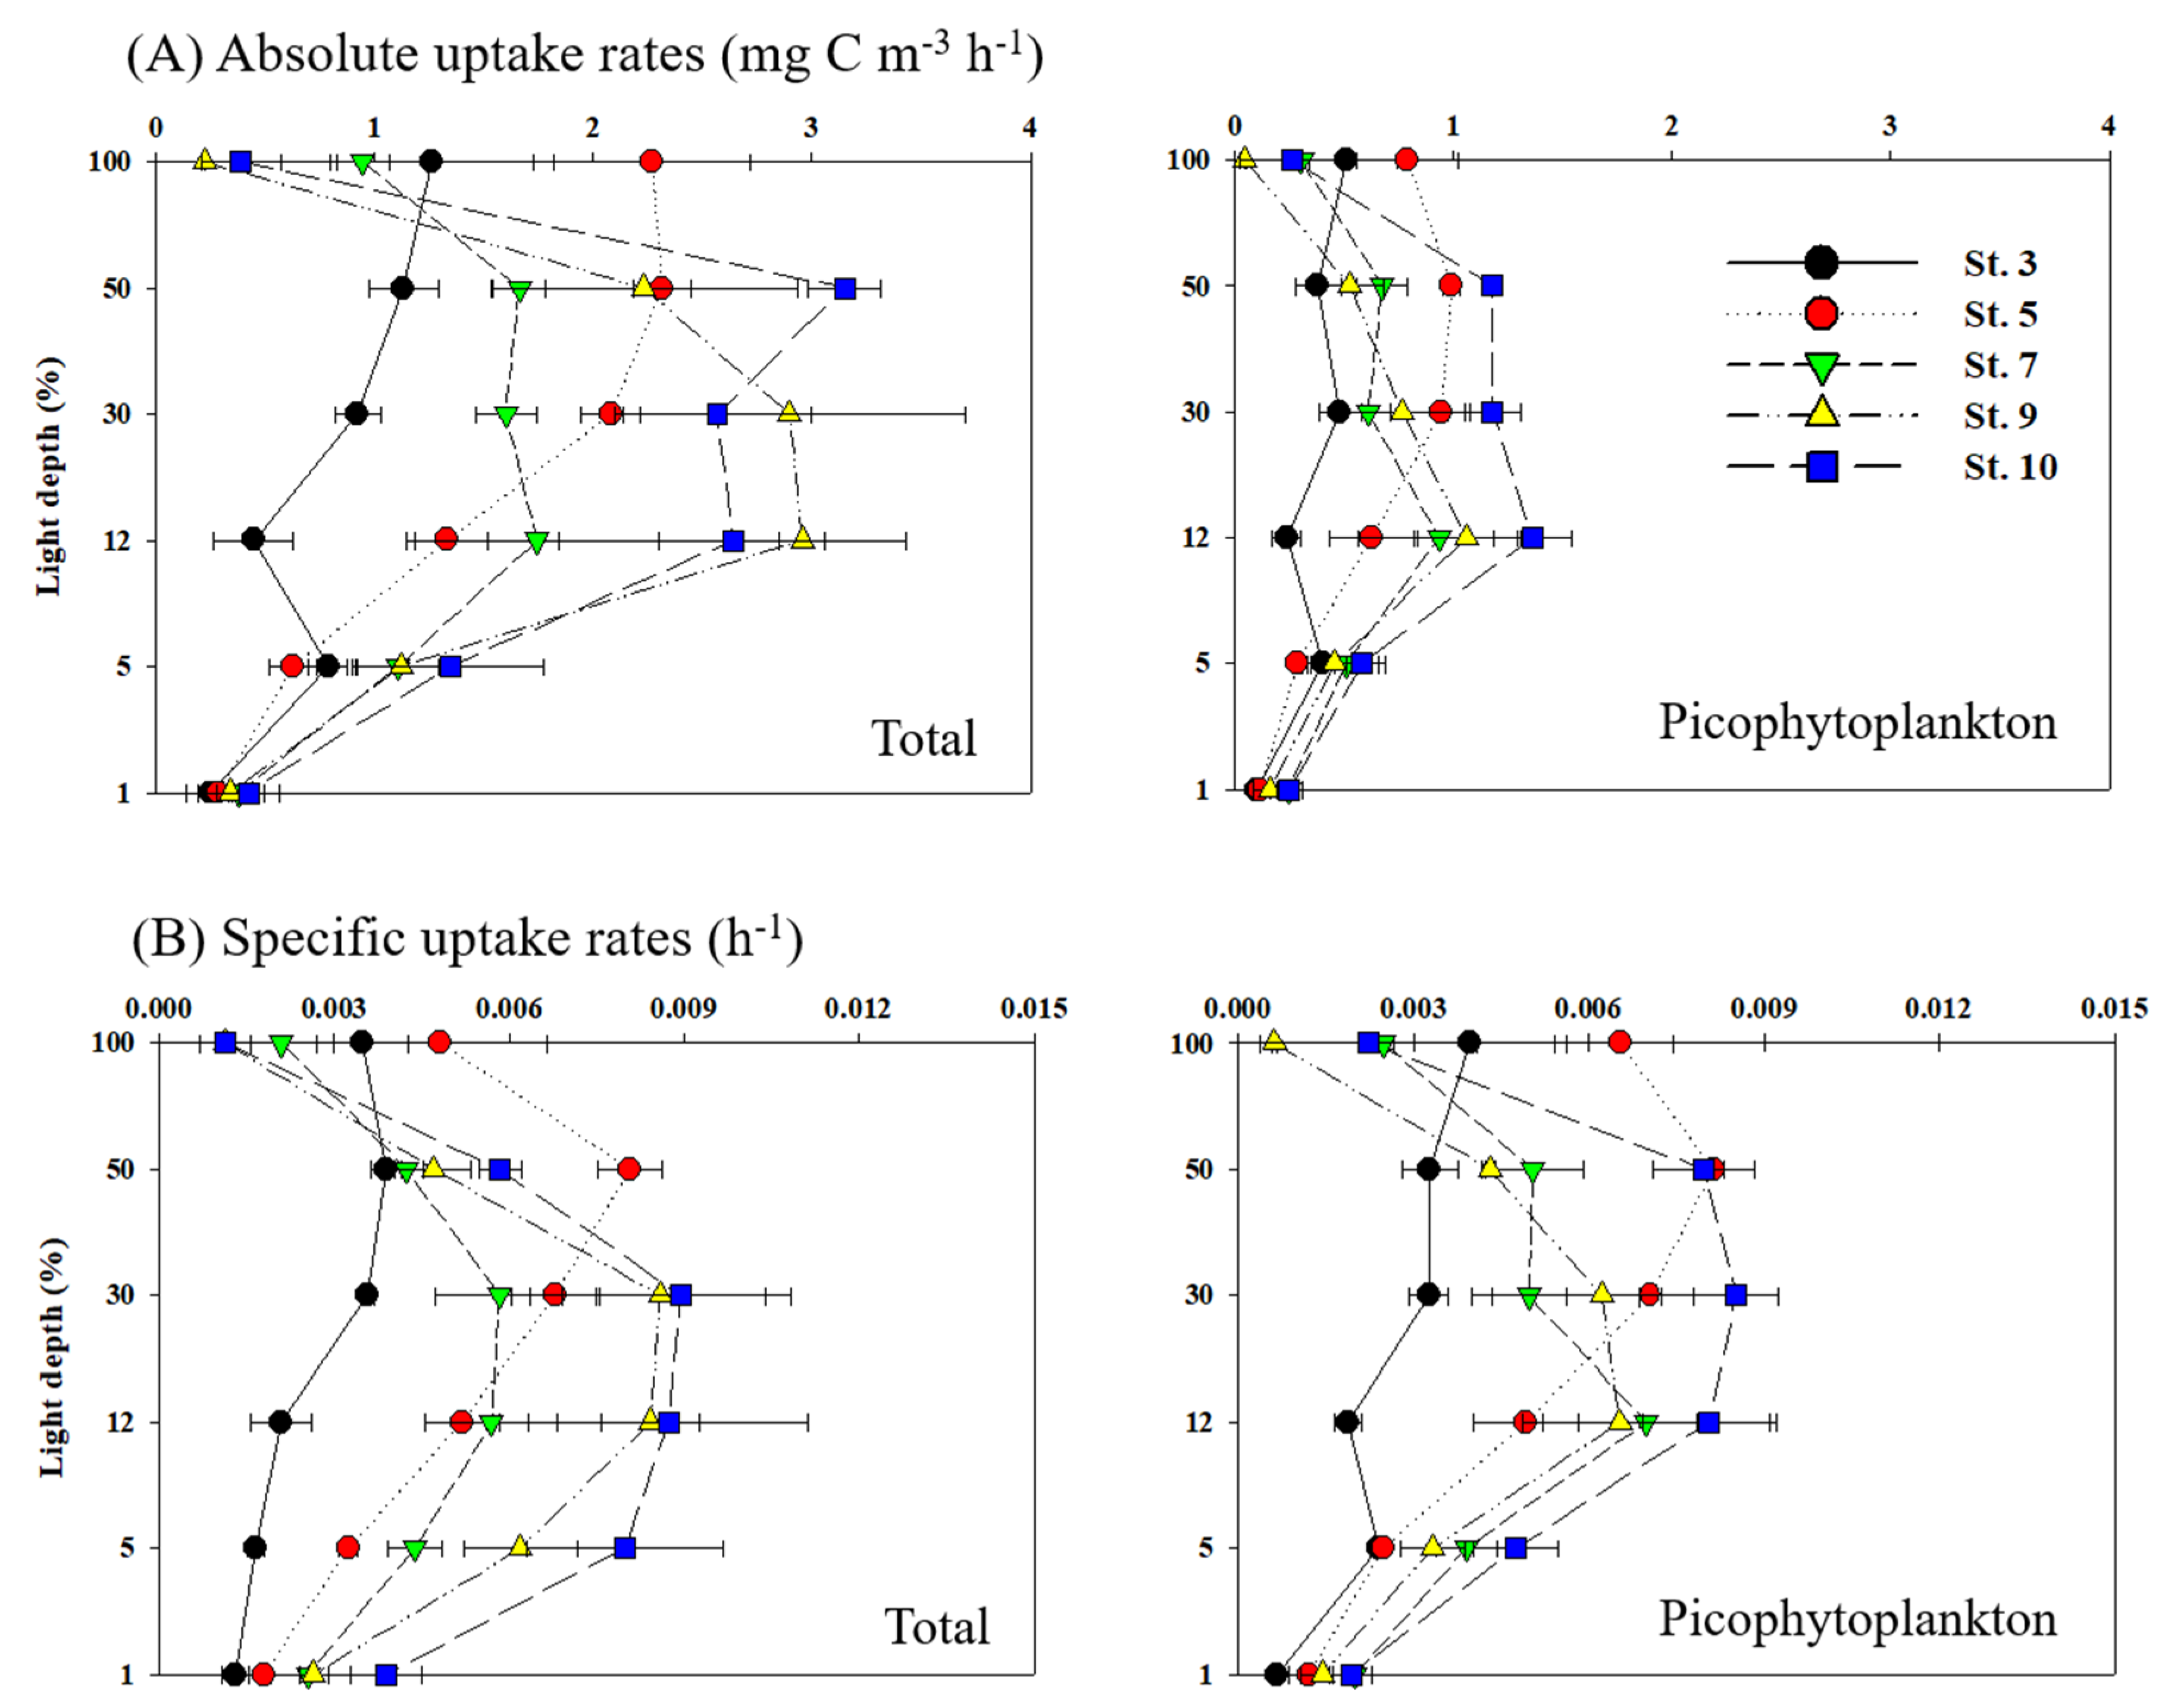
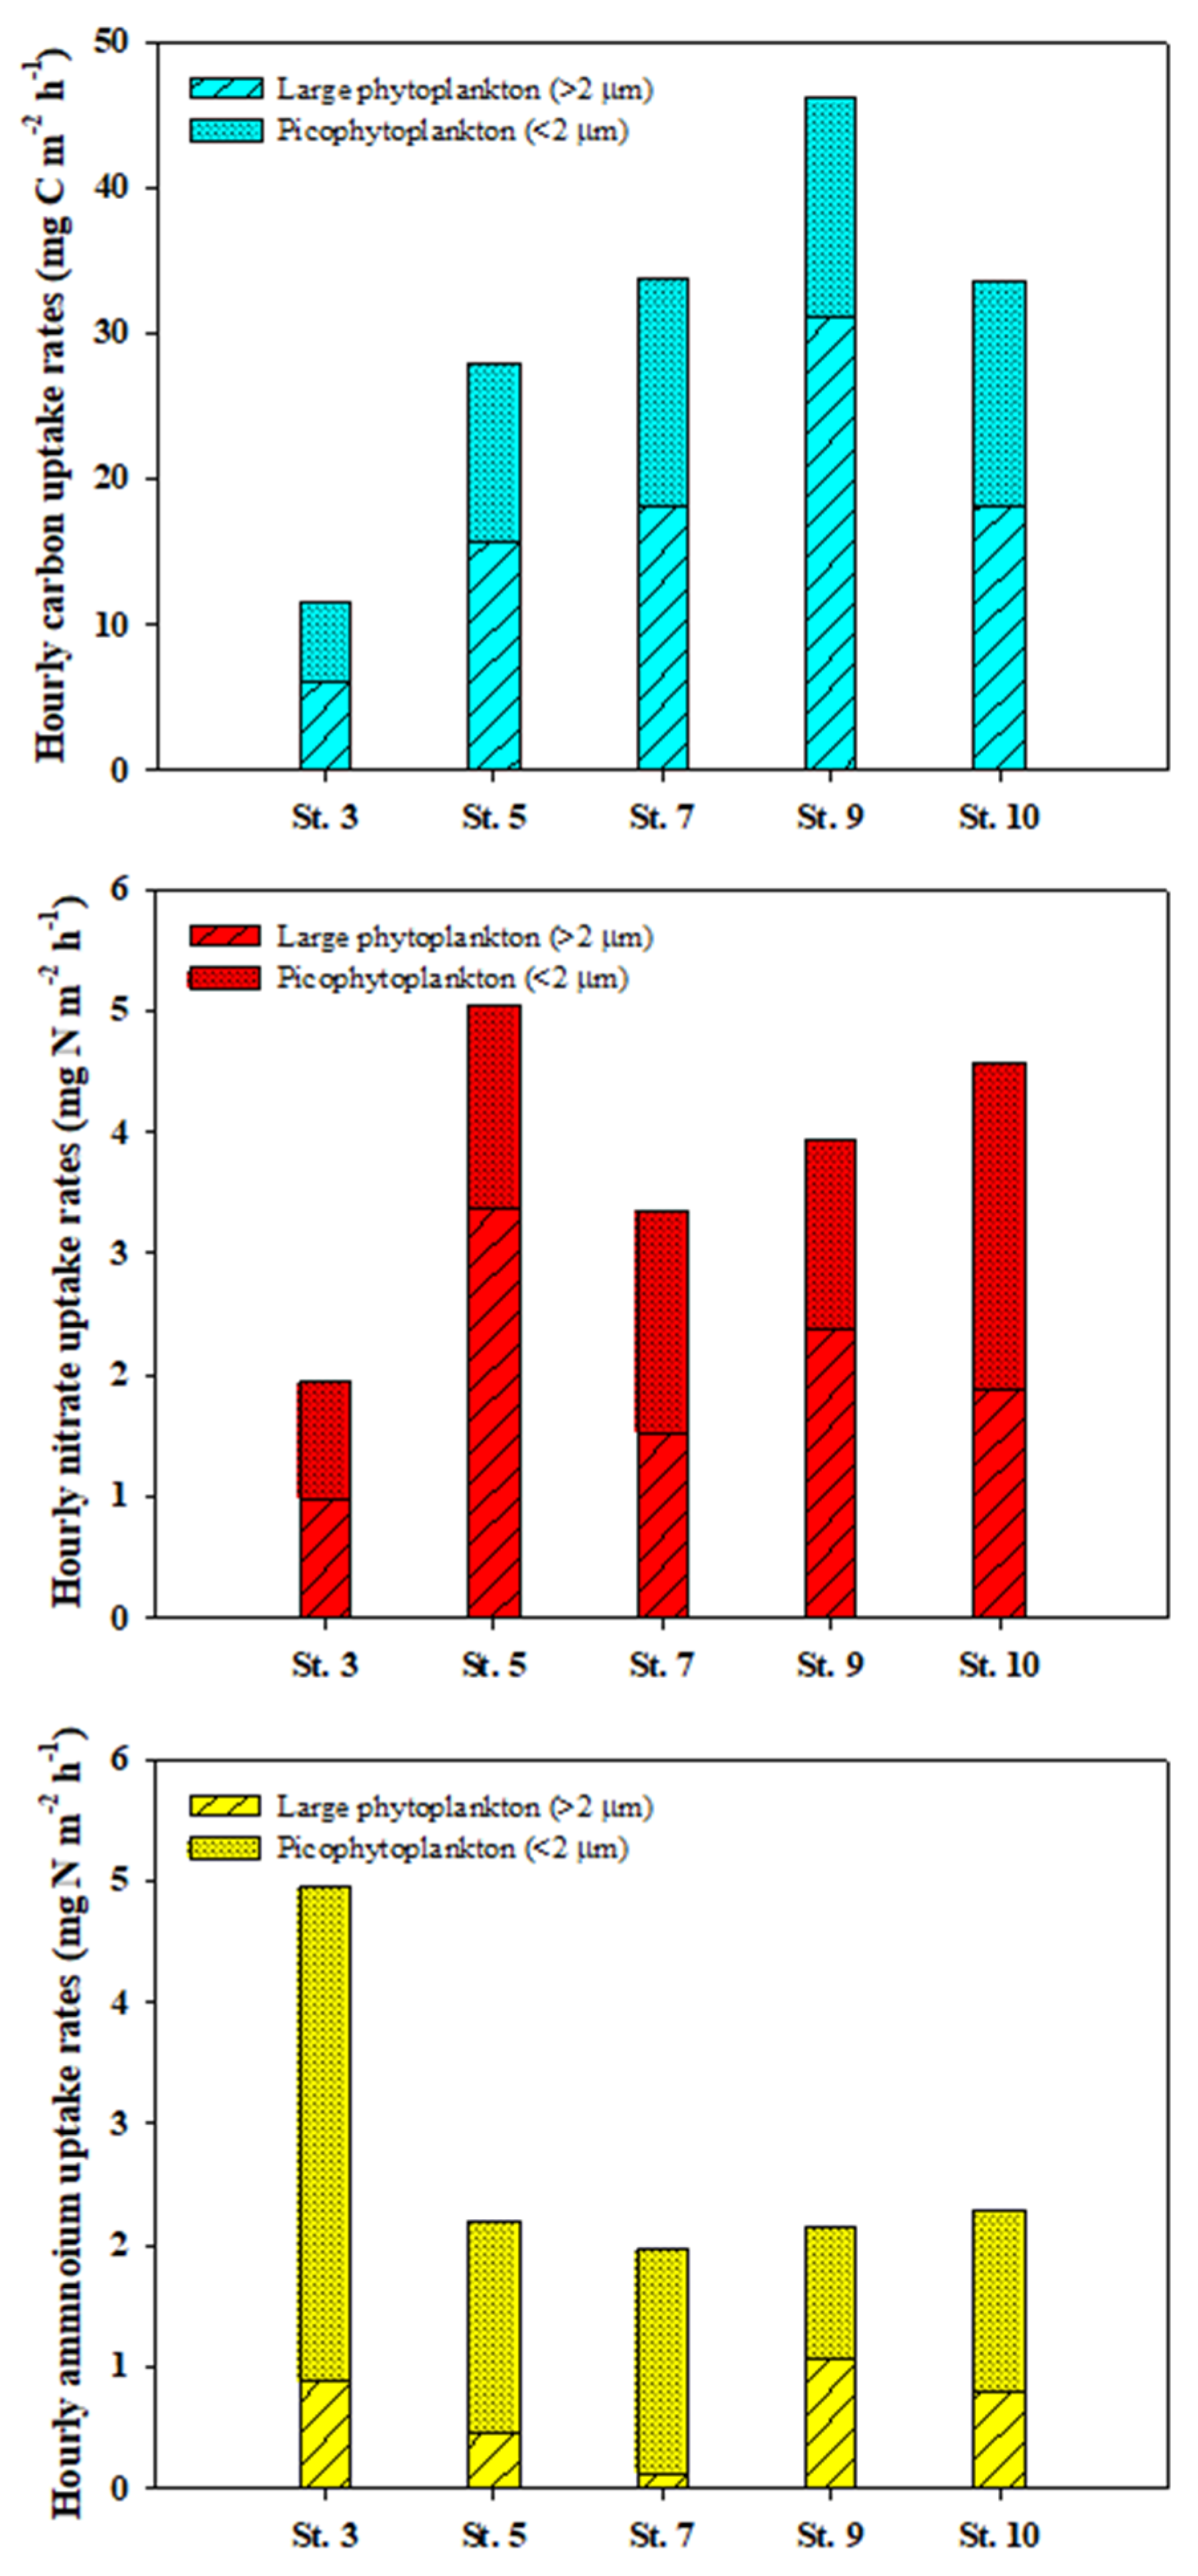
3.3. Carbon Uptake Rates of Phytoplankton

The total absolute and specific carbon uptake rates of phytoplankton in Kongsfjorden are shown in Figure 5. The absolute rate varied from 0.2 to 3.2 mg C m−3 h−1 (with a mean of 1.4 ± 0.9 mg C m−3 h−1) and the specific rate varied from 0.0006 and 0.0105 h−1 (mean ± SD = 0.0046 ± 0.0030 h−1). The total absolute carbon uptake rate was lowest at the surface or a 1% light level. Likewise, the highest specific carbon uptake rate was also observed in the absolute uptake rate profile (Figure 5).
The average total hourly carbon uptake rate integrated from 100 to 1% was 30.5 mg C m−2 h−1 (SD = ± 12.5 mg C m−2 h−1) in this study (Figure 6). The lowest uptake rate was 11.5 mg C m−2 h−1 at St. 3, whereas the highest uptake rate was 46.1 mg C m−2 h−1 at St. 9. The range of hourly carbon uptake rates of picophytoplankton (<2 µm) ranged from 5.4 (St. 3) to 15.5 (St. 7) mg C m−2 h−1, with a mean value of 12.7 mg C m−2 h−1 (SD = ± 4.3 mg C m−2 h−1) (Figure 6). The picophytoplankton contributed 42.9% (± 5.9%) of the total carbon production. The highest contribution of the large size fraction was found at St. 9 (Figure 6).

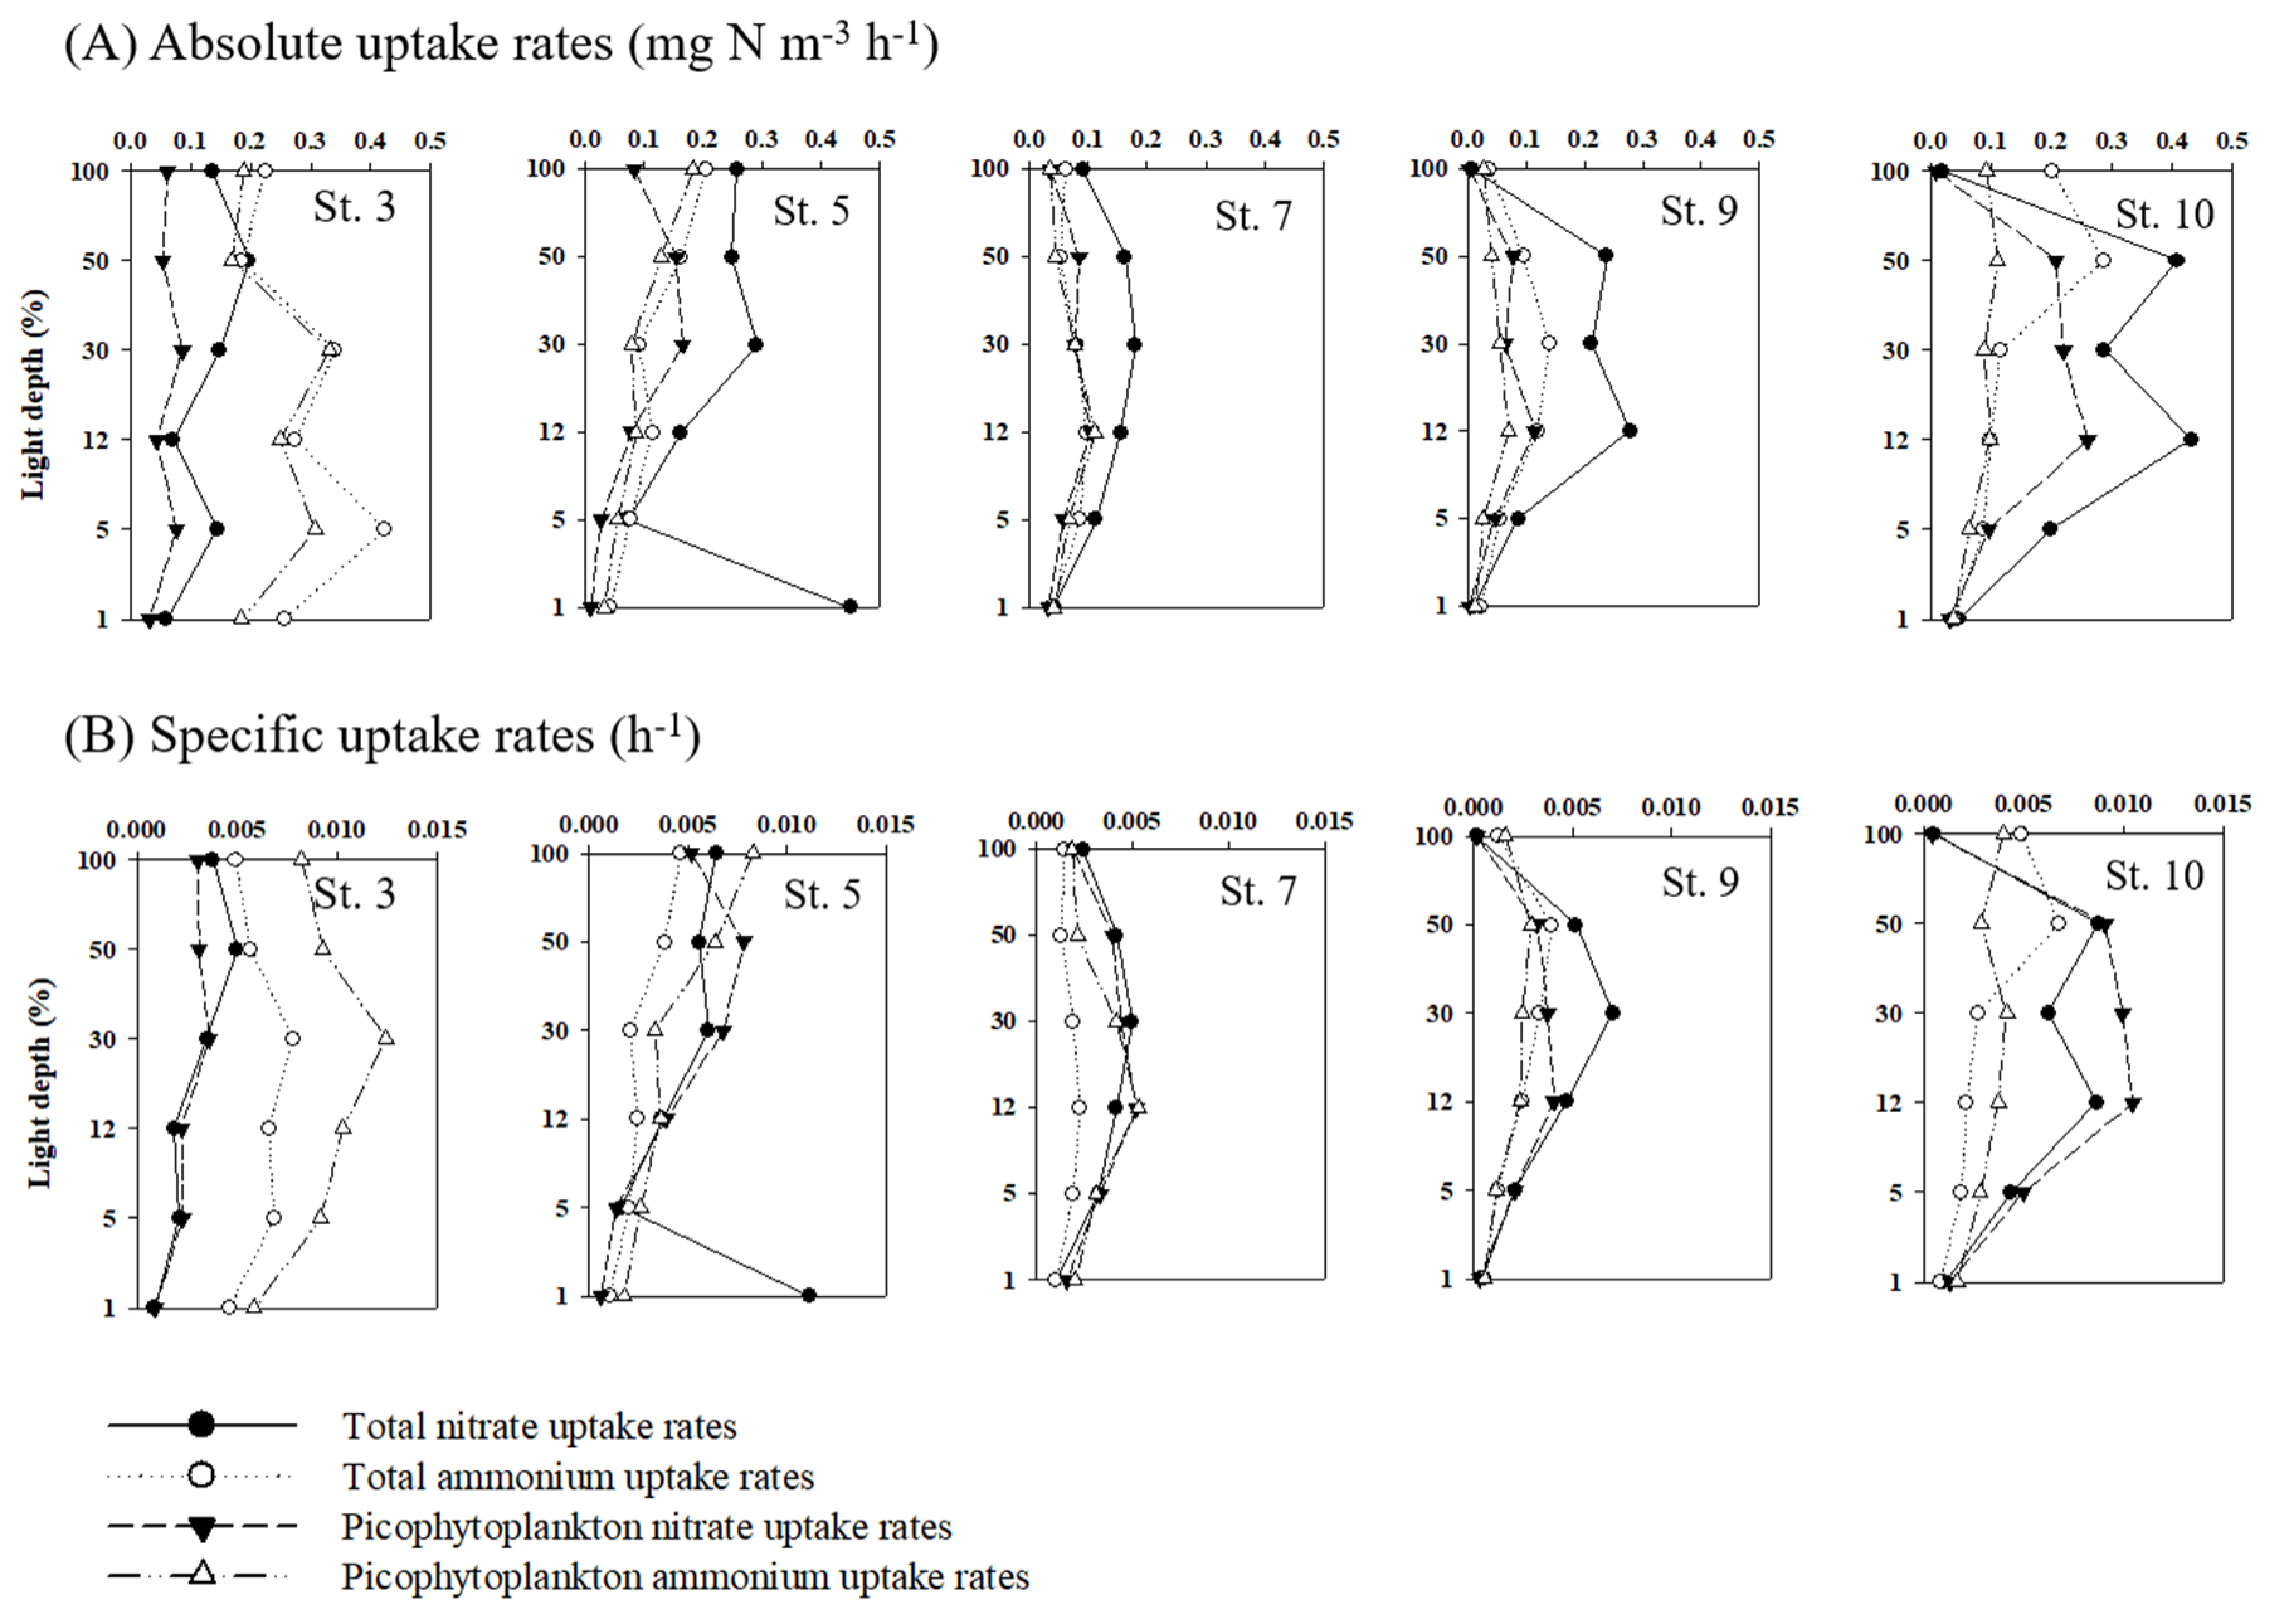
3.4. Nitrogen Uptake Rates of Phytoplankton

The absolute total nitrate uptake rates (new production) ranged between 0.003 and 0.450 mg N m−3 h−1 (mean ± SD = 0.127 ± 0.107 mg N m−3 h−1). The absolute total ammonium uptake rates ranged between 0.013 and 0.423 mg N m−3 h−1 (mean ± SD = 0.120 ± 0.092 mg N m−3 h−1). The specific total nitrate and ammonium uptake rates ranged between 0.0002 and 0.0112 h−1 (mean ± SD = 0.0039 ± 0.0027 h−1) and 0.0005–0.0125 h−1 (mean ± SD = 0.0037 ± 0.0027 h−1), respectively (Figure 7). The absolute total uptake rate generally showed a similar pattern to that of the specific total uptake rate (Figure 7). The temperature and ammonium concentrations showed a significant negative and positive correlation with the absolute and specific ammonium uptake rates, respectively (p < 0.05) (Table 3). In contrast, there was no significant difference between the nitrate concentration and the nitrate uptake rate (p > 0.05). The specific uptake rates of nitrate and ammonium were identical, thus suggesting that the utilization of nitrate and ammonium are similar for phytoplankton growth.
The total hourly nitrate and ammonium uptake rates integrated from 100 to 1% light levels were 2.0–5.0 mg N m−2 h−1 and 2.0–5.0 mg N m−2 h−1, respectively, at the productivity stations (Figure 6). The average nitrate uptake rate was 3.8 mg N m−2 h−1 (SD = ± 1.2 mg N m−2 h−1), which was higher than 2.7 mg N m−2 h−1 (SD = ± 1.3 mg N m−2 h−1) for ammonium, but the rates were not significantly different (t test, p > 0.05). The total nitrogen (nitrate and ammonium) uptake rates of the total phytoplankton and picophytoplankton ranged from 5.3 to 7.2 mg N m−2 h−1 (mean ± SD = 6.5 ± 0.8 mg N m−2 h−1) and 2.6 to 5.0 mg N m−2 h−1 (mean ± SD = 3.8 ± 0.9 mg N m−2 h−1), respectively (Figure 6). The contributions of picophytoplankton to the total nitrogen uptake rates were 47.1 ± 10.6% for nitrate and 74.0 ± 16.7% for ammonium (Figure 6).

4. Discussion

4.1. Environmental and Phytoplankton Community Characteristics of Early Springtime in Kongsfjorden

In Kongsfjorden, the bloom timing and dominant species varied from April to the end of May in relation to the environmental factors (i.e., sea ice, glacier and Atlantic water inflow events) [16,41,42]. During the spring bloom, the phytoplankton community was dominated by diatoms, with high integrated chl-a concentrations (up to 35 mg chl-a m−2) and nutrient-depleted conditions (<1.0 μM for silicate and <0.2 μM for nitrate) at depths of less than 50 m, while the dominant species shifted from Fragilariopsis spp. and diatoms in April and mid-May to Phaeocystis pouchetii colonies after mid-May with the low nutrient concentrations (level of spring bloom) [41]. This finding was consistent with that of von Quillfeldt [43], who found that diatoms dominated the early phytoplankton spring bloom.
In our study, the mean integrated chl-a value (ca. 20 mg chl-a m−2) in the euphotic zone was similar to that on 8 May (after peak bloom; 22 mg chl-a m−2 for 20 m) in Hodal et al.’s study [41] and higher than the winter values (6–7 mg chl-a m−2) in Eilertsen et al.’s study [21]. The observed values for nitrate and nitrite (mean ± SD = 4.2 ± 1.1 μM) were approximately half of the winter values (10–12 µM; Hop et al. [16]). The silicate (mean ± SD = 4.5 ± 0.2 μM) concentration was similar to that of the maximum level (4.8 μM) of early springtime (9 April to 12 May 2008) [44]. In addition, the N/P molar ratio (mean ± SD = 12.8 ± 1.4) at depths of less than 50 m was slightly lower than the Redfield ratio (16; Redfield [45]) and higher than that reported by Iversen and Seuthe [20] for the upper 50 m of the water column (3.2) during the spring bloom in Kongsfjorden. Although the Si/P molar ratio (mean ± SD = 11.1 ± 2.7) was less than the Redfield ratio (15:1) during the sampling period, this finding is not an indication of severe nutrient deficiency for phytoplankton growth because the proportion of microphytoplankton was approximately 68.1% of the total chl-a concentration. It is generally considered that communities dominated by large cells are responsible for phytoplankton biomass accumulation in nutrient-replete conditions, while small cells are typical of oligotrophic systems [46].
Previous studies indicated that in spring blooms, diatoms were the most important components of the phytoplankton communities in the fjord ([16,41] and references therein). However, the major contributor to the phytoplankton assemblage was Phaeocystis sp., which accounted for more than 40% of the total phytoplankton abundance in our study. The lower presence of the diatom compared to P. pouchetii and generally very low values of chl-a (<1 mg m−3) relative to the enhanced inflow of warm Atlantic water during the spring bloom were features observed in Kongsfjorden [41,42]. In fact, the waters of the middle zone (St. 7, St. 8, St. 9, and St. 10) at depths of less than 100 m were composed of warmer water (>2 °C), which was coincidental with a higher abundance of Phaeocystis sp. than the inner zone (St. 1, St. 2, and St. 3; mean ± SD = 0.9 ± 0.7 °C) in our study. The relative abundance of diatoms showed an inverse relationship with temperature. These relationships reflected the spatial distribution and taxonomic composition of phytoplankton communities and water masses. An advection of the haptophyte P. pouchetii into Kongsfjorden was suggested by van De Poll et al. [47]. In addition, the unidentified sp. (pico size; <2 μm) was quite important in terms of abundance in Kongsfjorden (~40%) at St. 6, which is near the glacier. A higher proportion of nano- and picophytoplankton (mean ± SD = 71.3 ± 16.4%) with relatively cold surface water was observed at the inner fjord, suggesting that glacial influence may have a predominant effect on phytoplankton size classes. The observed size classes of phytoplankton were in agreement with Piquet et al. [44], who conducted sampling near the Kongsfjorden glacier during early spring. Hence, we inferred that the sampling period was considered the early phase of the spring bloom and not a post-bloom state in Kongsfjorden based on chl-a nutrient data. The phytoplankton community was affected by glacial meltwater input and influenced by Atlantic waters (presumably as a result of warmer water).

4.2. Total Carbon and Nitrogen Uptake Rates of Phytoplankton

Generally, the carbon and nitrogen uptake rates reflected the light conditions, biomass, ambient nutrient concentration, size class, composition, and physiological state of the phytoplankton and their bloom timing [48,49,50]. The integrated carbon uptake rates of phytoplankton and chl-a decreased towards the inner part of the fjord and were even completely suppressed at the stations closest to the glacier (St. 3), which may have been caused by glacial sediment. The melting glacier releases particles into the fjord, leading to a lower euphotic zone and highly unfavorable conditions for phytoplankton growth [17,47,51,52]. In our study, due to their location and the nearest tidewater glacier in Kongsfjorden, the inner stations showed high turbidity (Figure 1D). This finding was consistent with that of Piquet et al. [44]; the relatively high Kd values near the Kongsfjorden glacier were caused by enriched sediment particles as a result of the early onset of glacial meltwater during early spring. Van de Poll et al. [53] also demonstrated that reduced light penetration into the water column associated with glacial sediments limits the buildup of depth-integrated chl-a in the inner Kongsfjorden. In this sense, at St. 3 in the observation area, the euphotic depth (16 m) was the lowest, which suggests that increases in meltwater influx led to increased turbidity and reduced light penetration into the water, resulting in a lower carbon uptake rate.
More specifically, phytoplankton were less active in shallow water than in deep water within the euphotic zone. As shown in Figure 5, the maximum total carbon uptake rates were relatively high between 10 and 30 m, where the chl-a concentrations were highest. The specific carbon uptake of the total phytoplankton, except for the phytoplankton biomass (particulate organic matter; POC), also showed a similar trend. This result mirrored the findings of Hodal et al. [41] in Kongsfjorden; they reported that a high primary production and low biomass of phytoplankton were observed at 5 or 10 m and at the surface, respectively, due to photoinhibition during mid-May. Notably, at St. 3 (which had high turbidity), the maximum total carbon uptake rate was observed in surface water, which coincided with the high picophytoplankton uptake rate and relatively low contribution of microphytoplankton (38.2%). There is a positive relationship between the contribution of picophytoplankton chl-a and turbidity in surface data (r = 0.75, n = 10, p < 0.05). From these results, it has been suggested that smaller phytoplankton have a competitive advantage over microphytoplankton under turbidity as a strategic response to light. This potential mechanism aligned with the finding that absorption efficiency was higher in smaller cells than in larger cells due to their reduced chromophore self-shading [54,55,56]. Unlike the carbon uptake rate, the absolute concentration of inorganic nutrients, except for ammonium, was constant within the euphotic zone in this study. As a result, there was no statistical significance between the nutrient parameters and carbon uptake rate (p > 0.05) (Table 3). Likewise, they did not show any relationship between species composition. In this sense, the high turbidity, which represented low light conditions across transects, was the primary factor influencing light attenuation among stations in our study.
In this study, the daily uptake rates were calculated based on the daylight duration (24 h). The mean carbon uptake rate (0.7 g C m−2 day−1) was up to two times lower than that reviewed by Hop et al. [16] (0.8–1.4 g·C·m−2 day−1) during July 1996 and much higher than that of Eilertsen et al. [21] in the transitional zone of Kongsfjorden (0.03 g C·m−2 day−1 for 26 July 1979 and 0.17 g C m−2 day−1 for 31 July 1980) (Table 4). In May, Hodal et al. [41] observed the carbon uptake rate of total phytoplankton during the peak bloom in 2002 (1 May; 1.5 g C m−2 day−1 for 30 m), and their mean value (0.5 g·C·m−2 day−1 from 1–22 May) was slightly lower than the values reported in our data. Similarly, Iversen and Sethue [20] and van de Poll et al. [53] observed low values (0.5 g C·m−2·day−1) at the end of May and in June, respectively. The variability in these data reflected large spatial and temporal abundance and the physiological state of phytoplankton and their bloom timing. Previous studies have reported that the carbon uptake rate ranges from 0.01 to 1.5 g C m−2 day−1 and is very variable in Kongsfjorden; the highest values are observed in April or May and then diminish [16,20,21,41].
The assimilation index (integrated carbon uptake rates to integrated chl-a concentrations) provides a useful indicator of the physiological state of phytoplankton [38,41,57]. It is mainly dependent on light conditions, nutrient supply, and/or phytoplankton species composition [58]. In Kongsfjorden, 14–36 mg·C (mg chl-a)−1 day−1 was documented, demonstrating good growth conditions [41]. The value that we calculated for the assimilation index ranged from 19.0 to 47.4 (mg C (mg chl-a)−1 day−1), with a mean of 37.1 mg·C (mg chl-a)−1 day−1 (SD = ± 13.7 mg C (mg chl-a)−1 day−1); the integrated value (16~27 m) was higher than that of a marginal ice zone during a bloom in the northern Barents Sea (Hodal and Kristiansen [38]; 3–10 mg C (mg chl-a)−1 day−1) and the values of Kongsfjorden during May (mean ± SD = 22.6 ± 8.3 mg C (mg chl-a)−1 day−1, integrated to 30 m (Hodal et al. [41]). The result of the assimilation index indicated a phytoplankton community that is not in a poor physiological condition. Despite the good growth conditions, the difference between the daily carbon uptake rate (0.7 g C m−2 day−1) in this study and that of Hodal et al. [41] (0.5 g C m−2 day−1) could be an indication of a difference between sampling periods. Hodal et al. [41] conducted measurements at one point station and covered peak- and post-bloom values, unlike our study.
In this study, the uptake rates of total nitrogen (nitrate and ammonium) were on average 0.16 ± 0.02 g·N·m−2·day−1, which was similar to that of the non-polynya area of the Amundsen Sea, Antarctica (0.2 g N·m−2 day−1; Lee et al. [59]), and slightly lower than those of the Northeast Atlantic fjord, Faroe Islands (May–September; 0.27 g N·m−2·day−1; Gaard et al. [60]). Compared to the rates previously reported in the Arctic Ocean [61,62,63,64], our values were relatively high. Lee and Whitledge [61] found that the average total nitrogen uptake rates were 0.03 g N m−2 day−1 (SD = 0.02 g N·m−2·day−1) in the Canada Basin, whereas Lee et al. [62] obtained various values (ranging from 0.02 to 0.5 g·N·m−2·day−1) from the Chukchi Sea during summer. In contrast, Yun et al. [63] found relatively low average rates (0.005 g·N·m−2·day−1) in the Canada Basin. The lower uptake rates in the Arctic Ocean compared to in the fjord area and the Southern Ocean may be due to the lower nitrogen availability because the Arctic Ocean is a nitrogen-limited system [65].
Overall, the daily total nitrate uptake rates (mean ± SD = 0.09 ± 0.03 g N m−2 day−1) were slightly higher than the ammonium uptake rates (mean ± SD = 0.07 ± 0.03 g N m−2 day−1), which implies that the ecosystem has potentially near-equal contributions from new and regenerated production to the total productivity within the euphotic zone. Generally, strong new production is observed in the exponential growth phase of phytoplankton, whereas regenerated production appears post-bloom due to the nutrients released by grazing and microbial processes (bacterial degradation and viral lysis) [4]. Considering that zooplankton abundance is low in spring in Kongsfjorden [66,67], the phytoplankton were not in the exponential growth phase, at least during our observation period. However, St. 3 had a somewhat unexpectedly high depth-integrated ammonium uptake rate with the lowest euphotic depth. In particular, the absolute and specific ammonium uptake rates coincided with peaks in ambient ammonium concentration and lower temperature in our study. These results suggest that the nitrogen uptake rate of phytoplankton was more strongly correlated with nutrients (with ammonium being of particular importance) than with light conditions. According to Halbach et al. [68], tidewater glacier and subglacial discharge, Atlantic water, and nutrient release from the seafloor can have both direct and indirect effects on the nutrient dynamics in Kongsfjorden. In this sense, supply from glacial discharge and induced upwelling with ammonium released from the seafloor could be considered possible sources of the observed ammonium at St. 3.

4.3. Contribution of Picophytoplankton to Carbon and Nitrogen Uptake Rates

Although the importance of picophytoplankton (<2 µm) as a major primary producer is well established in oligotrophic [69] and high-latitude environments, little is known about the abundance and carbon uptake rates of the picophytoplankton response to environmental forcing in Kongsfjorden. Recently, the contribution of picophytoplankton to total primary production has been highly variable and was reported to be up to 90% of the carbon fixation in the Atlantic Ocean [70] and 60% of that in the Kara, Laptev, and East Siberian Seas [71]. Picophytoplankton abundance is high in the Arctic Ocean [72,73] and accounts for 60–90% of the chl-a concentration in the eastern Fram Strait [74].
In this study, the depth-integrated carbon uptake rates of the picophytoplankton in Kongsfjorden ranged from 0.1 to 0.4 g C m−2 day−1 and decreased from the middle zone (St. 7, St. 9, and St. 10) to the inner zone (St. 3). Microphytoplankton (>20 μm) accounted for >60% of the phytoplankton chl-a, whereas picophytoplankton (<2 μm) was a minor primary producer, contributing approximately 20% of the total chl-a. However, the contribution of picophytoplankton to the total carbon uptake rates ranged from 32.6 to 46.5%, with a mean of 42.9 ± 5.9% (Figure 6), which was higher than the contribution of chl-a. In the Arctic Ocean, the mean contribution values for this study were similar to those of Hodal and Kristiansen [38] (46% for <10 μm-sized cells) in the marginal ice zone of the northern Barents Sea during the spring bloom, whereas these values were lower than those of the western Canada Basin (64.0 ± 9.1%; Yun et al. [75]) and higher than those in the Chukchi Sea (31.7 ± 23.6%) for 0.7–5 µm-sized phytoplankton [14].
Despite the low contribution of chl-a, it had a relatively high contribution to production due to the higher particulate organic carbon (POC)-to-chl-a ratio of picophytoplankton (867.8 ± 218.8) than that of larger phytoplankton (>2 μm; 270.6 ± 37.6). This finding was consistent with Lee et al. [14]. These authors reported that chl-a as a proxy for total phytoplankton biomass may not be as effective as a proxy for biomass in picophytoplankton. Additionally, the carbon-to-chl-a ratio of phytoplankton is highly regulated in response to the nutrient, temperature, and irradiance conditions [26]. In our study, we could not find any trend between total carbon uptake rates and the contribution of picophytoplankton chl-a, whereas a small negative correlation (r = −0.60) was observed with the picophytoplankton contribution to POC. Therefore, if we consider carbon to be the basis for phytoplankton biomass, the contribution of picophytoplankton is expected to decrease the total primary production in Kongsfjorden.
The nitrate uptake rates of picophytoplankton ranged from 0.02 to 0.06 g N m−2 day−1, with a mean of 0.04 g N m−2 day−1 (SD = ± 0.01 g N m−2 day−1), whereas the ammonium uptake ranged from 0.03 to 0.10 g N m−2 day−1, with a mean of 0.05 g N m−2 day−1 (SD = ± 0.03 g N m−2 day−1). Overall, the contributions of picophytoplankton to the total nitrogen uptake rates were 47.1 ± 10.6% for nitrate and 74.0 ± 16.7% for ammonium (Figure 6). Consistent with this observation, the relative preference index (RPI) of picophytoplankton for ammonium and nitrate ranged from 1.3 to 7.0 with a mean of 2.9 (SD = ± 1.4) and 0.1 to 0.9 with a mean of 0.5 (SD = ± 0.3), respectively (Figure 8). The RPI and turnover time values can be valuable tools for estimating the utilization of a nitrogen compound. RPI > 1 indicates positive nutrient selection for phytoplankton nitrogen uptake, and RPI < 1 indicates the opposite. Assuming little change in nitrate and ammonium concentrations during spring and only use by picophytoplankton, the mean turnover time for nitrate and ammonium was 105.8 (SD = ± 197.0 days) and 9.1 days (±6.6 days), respectively (Figure 8). Therefore, the RPI and turnover time of picophytoplankton suggested a predominance of ammonium uptake. This result was consistent with those of several studies [14,48,49,76], which found that large cells used nitrate for growth, whereas small phytoplankton (<5 μm) preferred regenerated nitrogen, such as ammonium. As suggested below, the ambient ammonium concentration may also have been an inhibitor of nitrate uptake.
The regulation and inhibition of the nitrate uptake rate of ammonium have been reported in many studies ([77,78,79] and references therein). More specifically, Goeyens et al. [77] found that nitrate uptake rates decrease when ammonium stocks exceed 1.7% of the total inorganic nitrogen in Southern Ocean marginal ice zones. Various threshold concentrations of inhibition have been reported in different studies, with a wide range of 0.1 to 2 μM [50,80,81,82,83]. In particular, the ammonium inhibition of nitrate uptake by picophytoplankton (<2 μm) was more pronounced than that of large (>2 μm) fractionated phytoplankton in the northeastern basin of the Atlantic [84]. In our study, the contribution of ammonium to the total inorganic nitrogen ranged from 11.1 to 45.0%, with a mean of 21.3% (±10.0%). Regardless of the phytoplankton cell size, there was no significant relationship between the ammonium contribution (%) and the absolute and specific nitrate uptake rates, which differed from the findings of Goeyens et al. [77]. However, as shown in Figure 6, the highest ammonium and lowest nitrate uptake rates of picophytoplankton at St. 3 in the fjord coincided with a relatively high concentration (approximately 1.5 µM) and contribution (39.2 ± 6.5%) of ammonium to the total inorganic nitrogen. Our results agreed with previous studies that reported that the ammonium uptake rate at >1 µM ammonium was higher than that at concentrations below 1 µM [50,77,79,82]. Hence, it was speculated that a major determinant of ammonium and nitrate uptake rates in this region may be the result of the ammonium concentration, suggesting that ammonium levels are capable of suppressing nitrate uptake.
However, our samples (<2 µm) contained not only phytoplankton but also microorganisms, such as bacteria, which can play a role in nitrogen uptake. In our study, the bacterial biomass within the euphotic zone was not quantified, but to verify this hypothesis, we compared the δ13C (−27.1 ± 1.4% and −26.2 ± 0.5% in total and pico-POC, respectively) and the carbon-to-nitrogen molar ratio (C/N) values (9.2 ± 1.7 and 9.6 ± 1.4) of the POC in this study. The observed values were within the ranges that were previously published. According to earlier studies, generally, the δ13C and C/N values of phytoplankton ranged between −27.5 and −25.6% and from 6 to 10, respectively ([85,86,87,88] and references therein). In addition, heterotrophic systems usually have low nutrient concentrations or nutrient-limited conditions. Based on the δ13C, C/N and nutrient conditions, we assumed that POC was mainly derived from phytoplankton in this study [14,64,87,88,89,90]. However, Fouilland et al. [91] reported that heterotrophic bacteria accounted for a large portion of the total uptake of nitrogen (up to 78%) in the North Water polynya. Nitrate and ammonium uptake by heterotrophic bacteria accounted for 4–14% and 22–39% during the North Atlantic spring bloom, respectively (May 1989; Kirchman et al. [92]). In Kongsfjorden, the heterotrophic bacteria accounted for 17% of the total POC in May [20]. Therefore, further investigations are needed to understand the regulation of nitrogen uptake by phytoplankton and bacteria in fjord ecosystems, as well as their interaction under nitrogen-limited conditions.

5. Summary and Conclusions

This present study investigated the carbon and nitrogen uptake rates of phytoplankton and the contribution of picophytoplankton to total production in Kongsfjorden. Our results suggest that low light availability by glacier melt inputs with high turbidity has an important negative effect on springtime primary production, restricting large phytoplankton productivity. The picophytoplankton contributed most to the uptake of ammonium (74.0 ± 16.7%) than nitrate (47.1 ± 10.6%) and carbon (42.9 ± 5.9%). This finding indicated that picophytoplankton was largely based on regenerated nutrients (ammonium as a nitrogen source) and a slightly lower assimilation of carbon than in large phytoplankton (>2 µm). During the study period, diatoms and Phaeocystis sp. were clearly the most important producers in Kongsfjorden, but if they were replaced by the nano- and picophytoplankton size classes, then the fjord ecosystem would become less productive, which would not sustain higher trophic levels of biomass (e.g., zooplankton).

Author Contributions

S.-Y.H. conceived of the study, participated in its design and helped to draft the manuscript. B.K.K. drafted the manuscript and performed the field and laboratory experiments. H.M.J. and J.J. carried out the analysis of the phytoplankton taxonomy, chl-a, and nutrients. B.L. critically reviewed the manuscript. All authors have read and agreed to the published version of the manuscript.

Funding

This study was supported by the Korea Polar Research Institute (KOPRI) and undertaken as part of “Carbon assimilation rate of sea ice ecosystem in the Kongsfjorden MIZ, Arctic (PE18170)” and “Adaptation and Assessment of coastal marine (benthic–pelagic) ecosystem impacted by rapid glacier retreat, Antarctica (PE20120)”.

Conflicts of Interest

The authors declare no conflict of interest.

References

  1. Azam, F. Oceanography: Microbial Control of Oceanic Carbon Flux: The Plot Thickens. Science 1998, 280, 694–696. [Google Scholar] [CrossRef] [Green Version]
  2. Arrigo, K.R. Marine microorganisms and global nutrient cycles. Nature 2005, 437, 349–355. [Google Scholar] [CrossRef] [PubMed]
  3. Falkowski, P.G.; Raven, J.A. Aquatic Photosynthesis, 2nd ed.; Princeton University Press: Princeton, NJ, USA, 2007. [Google Scholar]
  4. Dugdale, R.C.; Goering, J.J. Uptake of new and regenerated forms of nitrogen in primary productivity. Limnol. Oceanogr. 1967, 12, 196–206. [Google Scholar] [CrossRef] [Green Version]
  5. Eppley, R.W.; Peterson, B.J. Particulate organic matter flux and planktonic new production in the deep ocean. Nature 1979, 282, 677–680. [Google Scholar] [CrossRef]
  6. Ducklow, H.; Steinberg, D.; Buesseler, K. Upper Ocean Carbon Export and the Biological Pump. Oceanography 2001, 14, 50–58. [Google Scholar] [CrossRef]
  7. Wassmann, P.; Slagstad, D.; Riser, C.W.; Reigstad, M. Modelling the ecosystem dynamics of the Barents Sea including the marginal ice zone. J. Mar. Syst. 2006, 59, 1–24. [Google Scholar] [CrossRef]
  8. Olli, K.; Wassmann, P.; Reigstad, M.; Ratkova, T.N.; Arashkevich, E.; Pasternak, A.; Matrai, P.A.; Knulst, J.; Tranvik, L.J.; Klais, R.; et al. The fate of production in the central Arctic Ocean—top–down regulation by zooplankton expatriates? Prog. Oceanogr. 2007, 72, 84–113. [Google Scholar] [CrossRef]
  9. Richardson, T.L.; Jackson, G.A. Small Phytoplankton and Carbon Export from the Surface Ocean. Science 2007, 315, 838–840. [Google Scholar] [CrossRef] [Green Version]
  10. Henson, S.A.; Le Moigne, F.A.C.; Giering, S.L.C. Drivers of Carbon Export Efficiency in the Global Ocean. Glob. Biogeochem. Cycles 2019, 33, 891–903. [Google Scholar] [CrossRef]
  11. Li, W.K.W.; McLaughlin, F.A.; Lovejoy, C.; Carmack, E.C. Smallest Algae Thrive as the Arctic Ocean Freshens. Science 2009, 326, 539. [Google Scholar] [CrossRef] [Green Version]
  12. Comiso, J.C.; Hall, D.K. Climate trends in the Arctic as observed from space. Wiley Interdiscip. Rev. Clim. Chang. 2014, 5, 389–409. [Google Scholar] [CrossRef] [PubMed]
  13. Morán, X.A.G.; López-Urrutia, Á.; Calvo-Díaz, A.; Li, W.K.W. Increasing importance of small phytoplankton in a warmer ocean. Glob. Chang. Biol. 2010, 16, 1137–1144. [Google Scholar] [CrossRef]
  14. Lee, S.H.; Yun, M.S.; Kim, B.K.; Joo, H.; Kang, S.-H.; Chang-Keun, K.; Whitledge, T.E. Contribution of small phytoplankton to total primary production in the Chukchi Sea. Cont. Shelf Res. 2013, 68, 43–50. [Google Scholar] [CrossRef]
  15. Hopkins, T.S. The GIN Sea—A synthesis of its physical oceanography and literature review 1972–1985. Earth Sci. Rev. 1991, 30, 175–319. [Google Scholar] [CrossRef]
  16. Hop, H.; Pearson, T.; Hegseth, E.N.; Kovacs, K.M.; Wiencke, C.; Kwasniewski, S.; Eiane, K.; Mehlum, F.; Gulliksen, B.; Wlodarska-Kowalczuk, M.; et al. The marine ecosystem of Kongsfjorden, Svalbard. Polar Res. 2002, 21, 167–208. [Google Scholar] [CrossRef]
  17. Payne, C.M.; Roesler, C. Characterizing the influence of Atlantic water intrusion on water mass formation and phytoplankton distribution in Kongsfjorden, Svalbard. Cont. Shelf Res. 2019, 191, 104005. [Google Scholar] [CrossRef]
  18. Svendsen, H.; Beszczynska-Møller, A.; Hagen, J.O.; Lefauconnier, B.; Tverberg, V.; Gerland, S.; Ørbæk, J.B.; Bischof, K.; Papucci, C.; Zajaczkowski, M.; et al. The physical environment of Kongsfjorden-Krossfjorden, an Arctic fjord system in Svalbard. Polar Res. 2002, 21, 133–166. [Google Scholar]
  19. Stempniewicz, L.; Błachowiak-Samołyk, K.; Węsławski, J.M. Impact of climate change on zooplankton communities, seabird populations and arctic terrestrial ecosystem—A scenario. Deep Sea Res. Part II 2007, 54, 2934–2945. [Google Scholar] [CrossRef]
  20. Iversen, K.R.; Seuthe, L. Seasonal microbial processes in a high-latitude fjord (Kongsfjorden, Svalbard): I. Heterotrophic bacteria, picoplankton and nanoflagellates. Polar Biol. 2011, 34, 731–749. [Google Scholar] [CrossRef] [Green Version]
  21. Eilertsen, H.C.; Taasen, J.P.; Weslawski, J.M. Phytoplankton studies in the fjords of West Spitzbergen: Physical environment and production in spring and summer. J. Plankton Res. 1989, 11, 1245–1260. [Google Scholar] [CrossRef] [Green Version]
  22. Richardson, A.J.; Schoeman, D.S. Climate impact on plankton ecosystems in the Northeast Atlantic. Science 2004, 305, 1609–1612. [Google Scholar] [CrossRef] [PubMed]
  23. Trudnowska, E.; Basedow, S.L.; Blachowiak-Samolyk, K. Mid-summer mesozooplankton biomass, its size distribution, and estimated production within a glacial Arctic fjord (Hornsund, Svalbard). J. Mar. Syst. 2014, 137, 55–66. [Google Scholar] [CrossRef] [Green Version]
  24. Stroeve, J.; Markus, T.; Meier, W.N.; Miller, J. Recent changes in the Arctic melt season. Ann. Glaciol. 2006, 44, 367–374. [Google Scholar] [CrossRef] [Green Version]
  25. Serreze, M.C.; Holland, M.M.; Stroeve, J. Perspectives on the Arctic’s Shrinking Sea-Ice Cover. Science 2007, 315, 1533–1536. [Google Scholar] [CrossRef] [PubMed] [Green Version]
  26. Wang, G.Z.; Guo, C.Y.; Luo, W.; Cai, M.H.; He, J.F. The distribution of picoplankton and nanoplankton in Kongsfjorden, Svalbard during late summer 2006. Polar Biol. 2009, 32, 1233–1238. [Google Scholar] [CrossRef] [Green Version]
  27. Sinha, R.K.; Krishnan, K.P.; Hatha, A.A.M.; Rahiman, M.; Thresyamma, D.D.; Kerkar, S. Diversity of retrievable heterotrophic bacteria in Kongsfjorden, an Arctic fjord. Environ. Microbiol. 2017, 48, 51–61. [Google Scholar] [CrossRef] [Green Version]
  28. Piwosz, K.; Walkusz, W.; Hapter, R.; Wieczorek, P.; Hop, H.; Wiktor, J. Comparison of productivity and phytoplankton in a warm (Kongsfjorden) and a cold (Hornsund) Spitsbergen fjord in mid-summer 2002. Polar Biol. 2009, 32, 549–559. [Google Scholar] [CrossRef]
  29. Poole, H.H.; Atkins, W.R.G. Photo-electric measurements of submarine illumination throughout the year. J. Mar. Biol. Assoc. UK 1929, 16, 297–324. [Google Scholar] [CrossRef] [Green Version]
  30. Parsons, T.R.; Maita, Y.; Lalli, C.M. A Manual of Chemical and Biological Methods for Seawater Analysis; Pergamon Press: Oxford, UK, 1984; 173p. [Google Scholar]
  31. Bérard-Therriault, L.; Poulin, M.; Bossé, L. Guide D’identification du Phytoplancton Marin de L’estuaire et du Golfe du Saint-Laurent Incluantégalement Certains Protozoaires; Conseil National de Researches du Canada: Ottawa, ON, Canada, 1999.
  32. Booth, B.C. Estimating cell concentration and biomass of autotrophic plankton using microscopy. In Handbook of Methods in Aquatic Microbial Ecology; Kemp, P.F., Sherr, B.F., Sherr, E.B., Cole, J.J., Eds.; Lewis Publishers: Boca Raton, FL, USA, 1993; pp. 199–205. [Google Scholar]
  33. Tomas, C.R. Identifying Marine Phytoplankton; Academic Press: San Diego, CA, USA, 1997. [Google Scholar]
  34. Kang, S.H.; Fryxell, G.A.; Roelke, D.L. Fragilariopsis cylindrus compared with other species of the diatom family Bacillariaceae in Antarctic marginal ice-edge zones. Nova Hedwig. Beih. 1993, 106, 335–352. [Google Scholar]
  35. Garneau, M.-È.; Gosseling, M.; Klein, B.; Tremblay, J.-È.; Fouilland, E. New and regenerated production during a late summer bloom in an Arctic polynya. Mar. Ecol. Prog. Ser. 2007, 345, 13–26. [Google Scholar] [CrossRef]
  36. Dugdale, R.C.; Wilkerson, F.P. The use of 15N to measure nitrogen uptake in eutrophic ocean; experimental considerations. Limnol. Oceanogr. 1986, 31, 637–689. [Google Scholar] [CrossRef]
  37. Hama, T.; Miyazaki, T.; Ogawa, Y.; Iwakuma, T.; Takahashi, M. Measurement of Photosynthetic Production of a Marine Phytoplankton Population Using a STable 13C Isotope. Mar. Biol. 1983, 73, 31–36. [Google Scholar] [CrossRef]
  38. Hodal, H.; Kristiansen, S. The importance of small-called phytoplankton in spring blooms at the marginal ice zone in the northern Barents Sea. Deep Sea Res. Part II 2008, 55, 2176–2185. [Google Scholar] [CrossRef] [Green Version]
  39. McCarthy, J.J.; Taylor, W.R.; Taft, J.L. Nitrogenous nutrition of the plankton in the Chesapeake Bay. I. Nutrient availability and phytoplankton preferences. Limnol. Oceanogr. 1977, 22, 996–1011. [Google Scholar] [CrossRef]
  40. Gu, B.; Alexander, V. Dissolved nitrogen uptake by a Cyanobacterial bloom (Anabaena flos-aquae) in a subarctic lake. J. Appl. Environ. Microbiol. 1993, 59, 422–430. [Google Scholar] [CrossRef] [PubMed] [Green Version]
  41. Hodal, H.; Falk-Petersen, S.; Hop, H.; Kristiansen, S.; Reigstad, M. Spring bloom dynamics in Kongsfjorden, Svalbard: Nutrients, phytoplankton, protozoans and primary production. Polar Biol. 2012, 35, 191–203. [Google Scholar] [CrossRef] [Green Version]
  42. Hegseth, E.N.; Tverberg, V. Effect of Atlantic water inflow on timing of the phytoplankton spring bloom in a high Arctic fjord (Kongsfjorden, Svalbard). J. Mar. Syst. 2013, 113–114, 94–105. [Google Scholar] [CrossRef]
  43. von Quillfeldt, C.H. Common Diatom Species in Arctic Spring Blooms: Their Distribution and Abundance. Bot. Mar. 2000, 43, 499–516. [Google Scholar] [CrossRef]
  44. Piquet, A.M.-T.; van de Poll, W.H.; Visser, R.J.W.; Wiencke, C.; Bolhuis, H.; Buma, A.G.J. Springtime phytoplankton dynamics in Arctic Krossfjorden and Kongsfjorden (Spitsbergen) as a function of glacier proximity. Biogeosciences 2014, 11, 2263–2279. [Google Scholar] [CrossRef] [Green Version]
  45. Redifield, A.C. The biological control of chemical factors in the environment. Am. Sci. 1958, 46, 205–221. [Google Scholar]
  46. Thingstad, T.F.; Sakshaug, E. Control of phytoplankton growth in nutrient recycling ecosystems. Theory and Terminology. Mar. Ecol. Prog. Ser. 1990, 63, 261–272. [Google Scholar] [CrossRef]
  47. van De Poll, W.H.; Maat, D.S.; Fischer, P.; Rozema, P.D.; Daly, O.B.; Koppelle, S.; Visser, R.J.W.; Buma, A.G.J. Atlantic advection driven changes in glacial meltwater: Effects on phytoplankton chlorophyll a and taxonomic composition in Kongsfjorden, Spitsbergen. Front. Mar. Sci. 2016, 3, 200. [Google Scholar] [CrossRef] [Green Version]
  48. Probyn, T.A. Nitrogen uptake by size-fractionated phytoplankton populations in the southern Benguela upwelling system. Mar. Ecol. Prog. Ser. 1985, 22, 249–258. [Google Scholar] [CrossRef]
  49. Koike, I.; Holm-Hansen, O.; Biggs, D.C. Inorganic nitrogen metabolism by Antarctic phytoplankton with special reference to ammonium cycling. Mar. Ecol. Prog. Ser. 1986, 30, 105–116. [Google Scholar] [CrossRef]
  50. Dugdale, R.C.; Wilkerson, F.P.; Hogue, V.E.; Marchi, A. The role of ammonium and nitrate in spring bloom development in San Francisco Bay. Estuar. Coast. Shelf Sci. 2007, 73, 17–29. [Google Scholar] [CrossRef]
  51. Keck, A.; Wiktor, J.; Hapter, R.; Nilsen, R. Phytoplankton assemblages related to physical gradients in an arctic, glacier-fed fjord in summer. ICES J. Mar. Sci. 1999, 56, 203–214. [Google Scholar] [CrossRef]
  52. Hop, H.; Falk-Petersen, S.; Svendsen, H.; Kwasniewski, S.; Pavlov, V.; Pavlova, O.; Søreide, J.E. Physical and biological characteristics of the pelagic system across Fram Strait to Kongsfjorden. Prog. Oceanogr. 2006, 71, 182–231. [Google Scholar] [CrossRef]
  53. Van de Poll, W.H.; Kulk, G.; Rozema, P.D.; Brussaard, C.P.D.; Visser, R.J.W.; Buma, A.G.J. Contrasting glacial meltwater effects on post-bloom phytoplankton on temporal and spatial scales in Kongsfjorden, Spitsbergen. Elem. Sci. Anthr. 2018, 6, 50. [Google Scholar] [CrossRef]
  54. Raven, J.A. The twelfth Tansley Lecture. Small is beautiful: The picophytoplankton. Funct. Ecol. 1998, 12, 503–513. [Google Scholar] [CrossRef]
  55. Callieri, C. Picophytoplankton in freshwater ecosystems: The importance of small-sized phototrophs. Freshw. Rev. 2008, 1, 1–28. [Google Scholar] [CrossRef]
  56. Finkel, Z.V.; Beardall, J.; Flynn, K.J.; Quigg, A.; Rees, T.A.V.; Raven, J.A. Phytoplankton in a changing world: Cell size and elemental stoichiometry. J. Plankton Res. 2010, 32, 119–137. [Google Scholar] [CrossRef] [Green Version]
  57. Lourey, M.J.; Thompson, P.A.; McLaughlin, M.J.; Bonham, P.; Feng, M. Primary production and phytoplankton community structure during a winter shelf-scale phytoplankton bloom off Western Australia. Mar. Biol. 2013, 160, 335–369. [Google Scholar] [CrossRef]
  58. Huot, Y.; Babin, M.; Bruyant, F.; Grob, C.; Twardowski, M.; Claustre, H. Relationship between photosynthetic parameters and different proxies of phytoplankton biomass in the subtropical ocean. Biogeosciences 2017, 4, 853–868. [Google Scholar] [CrossRef] [Green Version]
  59. Lee, S.H.; Kim, B.K.; Yun, M.S.; Joo, H.; Yang, E.J.; Kim, Y.N.; Shin, H.C.; Lee, S. Spatial distribution of phytoplankton productivity in the Amundsen Sea, Antarctica. Polar Biol. 2012, 35, 1721–1733. [Google Scholar] [CrossRef]
  60. Gaard, E.; Norði, Á.G.; Simonsen, K. Environmental effects on phytoplankton production in a Northeast Atlantic fjord, Faroe Islands. J. Plankton Res. 2011, 33, 947–959. [Google Scholar] [CrossRef]
  61. Lee, S.H.; Whitledge, T.E. Primary and new production in the deep Canada Basin during summer 2002. Polar Biol. 2005, 28, 190–197. [Google Scholar] [CrossRef]
  62. Lee, S.H.; Whitledge, T.E.; Kang, S.-H. Recent carbon and nitrogen uptake rates of phytoplankton in Bering Strait and the Chukchi Sea. Cont. Shelf Res. 2007, 27, 2231–2249. [Google Scholar] [CrossRef]
  63. Yun, M.S.; Chung, K.H.; Zimmermann, S.; Zhao, J.; Joo, H.M.; Lee, S.H. Phytoplankton productivity and its response to higher light levels in the Canada Basin. Polar Biol. 2012, 35, 257–268. [Google Scholar] [CrossRef]
  64. Lee, S.H.; Lee, J.H.; Lee, H.; Kang, J.J.; Lee, J.H.; Lee, D.; An, S.H.; Stockwell, D.A.; Whitledge, T.E. Field-obtained carbon and nitrogen uptake rates of phytoplankton in the Laptev and East Siberian seas. Biogeosci. Discuss. 2017, 1–32. [Google Scholar] [CrossRef] [Green Version]
  65. Harrison, W.G.; Cota, G.F. Primary production in polar waters: Relation to nutrient availability. Polar Res. 1991, 10, 87–104. [Google Scholar] [CrossRef]
  66. Willis, K.J.; Cottier, F.R.; Kwasniewski, S. Impact of warm water advection on the winter zooplankton community in an Arctic fjord. Polar Biol. 2008, 31, 475–481. [Google Scholar] [CrossRef]
  67. Walkusz, W.; Kwasniewski, S.; Falk-Petersen, S.; Hop, H.; Tverberg, V.; Wieczorek, P.; Weslawski, J.M. Seasonal and spatial changes in zooplankton composition in the glacially influenced Kongsfjorden, Svalbard. Polar Res. 2009, 28, 254–281. [Google Scholar] [CrossRef]
  68. Halbach, L.; Vihtakari, M.; Duarte, P.; Everett, A.; Granskog, M.A.; Hop, H.; Kauko, H.M.; Kristiansen, S.; Myhre, P.I.; Pavlov, A.K.; et al. Tidewater Glaciers and Bedrock Characteristics Control the Phytoplankton Growth Environment in a Fjord in the Arctic. Front. Mar. Sci. 2019, 6, 254. [Google Scholar] [CrossRef]
  69. Partensky, F.; Garczarek, L. Prochlorococcus: Advantages and limits of minimalism. Annu. Rev. Mar. Sci. 2010, 2, 305–331. [Google Scholar] [CrossRef] [Green Version]
  70. Poulton, A.J.; Holligan, P.M.; Hickman, A.; Kim, Y.-N.; Adey, T.R.; Stinchcombe, M.C.; Holeton, C.; Root, S.; Woodward, E.M.S. Phytoplankton carbon fixation, chlorophyll-biomass and diagnostic pigments in the Atlantic Ocean. Deep Sea Res. Part II 2006, 53, 1593–1610. [Google Scholar] [CrossRef]
  71. Bhavya, P.S.; Lee, J.H.; Lee, H.W.; Kang, J.J.; Lee, J.H.; Lee, D.; An, S.H.; Stockwell, D.A.; Whitledge, T.E.; Lee, S.H. First in situ estimations of small phytoplankton carbon and nitrogen uptake rates in the Kara, Laptev, and East Siberian seas. Biogeosciences 2018, 15, 5503–5517. [Google Scholar] [CrossRef] [Green Version]
  72. Tremblay, G.; Belzile, C.; Gosselin, M.; Poulin, M.; Roy, S.; Tremblay, J.-É. Late summer phytoplankton distribution along a 3500 km transect in Canadian Arctic waters: Strong numerical dominance by picoeukaryotes. Aquat. Microb. Ecol. 2009, 54, 55–70. [Google Scholar] [CrossRef] [Green Version]
  73. Ardyna, M.; Gosselin, M.; Michel, C.; Poulin, M.; Tremblay, J.-É. Environmental forcing of phytoplankton community structure and function in the Canadian High Arctic: Contrasting oligotrophic and eutrophic regions. Mar. Ecol. 2011, 442, 37–57. [Google Scholar] [CrossRef] [Green Version]
  74. Metfies, K.; von Appen, W.-J.; Kilias, E.; Nicolaus, A.; Nöthig, E.-M. Biogeography and Photosynthetic Biomass of Arctic Marine Pico-Eukaroytes during Summer of the Record Sea Ice Minimum 2012. PLoS ONE 2016, 11, e0148512. [Google Scholar] [CrossRef] [Green Version]
  75. Yun, M.S.; Kim, B.K.; Joo, H.T.; Yang, E.J.; Nishino, S.; Chung, K.H.; Kang, S.-H.; Lee, S.H. Regional productivity of phytoplankton in the Western Arctic Ocean during summer in 2010. Deep Sea Res. Part II 2015, 120, 61–71. [Google Scholar] [CrossRef]
  76. Tremblay, J.-É.; Legendre, L.; Klein, B.; Therriault, J.-C. Size-differential uptake of nitrogen and carbon in a marginal sea (Gulf of St. Lawrence, Canada): Significance of diel periodicity and urea uptake. Deep Sea Res. Part II 2000, 47, 489–518. [Google Scholar] [CrossRef]
  77. Goeyens, L.; Tréguer, P.; Baumann, M.E.M.; Baeyens, W.; Dehairs, F. The leading role of ammonium in the nitrogen uptake regime of Southern Ocean marginal ice zones. J. Mar. Syst. 1995, 6, 345–361. [Google Scholar] [CrossRef]
  78. Xu, J.; Glibert, P.M.; Liu, H.; Yin, K.; Yuan, X.; Chen, M.; Harrision, P. Nitrogen sources and rates of phytoplankton uptake in different regions of Hong Kong Waters in summer. Estuar. Coast. 2012, 35, 559–571. [Google Scholar] [CrossRef]
  79. Kim, B.K.; Joo, H.T.; Song, H.J.; Yang, E.J.; Lee, S.H.; Hahm, D.; Rhee, T.S.; Lee, S.H. Large seasonal variation in phytoplankton production in the Amundsen Sea. Polar Biol. 2015, 38, 319–331. [Google Scholar] [CrossRef]
  80. MacIsaac, J.J.; Dugdale, R.C. The kinetics of nitrate and ammonia uptake by natural populations of marine phytoplankton. Deep Sea Res. 1969, 16, 45–57. [Google Scholar] [CrossRef]
  81. Paasche, E.; Kristiansen, S. Nitrogen nutrition of the phytoplankton in the Oslofjord. Estuar. Coast. Shelf Sci. 1982, 14, 237–249. [Google Scholar] [CrossRef]
  82. Dortch, Q. The interaction between ammonium and nitrate uptake in phytoplankton. Mar. Ecol. Prog. Ser. 1990, 61, 183–201. [Google Scholar] [CrossRef]
  83. Cochlan, W.P.; Harrison, P.J. Uptake of nitrate, ammonium, and urea by nitrogen-starved cultures of Micromonas pusilla (Prasinophyceae): Transient responses. J. Phycol. 1991, 27, 673–679. [Google Scholar] [CrossRef]
  84. L’Helguen, S.; Maguer, J.-F.; Caradec, J. Inhibition kinetics of nitrate uptake by ammonium in size-fractionated oceanic phytoplankton communities: Implications for new production and f-ratio estimates. J. Plankton Res. 2008, 30, 1179–1188. [Google Scholar] [CrossRef]
  85. Wada, E.; Terazaki, M.; Kabaya, Y.; Nemoto, T. 15N and 13C abundances in the Antarctic Ocean with emphasis on the biogeochemical structure of the food web. Deep Sea Res. Part A 1987, 34, 829–841. [Google Scholar] [CrossRef]
  86. Corbisier, T.N.; Petti, M.A.V.; Skowronski, R.S.P.; Brito, T.A.S. Trophic relationships in the nearshore zone of Martel Inlet (King George Island, Antarctica): δ13C stable-isotope analysis. Polar Biol. 2004, 27, 75–82. [Google Scholar] [CrossRef]
  87. Kim, B.K.; Lee, J.H.; Joo, H.T.; Song, H.J.; Yang, E.J.; Lee, S.H.; Lee, S.H. Macromolecular compositions of phytoplankton in the Amundsen Sea, Antarctica. Deep Sea Res. Part II 2016, 123, 42–49. [Google Scholar] [CrossRef]
  88. Baumann, M.E.M.; Lancelot, C.; Brandini, F.P.; Sakshaug, E.; John, D.M. The taxonomic identity of the cosmopolitan prymnesiophyte Phaeocystis: A morphological and ecophysiological approach. J. Mar. Syst. 1994, 5, 5–22. [Google Scholar] [CrossRef]
  89. Kendall, C.; Silva, S.R.; Kelly, V.J. Carbon and nitrogen isotopic compositions of particulate organic matter in four large river systems across the United States. Hydrol. Process. 2001, 15, 1301–1346. [Google Scholar] [CrossRef]
  90. Schoemann, V.; Becquevort, S.; Stefels, J.; Rousseau, V.; Lancelot, C. Phaeocystis blooms in the global ocean and their controlling mechanisms: A review. J. Sea Res. 2005, 53, 43–66. [Google Scholar] [CrossRef]
  91. Fouilland, E.; Gosselin, M.; Rivkin, R.B.; Vasseur, C.; Mostajir, B. Nitrogen uptake by heterotrophic bacteria and phytoplankton in Arctic surface waters. J. Plankton Res. 2007, 29, 369–376. [Google Scholar] [CrossRef] [Green Version]
  92. Kirchman, D.L.; Ducklow, H.W.; McCarthy, J.J.; Garside, C. Biomass and nitrogen uptake by heterotrophic bacteria during the spring phytoplankton bloom in the North Atlantic Ocean. Deep Sea Res. Part I 1994, 41, 879–895. [Google Scholar] [CrossRef]
Figure 1. (A) Sampling stations in Kongsfjorden. The blue dots indicate productivity stations. Surface distribution of (B) water temperature (°C), (C) chlorophyll a (chl-a) (mg·m−3), and (D) turbidity (FTU) in Kongsfjorden (Ocean Data View (ODV) version 5.1.0) (AWI, Bremerhaven, Germany, Schlitzer, R.).
Water 12 02903 g001
Figure 2. Vertical patterns of phosphate (µM), nitrite + nitrate (µM), ammonium (µM), and silicate (µM) concentrations from the surface to the 100-m water depth at sampling stations.
Water 12 02903 g002
Figure 3. The distribution of chl-a concentrations (mg chl-a m−2) integrated from the surface to 1% light depth at productivity stations.
Water 12 02903 g003
Figure 4. Relative abundance and biovolume of the phytoplankton taxa.
Water 12 02903 g004
Figure 5. The vertical pattern of (A) absolute and (B) specific carbon uptake rates for total and picophytoplankton at each light depth (100, 50, 30, 12, 5, and 1% light depth).
Water 12 02903 g005
Figure 6. Hourly carbon, nitrate and ammonium uptake rates of phytoplankton integrated from the surface to 1% light depth at the productivity stations.
Water 12 02903 g006
Figure 7. The vertical pattern of (A) absolute and (B) specific nitrogen (nitrate and ammonium) uptake rates for total and picophytoplankton at each light depth (100, 50, 30, 12, 5, and 1% light depth).
Water 12 02903 g007
Figure 8. The relative preference index (RPI) and turnover time (TT; day) for picophytoplankton. An RPI > 1 indicates positive nutrient selection for phytoplankton nitrogen uptake.
Water 12 02903 g008
Table 1. Sample location with corresponding sampling depth for nutrient, chl-a, andphytoplankton taxonomy samples in Kongsfjorden in 2017.
StationLatitude (°N)Longitude (°E)Date (Day, Month Year)Bottom Depth (m)Euphotic Depth (m)Sampling Depth (m)Zone
St. 178.9112.394 May 201763-0, 10, 30, 50Inner
St. 278.9312.394 May 201747-0, 10, 20, 40Inner
St. 378.9812.327 May 201755160, 4, 16, 40Inner
St. 478.9612.227 May 201714-0, 5, 10Transition
St. 578.9312.154 May 2017110220, 6, 22, 80Transition
St. 67912.027 May 201763-0, 10, 20, 50Transition
St. 778.9611.927 May 2017357270, 7, 27, 80Middle
St. 878.9811.918 May 2017226-0, 10, 40, 100Middle
St. 979.0311.758 May 2017211270, 7, 27, 50, 100Middle
St. 1078.9911.658 May 2017287190, 5, 19, 50, 100Middle
Table 2. The relative contribution of chl-a in the different size fractions from surface to 100-m depth.
StationDepth (m)Microphytoplankton (%)Nanophytoplankton (%)Picophytoplankton (%)
St. 1038.137.624.2
1054.026.020.0
3071.613.514.9
5080.011.28.8
St. 209.753.536.8
1048.321.330.3
2079.25.715.1
4073.812.713.5
St. 3038.235.426.4
452.728.618.8
1661.121.917.0
4057.038.74.3
St. 4064.119.316.6
575.510.813.7
1073.614.811.6
St. 5078.86.514.7
682.17.310.6
2281.55.413.1
8057.89.832.4
St. 6029.548.821.7
1055.137.07.9
2071.59.918.6
5053.124.222.7
St. 7080.17.812.1
768.19.522.4
2769.67.123.3
8052.711.236.0
St. 8086.54.49.1
1057.09.633.4
4047.310.342.3
10060.513.026.5
St. 9081.44.214.5
761.19.529.4
2775.16.218.7
5074.47.518.1
10074.36.519.2
St. 10066.611.222.2
568.610.520.9
1956.313.530.3
5053.813.332.9
10075.97.716.4
Table 3. Pearson’s correlation analysis of specific and absolute total carbon and nitrogen uptake rates (n = 15). Significant correlations are indicated as follow: * p < 0.05, ** p < 0.01.
TemperaturePhosphateNitrite + NitrateSilicateAmmoniumSpecific CarbonAbsolute CarbonSpecific NitrateAbsolute NitrateSpecific AmmoniumAbsolute Ammonium
Temperature1
Phosphate0.868 **1
Nitrite + Nitrate0.797 **0.974 **1
Silicate0.795 **0.706 **0.598 *1
Ammonium−0.664 **−0.630 *−0.503−0.651 **1
Specific Carbon0.2000.1400.1400.353−0.1301
Absolute Carbon0.1650.1010.1020.326−0.1090.998 **1
Specific Nitrate0.2320.1160.1610.248−0.1870.567 *0.566 *1
Absolute Nitrate0.2340.0690.1020.272−0.2090.525 *0.531 *0.979 **1
Specific Ammonium−0.698 **−0.716 **−0.621 *−0.4690.795 **0.1830.2070.0260.0261
Absolute Ammonium−0.732 **−0.784 **−0.701 **−0.5010.768 **0.1410.1670.0060.0150.987 **1
Table 4. Investigations of daily carbon uptake rate in Kongsfjorden.
Sampling PeriodDaily Carbon Uptake Rate (g C m−2 day−1)ReferenceRemarks
July 19790.128Eilertsen et al. [21]Daily mean production rate 76% of noon; calculated by Hop et al. [16]
July 19800.024
July 19960.8–1.4Hop et al. [16] and references thereinNight production 32% of daytime production; calculated by Hop et al. [16]
1–22 May 20020.466Hodal et al. [41]Integrated to 30 m
23–27 July 20020.088Piwosz et al. [28]Integrated to 30 m, daily production was calculated based on 24 h
18 March 20060.004Iversen and Seuthe [20]Integrated to 50 m
25 April 20060.405
30 May 20060.445
4 July 20060.155
16 September 20060.080
Jun 20150.528van De Poll et al. [53]Integrated to euphotic zone (defined as the depth interval down to 0.1% irradiance)
4–8 May 20170.733This studyIntegrated to 1% light depth
Publisher’s Note: MDPI stays neutral with regard to jurisdictional claims in published maps and institutional affiliations.

