Article

Temporal and Spatial Variations of the Biochemical Composition of Phytoplankton and Potential Food Material (FM) in Jaran Bay, South Korea

1
South Sea Fisheries Research Institute, National Institute of Fisheries Science, Yeosu-si 59780, Korea
2
Marine Environment Research Division, National Institute of Fisheries Science, Busan 46083, Korea
3
Department of Oceanography, Pusan National University, Busan 46241, Korea
4
Marine Disaster Research Center, KIOST, Busan 49111, Korea
*
Author to whom correspondence should be addressed.
Water 2020, 12(11), 3093; https://doi.org/10.3390/w12113093
Submission received: 22 September 2020 / Revised: 29 October 2020 / Accepted: 30 October 2020 / Published: 4 November 2020
(This article belongs to the Special Issue Marine Nitrogen Fixation and Phytoplankton Ecology)

Abstract

:
Food material (FM) derived from biochemical components (e.g., proteins, lipids, and carbohydrates) of phytoplankton can provide important quantitative and qualitative information of the food available to filter-feeding animals. The main objective of this study was to observe the seasonal and spatial variations of the biochemical compositions of phytoplankton and to identify the major controlling factors of FM as a primary food source in Jaran Bay, a large shellfish aquaculture site in South Korea. Based on monthly sampling conducted during 2016, significant monthly variations in the depth-integrated concentrations of major inorganic nutrients and chlorophyll a within the euphotic water column and a predominance (49.9 ± 18.7%) of micro-sized phytoplankton (>20 μm) were observed in Jaran Bay. Carbohydrates were the dominant biochemical component (51.8 ± 8.7%), followed by lipids (27.3 ± 3.8%) and proteins (20.9 ± 7.4%), during the study period. The biochemical compositions and average monthly FM levels (411.7 ± 93.0 mg m−3) in Jaran Bay were not consistent among different bays in the southern coastal region of South Korea, possibly due to differences in controlling factors, such as environmental and biological factors. According to the results from multiple linear regression, the variations in FM could be explained by the relatively large phytoplankton and the P* (PO43− − 1/16 × NO3) and NH4+ concentrations in Jaran Bay. The macromolecular compositions and FM, as alternatives food source materials, should be monitored in Jaran Bay due to recent changes in nutrient concentrations and phytoplankton communities.

1. Introduction

Bays are important aquatic systems that provide food resources for fisheries and aquaculture since they provide habitats and prey for various marine organisms. Recently, mollusk farming, including bivalves, has contributed greatly to global farming production [1]. The present study site, Jaran Bay, is one of the largest shellfish aquaculture regions for oysters and scallops in South Korea [2], and these filter-feeding oysters and scallops feed mainly on water-dwelling phytoplankton for their growth and reproduction [3,4].
The growth and physiological conditions of phytoplankton can vary depending on environmental conditions [5,6,7]. In particular, phytoplankton synthesize biochemical components through photosynthesis and are therefore highly dependent on light conditions and quality [8,9,10], temperature [11], species composition [12,13] and nutrient availability [5,8,14]. Recently, Lee et al. [5] reported that dissolved inorganic nitrogen loading from river discharge is a major factor that controls the photosynthetic biochemical compositions (e.g., carbohydrates, proteins and lipids) of phytoplankton in Gwangyang Bay. Moreover, the community structure and, consequently, biochemical composition of phytoplankton can be altered by differences in nutrient inputs due to river discharge [7]. Differences in the biochemical compositions of phytoplankton can lead to differences in nutritional qualities for potential consumers [5,15,16,17]. Therefore, the biochemical compositions of phytoplankton, as natural food resources, are very important for phytoplankton-grazing herbivores. In agreement with this finding, Yun et al. [16] reported a strong positive relationship between the lipid composition in phytoplankton and protein content in the mesozooplankton community in the northern Chukchi Sea, indicating that a high lipid content in phytoplankton can be important for protein synthesis for zooplankton growth.
Food material (FM) is represented as the sum of the concentrations of proteins, lipids and carbohydrates [18,19]. FM indicates the quantity of food that is available to potential consumers [19] and is also used as a food index of food quality [20]. Seasonal and spatial variations in the quantity and quality of the natural diet available to filter feeders could be important for their grazing characteristics [20]. Navarro and Thompson [20] observed that the seasonal trends in FM dynamics are closely correlated with the trends of the chlorophyll a concentration in Logy Bay, southeast Newfoundland, Canada. Recently, Kang et al. [21] found that small-sized cells of phytoplankton could assimilate higher amounts of FM per unit of chlorophyll a concentration compared to large-sized cells of phytoplankton in the East/Japan Sea based on size fractionation filtering methods. Similar results from Gwangyang Bay, Korea, were also in agreement with this consistent observation [7].
Previously, most biochemical composition studies have been conducted once a year or, at most, seasonally [5,7,21]. Considering the importance of phytoplankton as a primary food source for filter-feeding aquaculture animals, the present study aimed to observe monthly and spatial variations in biochemical compositions as a food quality indicator of phytoplankton and to determine the major environmental controlling factors of FM available to shellfish, such as oysters and scallops, growing in Jaran Bay as a large aquaculture site in South Korea.

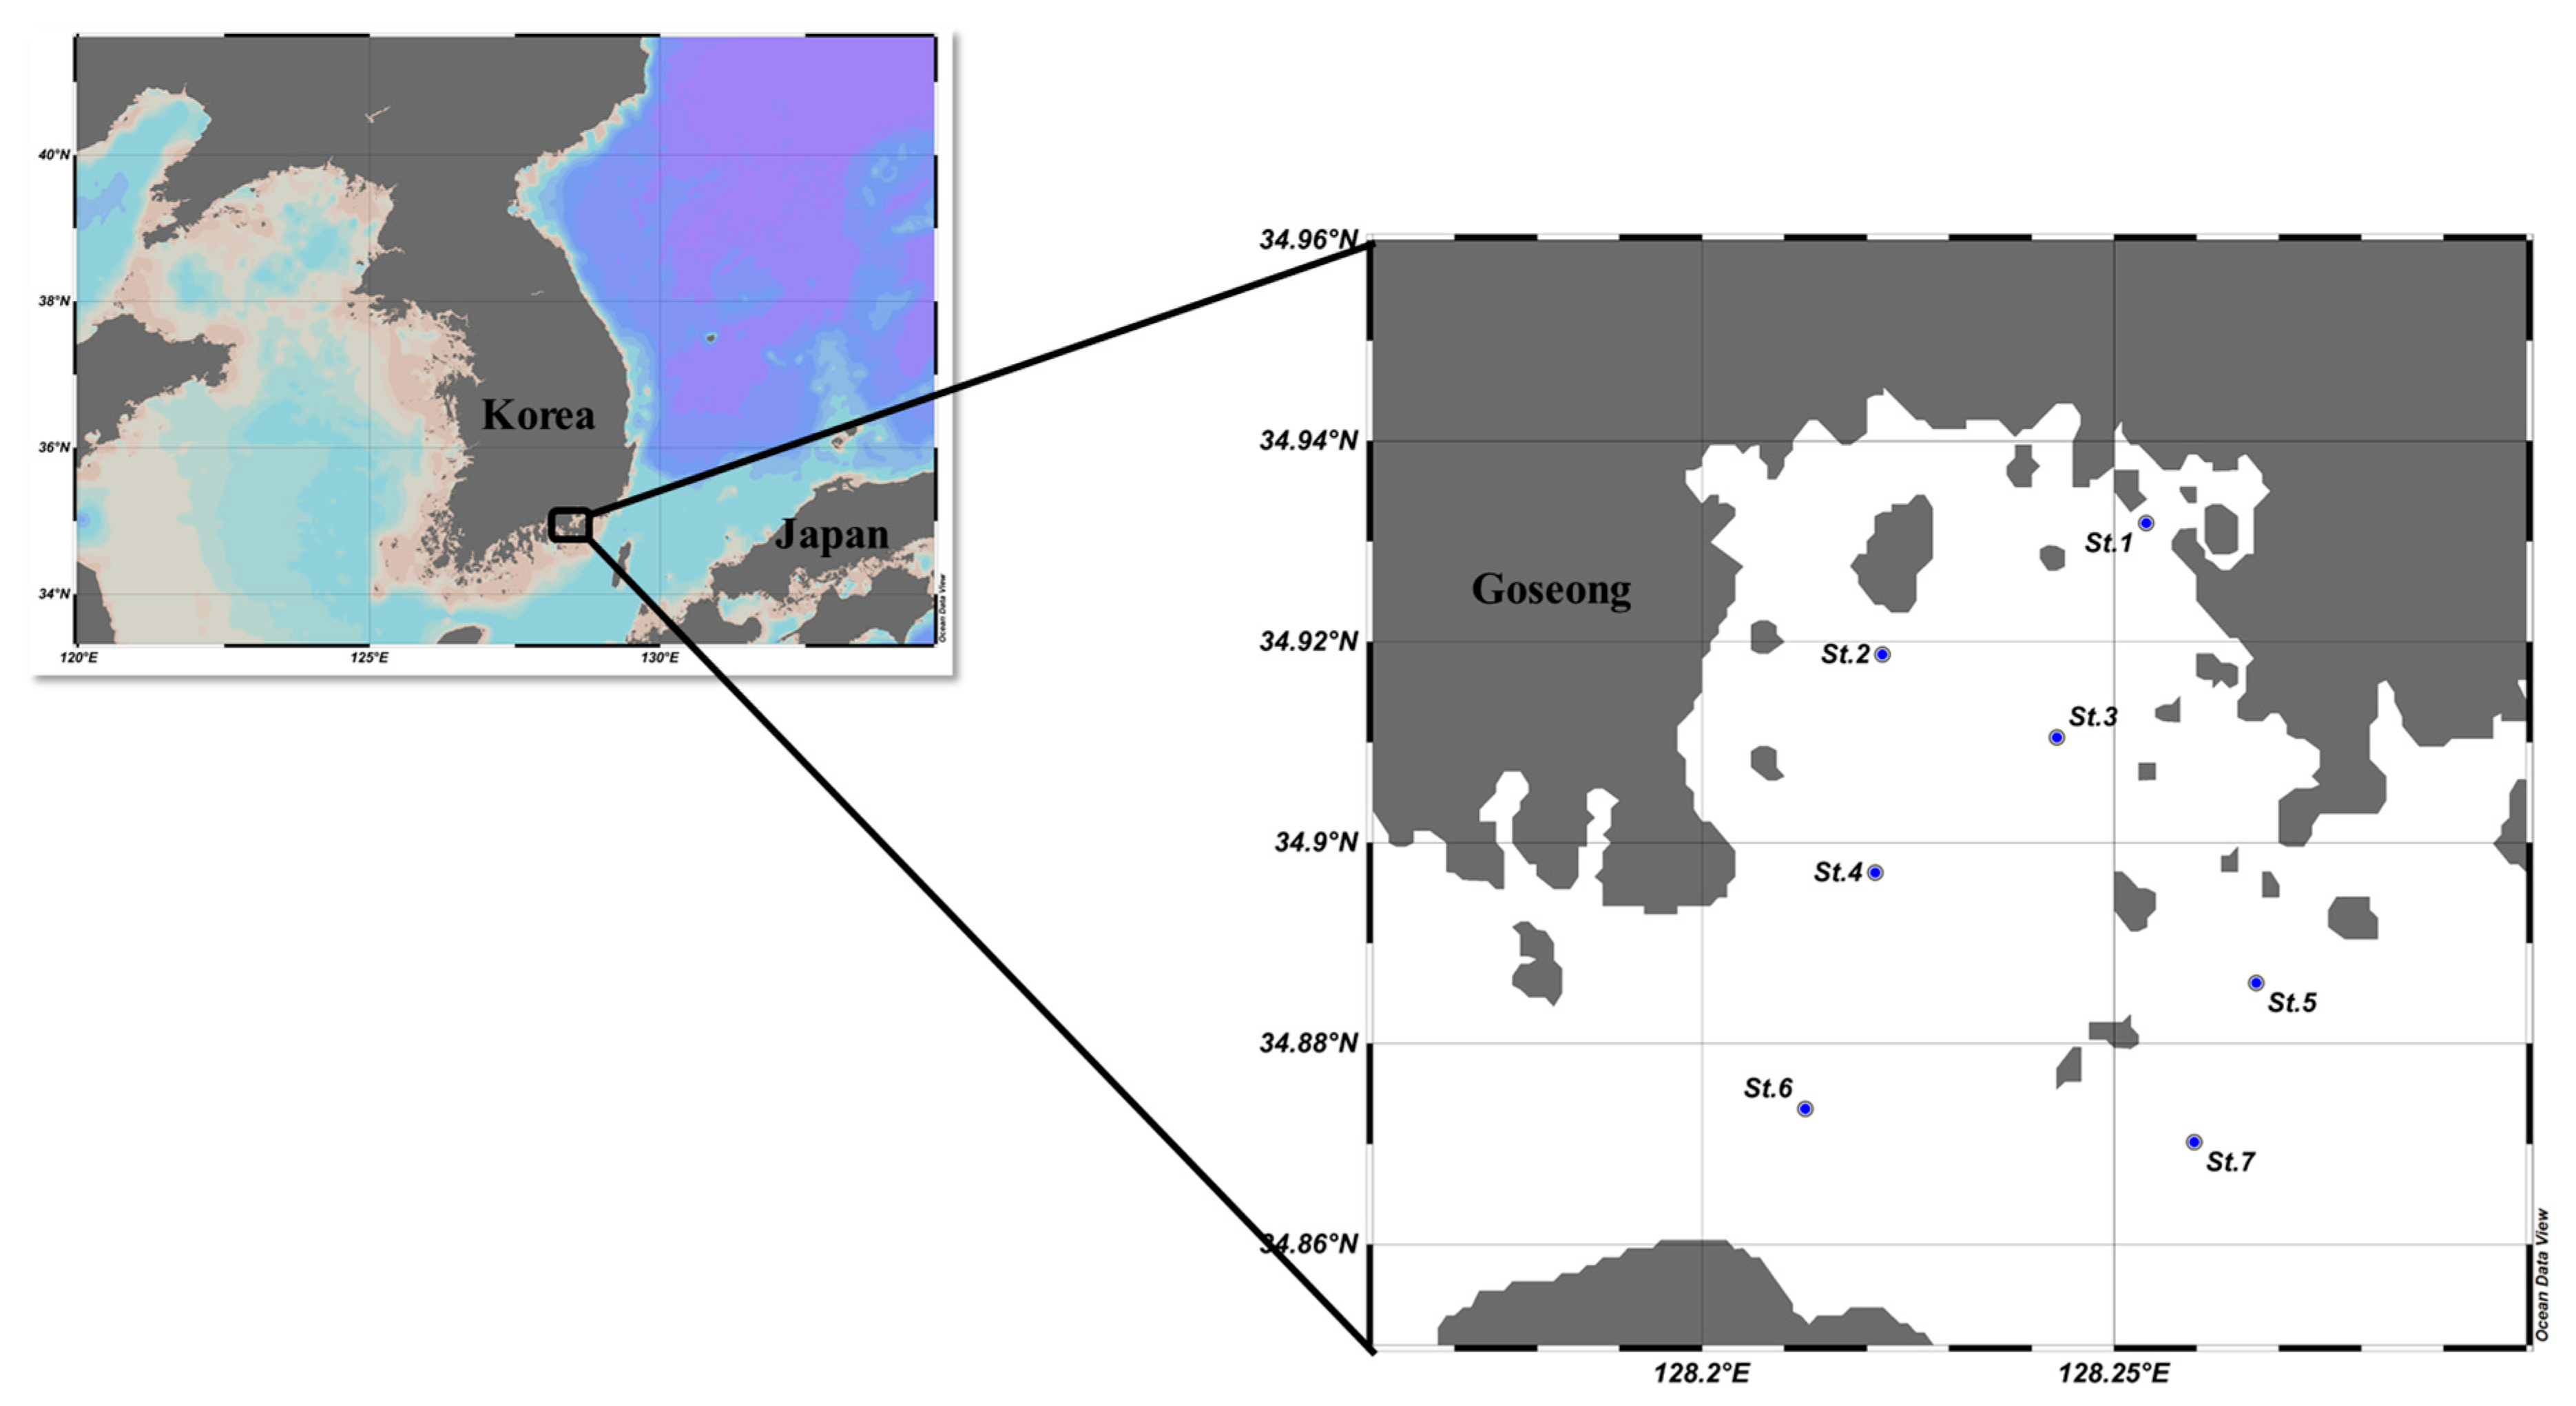
2. Materials and Methods

2.1. Water Sampling and Analysis

Using a 5 L Niskin sampler (General Oceanics Inc., Miami, FL, USA), water samples for the determination of the nutrient and chlorophyll a concentrations were obtained from three different light depths (e.g., 100, 30 and 1% of photosynthetic active radiation (PAR), determined by using a Secchi disk) at seven different stations (Figure 1). The study area Jaran Bay is a relatively shallow coastal bay with an average water depth of 10 m [2]. Sampling was conducted monthly from January to December 2016. The depth-averaged values were obtained from the three light depths (e.g., 100, 30 and 1% PAR), and monthly observed values were obtained from all depths and stations.
The water samples (0.2 L) used for determining the dissolved inorganic nutrient concentrations were filtered through a 47 mm GF/F filters (0.7-μm pore size, Whatman, Maidstone, UK), and the filtrates were stored at −20 °C for further analysis using an Auto Analyzer (Quaatro, Bran+Luebbe, Germany) at the National Institute of Fisheries Science (NIFS), Korea. For determining the total chlorophyll a concentration as a proxy for biomass, water samples (0.2 L) were filtered through 25-mm GF/F filters (0.7-μm pore size, Whatman, Maidstone, UK). The water samples (0.6 L) were filtered sequentially through 47-mm Nucleopore filters (20- and 2-μm) and 47-mm GF/F filters (0.7-μm pore size, Whatman, Maidstone, UK) to determine size-fractionated chlorophyll a concentrations of different cell-sized phytoplankton communities [22,23]. The filters retained chlorophyll a and were immediately frozen and preserved at −70 °C for chlorophyll a extraction at the home laboratory at Pusan National University, South Korea. The chlorophyll a concentrations were measured using a previously calibrated 10-AU fluorometer (Turner Designs, San Jose, CA, USA) after extraction (approximately 24 h, 4 °C) with 90% acetone and centrifugation at 4480 g for 20 min [24].
The water samples that were used for determining the macromolecular compositions (e.g., carbohydrates, proteins and lipids) of particulate organic matter (POM) were filtered through 47 mm GF/F filters, and the filters were immediately preserved at −70 °C until further spectrophotometric analysis. The samples were filtered under a constant vacuum (<10 cm Hg) because live cells could be damaged during the strong vacuum filtration [23]. Carbohydrate extraction was performed by following Dubois et al. [25]. The preground POM-retained filter paper was transferred to a polypropylene (PP) tube. After the addition of 1 mL deionized water, 1 mL of a 5% phenol solution was added and allowed to rest for 40 min. Then, 5 mL of sulfuric acid (H2SO4) was added and allowed to stand for 10 min. Next, the solutions were centrifuged at 3430 g for 10 min. The absorbance of the supernatant was measured at 490 nm. A glucose solution (1 mg mL−1, Sigma Aldrich) was used as the standard for determining the carbohydrate concentration.
For protein extraction, each preground sample filter was transferred to a 12-mL glass tube with 1 mL deionized water (DH2O) and was added to 5 mL of an alkaline copper solution. After the solution was well mixed, 0.5 mL of diluted Folin–Ciocalteu phenol reagent (1:1, v/v) were added and allowed to sit for 1 h 30 min at room temperature. Then, the solutions were centrifuged for 10 min at 2520 g. The absorbance of the supernatant was measured at 750 nm. Bovine serum albumin (2 mg mL−1, Sigma Aldrich) was used as the standard for determining the protein concentration based on previous works in various oceans [5,6,7,16,17,21].
Last, the filters used for lipid extraction were transferred into a 16-mL glass tubes, ground with 3 mL of chloroform-methanol (1:2, v/v) and stored at 4 °C for 1 h. After the solution was homogenized with 4 mL of DH2O, the lower (chloroform) phase of the solution was dried at 40 °C for 48 h and then heated at 200 °C for 15 min with 2 mL of H2SO4. An additional 3 mL of DH2O was added to the chloroform phase in the glass tubes and then they were allowed to rest for 10 min. The absorbance of the supernatant was measured at 375 nm, and a tripalmitin solution (Sigma Aldrich) was used as the standard for determining the lipid concentration. After each extraction process, the concentration of each biochemical component was determined using a UV spectrophotometer (Hitachi-UH5300, Hitachi, Tokyo, Japan).

2.2. Statistical Analysis

Principal component analysis (PCA) was performed on our field-obtained data of the chemical and biological variables (i.e., nutrient concentrations and phytoplankton biomass) for their relative significance and interrelationship patterns among the various biochemical conditions measured during our sampling period. Bartlett’s sphericity tests were used to determine the validity of the PCA (p < 0.01) [26,27]. Factor analysis was conducted to obtain various factors selected by the principal component method with varimax rotation [28]. Due to the strong dependency between PO43− and NO3 (r = 0.56, p < 0.01; Pearson’s correlation coefficient), PO43− was excluded but included P* (PO43− − 1/16 × NO3) in the PCA. P* reflects the excess (or deficiency) of PO43− versus NO3 [29,30].
To determine the major factors controlling the macromolecular composition and FM of POM, multiple linear regression analysis was conducted in this study based on the PCA results. The multiple linear regression equation of Pedhazur [31] is as follows:
Y = α + b 1 X 1 + + b k X k + e
where Y denotes a dependent variable and the FM of POM is estimated from the independent variables (predictors), X1Xk. Parameter α is a constant, b1bk are the regression coefficients for the predictors (FM in this study), and e is an error term.
Insignificant variables for the controlling the FM variation were stepwise eliminated from the model by stepwise variable selection after multiple linear regression analysis. Statistical analysis was performed with IBM SPSS software version 12.0 (SPSS Inc., Chicago, IL, USA). t statistics were conducted for testing the regression coefficients and values of the coefficient of determination (R2) were obtained for measure of goodness of fit for the FM in this study.

3. Results

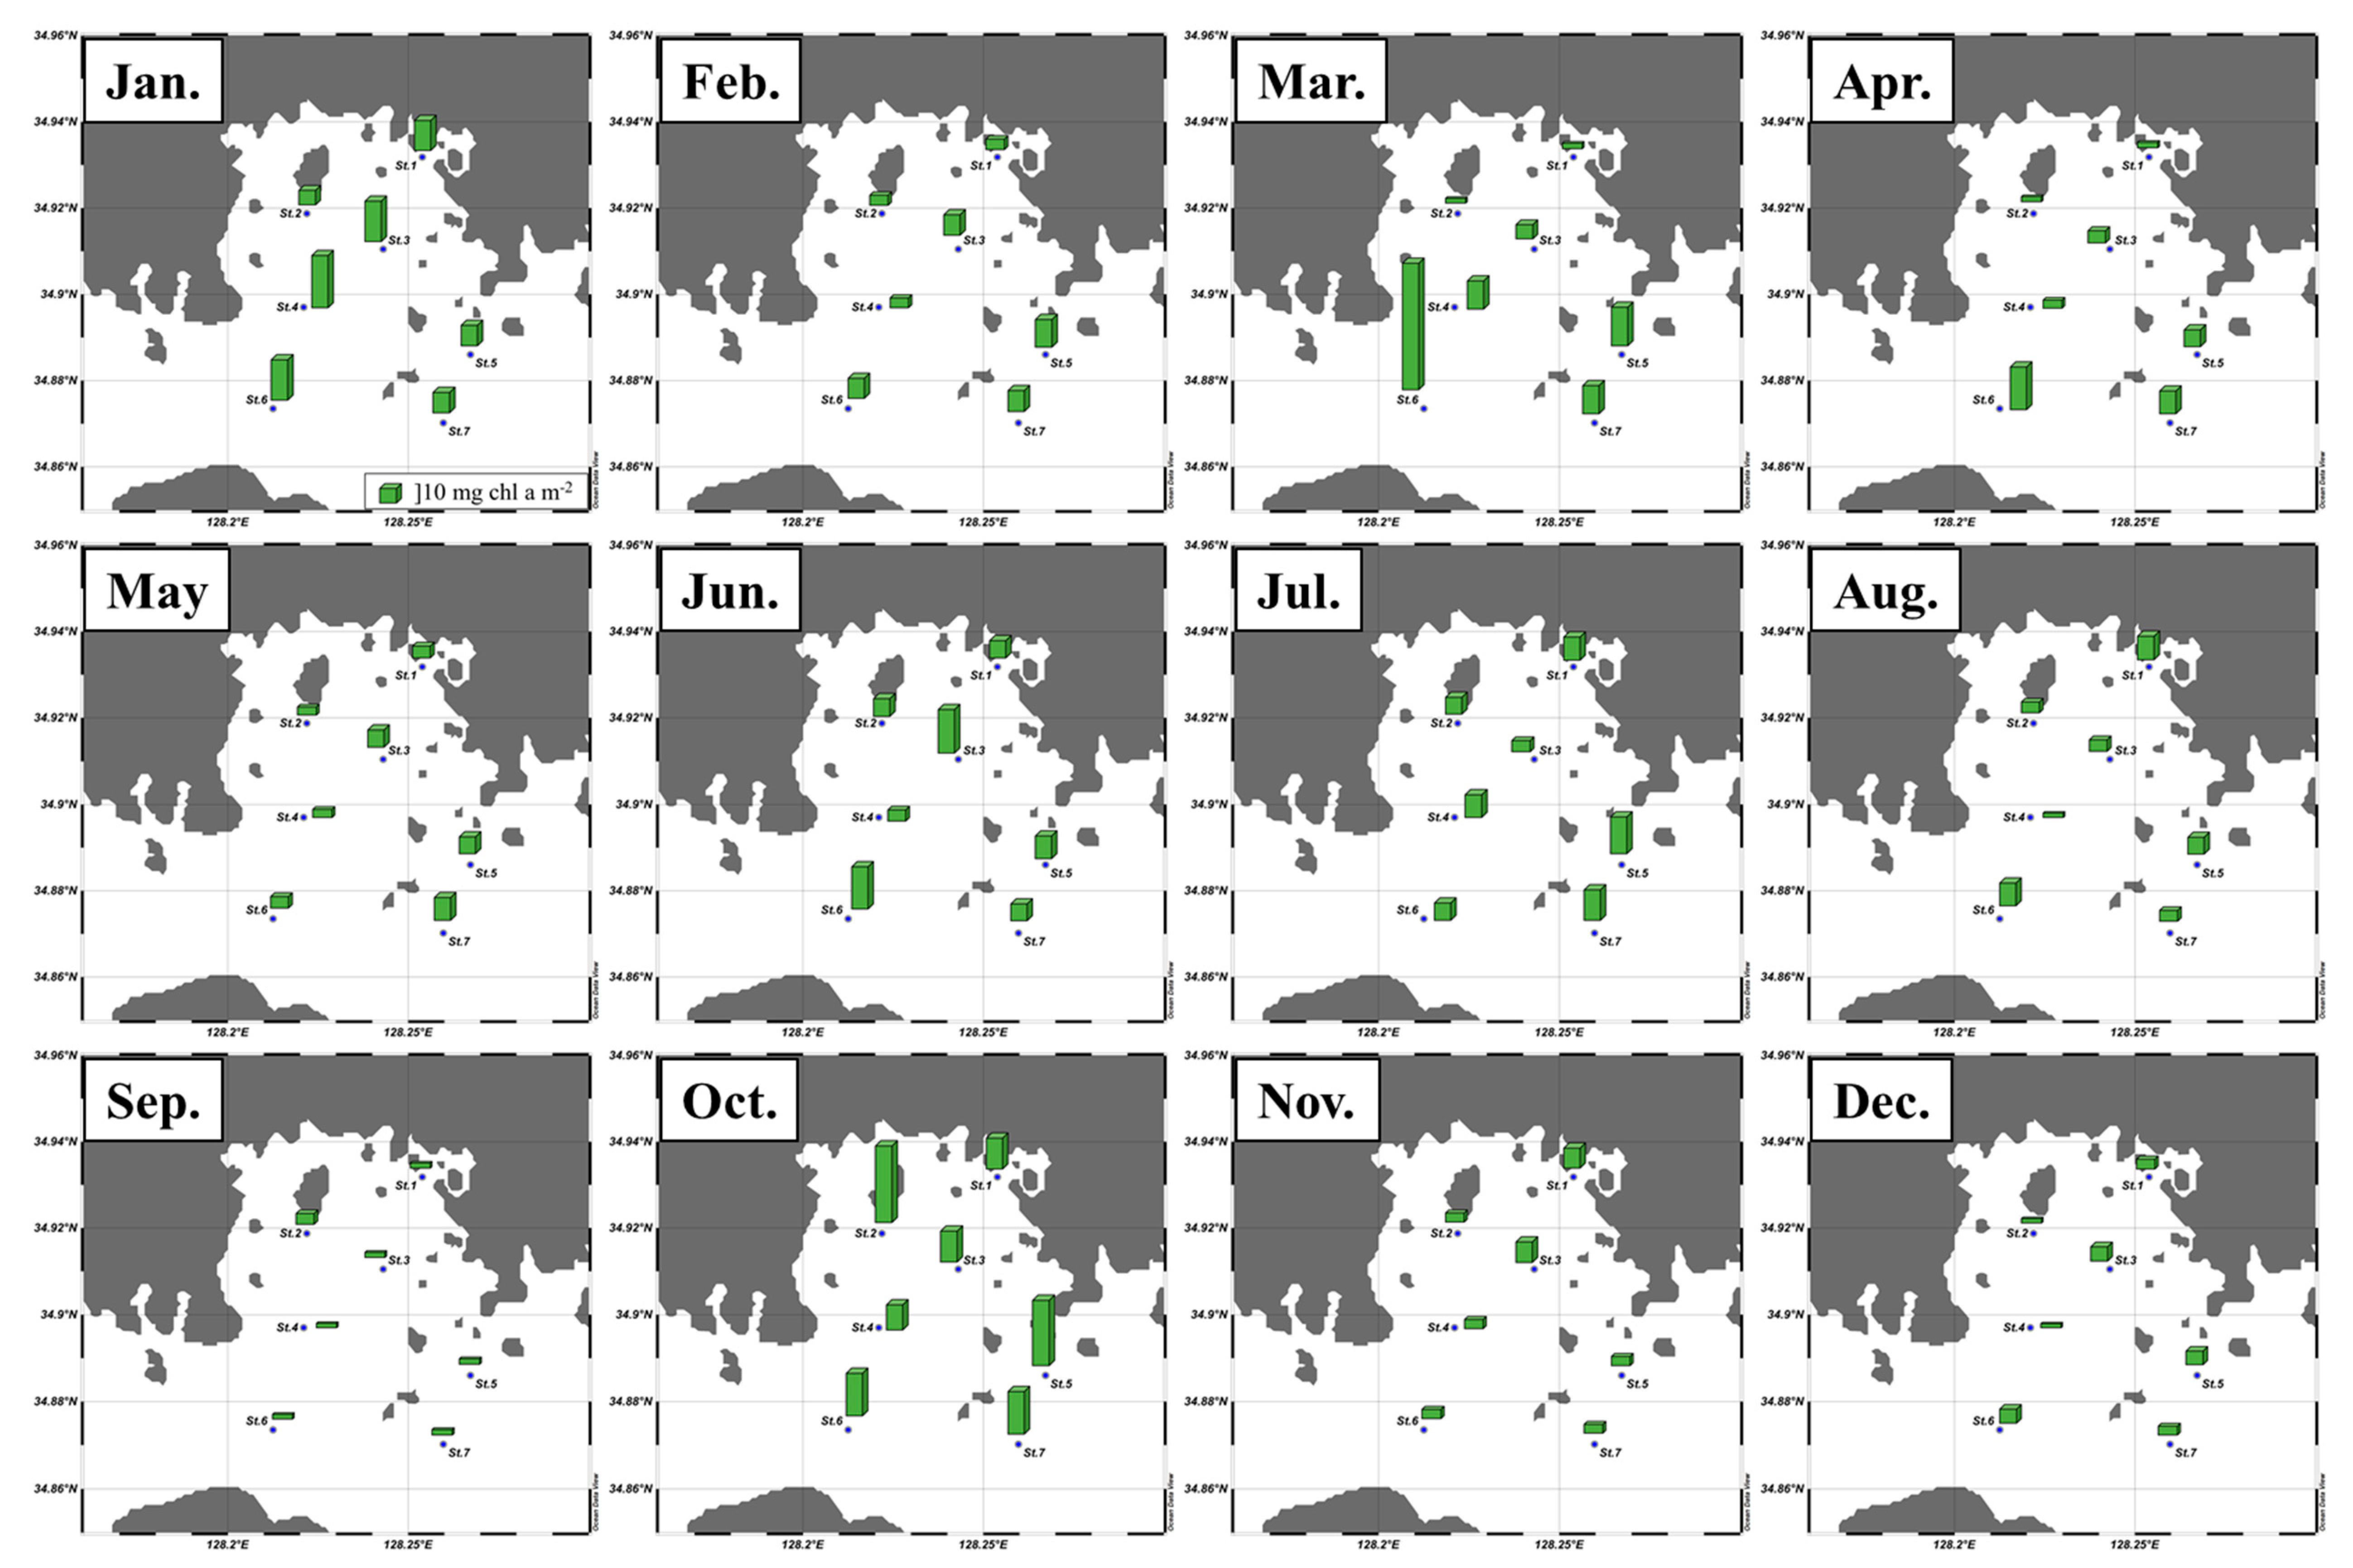
3.1. Monthly Concentrations of Nutrients and Chlorophyll a

The monthly depth-integrated nutrient concentrations within the euphotic water column from 100 to 1% light depths during the present study period are summarized in Table 1. The ranges of the NH4+, NO2 + NO3, PO43− and Si(OH)42− concentrations were 4.0−47.5, 10.9−80.0, 0.5−6.0 and 20.9−166.9 μM, respectively, in Jaran Bay from January to December 2016. The concentration ranges varied significantly during the observation period, and the highest concentrations were detected in September, except for the Si(OH)42− concentrations, which showed the largest peak in June and a secondary peak in September.
The total monthly chlorophyll a concentration averaged from the three light depths at seven stations ranged from 0.77 µg L−1 in September to 4.89 µg L−1 in October, with an average of 2.13 µg L−1 (S.D. = ± 1.18 µg L−1) (Figure 2). Based on the different size-fractionated chlorophyll a concentrations (Figure 3), the compositions of the micro- (> 20 µm), nano- (2−20 µm) and pico-sized chlorophyll a concentrations (0.7−2 µm) varied significantly in Jaran Bay among the different months. The compositions of the micro-sized chlorophyll a concentrations ranged from the lowest value in April (23.8 ± 18.7%) to the highest value in January (77.8 ± 6.8%), whereas the nano-sized chlorophyll a compositions ranged from the lowest value in January (14.3 ± 7.0%) to the highest value in June (50.3 ± 21.3%). In comparison, the compositions of pico-sized chlorophyll a were lowest in January (7.9 ± 4.4%) and highest in April (46.0 ± 18.1%). Seasonally, the compositions of the micro-sized chlorophyll a concentrations steadily increased from spring (March−May) to winter (December−February), although significant monthly variations were present. In contrast, the compositions of the pico-sized chlorophyll a concentrations steadily decreased from spring to winter. The compositions of the nano-sized chlorophyll a concentrations were highest in summer (June−August) and lowest in winter. On average, micro-sized (>20 μm) cells contributed 49.9% (± 18.7%) of the total chlorophyll a concentration in Jaran Bay during our observation period. In comparison, the nano- and pico-sized chlorophyll a compositions contributed 28.5% (± 12.4%) and 21.6% (± 11.2%), respectively. A strong positive relationship was found between the micro-sized chlorophyll a concentrations and total chlorophyll a concentrations integrated from the euphotic water columns in this study (y = 1.31x + 5.74, r2 = 0.82; Figure 4).

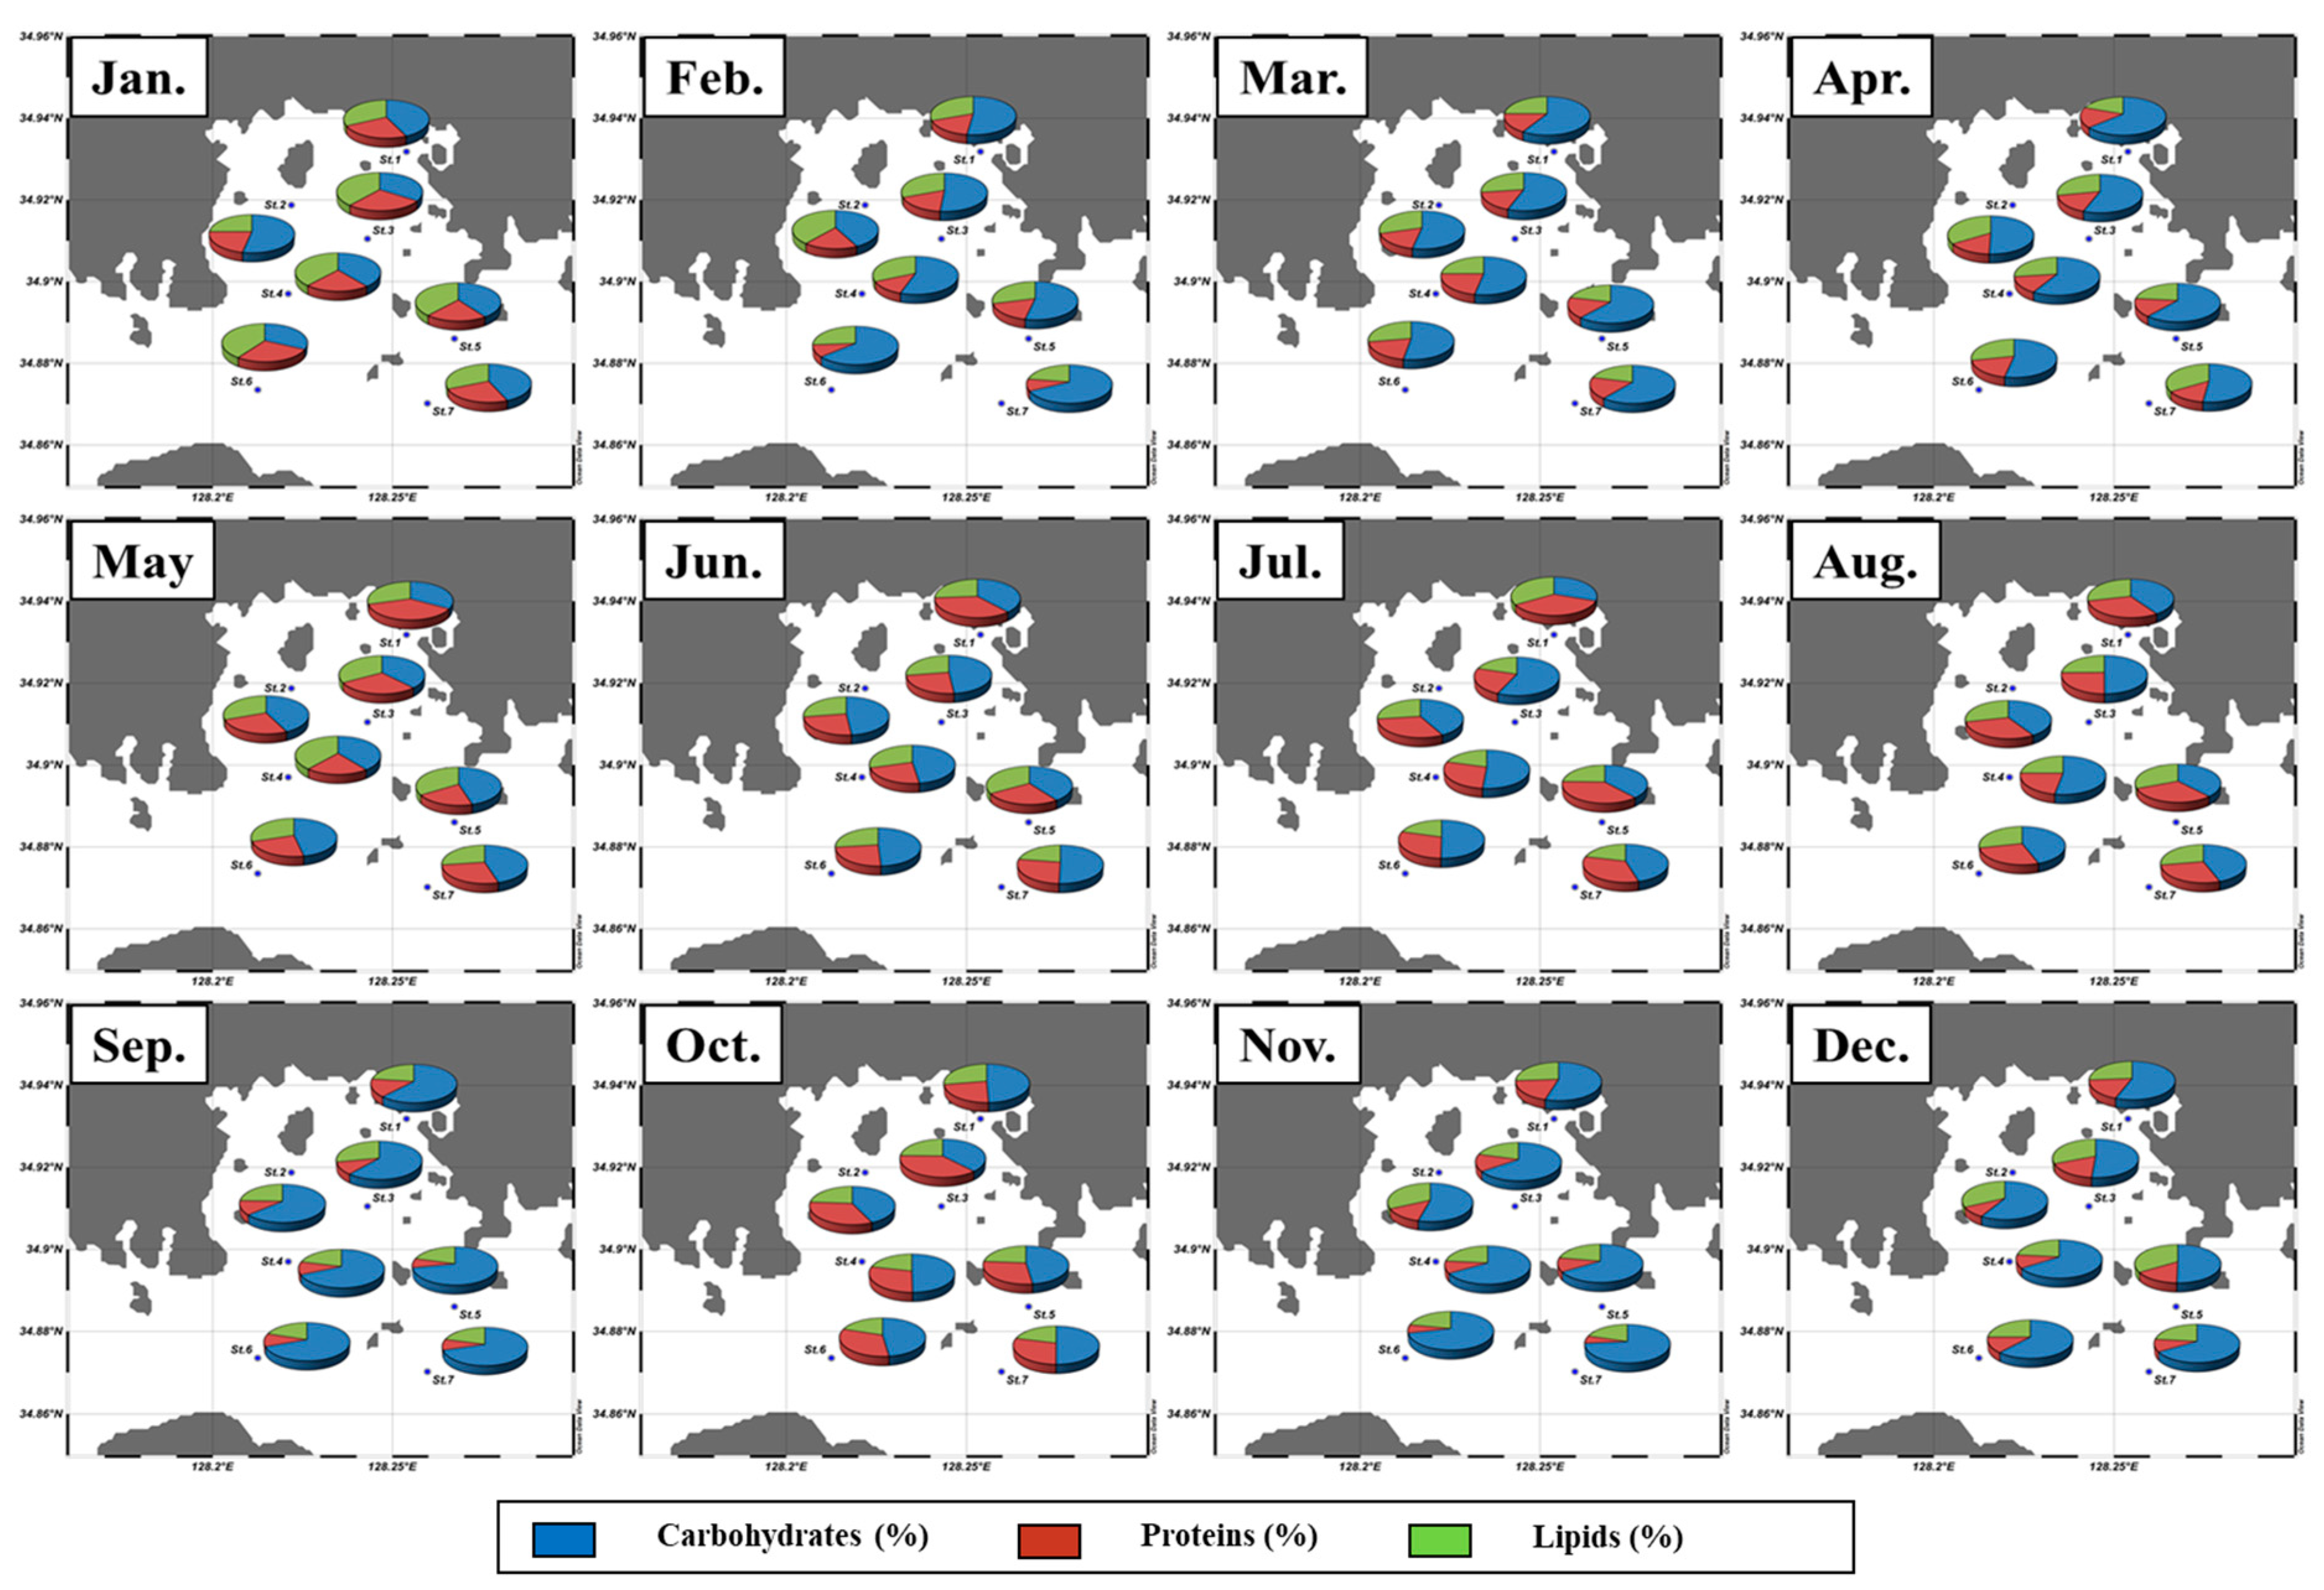
3.2. Spatial and Temporal Variations of the Macromolecular Compositions of POM

Figure 5 shows the average of three light depth values of each macromolecular composition of POM in Jaran Bay from January to December 2016. No distinctive spatial variations were detected in the macromolecular compositions among the different stations; however, they significantly varied among the different months. Carbohydrates were the predominant biochemical component during our observation period from January to December, with monthly proportions of carbohydrates ranging from 40.9% to 66.4%. In comparison, the protein and lipid proportions were 11.1–31.0% and 22.5–35.1%, respectively. The lipid proportion appeared to decrease steadily from January to December. Seasonally, the carbohydrate proportion were relatively variable compared to the protein and lipid proportions. The carbohydrate proportion was lowest during summer (45.6 ± 1.4%) and highest during autumn (59.1 ± 10.9%). In comparison, the protein proportion was lowest during winter (17.5 ± 5.7%) and highest during summer (28.1 ± 2.7%), while the lipid proportion was lowest in autumn (23.1 ± 0.6%) and highest in winter (31.1 ± 3.7%).
The monthly FM concentrations ranged from 297 to 630 mg m−3, with an average of 411.7 mg m−3 (S.D. = ± 93.0 mg m−3), in this study (Table 2). No noticeable monthly variations were observed for the FM concentrations. Spatial variations in the FM concentrations were not noticeable for the seven stations during the observation period except for March, April and June, which had considerably higher FM concentrations at several stations (Figure 6). The monthly calorific values and FM contents of FM averaged from the three light depths at the seven stations did not vary significantly and ranged from 5.5–6.3 Kcal g−1 and 1.7–3.7 Kcal m−3, respectively, in Jaran Bay (Table 2).

3.3. Principal Component Analysis (PCA)

The PCA results for our field-observed biochemical parameters are summarized in Table 3. Three PCs were selected for multiple linear regression analysis in this study. The variables shown in bold indicate the highest correlations among the 12 variables and the corresponding components. The nano-sized chlorophyll a concentrations, carbohydrates, proteins, lipids and FMs had the highest correlations with PC1, whereas the concentrations of NH4+, NO3, P* and Si(OH)42− were highest correlated with PC2. For PC3, temperature and the micro- and pico-sized chlorophyll a concentrations showed the highest correlations. Based on the PCA results in Table 3, multiple linear regression analysis was performed to obtain the major controlling factors for the variation in the FM in Jaran Bay (Table 4). The nano- and micro-sized chlorophyll a concentrations and P* and NH4+ concentrations were found to be the major factors for controlling the FM in Jaran Bay during our observation period (Table 4). The concentrations of nano- and micro-sized chlorophyll a and NH4+ had positive effects whereas the P* concentration had a negative impact on the FM in Jaran Bay during the study period. In other word, a total increase in the concentrations of nano- and micro-sized chlorophyll a and NH4+ could bring an increase in the FM. On the other hand, an increase in P* concentration could lead to a decrease in the FM.

4. Discussion

The monthly-averaged concentrations of the depth-integrated nutrient concentrations measured were within the ranges previously reported from regions near Jaran Bay [32,33,34,35]. The present study indicates that each nutrient concentration showed significant seasonal variations. For example, the DIN concentrations were relatively higher during the period from September to December, whereas the silicate concentrations were higher in June−September compared to other months (Table 1).
The monthly depth-integrated total chlorophyll a concentrations within the euphotic water column from 100% to 1% light depths ranged from 5.2 to 36.7 mg m−2 (mean ± S.D. = 17.0 ± 9.2 mg chl-a m−2) during the study period from January to December 2016. The largest peak was observed in October immediately, followed by the nutrient peaks observed in September (Table 1). However, the seasonal chlorophyll a concentrations did not vary greatly and ranged from 15.8 to 17.8 mg m−2. Generally, the spatial variation of the total chlorophyll a concentrations appeared to be low among the seven stations in Jaran Bay during the observation period except for March (Figure 2). Overall, the phytoplankton community was dominated by micro-sized phytoplankton based on the size-fractionated chlorophyll a concentration results during our observation period. Previous studies have reported that the predominant species in this area consisted of diatoms [23,36]. In general, the spatial and seasonal variations of the total chlorophyll a concentrations were strongly related to the micro-sized (> 20 μm) chlorophyll a concentrations (Figure 4). This finding suggests that micro-sized cells greatly contributed to the total chlorophyll a concentration in Jaran Bay. In other words, 49.9% (± 18.7%) of total chlorophyll a was from micro-sized cells (Figure 3) during our observation period.
The overall dominant macromolecular composition of POM was carbohydrates (51.8 ± 8.7%), followed by lipids (27.3 ± 3.8%) and proteins (20.9 ± 7.4%), during our observation period (Figure 5). The macromolecular compositions obtained from the present study fell in a similar range to those obtained from Geoje-Hansan Bay by Kim et al. [6], in which their study area was close to our research site. However, the compositions in Jaran and Geoje-Hansan bays were considerably different from those in Gwangyang Bay. The mean compositions in Gwangyang Bay were 26.4% (± 9.4%), 37.8% (± 16.1%), and 35.7% (± 13.9%) carbohydrates, proteins, and lipids, respectively [5]. These differences may have been due to the influence of river-borne nutrients. The protein and lipid proportions are largely dependent on the input of dissolved inorganic nitrogen from the Seomjin River in Gwangyang Bay [5]. In comparison, there are no large river inputs in the Jaran and Geoje-Hansan bays. For coastal management plans, e.g., artificial dam construction, the potential influence of river inputs on the dominant cell size and photosynthetic end-products of phytoplankton should be considered [7].
Although the macromolecular compositions between Jaran and Geoje-Hansan Bays [6] in south Korea are similar, the monthly FM concentrations were relatively lower in Jaran Bay and ranged from 297 to 630 mg m−3 with an average of 411.7 mg m−3 (S.D. = ± 93.0 mg m−3), than in Geoje-Hansan Bay, which had a range of 346−1280 mg m−3 (615.5 ± 291.7 mg m−3; Table 5). However, the average monthly FM concentration (411.7 ± 93.0 mg m−3) of POM in Jaran Bay during our observation period was similar to that in Gwangyang Bay (434.5 ± 175.5 mg m−3) [5] despite the large difference in macromolecular compositions between the two bays. Based on the fact that FM concentrations are derived from the total concentrations of carbohydrates, proteins and lipids [18,19] and that their relative compositions can be affected by various environmental and biological factors [5,8,9,10,11,12,13,14], different macromolecular compositions are unlikely to be strongly related to the FM concentrations of POM. Instead of the compositions of the chlorophyll a concentrations, which are often used to represent phytoplankton biomass, would be more appropriate for comparisons. However, no strong relationship between the FM concentrations and total chlorophyll a concentrations was found in the present study, although a strong correlation was found in Gwangyang Bay by [7]. Similarly, no significant linear relationship was observed between the FM and total chlorophyll a concentrations among the different bays in South Korea (Table 5). The average chlorophyll a concentrations were 2.13 µg L−1 (S.D. = ± 1.18 µg L−1, this study), 4.34 µg L−1 [6] and 3.45 µg L−1 [5] in the Jaran, Geoje-Hansan and Gwangyang Bays, (Table 5). These bays are all in the South Sea of South Korea. In the Garolim-Asan Bay, Yellow Sea [37], the average chlorophyll a concentration (2.81 ± 2.12 µg L−1) was within the low range (2.13−4.34 µg L−1) among the three bays, but the average FM concentration (781.4 ± 228.2 mg m−3) was highest among the bays in this study. The chlorophyll a concentration has been used as a proxy for biomass, but may not be completely representative of phytoplankton biomass since the chlorophyll a concentration is greatly influenced by light and nutrient conditions, physiological status and species composition of phytoplankton [38,39,40,41]. Instead of the chlorophyll a concentration, Lee et al. [5] and Kim et al. [7] suggested that the FM concentration of POM, mainly phytoplankton, could be an alternative proxy for food sources available to higher trophic levels in bay or coastal marine ecosystems. Therefore, the FM concentration could have a quantitatively complementary value for the amount of various food material sources available to potential consumers in estuarine or bay ecosystems [7,21]. With respect to energy aspects, the calorific content, which depends on the different macromolecular compositions of the FM concentration, should be considered as representative of the physiological or ecological conditions of higher trophic levels of consumers [5,7,21].
According to the PCA results, spatiotemporal variations in FM are primarily governed by the nano-sized chlorophyll a concentrations, carbohydrates, proteins and lipids since FM is the sum of the concentrations of the three different macromolecules. However, the positive relationship between the nano-sized chlorophyll a concentration and FM would not be predictable. In Jaran Bay, the spatiotemporal change of the total chlorophyll a concentration was primarily controlled by the micro-sized chlorophyll a concentrations because of their high contribution to the total chlorophyll a concentration. In comparison, nano-sized chlorophyll a compositions contributed 28.5% (± 12.4%) of the total chlorophyll a concentration in this study, although their monthly contributions varied somewhat broadly and ranged from 14.3% (±7.0%) in January to 50.3% (±21.3%) in June (Figure 3). In PC2, the positive correlations among the major inorganic nutrient concentrations (e.g., NH4+, NO3, P* and Si(OH)42−) were reasonable. Temperature and the micro- and pico-sized chlorophyll a concentrations in PC3 indicate positive correlations among the three variables in Jaran Bay (Table 3). PCA was used in this study for ranking their relative significance (Table 3) among our field-observed biochemical parameters for multiple linear regression analysis and deriving major controlling factors (Table 4) of the FM in our study site. In this approach, we could predict the FM in our study site based on the multiple linear regression analysis. According to the multiple linear regression, approximately 60% of the variation in FM could be explained by the nano- and micro-sized chlorophyll a concentrations and P* and NH4+ concentrations in Jaran Bay (Table 4). With this approach, the four major controlling factors were determined for the observed FM variations in Jaran Bay during our observation period from January to December 2016. However, the somewhat low prediction of up to 60% suggests that other potential factors in addition to our observed parameters should be investigated to improve the spatiotemporal variation in the FM in Jaran Bay. Since this study was a pilot study, some of important parameters were not considered. For example, grazing effects from predators, such as aquaculture shellfish and zooplankton, could be highly correlated with FM, which is a main food source available to them.

5. Conclusions

A detailed spatiotemporal evaluation of the biochemical compositions and FM of POM of phytoplankton communities and a set of multiple linear regression analyses were conducted in Jaran Bay to understand their major controlling factors. Based on this research, the variations in FM representing food source materials could be explained by large-cell-sized phytoplankton (>2 μm) and major inorganic nutrient concentrations. Kim et al. [42] observed progressive decreases in dissolved inorganic nutrients in the southern coastal region of South Korea in recent decades. A progressive decline of the chlorophyll a concentration has been consistently reported in several regions in the southern coastal region of South Korea [43]. At this point, we cannot assume that the changes of the species compositions or size compositions of phytoplankton are correlated with the decreases of the concentrations of nutrients and chlorophyll a. However, we may expect greater numbers of small-sized phytoplankton cells than of large cell-sized phytoplankton cells under these conditions. These changes in nutrient concentrations and dominant phytoplankton communities could cause changes in FM and further alterations in potential consumers. Jaran Bay is one of the largest shellfish aquaculture sites in the South Sea of Korea. Further studies on the spatial and temporal variations in the macromolecular compositions and FM of POM in regard to various environmental conditions are needed to better understand the quality and quantity of the primary food source available to higher trophic animals.

Author Contributions

Conceptualization, J.H.L., W.-C.L., H.C.K. and S.H.L.; data curation: J.H.L., N.J. and K.K.; formal analysis: K.K. and B.-R.S.; investigation: J.H.L., N.J., K.K., D.L. and J.J.K.; methodology: N.J. and K.K.; validation: J.H.L., W.-C.L., H.C.K. and J.-I.K.; visualization: J.H.L.; writing—original draft: J.H.L. and S.H.L.; writing—review & editing: J.H.L., N.J. and S.H.L. All authors have read and agreed to the published version of the manuscript.

Funding

This research was supported by a grant (R2020048) from the National Institute of Fisheries Science (NIFS) and partly by a project titled ‘Improvements of ocean prediction accuracy using numerical modeling and artificial intelligence technology’ which are funded by the Ministry of Oceans and Fisheries, Republic of Korea.

Acknowledgments

We thank the anonymous reviewers who greatly improved an earlier version of manuscript.

Conflicts of Interest

The authors declare no conflict of interest.

References

  1. Mathiesen, A.M. The state of the World Fisheries and Aquaculture 2012; Food and Agriculture Organization: Rome, Italy, 2012; p. 290. [Google Scholar]
  2. Cho, C.H.; Park, K. Eutrophication of bottom mud in shellfish farms, the Goseong-Jaran Bay. Korean J. Fish. Aquat. Sci. 1983, 16, 260–264. [Google Scholar]
  3. Xu, Q.; Yang, H. Food sources of three bivalves living in two habitats of Jiaozhou Bay (Qingdao, China): Indicated by lipid biomarkers and stable isotope analysis. J. Shellfish Res. 2007, 26, 561–567. [Google Scholar] [CrossRef]
  4. Umehara, A.; Asaoka, S.; Fujii, N.; Otani, S.; Yamamoto, H.; Nakai, S.; Okuda, T.; Nishijima, W. Biological productivity evaluation at lower trophic levels with intensive Pacific oyster farming of Grassostrea gigas in Hiroshima Bay, Japan. Aquaculture 2018, 495, 311–319. [Google Scholar] [CrossRef]
  5. Lee, J.H.; Lee, D.; Kang, J.J.; Joo, H.; Lee, J.H.; Lee, H.W.; Ahn, S.H.; Kang, C.K.; Lee, S.H. The effects of different environmental factors on the biochemical composition of particulate organic matter in Gwanyang Bay, South Korea. Biogeosciences 2017, 14, 1903–1917. [Google Scholar] [CrossRef] [Green Version]
  6. Kim, H.C.; Lee, J.H.; Lee, W.C.; Hong, S.; Kang, J.J.; Lee, D.; Jo, N.; Bhavya, P.S. Decoupling of macromolecular compositions of particulate organic matters between the water columns and the sediment in Geoje-Hansan Bay, South Korea. Ocean Sci. J. 2018, 53, 735–743. [Google Scholar] [CrossRef]
  7. Kim, Y.; Lee, J.H.; Kang, J.J.; Lee, J.H.; Lee, H.W.; Kang, C.K.; Lee, S.H. River discharge effects on the contribution of small-sized phytoplankton to the total biochemical composition of POM in Gwangyang Bay, Korea. Estuar. Coast. Shelf Sci. 2019, 226, 106293. [Google Scholar] [CrossRef]
  8. Morris, I.; Glover, H.E.; Yentsch, C.S. Products of photosynthesis by marine phytoplankton: The effect of environmental factors on the relative rates of protein synthesis. Mar. Biol. 1974, 21, 1–9. [Google Scholar] [CrossRef]
  9. Kowallik, W. Blue light effects on carbohydrate and protein metabolism. In Blue Light Responses: Phenomena and Occurrence in Plants; Senger, H., Ed.; CRC Press: Boca Raton, FL, USA, 1978; Volume 1, pp. 8–13. [Google Scholar]
  10. Suárez, I.; Maranón, E. Photosynthate allocation in a temperate sea over an annual cycle: The relationship between protein synthesis and phytoplankton physiological state. J. Sea Res. 2003, 50, 285–299. [Google Scholar] [CrossRef]
  11. Mortensen, S.H.; Børsheim, K.Y.; Rainuzzo, J.; Knutsen, G. Fatty acid and elemental composition of the marine diatom Chaetoceros gracilis Schütt. Effects of silicate deprivation, temperature and light intensity. J. Exp. Mar. Biol. Ecol. 1988, 122, 173–185. [Google Scholar] [CrossRef]
  12. Liebezeit, G. Particulate carbohydrate in relation to phytoplankton in the euphotic zone of the Bransfield Strait. Polar Biol. 1984, 2, 225–228. [Google Scholar] [CrossRef]
  13. Moal, J.; Jezequel, V.M.; Harris, R.P.; Samain, J.F.; Poulet, S.A. Interspecific and intraspecific variability of the chemical-composition of marine-phytoplankton. Oceanol. Acta 1987, 10, 339–346. [Google Scholar]
  14. Kilham, S.S.; Kreeger, D.A.; Goulden, C.E.; Lynn, S.G. Effects of nutrient limitation on biochemical constituents of Ankistrodesmus falcatus. Freshw. Biol. 1997, 38, 591–596. [Google Scholar] [CrossRef]
  15. Lee, S.H.; Kim, H.J.; Whitledge, T.E. High incorporation of carbon into proteins by the phytoplankton of the Bering Strait and Chukchi Sea. Cont. Shelf Res. 2009, 29, 1689–1696. [Google Scholar] [CrossRef]
  16. Yun, M.S.; Lee, D.B.; Kim, B.K.; Kang, J.J.; Lee, J.H.; Yang, E.J.; Park, W.G.; Chung, K.H.; Lee, S.H. Comparison of phytoplankton macromolecular compositions and zooplankton proximate compositions in the northern Chukchi Sea. Deep Sea Res. Part II 2015, 120, 82–90. [Google Scholar] [CrossRef]
  17. Jo, N.; Kang, J.J.; Park, W.G.; Lee, B.R.; Yun, M.S.; Lee, J.H.; Kim, S.M.; Lee, D.; Joo, H.; Lee, J.H.; et al. Seasonal variation in the biochemical compositions of phytoplankton and zooplankton communities in the southwestern East/Japan Sea. Deep Sea Res. Part II 2017, 143, 82–90. [Google Scholar] [CrossRef]
  18. Navarro, J.M.; Clasing, E.; Urrutia, G.; Asencio, G.; Stead, R.; Herrera, C. Biochemical composition and nutritive value of suspended particulate matter over a tidal flat of Southern Chile. Estuar. Coast. Shelf Sci. 1993, 37, 59–73. [Google Scholar] [CrossRef]
  19. Danovaro, R.; Dell’Anno, A.; Pusceddu, A.; Marrale, D.; Croce, N.D.; Fabiano, M.; Tselepides, A. Biochemical composition of pico-, nano- and microparticulate organic matter and bacterioplankton biomass in the oligotrophic Cretan Sea (NE Mediterranean). Prog. Oceanogr. 2000, 46, 279–310. [Google Scholar] [CrossRef]
  20. Navarro, J.M.; Thompson, R.J. Seasonal fluctuations in the size spectra, biochemical-composition and nutritive-value of the seston available to a suspension-feeding bivalve ina asub-arctic environment. Mar. Ecol. Prog. Ser. 1995, 125, 95–106. [Google Scholar] [CrossRef] [Green Version]
  21. Kang, J.J.; Joo, H.; Lee, J.H.; Lee, J.H.; Lee, H.W.; Lee, D.; Kang, C.K.; Yun, M.S.; Lee, S.H. Comparison of biochemical compositions of phytoplankton during spring and fall seasons in the northern East/Japan Sea. Deep Sea Res. Part II 2017, 143, 73–81. [Google Scholar] [CrossRef]
  22. Lee, S.H.; Whitledge, T.E.; Kang, S. Recent carbon and nitrogen uptake rates of phytoplankton in Bering Strait and the Chukchi Sea. Cont. Shelf Res. 2007, 27, 2231–2249. [Google Scholar] [CrossRef]
  23. Lee, J.H.; Kim, H.C.; Lee, T.; Lee, W.C.; Kang, J.J.; Jo, N.; Lee, D.; Kim, K.; Min, J.; Kang, S.; et al. Monthly variations in the intracellular nutrient pools of phytoplankton in Jaran Bay, Korea. J. Coast. Res. 2018, 85, 331–335. [Google Scholar] [CrossRef]
  24. Welschmeyer, N.A. Fluorometric analysis of chlorophyll a in the presence of chlorophyll b and phaeopigments. Limnol. Oceanogr. 1994, 39, 1985–1992. [Google Scholar] [CrossRef]
  25. Dubois, M.; Gilles, K.; Hamilton, J.K.; Rebers, P.A.; Smith, F. Colormetric method for determination of sugars and related substances. Anal. Chem. 1994, 28, 350–356. [Google Scholar] [CrossRef]
  26. Stevens, J. Applied Multivariate Statistics for the Social Science; Lawrence Erlbaum: New York, NY, USA, 1986; p. 515. [Google Scholar]
  27. Camdevyren, H.; Demyr, N.; Kanik, A.; Keskyn, S. Use principal component scores in multiple linear regression models for prediction of Chlorophyll-a in reservoirs. Ecol. Model. 2005, 181, 581–589. [Google Scholar] [CrossRef]
  28. Wang, Y.S.; Lou, Z.P.; Sun, C.C.; Wu, M.L.; Han, S.H. Multivariate statistical analysis of water quality and phytoplankton characteristics in Daya Bay, China, from 1999 to 2002. Oceanologia 2006, 48, 193–211. [Google Scholar]
  29. Deutsch, C.; Sarmiento, J.L.; Sigman, D.M.; Gruber, N.; Dunne, J.P. Spatial coupling of nitrogen inputs and losses in the ocean. Nature 2007, 445, 163–167. [Google Scholar] [CrossRef]
  30. Brun, P.; Vogt, M.; Payne, M.R.; Gruber, N.; O’Brien, C.J.; Buitenhuis, E.T.; Le Quere, C.; Leblanc, K.; Luo, Y.W. Ecological niches of open ocean phytoplankton taxa. Limnol. Oceanogr. 2015, 60, 1020–1038. [Google Scholar] [CrossRef] [Green Version]
  31. Pedhazur, E. Multiple regression in behavioral science; Holt Rinehart & Winston: Fort Worth, TX, USA, 1982; p. 135. [Google Scholar]
  32. Lee, Y.S.; Kang, C.K.; Kwon, K.Y.; Kim, S.Y. Organic and inorganic matter increase related to eutrophication in Gamak Bay, South Korea. J. Environ. Biol. 2009, 30, 373–380. [Google Scholar]
  33. Lee, Y.S.; Kang, C.K. Causes of COD increases in Gwangyang Bay, South Korea. J. Environ. Monit. 2010, 12, 1537–1546. [Google Scholar] [CrossRef] [PubMed] [Green Version]
  34. Lee, Y.S.; Lim, W.A.; Jung, C.S.; Park, J. Spatial distributions and monthly variations of water quality in coastal seawater of Tongyeong, Korea. J. Korean Soc. Mar. Environ. Eng. 2011, 14, 154–162. [Google Scholar] [CrossRef]
  35. Jeong, D.H.; Shin, H.H.; Jung, S.W.; Lim, D.I. Variations and characters of water quality during flood and dry seasons in the Eastern coast of South Sea, Korea. Korean J. Environ. Biol. 2013, 31, 19–36. [Google Scholar] [CrossRef]
  36. Park, J.S.; Yoon, Y.H.; Oh, S.J. Variational characteristics of phytoplankton community in the mouth parts of Gamak Bay, Southern Korea. Korean J. Environ. Biol. 2009, 27, 205–215. [Google Scholar]
  37. Lee, J.H.; Kang, J.J.; Jang, H.K.; Jo, N.; Lee, D.; Yun, M.S.; Lee, S.H. Major controlling factors for spatio-temporal variations in the macromolecular composition and primary production by phytoplankton in Garolim and Asan bays in the Yellow Sea. Reg. Stud. Mar. Sci. 2020, 36, 101269. [Google Scholar] [CrossRef]
  38. Desortová, B. Relationship between chlorophyll-a concentration and phytoplankton biomass in several reservoirs in Czechoslovakia. Hydrobiology 1981, 66, 153–169. [Google Scholar] [CrossRef]
  39. Behrenfeld, M.J.; Boss, E.; Siegel, D.A.; Shea, D.M. Carbon-based ocean productivity and phytoplankton physiology from space. Glob. Biogeochem. Cycles 2005, 19. [Google Scholar] [CrossRef]
  40. Behrenfeld, M.J.; Boss, E. Beam attenuation and chlorophyll concentration as alternative optical indices of phytoplankton biomass. J. Mar. Res. 2006, 64, 431–451. [Google Scholar] [CrossRef]
  41. Kruskopf, M.; Flynn, K.J. Chlorophyll content and fluorescence responses cannot be used to gauge reliably phytoplankton biomass, nutrient status or growth rate. New Phytol. 2006, 169, 525–536. [Google Scholar] [CrossRef]
  42. Kim, T.W.; Lee, K.; Lee, C.K.; Jeong, H.D.; Suh, Y.S.; Lim, W.A.; Kim, K.Y.; Jeong, H.J. Interannual nutrient dynamics in Korean coastal waters. Harmful Algae 2013, 30, 15–27. [Google Scholar] [CrossRef]
  43. Son, Y.B.; Ryu, J.H.; Noh, J.H.; Ju, S.J.; Kim, S.-H. Climatological variability of satellite-derived sea surface temperature and chlorophyll in the South Sea of Korea and East China Sea. Ocean Polar Res. 2012, 34, 201–218. [Google Scholar] [CrossRef] [Green Version]
Figure 1. Sampling stations in Jaran Bay, South Sea of Korea.
Water 12 03093 g001
Figure 2. Water column-integrated chlorophyll a concentrations at the sampling stations in Jaran Bay.
Water 12 03093 g002
Figure 3. Different size compositions of chlorophyll a concentrations at the sampling stations in Jaran Bay.
Water 12 03093 g003
Figure 4. Relationship between the euphotic depth-integrated micro-sized chlorophyll a concentrations and the integrated total chlorophyll a concentrations in Jaran Bay.
Water 12 03093 g004
Figure 5. Biochemical compositions of POM relative to the total FM at the sampling stations in Jaran Bay.
Water 12 03093 g005
Figure 6. Water column-integrated the total FM concentrations at the sampling stations in Jaran Bay.
Water 12 03093 g006
Table 1. Monthly variations in the water column-integrated major nutrient concentrations averaged from seven different stations in Jaran Bay.
Integrated Nutrients
NH4+NO2 + NO3DIPSiO2-Si
mmol m−2
Jan.8 ± 521 ± 193 ± 264 ± 46
Feb.4 ± 38 ± 62 ± 121 ± 11
Mar.4 ± 27 ± 61 ± 122 ± 7
Apr.7 ± 212 ± 52 ± 147 ± 5
May6 ± 17 ± 20.5 ± 0.274 ± 14
Jun.8 ± 312 ± 81 ± 1167 ± 48
Jul.11 ± 415 ± 102 ± 1161 ± 31
Aug.9 ± 48 ± 42 ± 190 ± 46
Sep.48 ± 1933 ± 136 ± 2146 ± 37
Oct.6 ± 222 ± 231 ± 272 ± 70
Nov.11 ± 444 ± 244 ± 2102 ± 46
Dec.9 ± 446 ± 314 ± 2106 ± 66
Table 2. Monthly averaged compositions of different sized chlorophyll a concentrations and biochemical concentrations and compositions of POM averaged from seven different stations in Jaran Bay.
Total chl aMicroNanoPicoCHOPRTLIPFMCHOPRTLIP
(μg L−1)(%)(%)(%)(μg L−1)(μg L−1)(μg L−1)(μg L−1)(%)(%)(%)
Jan.3.2 ± 1.078 ± 714 ± 78 ± 4145 ± 6481 ±19119 ± 34345 ± 8441 ± 924 ± 435 ± 8
Feb.1.7 ± 0.672 ± 1915 ± 813 ± 18243 ± 5665 ± 21134 ± 44442 ± 5655 ± 1015 ± 530 ± 8
Mar.2.5 ± 1.645 ± 2219 ± 537 ± 18206 ± 4868 ± 2192 ± 26368 ± 7856 ± 618 ± 325 ± 5
Apr.1.4 ± 0.724 ± 1930 ± 646 ± 18183 ± 3753 ± 1796 ± 31332 ± 5756 ± 816 ± 329 ± 7
May1.4 ± 0.832 ± 1638 ± 1229 ± 12163 ± 44103 ± 37129 ± 50395 ± 10142 ± 726 ± 732 ± 5
Jun.2.5 ± 1.432 ± 1950 ± 2118 ± 6239 ± 182122 ± 64131 ± 82492 ± 31747 ± 826 ± 527 ± 8
Jul.3.2 ± 1.840 ± 1541 ± 1519 ± 6269 ± 94202 ± 108158 ± 99630 ± 25045 ± 1131 ± 824 ± 6
Aug.1.6 ± 1.562 ± 1621 ± 1116 ± 8168 ± 71101 ± 34101 ± 32370 ± 12545 ± 628 ± 528 ± 4
Sep.0.8 ± 0.232 ± 1545 ± 1423 ± 18255 ± 4842 ± 1185 ± 14382 ± 5366 ± 611 ± 323 ± 4
Oct.4.9 ± 1.675 ± 1117 ± 88 ± 3239 ± 48157 ± 43117 ± 18513 ± 8347 ± 630 ± 623 ± 3
Nov.1.4 ± 0.751 ± 2028 ± 1220 ± 9240 ± 3645 ± 1989 ± 22375 ± 4564 ± 812 ± 524 ± 5
Dec.0.9 ± 0.455 ± 1423 ±622 ± 13172 ± 2341 ± 1485 ± 32297 ± 4958 ± 714 ± 428 ± 7
Table 3. Principal component analysis (PCA) results in Jaran Bay during the observation period.
Variables inStandardized Weight of Variables in SelectedLoading of Variables (vik)Communalities
PC (tik; I = 1, 2, …, 12 and k = 1, 2)
PC 1PC 2PC 3PC 1PC 2PC 3
Temperature−0.1030.180.3730.1090.5060.5870.612
NH4+−0.0020.35−0.06−0.0870.874−0.0650.775
NO30.0540.217−0.0280.1540.5430.0470.321
P*−0.0520.289−0.141−0.3710.708−0.2890.723
SiO2-Si−0.0170.2730.2220.2210.7190.430.75
Micro−0.102−0.1330.4160.171−0.2760.6240.495
Nano0.2040.0460.0330.7720.1180.330.719
Pico−0.1070.0230.3350.0480.1050.4890.253
CHO0.3570.108−0.3570.8180.219−0.190.754
PRT0.094−0.0680.2770.694−0.1330.6270.892
LIP0.252−0.053−0.0750.805−0.1470.1770.702
FM0.3040.012−0.0990.9610.0130.2090.967
Table 4. Regression analysis results for the FM in Jaran Bay (**: p < 0.01, n = 252).
Included IndependentRegressionStandardStandardized Regressiont Staticsp ValueAdjusted R2 (%)
VariablesCoefficient (bk)Error of bkCoefficient
Constant337.87212.08 27.9690.000 **
Nano-chlorophyll a concentration112.4768.160.61713.7840.000 **0.544
Micro-chlorophyll a concentration20.1155.4120.1563.7160.000 **0.57
P*−230.32149.425−0.305−4.660.000 **0.582
NH4+ concentration19.3215.3620.2253.6030.000 **0.602
Table 5. Comparison of the total chlorophyll a concentrations and FM concentrations of POM among different Korean bays.
RegionPeriodTotal Chlorophyll a ConcentrationFM ConcentrationReference
(μg L−1)(mg m−3)
Gwangyang Bay, KoreaSeasonally, 2012–20133.45 (±2.81)434.5 (±175.5)[5]
Geoje-Hansan Bay, KoreaMonthly, 20154.34 (±2.42)615.5 (±291.7)[6]
Garolim-Asan Bay, KoreaSeasonally, 2015–20162.81 (±2.12)781.4 (±228.2)[37]
Jaran Bay, KoreaMonthly, 20162.13 (±1.18)411.7 (±93.0)This study
Publisher’s Note: MDPI stays neutral with regard to jurisdictional claims in published maps and institutional affiliations.

