Article

Monitoring Waterborne Pathogens in Surface and Drinking Waters. Are Water Treatment Plants (WTPs) Simultaneously Efficient in the Elimination of Enteric Viruses and Fecal Indicator Bacteria (FIB)?

1
Instituto de Saúde Ambiental, Faculdade de Medicina da Universidade de Lisboa, Avenida Prof. Egas Moniz, Edifício Egas Moniz, Piso 0, Ala C, 1649-028 Lisboa, Portugal
2
Centro de Estudos do Ambiente e do Mar (CESAM), Departamento de Biologia Vegetal, Faculdade de Ciências da Universidade de Lisboa, Edifício C2-Piso 4, Campo Grande, 1749-016 Lisboa, Portugal
3
Direção de Laboratórios e Controlo da Qualidade da Água (LAB) da Empresa Portuguesa das Águas Livres (EPAL), Avenida de Berlim, 15, 1800-031 Lisboa, Portugal
*
Author to whom correspondence should be addressed.
Water 2020, 12(10), 2824; https://doi.org/10.3390/w12102824
Submission received: 8 September 2020 / Revised: 6 October 2020 / Accepted: 8 October 2020 / Published: 11 October 2020

Abstract

:
Monitoring the quality of water is a requisite to prevent outbreaks related to waterborne diseases, predominantly caused by pathogens like enteric viruses, usually transmitted via the fecal-oral route. This study aimed to survey a group of enteric viruses (Enterovirus, Norovirus genogroups I and II, and hepatitis A virus) in two surface water sources of drinking water, also intending to evaluate the extent of their elimination in the two water treatment plants (WTPs) involved in drinking water production. Correlations between these viruses and fecal indicator bacteria (FIB) were also evaluated. Positive samples for viral RNA were recurrently found by reverse transcription quantitative PCR (RT-qPCR) and quantified, in genomic copies per liter (gc/L) of sampled water. Viral RNAs were detected in 14 out of 27 samples of surface water, and 21 out of 36 samples of drinking water, NoV II having been the most frequently detected in both (0–78.6 gc/L and 0–12.5 gc/L, respectively). Both WTPs showed variable efficacies in the elimination of viral RNA. Only one correlation was found with FIB, between NoV II and intestinal enterococci. These results recommend the monitoring of enteric viruses over time and their inclusion in the mandatory analysis of water quality.

Graphical Abstract

1. Introduction

The water used by human societies can have different origins, such as surface water from rivers and dam reservoirs. The World Health Organization (WHO) estimates that 785 million people do not have a basic water supply service, counting 144 million people who are directly dependent on surface water [1]. In 2025, half of the population will live in areas of water stress [1]. The monitoring of the quality of water is a permanent requisite to prevent, among other possible threats to human health, outbreaks related to waterborne diseases [2,3]. Health risks associated with the use of surface water include infectious diseases predominantly caused by enteric pathogens, mainly bacteria and viruses [4,5].
There are more than 200 enteric viruses in nature, distributed among several virus families: Adenoviridae, Astroviridae, Caliciviridae, Hepeviridae, Picornaviridae, and Reoviridae [3,6,7]. In the Guidelines for Drinking Water Quality, WHO (2017) reported that viruses from these families have a moderate to high impact on human health, highlighting the following viruses with RNA genomes: Enterovirus, hepatitis A and E viruses, Norovirus, Rotavirus, and Sapovirus [8]. Recently, Enterovirus, Norovirus, and hepatitis A virus were classified as emerging agents by the USA Environmental Protection Agency and included in the Contaminant Candidate List 4-CCL [9].
The present study targets the last three viruses referred to above, included two virus families of enteric RNA viruses, which are considered the most diverse group of pathogens for humans and animals [5,10].
Viruses from the genus Enterovirus belong to the family Picornaviridae, which comprises single-stranded positive-sense RNA viruses with a nonenveloped small icosahedral capsid [11]. Enterovirus includes 12 species with numerous virus isolates, distributed across the globe [11]. In the United States, enteroviruses cause more than 10 million infections and several thousand hospitalizations per year [12]. In Portugal, a study based on 625 fecal samples, detected 22.9% of samples were positive for these viruses [13]. Most infections are asymptomatic but can also take the form of a febrile illness that lasts a few days, often accompanied by symptoms associated with upper respiratory tract illness. However, they can cause more serious diseases such as poliomyelitis, paralytic disease, meningitis, myocarditis, and hand, foot, and mouth disease [12,14]. Enteroviruses were detected in surface water in the USA [15], Japan [16], Netherlands [17], Hawaii [18], South Africa [19], France [20], and in other countries [10], as well as in drinking water in Colombia [21].
Hepatitis A virus (HAV) is the unique serotype of the species Hepatovirus A [22], one out the nine species of the genus Hepatovirus, also belonging to the Picornaviridae family. According to the WHO, HAVs caused around 7134 deaths worldwide in 2016 [23]. In Portugal, hepatitis A is a mandatory reporting disease, with 599 cases reported in 2017 [24]. Most infections are silent in children under the age of five. In older children and adults, the most common symptoms are dark urine, diarrhea, abdominal pain, fever, nausea, jaundice, and anorexia [3,5]. This virus was detected in surface water in the USA [25], Brazil [26], Spain [27], Uganda [28], and also in other countries [10]; as well as in drinking water in Colombia [21].
The genus Norovirus, belonging to the Caliciviridae family, also comprises nonenveloped icosahedral viruses with a positive-sense single-stranded RNA genome. This genus includes several isolates from a unique species (Norwalk virus) [29]. They are distributed in six genogroups (GI to GVI); however, only isolates from genogroups I, II, and IV infect humans [10]. Human noroviruses are the most common etiological agent linked to gastroenteritis outbreaks as well as the leading cause of non-bacterial gastroenteritis [5]. According to the Centers for Disease Control and Prevention (CDC), noroviruses cause approximately 200,000 deaths per year worldwide and 70,000, or more, are among children in developing countries [30]. In Portugal, a study carried out in 2015, involving 580 stool samples from patients hospitalized for acute diarrhea in 13 hospitals, found 11.6% of samples were positive for these viruses [31]. In most cases, infection by noroviruses causes mild symptoms, such as diarrhea, vomiting, nausea, abdominal cramps, headache, fever, and muscle pain [3]. These viruses were detected in surface water in Finland [32], Norway [33], Netherlands [34], Japan [16], and also in other countries [10]; as well as in drinking water in Finland [35] and Spain [36].
Enteric viruses are usually transmitted to humans via the fecal-oral route, by person-to-person contact, aerosols, ingestion of contaminated food, and water, this one recognized as an important transmission vehicle [3,14]. These viruses are released in large numbers in the feces of carriers during infection (105 to 1011 virus particles per gram of stool) [7]. They are very contagious and can survive in the environment for longer periods than bacteria, having been reported that they can remain infectious for 120 days in freshwater [3,7,8,37]. As they have very robust capsids, they are more resistant to disinfection, temperature changes, and low pH, than bacteria [3,37,38,39]. Their elimination is complex in water matrices, requiring the use of combined processes in water treatment plants (WTP) [37,40]. Particularly in drinking water, where these viruses are usually found in low concentrations, their detection is another technical challenge [41].
Despite the indisputable importance of enteric viruses, the current Portuguese legislation does not include these pathogens in the list of the microbiological parameters required to control the quality of the drinking water. The microbial indicators of fecal contamination included in that list are fecal indicator bacteria (FIB), comprising coliform bacteria (Escherichia coli and other coliforms), and intestinal enterococci [42]. Although FIB have been considered effective indicators of the presence of other pathogens, this association has been questioned [43,44,45].
In this context, our study conducted in Portugal aimed to evaluate the presence of Enterovirus, Norovirus (GI and GII), and HAV, in natural water sampled in two surface sources (a river and a dam reservoir) feeding two WTPs, whose efficacy in eliminating viral RNA was addressed by simultaneous sampling of drinking water at the outlet of both WTPs; a sampling point located in the water distribution network was included, as outside control. This study also intended to extend the evaluation to the degree of correlation of the enteric viruses eventually detected, with FIB and some physical-chemical characteristics of the sampled water.

2. Materials and Methods

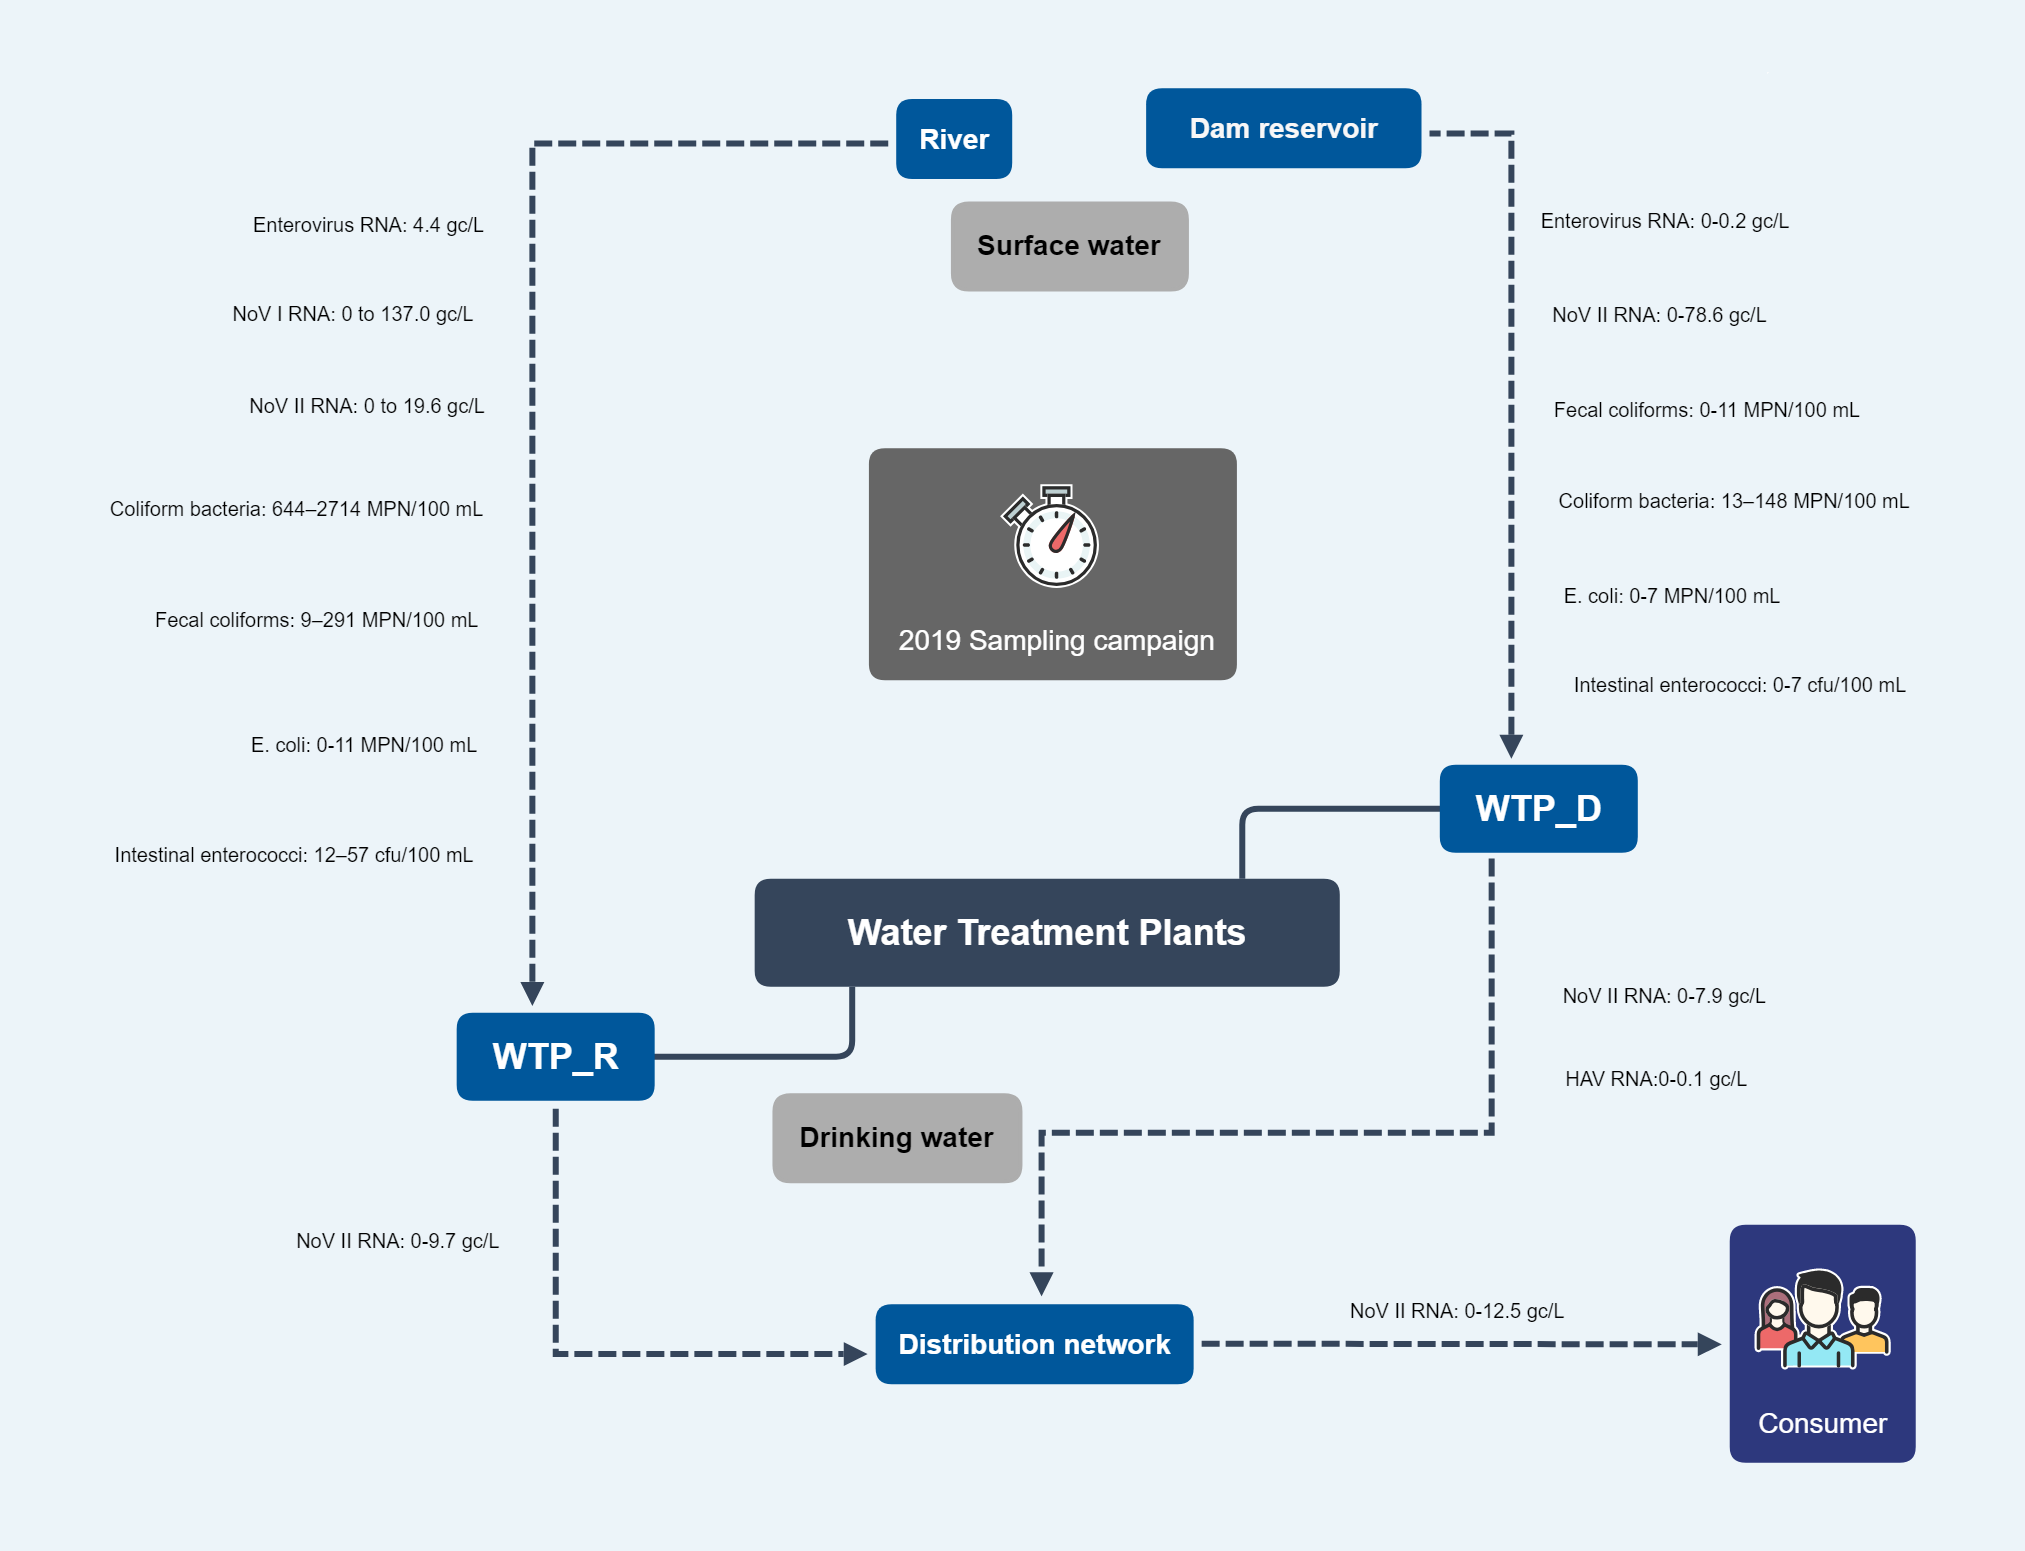
2.1. Sampling Sites of Surface Water and Drinking Water

The surface water samples came from two bodies of water: a river and a dam reservoir. They were sampled in two locations: at the abstraction site in the case of the river, and the inlet of the WTP in the case of the dam reservoir. The river has a length of 1007 km, its natural water is used for hydroelectric energy production, irrigation, fishing activity, navigability, and human supply [46]. The dam reservoir has a maximum capacity of 1,095,000 dam3, and it is a source of water for 2 million people, which represents about one fifth of the Portuguese population; its water is used for energy production, recreational use, and human supply [46]. The two water bodies belong to the same district and the same hydrographic basin with a total area of 3964.56 km2 [46]. While the water from the dam reservoir has an origin independent of the river, the river receives the water discharged from the dam reservoir, at a location upstream from the sampling site included in this survey. The areas surrounding the dam reservoir are characterized by the existence of forest, agricultural fields, dispersed human populations, agro-livestock units (mainly raising pigs), and some industries. The area surrounding the sampling site in the river is characterized by the existence of a great extension of agricultural fields, agro-livestock units (raising pigs, cows, goats, and sheep), and industries [47]. The monitoring of the water in previous years showed a higher level of bacterial and chemical contamination in the river than in the water of the dam reservoir (unpublished data).
The water from the river and dam reservoir was treated at WTP_R and WTP_D, respectively. The WTPs used different treatment schemes, as described in Salvador et al. (2020) [48], the main differences being in the first pre-oxidation step, carried out with ozone in WTP_R and with chlorine in WTP_D; and the inclusion of an adsorption step with activated carbon, in WTP_R. Both WTPs include a final disinfection with chlorine. The sampling of drinking water occurred at the outlet of the two WTPs and at one representative site in the water distribution network fed by both.

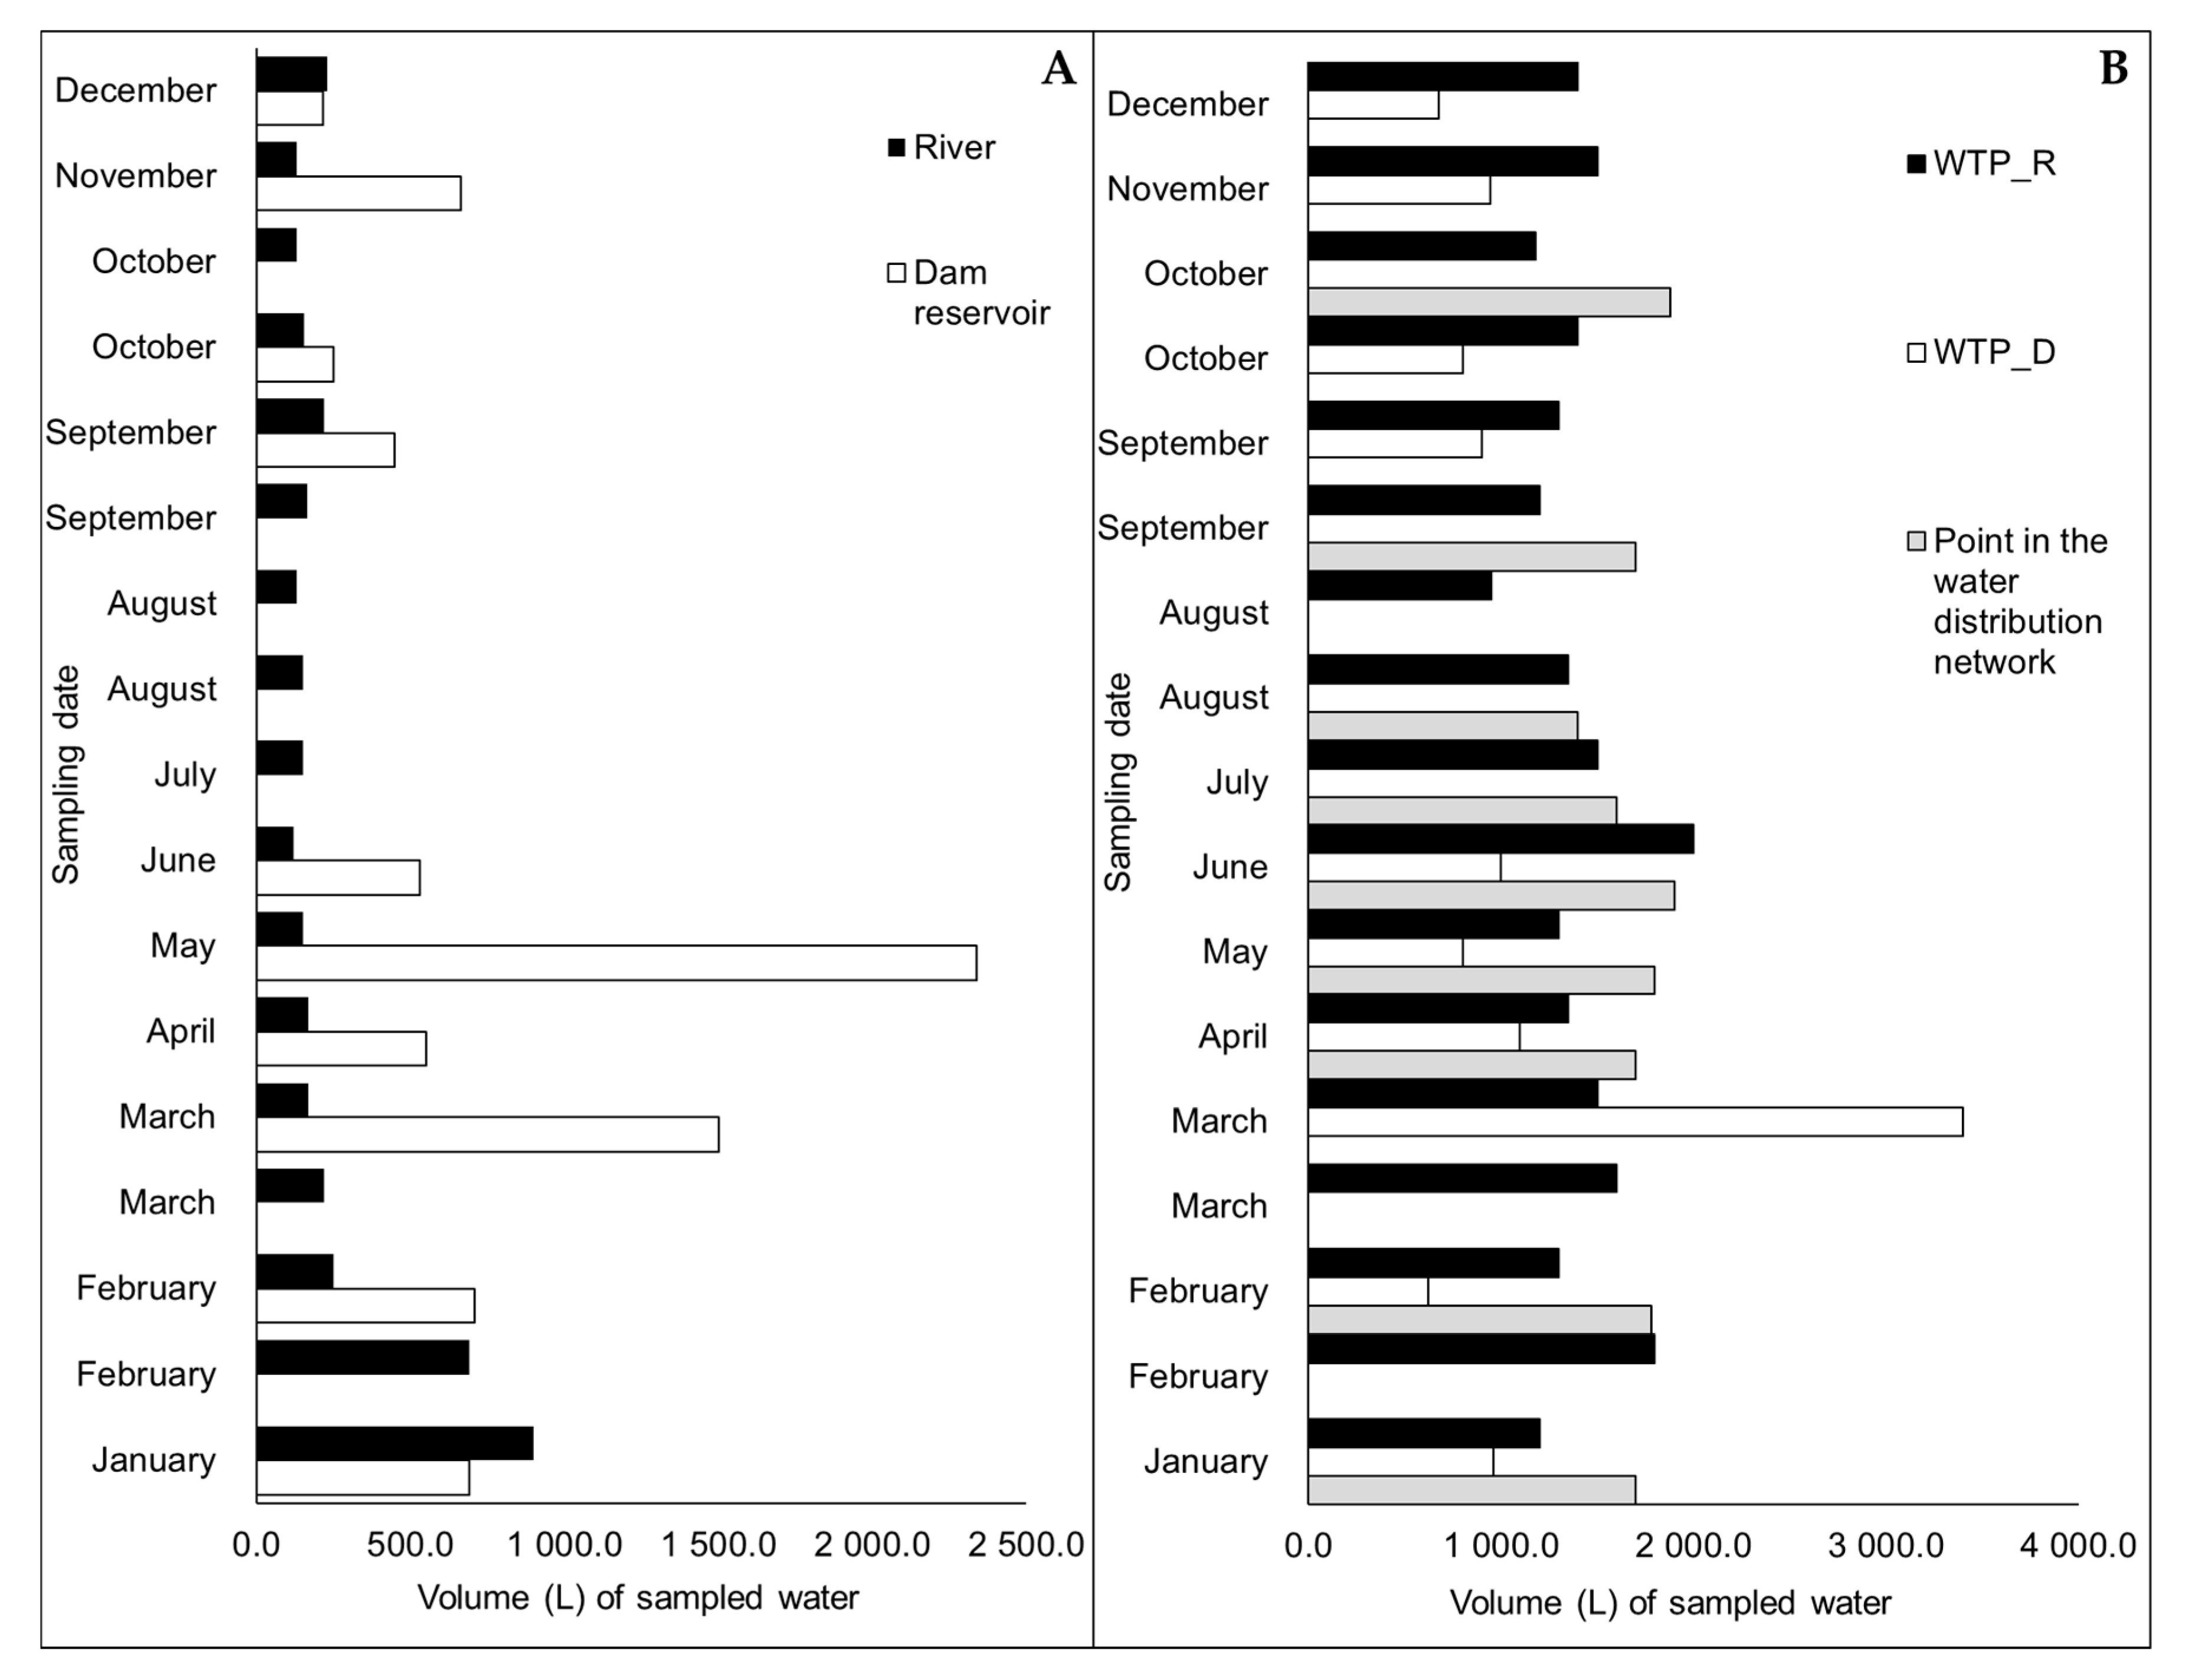
2.2. Sample Collection

The water sampling campaign was carried out between January and December 2019, usually consisting of one sampling per month. On the same day, samples were collected for the detection/quantification of enteric viruses, quantification of FIB, and physical-chemical characterization. Concerning the sampling intended for enteric virus detection, there were some exceptions: biweekly sampling at the river and WTP_R sites in some months and absence of sampling at the dam reservoir and WTP_D sites in July and August (Figure 1). Large volumes of water were collected at the sampling sites (Figure 1) and concentrated by filtration thru Nanoceram filters (Argonite; Sanford, FL, USA) set up in housing chambers [49]. The filtered volumes followed Method 1615 (EPA/600/R-10/181) [50], but were subjected to variations, mainly depending on the occurrence of membrane clogging. The average volumes of water concentrated were 243.2 L for the river, 790.0 L for the dam reservoir, and largely higher for the drinking water collected at the different sites: 1490.0 L for WTP_R, 1120.0 L for WTP_D, and 1717.8 L for the sampling point in the network distribution (Figure 1). For detection and quantification of FIB, a volume of 1 L was collected in a sterile polyethylene container (Labinox, Esmoriz, Portugal) with sodium thiosulfate to inactivate chlorine. For determination of pH, 250 mL of water was collected in glass containers. The collected samples were transported refrigerated to the laboratory. Determinations of temperature and chlorine were carried out at the sampling site.

2.3. Detection and Quantification of Enteric Viruses’ Genomic RNAs

Most of the procedures followed in this study were performed as described in Salvador et al. (2020) [48]. Briefly, the Nanoceram filters (Argonite; Sanford, FL, USA) with the samples of concentrated water were eluted with beef extract (BD Bioscience; Franklin Lakes, NJ, USA) and the eluted solutions were subjected to an organic flocculation process followed by centrifugation and filtration through 0.22-μm pore-size Acrodisc Syringe filters (PALL Corporation; Ann Arbor, Michigan, USA). The resulting volumes were aliquoted and kept at −70 °C, until use. In a second step, thawed samples of about 20 mL were applied to Vivaspin concentrators (Sartorius; Goettingen, Germany) and centrifuged at 8000× g and 4 °C for 6 h, until a volume of less than 1 mL was achieved in each sample. The final concentrates were subjected to RNA extraction and purification, using the viral QIAamp RNA Mini kit (Qiagen; Hilden, Germany), according to the manufacturer’s instructions.
RT-qPCR reactions were performed on a StepOnePlus thermocycler (Applied Biosystems; Foster City, CA, USA). Enterovirus genesig Advanced Kit (PrimerdesignTM Ltd.; Chandler’s Ford, United Kingdom) was used for detection and quantification of Enterovirus in reaction mixtures of 20 µL containing 5 µL of extracted RNA. For HAV and NoV the CeeramTools Hepatitis A Kit, CeeramTools NorovirusGI Kit and CeeramTools NorovirusGII Kit (all purchased from bioMérieux; Marcy-l’Etoile, France) were used in reaction mixtures of 25 μL containing 5 μL of extracted RNA. The amplification conditions are described in Table 1. Enterovirus, NoV I, NoV II, and HAV genomic RNAs were quantified by standard curves with five points, constructed with 1:10 serial dilutions of standard RNAs acquired in Standard kits from CeeramTools (bioMérieux; Marcy-l’Etoile, France). Each RT-qPCR result, expressed in genomic copies (gc) per five microliters of RNA, is the average value of two independent amplifications and was converted into genomic copies per liter of collected sample (gc/L). Only results that met the quality requirements specified by the kits referred above were validated. Only samples with Cq (cycle quantification) values below 40 were considered positive.

2.4. Quantification of Fecal Indicator Bacteria (FIB)

2.4.1. Coliform Bacteria and E. Coli

The procedure for quantifying coliform bacteria and E. coli in surface water was based on the international standard method ISO 9308-2 [51] using the Colilert test with Quanti-Tray (IDEXX Laboratories, Westbrook, TX, USA), at 36 °C. The results were expressed in the most probable number per 100 mL (MPN/100 mL). The procedure for quantifying coliform bacteria and E. coli in drinking water was based on the international standard method ISO 9308-1: 2014 [52]. Briefly, a 100-mL aliquot of water sample was filtered through a 0.45 μm cellulose-ester membrane (Pall Life Sciences; Westborough, MA, USA) placed over a plate with medium CCA (Chromogenic Coliform Agar) (OXOID Limited; Wade Road, United Kingdom) that was incubated at 36 ± 2 °C for 21 ± 3 h. Positive β-D-galactosidase colonies (pink or red) were presumed to be colonies of coliform bacteria. These colonies were then cultured on non-selective nutrient agar (Yeast Extract Agar, OXOID Limited; Wade Road, United Kingdom) at 36 ± 2 °C for 21 ± 3 h. After the incubation time, the cytochrome c oxidase test (Abtek Biologicals Ltd.; Liverpool, United Kingdom) was performed. The oxidase negative colonies were confirmed as coliform bacteria and positive β-D-galactosidase colonies (dark blue or violet) were counted as E. coli. The results were expressed in colony forming units per 100 mL (cfu/100 mL).

2.4.2. Fecal Coliforms

Quantification of fecal coliforms in surface water samples was performed using the Colilert test with Quanti-Tray (IDEXX Laboratories; Westbrook, TX, USA) at 44.5 °C, following the manufacturer’s instructions. The results were expressed in MPN/100 mL. The quantification of fecal coliforms in drinking water samples was performed by filtration of a 100-mL aliquot through a 0.45 μm cellulose-ester membrane (Pall Life Sciences) that was placed on a plate with Lauryl culture medium (MLSA, OXOID Limited; Wade Road, United Kingdom) and incubated at 44 ± 0.5 °C for 21 ± 3 h. Yellow and orange colonies were transferred to non-selective nutrient agar medium (Yeast Extract Agar, OXOID Limited; Wade Road, United Kingdom) and incubated at 36 ± 2 °C for 21 ± 3 h. After incubation, the cytochrome c oxidase test (Merck; Darmstadt, Germany) was performed. The negative oxidase colonies were incubated in DEV - Fluorocult (Biogerm; Maia, Portugal) culture medium at 44 ± 0.5 °C for 21 ± 3 h. After this period, fecal coliforms were quantified as those that changed the medium color to yellow, due to lactose fermentation. The results were expressed in cfu/100 mL.

2.4.3. Intestinal Enterococci

The procedure for quantifying intestinal enterococci was based on the international standard method ISO 7899-2 [53]. A 100-mL water sample was filtered through a 0.45 μm cellulose-ester membrane (Pall Life Sciences). The membrane was placed over a plate with selective Slanetz and Bartley agar medium (VWR Chemicals; Radnor, PA, USA), and incubated at 36 ± 2 °C for 44 ± 4 h. Membranes containing red, brown, or pink colonies were transferred to bile esculin agar medium (Merck; Darmstadt, Germany) and incubated at 44 ± 0.5 °C for 2 h. Black colonies with the capacity to reduce 2,3,5-triphenyltetrazolium chloride to hydrolase esculin were counted after two hours as intestinal enterococci. The results were expressed in cfu/100 mL.

2.5. Determination of Physical-Chemical Parameters

The physical-chemical parameters included in this study (temperature and total chlorine concentration) were determined in situ at the sampling moment. The values of temperature were obtained using Model E 905 000 thermometers (Amarell-Electronic; Kreuzwertheim, Germany). The determination of total chlorine concentration in drinking water samples was performed by molecular absorption photometry, using a portable photometer (Palintest; Gateshead, United Kingdom) [54]. The pH was determined at the laboratory in a 785 DMP Titrino equipment (Metrohm; Herisau, Switzerland) [55].

2.6. Statistical Analyses

Data processing and statistical analysis were performed using Microsoft Excel 2017 (Microsoft Inc., Redmond, WS, USA) and IBM SPSS Statistics Version 26 (IBM Corporation; Armonk, New York, NY, USA). Spearman correlation coefficient was used to evaluate the correlations involving the following parameters: enteric viruses detected, microbiological data, and physicochemical data. The correlations were classified as strong (r > 0.90), moderate (0.40 < r < 0.89) or weak (r < 0.39) [5].

3. Results

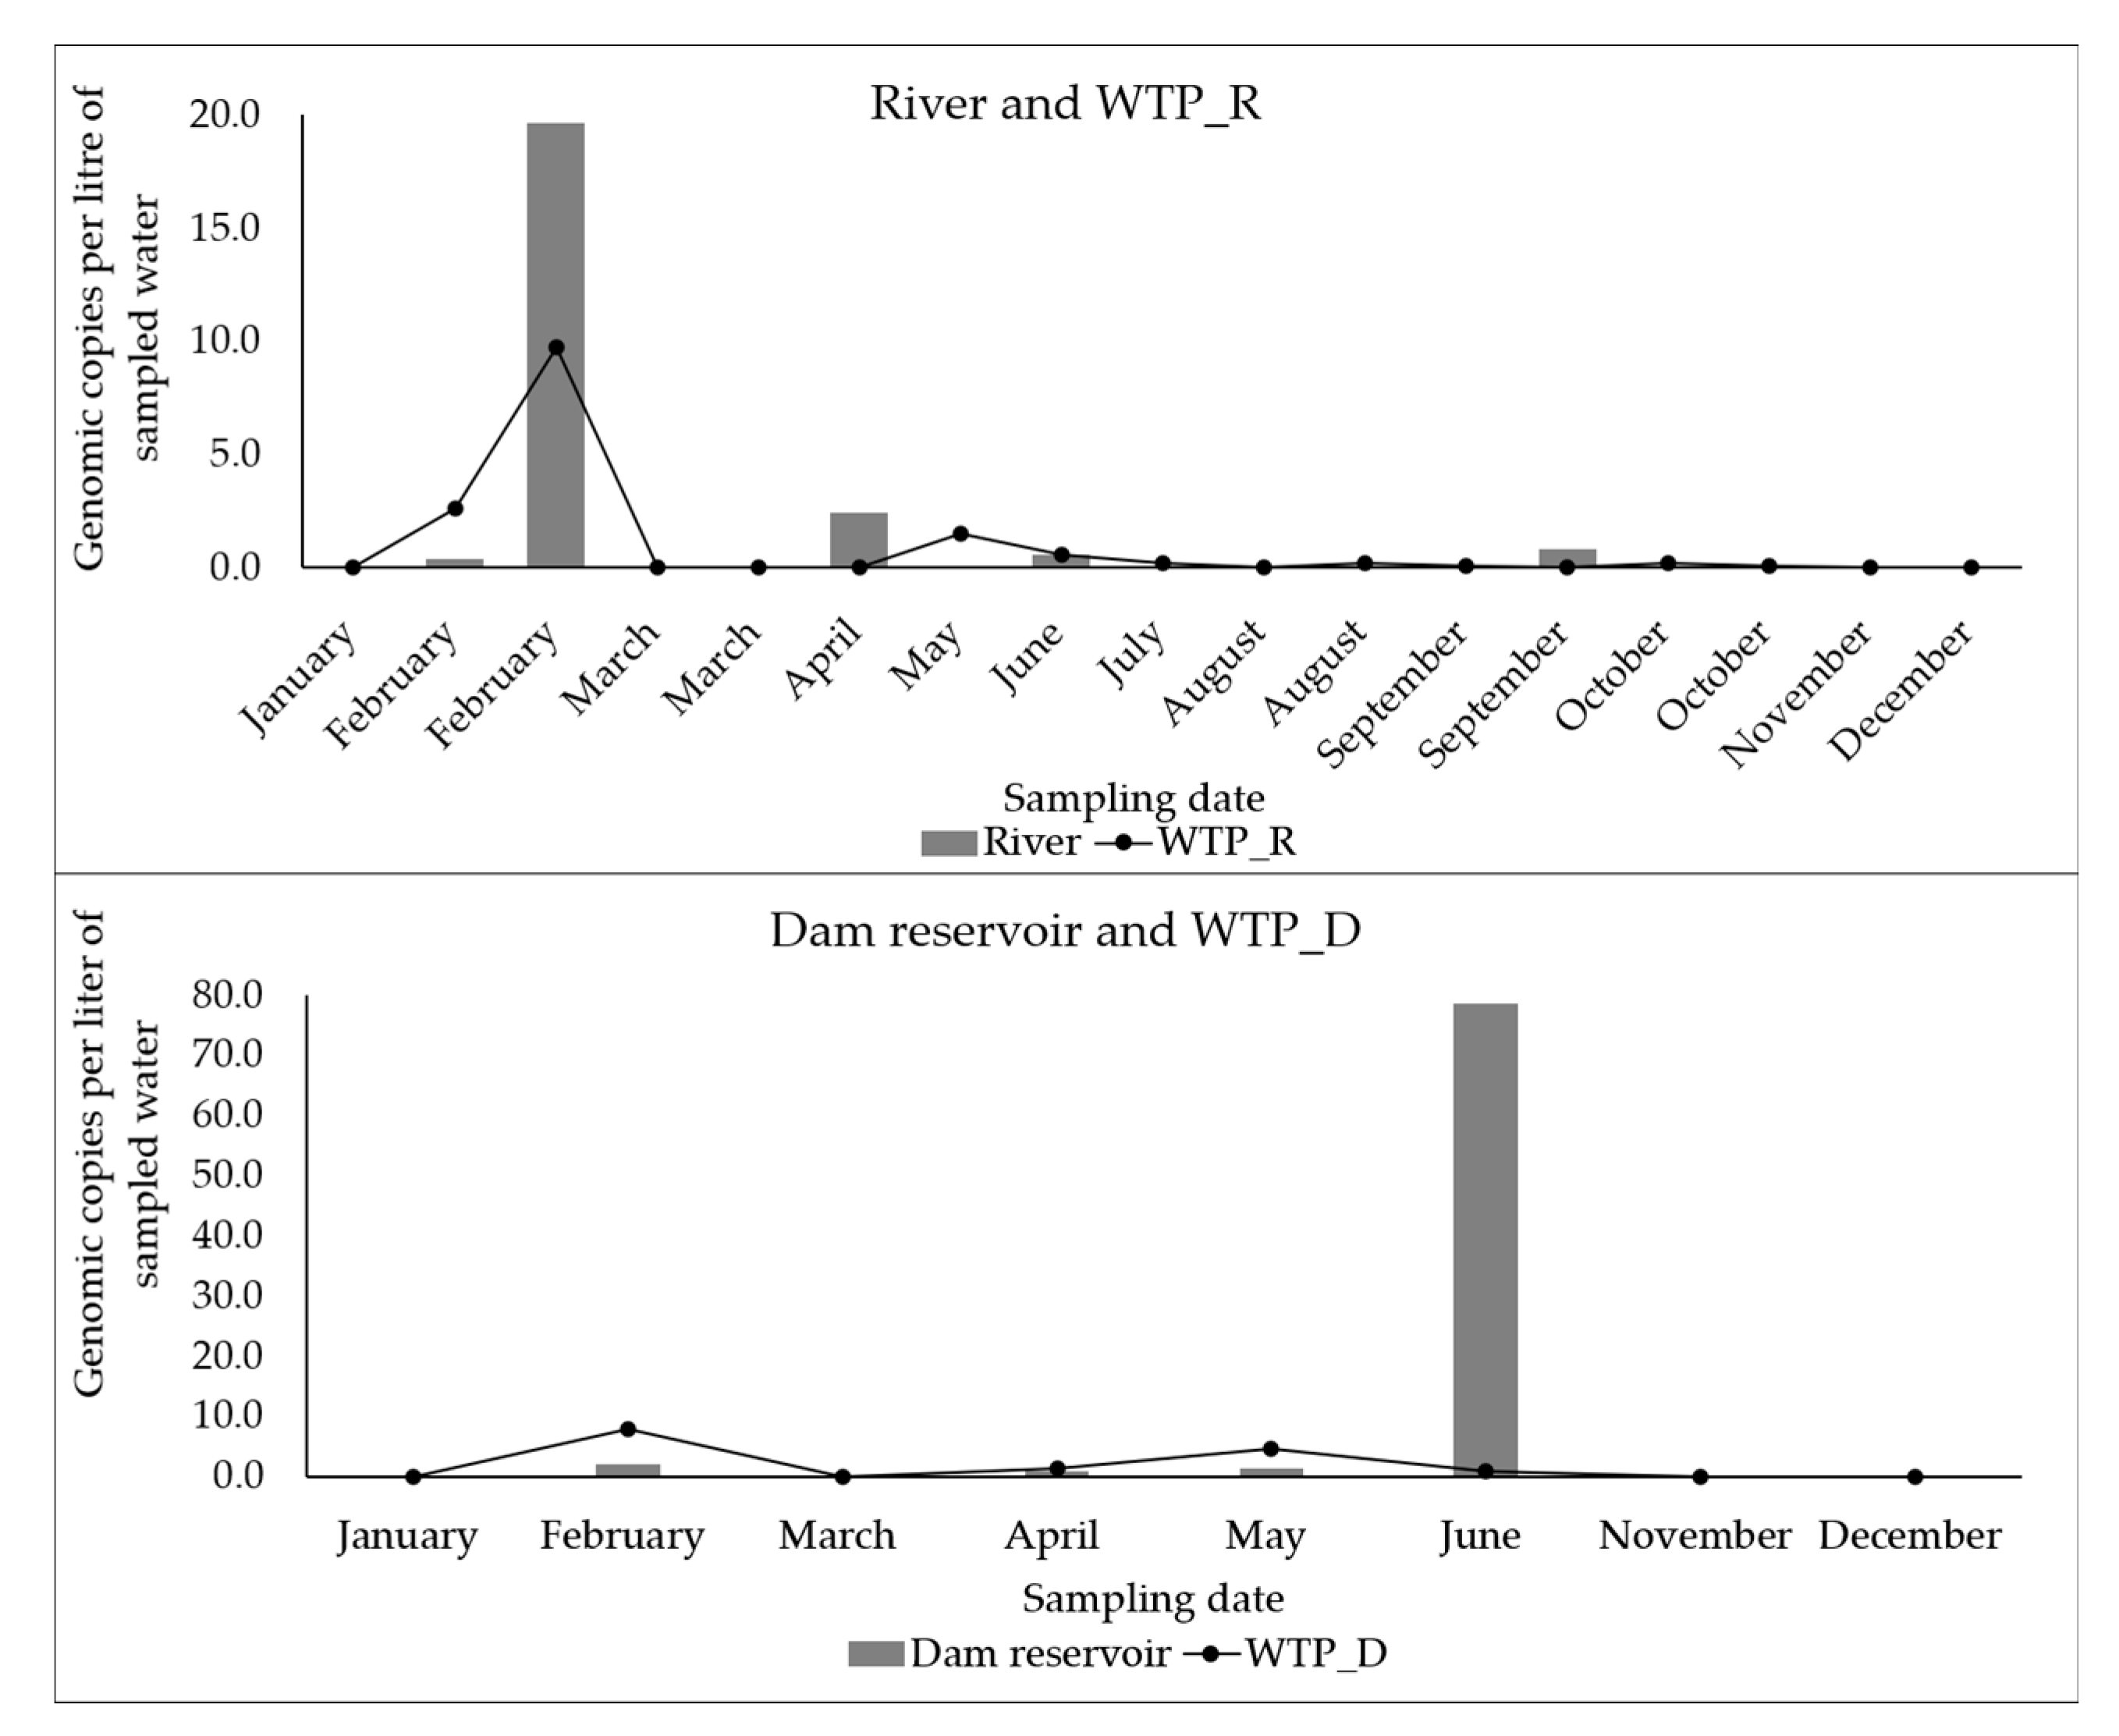
3.1. Detection and Quantification of Enteric Viruses

In surface water samples, viral RNAs were detected in 14 (51.9%) out of a total of 27 samples: 9/17 in the river and 5/10 in the dam reservoir (Table 2). Of the nine positive samples collected in the river, NoV I RNA was the most frequently detected, at 137.0 gc/L in one sample, and at concentrations not greater than 11.6 gc/L in the other five. NoV II RNA was detected at 19.6 gc/L in one sample and at 2.4 gc/L or less in the other four samples, and Enterovirus RNA was only detected once, at 4.4 gc/L. Of the five samples positive from the dam reservoir, four were positive for NoV II RNA, detected at 78.6 gc/L in one sample and at 2.0 gc/L or below in the others. Enterovirus RNA was detected in one sample, at 0.2 gc/L (Table 2).
Regarding the drinking water samples, viral RNAs were detected in 21 (58.3%) out of a total of 36 samples, distributed among the three sampling points, as follows: 9/17 at WTP_R, 6/10 at WTP_D, and 7/9 at the distribution network (Table 2). At WTP_R, only Nov II RNA was detected (nine samples), with a concentration that varied between 0.1 and 9.7 gc/L. At WTP_D, Nov II RNA was detected in five samples, at a maximum concentration of 7.9 gc/L, and HAV RNA in one sample, at 0.1 gc/L. At the sampling point in the distribution network, seven samples were positive for NoV II RNA, detected at concentrations ranging between 0.1 and 12.5 gc/L (Table 2).

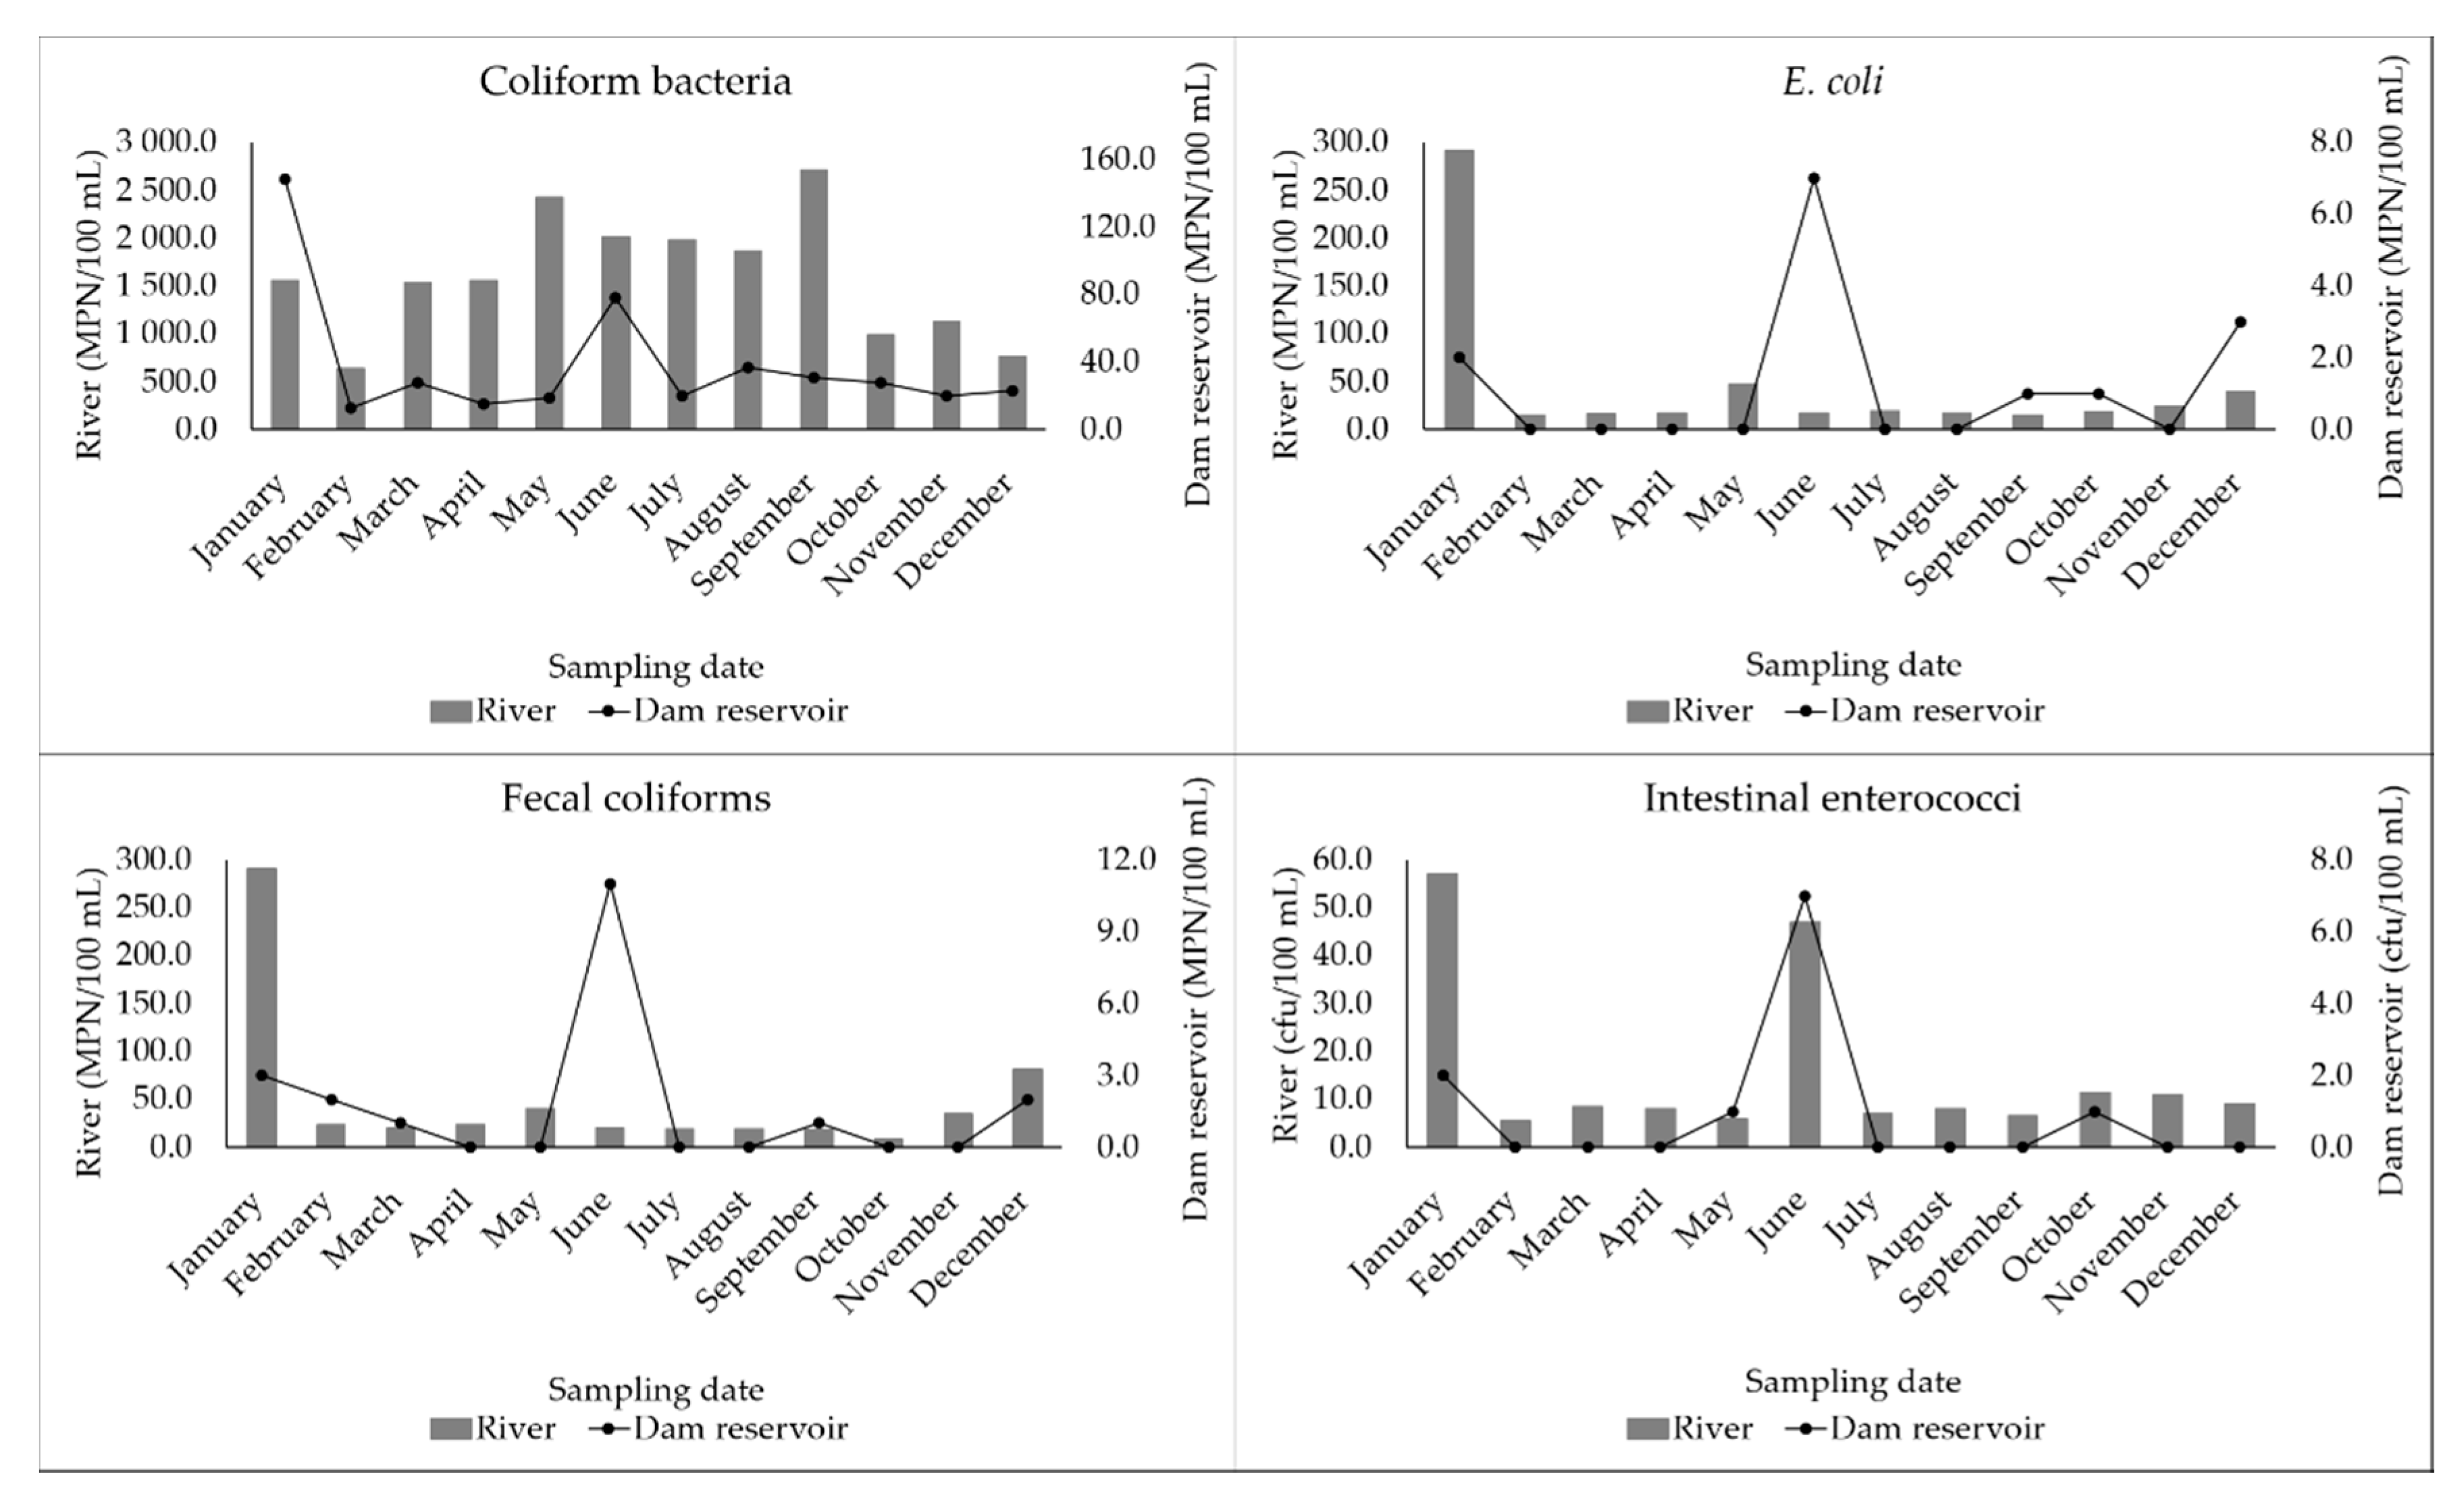
3.2. Fecal Indicator Bacteria (FIB) Quantified in Water Samples

From the 24 surface water samples analyzed, coliform bacteria were detected in all (100.0%), fecal coliforms in 18 (75.0%), E. coli in 17 (70.8%), and intestinal enterococci in 16 (66.7%). The fecal contaminants under survey were not detected in the three sampling points of drinking water.
Coliform bacteria were detected throughout the sampling campaign, in concentrations of 644–2714 MPN/100 mL in the river and 13–148 MPN/100 mL in the dam reservoir (Figure 2). Fecal coliforms were detected in the river, throughout the 12 months of the sampling campaign, at concentrations of 9–291 MPN/100 mL, whilst in the dam reservoir they were detected in six of the twelve months, at a maximum concentration of 11 MPN/100 mL (Figure 2). E. coli was detected in the river, throughout the sampling campaign, at 291 MPN/100 mL in January and under 50 MPN/100 mL in the other months. In the dam reservoir, E. coli was detected in five months, at concentrations ranging from 1 to 7 MPN/100 mL (Figure 2). Intestinal enterococci were also detected during the 12 months of the sampling campaign, in the river at 12–57 cfu/100 mL and during four months in the dam reservoir, at concentrations below 7 cfu/100 mL (Figure 2).

3.3. Evaluation of the Effectiveness of the WTPs in the Reduction of Enteric Viruses and FIB

Enterovirus and NoV I RNAs, detected in samples from the river, were not detected in the water samples collected at the outlet of WTP_R. Results concerning NoV II RNA varied from total elimination to absence of elimination and slight “increments” were also detected; HAV RNA was not detected in both water matrices (Figure 3, river and WTP_R).
Although Enterovirus RNA was detected in one sample from the dam reservoir, it was not found in the drinking water collected at the outlet of WTP_D. NoV II RNA evidenced a 98.9% decrease after treatment in a single sample, and no decrease or slight increments in the remaining samples; HAV RNA, not previously detected in dam reservoir samples, was detected in a drinking water sample of WTP_D, at 0.1 gc/L (Figure 3, dam reservoir and WTP_D).
Although present in the two surface water sources surveyed, FIB were not detected in drinking water.

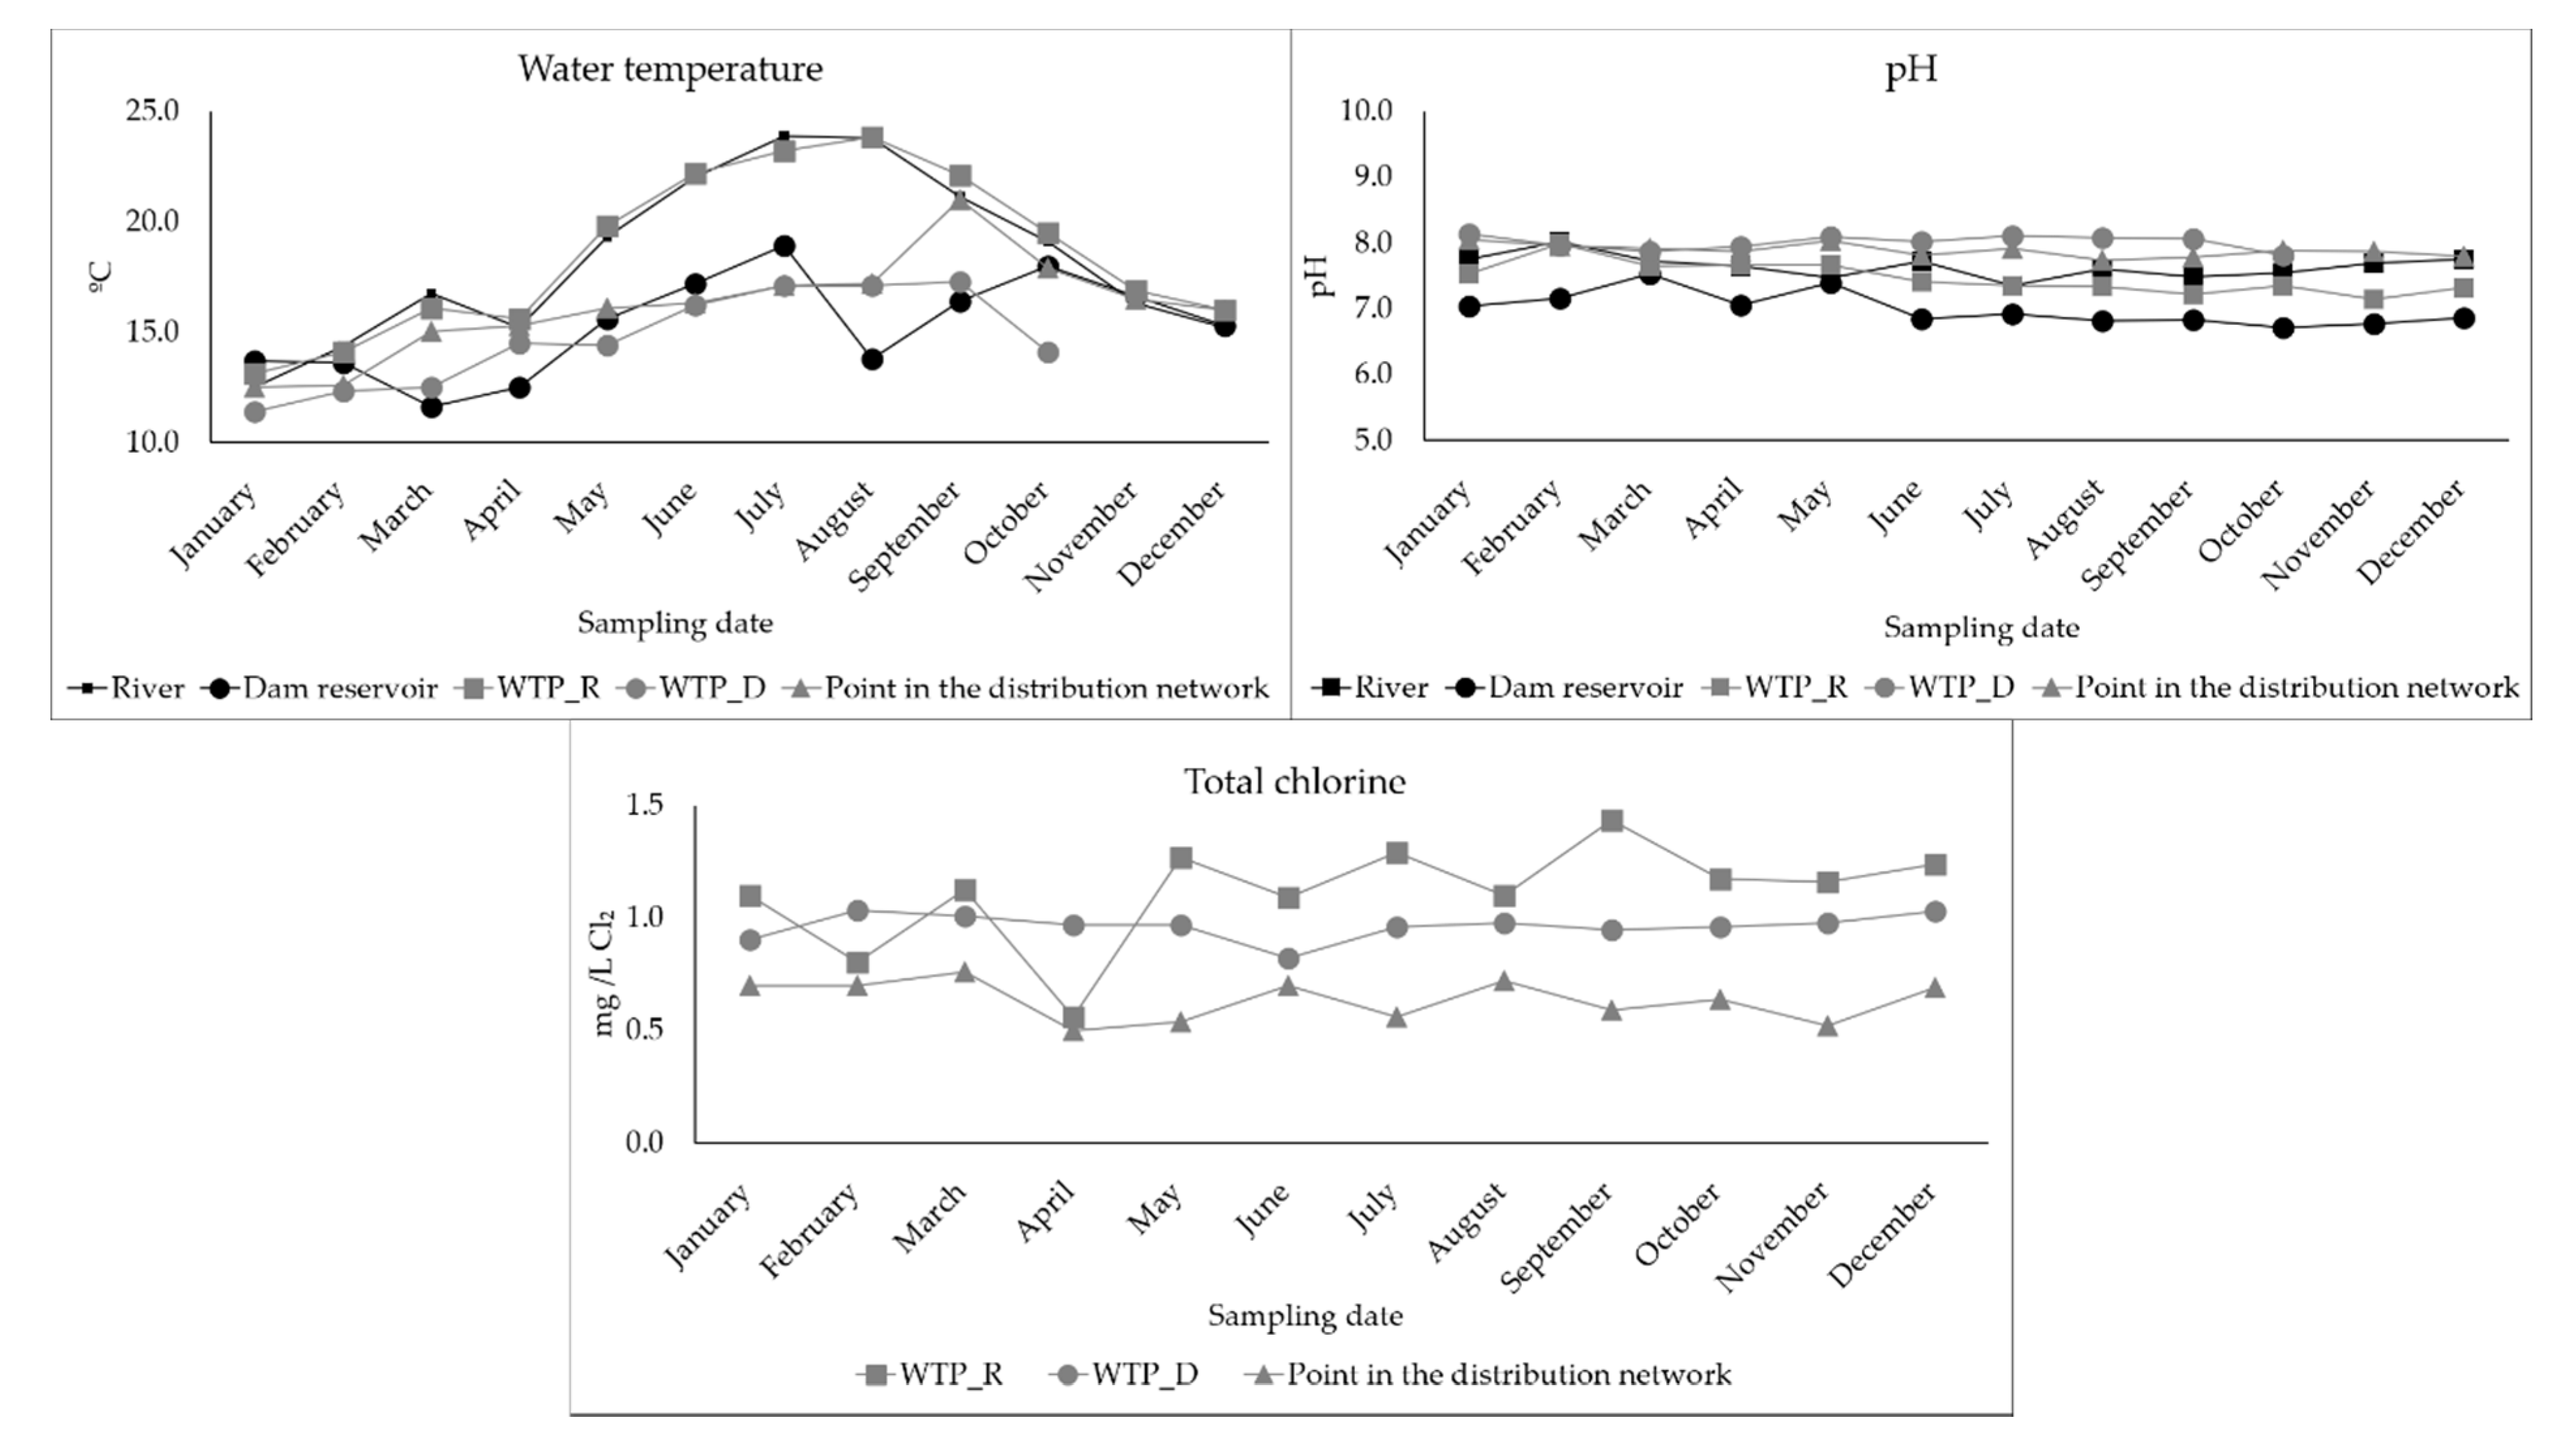
3.4. Determination of Physical-Chemical Parameters in the Waters Surveyed

Between January and December, 24 samples of surface water and 36 samples of drinking water were collected for analyses of temperature, pH, and total chlorine concentration (Figure 4). The water temperatures varied between 12.5 and 23.9 °C on the river and WTP_R, between 11.6 and 18.9 °C in the dam reservoir and WTP_D, and between 12.5 and 21.0 °C at the sampling point in the water distribution network (Figure 4). The pH was similar along the sampling campaign on the river and WTP_R (7.4–8.0 and 7.1–8.0, respectively) while on the dam reservoir and WTP_D an increase was detected after the treatment (6.7–7.5 and 7.8–8.1, respectively); at the point in the distribution network, the pH of the drinking water samples was similar over the 12 months (7.7–8.1) (Figure 4). The surface waters under study did not contain chlorine. The average values of the total chlorine concentration were 1.1 mg/L Cl2 in the water sampled at WTP_R, 1.0 mg/L at WTP_D, and 0.64 mg/L at the sampling point in the water distribution network (Figure 4).

3.5. Evaluation of Correlations between the Various Parameters under Study

The enteric viruses detected in this study did not evidence any correlation with the microbiological (coliform bacteria, E. coli, fecal coliforms, intestinal enterococci) and the physical-chemical parameters under study (temperature, pH, total chlorine), except that NoV I detection/quantification showed a moderate positive correlation with intestinal enterococci (r = 0.48; p < 0.001) (Table 3). On the other end, correlations were found between the microbiological parameters, except for intestinal enterococci (Table 3). The concentration of coliform bacteria evidenced a strong positive correlation with fecal coliforms concentration (r = 0.92; p < 0.001), as well as with the concentration of E. coli (r = 0.92; p < 0.001); moderate negative correlations with pH (r = −0.45; p < 0.001) and concentration of total chlorine (r = −0.85; p < 0.001); and a weak positive correlation with temperature (r = 0.30; p = 0.017). The concentration of fecal coliforms showed a strong positive correlation with E. coli concentration (r = 0.94; p < 0.001), a moderate negative correlation with the concentration of total chlorine (r = −0.76; p < 0.001), and a weak negative correlation with pH (r = −0.39; p = 0.002). Besides, E. coli concentration evidenced moderate negative correlations with pH (r = −0.41; p = 0.001) and total chlorine concentration (r = −0.73; p < 0.001). Among the physical-chemical parameters, pH had a weak negative correlation with temperature (r = −0.45; p < 0.001) and a weak positive correlation with total chlorine concentration (r = 0.36; p = 0.003).

4. Discussion

During 2019, the surface water that feeds two WTPs was subjected to a sampling campaign to monitor FIB and genomic RNAs from enteric viruses. Drinking water collected at the outlet of those WTPs and in the distribution network was also monitored, thus enabling the evaluation of the WTPs efficacy in the elimination of viral RNA.
RNA from at least one of the viruses under study was detected in about half of the surface water samples collected, being NoV I RNA the most common and exclusive to the river, where it was detected at 0.2–137.0 gc/L. NoV II and Enterovirus RNAs were detected in both bodies of water, NoV II frequently at low concentrations (<20 gc/L) with one exception in each, but not exceeding 78.6 gc/L; Enterovirus RNA was only detected once in each body of water, and at low concentrations (4.4 gc/L and 0.2 gc/L).
RNA from representative of these two viral genera had already been detected in surface water, in other countries. Enterovirus was detected in three inland freshwater beaches in the USA [15]; NoV I, NoV II, and Enterovirus were detected in water samples from the River Seine in France [56]; and recently NoV was detected in water samples from six major rivers in Alberta in Canada [57]. When quantified, in the studies referred above, the median viral loads varied between 102 and 103 gc/L for NoV I and NoV II, whereas for Enterovirus they were under 102 gc/L. NoV II was more often detected than NoV I, as in our study. Despite this similarity, the viral RNA concentrations found in the present study were always lower, thus meaning lower levels of contamination. HAV RNA, not detected in the present study in surface waters, was detected in Peri Lagoon in Brazil [58] at relatively high concentrations (1.1 × 10² to 4.3 × 10³ gc/L). In Portugal, Teixeira et al. (2020) [44] did not detect viruses in superficial water intended for drinking water production, but Salvador et al. (2020) [48] reported, for surface water samples included in this study (from the river and the dam reservoir), the detection of hepatitis E virus (HEV), which is an enteric virus not included in the present study.
As for surface water, about half of the drinking water samples also proved to be positive for viral RNA, always at low concentrations (under 12.5 gc/L). In this water matrix, only NoV II and HAV RNAs were detected, NoV II most frequently and at all three sampling points. HAV RNA was only detected in one water sample from WTP_D and at a low concentration (0.1 gc/L).
In Portugal, NoV and HAV RNAs had not yet been found in drinking water, namely in a recent study [44]. However, another enteric virus (HEV) was detected in the drinking water sampled in this study, as was already referred to above for surface water samples [48]. Concerning other countries, Kukkula et al. (1999) [35] detected NoV II RNA in drinking water from various sources in Finland and, more recently, Blanco et al. (2017) [36] detected NoV I and NoV II RNA in drinking water in Spain, in concentrations (327.0–660.0 gc/L) higher than in the present study. RNA from HAV, detected in this study, had already been detected in treated waters in several municipalities in Colombia [21], together with Enterovirus RNA.
Concerning the detection of FIB, the water from the river always presented higher concentrations in comparison to the dam reservoir, also evidencing a larger temporal distribution throughout the sampling campaign. The differences found in fecal contamination can be explained by the location of the sampling point in the river, near places of industries, agriculture, and animal farming activities [47], where manure is still used as fertilizer. Fecal contamination may reach the river either through permeabilized soils or by direct drainage [59,60]. Only coliform bacteria were continuously detected in both water sources. In the surface water of the dam reservoir, there was a peak of maximum concentration of fecal coliforms, E. coli, and intestinal enterococci in June, as well as for NoV II RNA. This result may be associated to some illegal untreated wastewater discharges, higher air temperatures, or both, associated to absence of rainfall (characteristics of summer) that may have caused a decrease in the reservoir level and, consequently, a “concentration” of the elements in suspension in the water matrix. In other countries, the detection of FIB in surface water has also been reported: in Mexico, Megchún-García et al. (2015) [61] detected total coliforms and E. coli; in Kenya, Onyango et al. (2018) [62] detected FIB and, more recently in Nigeria, Olasoji et al. (2019) [63] detected coliform bacteria. In the studies referred to above, FIB were detected in considerably higher concentrations, indicating that, although there are bacteria associated with fecal contamination in these two surface water sources in Portugal, they consistently appeared at lower concentrations than in other countries with higher levels of pollution [44,62]. FIB were not detected in drinking water sampled in this survey, thus confirming the efficacy of the two WTPs in eliminating them. This was an expected result due to the permanent surveillance over the water for human consumption in Portugal, where the legislation [42] is being rigorously enforced.
Evaluating the efficacy of the WTPs in decreasing viral RNA concentration, it was found effective for Enterovirus and NoV I. However, while HAV RNA was not detected in dam reservoir samples, its detection occurred once, yet at a low concentration, in the drinking water of WTP_D. Although bearing in mind that RNA concentration was always normalized to the volumes of sampled water, its detection may have been due to the considerably higher volumes of drinking water sampled (620 L in this particular sample of WTP_D), relative to surface water (Figure 1), thus increasing the possibility of finding viruses in this water matrix [48,64]. In relation to NoV II RNA, the results evidenced its resistance to water treatment, although its decrease was very variable, having even been detected in drinking water a few months after its detection in the surface water that feeds the WTP. This result, like the one concerning HAV, may be explained by the disproportionality in the volumes of sampled water (as suggested above, for HAV), and by differences in water matrices’ characteristics, which may influence the performance of the RNA extraction procedures, eventually leading to RNA degradation. The fragility of RNA molecules that can degrade in a complex experimental procedure [65] such as the one followed in this survey is well documented. Water matrix interfering materials, besides possible effects on the recovery of viral RNA may also cause inhibition in RT-qPCR reactions [48,66,67]. To assess the possible inhibition in each reaction, internal amplification controls were used to allow the identification of eventual false negatives [68]. The referred influence of the characteristics of the water matrix on viral RNA recovery rate was reported in the study by Salvador et al. (2020) [48], where the RNA recovery from a process control virus (Mengo virus), introduced during the water sampling process, was low in drinking water samples (under 20%) but even lower in surface water samples (under 5%).
The volumes of water sampled, although following Method 1615 [50], always depended on the characteristics of the water matrix at the time of sampling; an attempt was made to filter as much water as possible, to guarantee greater reliability in the monitoring [69]. This option caused a considerable variation in the volumes of filtered water, even among samples from the same matrix, as previously mentioned.
Globally, in respect to the efficacy of the two WTPs in the elimination of waterborne pathogens, our results evidence the need to monitor this water matrix and carry out further assessments, also contemplating research of viral infectivity, not addressed in the present study. This is particularly relevant when viral RNA is detected since it may or may not be infectious. The answer to this question is what matters to public health, as viral RNA may be detected by RT-qPCR even when a reasonable degree of degradation is present. These concerns are supported by the recent finding of infectious HEV in drinking water sampled in large volumes, as occurred in the present study [48].
Concerning the correlations between enteric viruses and FIB, only a single moderate positive correlation was found between NoV I RNA and intestinal enterococci, although the RNA of this virus was only detected in samples from the river. In a recent study, Teixeira et al. (2020) [44], also found a moderate positive correlation, but between NoV I RNA and fecal coliforms. The absence of correlations between enteric viruses and FIB was an expected result, due to the 21 drinking water samples positive for viral RNA where FIB were not found. Additionally, and expected due to the high rates of viability in the environment attributed to enteric viruses [39], no significant correlations were found between enteric viruses and the physical-chemical water parameters evaluated, contrary to bacteria, sensitive to variations in temperature and pH [7,37].
In what concerns FIB inter-correlations, strong positive correlations were only found for total coliforms, either with fecal coliforms or with E. coli, like has been consistently reported [70] and explained by their actual relationships. The weak positive correlation between concentration of fecal coliforms and temperature is in line with the results of Addo et al. (2016) [71], as this factor affects the growth rate of these microorganisms. The high/moderate negative correlation between coliform bacteria, both with pH and chlorine concentration, emphasize the importance of these two physical-chemical parameters in the control of these pathogens in water [62].
In the context of the results discussed above, it is of major importance to consider the insertion of enteric viruses, in addition to FIB, in the mandatory analysis of water quality [44,45].

5. Conclusions

Enteric viruses have a high impact on human health and in the emergence of waterborne diseases. Among the several routes of transmission, water is of crucial importance, especially in the context of climate change and increased pressure on the quality and quantity of this resource.
Similarly reported for other countries, genomic RNAs of the viruses under survey were also detected in Portugal, in surface and drinking waters. These results confirmed other studies proposing that these emergent viruses should be monitored together with fecal indicator bacteria (FIB), already included in mandatory surveys. This proposal is reinforced by the absence of significant correlations between enteric viruses and FIB.
Our results also evidenced that studies like this one should be reinforced in the future, also targeting viral infectivity, other waterborne pathogenic viruses, and other water matrices (i.e. groundwater and treated wastewater).

Author Contributions

Conceptualization, C.N., M.F.C., and D.S.; methodology, C.N., M.F.C., and D.S.; validation, D.S., M.F.C., and C.N.; formal analysis, D.S., C.N., and M.F.C.; investigation, D.S., C.N., and M.F.C.; resources, D.S., C.N., and M.F.C.; data curation, D.S.; writing—original draft preparation, D.S.; writing—review and editing, M.F.C., C.N., F.S., R.N.C., and P.N.; visualization, D.S., M.F.C., C.N., and P.N.; supervision, C.N., M.F.C., and F.S.; project administration, C.N., M.F.C., and D.S.; funding acquisition, M.F.C., C.N., and R.N.C. All authors have read and agreed to the published version of the manuscript.

Funding

This research was funded by the Empresa Portuguesa das Águas Livres (EPAL) and the Foundation for Science and Technology (FCT) Portugal through a Ph.D. grant to D. Salvador (PDE/BDE/114582/2016) and financial support to CESAM and ISAMB (FCT/MCTES projects UIDP/50017/2020+UIDB/50017/2020 and UIDB/04295/2020, respectively) through national funds.

Acknowledgments

The authors are grateful to the microbiology team of the Lisbon Laboratory of EPAL for all the help in implementing the method, ISAMB/FMUL for financial support, and Francisco Caeiro for providing helpful comments and English revision.

Conflicts of Interest

The authors declare no conflict of interest.

References

  1. World Health Organization. Drinking-Water. Available online: https://www.who.int/news-room/fact-sheets/detail/drinking-water (accessed on 23 May 2020).
  2. Macy, J.T.; Quick, R.E. Transmission and prevention of water-related diseases. In Water and Health; Grabow, W., Ed.; EOLSS Publications: Oxford, UK, 2009; Volume I, pp. 104–107. [Google Scholar]
  3. Bouseettine, R.; Hassou, N.; Bessi, H.; Ennaji, M. Waterborne Transmission of Enteric Viruses and Their Impact on Public Health. In Emerging and Reemerging Viral Pathogens; Academic Press: Cambridge, MA, USA, 2020; Volume 21, pp. 907–932. ISBN 9789896540821. [Google Scholar]
  4. Ashbolt, N.J. Microbial Contamination of Drinking Water and Human Health from Community Water Systems. Curr. Environ. Health Rep. 2015, 2, 95–106. [Google Scholar] [CrossRef] [PubMed] [Green Version]
  5. Sibanda, T.; Okoh, A.I. Real-time PCR quantitative assessment of hepatitis A virus, rotaviruses and enteroviruses in the Tyume River located in the Eastern Cape Province, South Africa. Water SA 2013, 39, 295–304. [Google Scholar] [CrossRef] [Green Version]
  6. Eifan, S.A. Enteric Viruses And Aquatic Environment. Internet J. Microbiol. 2013, 12, 1–7. [Google Scholar]
  7. La Rosa, G.; Fratini, M.; della Libera, S.; Iaconelli, M.; Muscillo, M. Emerging and potentially emerging viruses in water environments. Ann. Ist. Super Sanità 2012, 48, 397–406. [Google Scholar] [CrossRef] [PubMed]
  8. World Health Organization. Guidelines for Drinking-Water Quality, 4th ed.; WHO: Geneva, Switzerland, 2017; pp. 1–541. [Google Scholar]
  9. USEPA Final CCL 4 Microbial Contaminants. Available online: https://www.epa.gov/ccl/contaminant-candidate-list-4-ccl-4-0 (accessed on 15 July 2020).
  10. Teixeira, P.; Salvador, D.; Brandão, J.; Ahmed, W.; Sadowsky, M.J.; Valério, E. Environmental and adaptive changes necessitate a paradigm shift for indicators of fecal contamination. Microbiol. Spectr. 2020, 8. [Google Scholar] [CrossRef] [Green Version]
  11. ICTV Picornaviridae. Available online: https://talk.ictvonline.org/ictv-reports/ictv_online_report/positive-sense-rna-viruses/picornavirales/w/picornaviridae (accessed on 25 May 2020).
  12. Holm-Hansen, C.C.; Midgley, S.E.; Fischer, T.K. Global emergence of enterovirus D68: A systematic review. Lancet Infect. Dis. 2016, 16, 64–75. [Google Scholar] [CrossRef]
  13. Palminha, P.; Ribeiro, C.; Roque, C.; Vinagre, E. Vigilância laboratorial da infeção a Enterovirus entre 2010 e 2013. Bol. Epidemiológico Obs. 2015, 5, 19–21. [Google Scholar]
  14. Sinclair, R.G.; Jones, E.L.; Gerba, C.P. Viruses in recreational water-borne disease outbreaks: A review. J. Appl. Microbiol. 2009, 107, 1769–1780. [Google Scholar] [CrossRef]
  15. Lee, C.S.; Lee, C.; Marion, J.; Wang, Q.; Saif, L.; Lee, J. Occurrence of human enteric viruses at freshwater beaches during swimming season and its link to water inflow. Sci. Total Environ. 2014, 472, 757–766. [Google Scholar] [CrossRef]
  16. Haramoto, E.; Katayama, H.; Oguma, K.; Ohgaki, S. Application of cation-coated filter method to detection of noroviruses, enteroviruses, adenoviruses, and torque teno viruses in the Tamagawa River in Japan. Appl. Environ. Microbiol. 2005, 71, 2403–2411. [Google Scholar] [CrossRef] [Green Version]
  17. Schets, F.M.; Van Wijnen, J.H.; Schijven, J.F.; Schoon, H.; De Roda Husman, A.M. Monitoring of waterborne pathogens in surface waters in Amsterdam, the Netherlands, and the potential health risk associated with exposure to Cryptosporidium and Giardia in these waters. Appl. Environ. Microbiol. 2008, 74, 2069–2078. [Google Scholar] [CrossRef] [PubMed] [Green Version]
  18. Updyke, E.A.; Wang, Z.; Sun, S.; Connell, C.; Kirs, M.; Wong, M.; Lu, Y. Human enteric viruses–potential indicators for enhanced monitoring of recreational water quality. Virol. Sin. 2015, 30, 344–353. [Google Scholar] [CrossRef] [PubMed]
  19. Lin, J.; Singh, A. Detection of human enteric viruses in Umgeni River, Durban, South Africa. J. Water Health 2015, 13, 1098–1112. [Google Scholar] [CrossRef] [PubMed] [Green Version]
  20. Prevost, B.; Goulet, M.; Lucas, F.S.; Joyeux, M.; Moulin, L.; Wurtzer, S. Viral persistence in surface and drinking water: Suitability of PCR pre-treatment with intercalating dyes. Water Res. 2016, 91, 68–76. [Google Scholar] [CrossRef]
  21. Peláez-Carvajal, D.; Guzmán, B.L.; Rodríguez, J.; Acero, F.; Nava, G. Presence of enteric viruses in water samples for consumption in Colombia: Challenges for supply systems. Biomedica 2016, 36, 169–172. [Google Scholar]
  22. ICTV Genus: Hepatovirus. Available online: https://talk.ictvonline.org/ictv-reports/ictv_online_report/positive-sense-rna-viruses/picornavirales/w/picornaviridae/709/genus-hepatovirus (accessed on 1 June 2020).
  23. World Health Organization. Global Hepatitis Report, 2017; WHO: Geneva, Switzerland, 2017; pp. 1–68. [Google Scholar]
  24. DGS. Boletim Epidemiológico. In Hepatite A em Portugal; Direção-Geral da Saúde: Lisboa, Portugal, 2017. [Google Scholar]
  25. Jiang, S.C.; Chu, W. PCR detection of pathogenic viruses in southern California urban rivers. J. Appl. Microbiol. 2004, 97, 17–28. [Google Scholar] [CrossRef] [PubMed] [Green Version]
  26. Elmahdy, E.M.; Fongaro, G.; Schissi, C.D.; Petrucio, M.M.; Barardi, C.R.M. Enteric viruses in surface water and sediment samples from the catchment area of Peri Lagoon, Santa Catarina State, Brazil. J. Water Health 2016, 14, 142–154. [Google Scholar] [CrossRef] [PubMed] [Green Version]
  27. López-Gálvez, F.; Truchado, P.; Sánchez, G.; Aznar, R.; Gil, M.I.; Allende, A. Occurrence of enteric viruses in reclaimed and surface irrigation water: Relationship with microbiological and physicochemical indicators. J. Appl. Microbiol. 2016, 121, 1180–1188. [Google Scholar] [CrossRef]
  28. O’Brien, E.; Nakyazze, J.; Wu, H.; Kiwanuka, N.; Cunningham, W.; Kaneene, J.B.; Xagoraraki, I. Viral diversity and abundance in polluted waters in Kampala, Uganda. Water Res. 2017, 127, 41–49. [Google Scholar] [CrossRef]
  29. ICTV Genus: Norovirus. Available online: https://talk.ictvonline.org/ictv-reports/ictv_online_report/positive-sense-rna-viruses/w/caliciviridae/1167/genus-norovirus (accessed on 27 May 2020).
  30. Lopman, B.; Atmar, R.; Baric, R.; Estes, M.; Green, K.; Glass, R.; Hall, A.; Iturriza-Gomara, M.; Kang, C.; Lee, B.; et al. Global burden of norovirus and prospects for vaccine development. Cent. Dis. Control Prev. 2015, 1–46. [Google Scholar]
  31. Costa, I.; Mesquita, J.R.; Veiga, E.; Oleastro, M.; Nascimento, M.J.S. Surveillance of norovirus in Portugal and the emergence of the Sydney variant, 2011–2013. J. Clin. Virol. 2015, 70, 26–28. [Google Scholar] [CrossRef]
  32. Maunula, L.; Söderberg, K.; Vahtera, H.; Vuorilehto, V.P.; Von Bonsdorff, C.H.; Valtari, M.; Laakso, T.; Lahti, K. Presence of human noro- and adenoviruses in river and treated wastewater, a longitudinal study and method comparison. J. Water Health 2012, 10, 87–99. [Google Scholar] [CrossRef] [Green Version]
  33. Grøndahl-rosado, R.; Yarovitsyna, E.; Trettenes, E.; Myrmel, M.; Robertson, L.J. A One Year Study on the Concentrations of Norovirus and Enteric Adenoviruses in Wastewater and A Surface Drinking Water Source in Norway. Food Environ. Virol. 2014, 6, 232–245. [Google Scholar] [CrossRef]
  34. Lodder, W.J.; de Roda Husman, A.M. Presence of Noroviruses and Other Enteric Viruses in Sewage and Surface Waters in The Netherlands. Appl. Environ. Microbiol. 2005, 71, 1453–1461. [Google Scholar] [CrossRef] [Green Version]
  35. Kukkula, M.; Maunula, L.; Silvennoinen, E. Outbreak of Viral Gastroenteritis Due to Drinking Water Contaminated by Norwalk-like Viruses. J. Infect. Dis. 1999, 180, 1771–1776. [Google Scholar] [CrossRef]
  36. Blanco, A.; Guix, S.; Fuster, N.; Fuentes, C.; Bartolomé, R.; Cornejo, T.; Pintó, R.M.; Bosch, A. Norovirus in Bottled Water Associated with Gastroenteritis Outbreak, Spain, 2016. Emerg. Infect. Dis. 2017, 23, 1531–1534. [Google Scholar] [CrossRef]
  37. Gall, A.M.; Mariñas, B.J.; Lu, Y.; Shisler, J.L. Waterborne Viruses: A Barrier to Safe Drinking Water. PLoS Pathog. 2015, 11, 1–7. [Google Scholar] [CrossRef]
  38. Goyal, S.M.; Cannon, J.L. The Molecular Virology of Enteric Viruses. In Viruses in Foods; Springer: Berlin/Heidelberg, Germany, 2006; pp. 471–503. ISBN 978-3-319-30721-3. [Google Scholar]
  39. Rzezutka, A.; Cook, N. Survival of human enteric viruses in the environment and food. FEMS Microbiol. Rev. 2004, 28, 441–453. [Google Scholar] [CrossRef] [Green Version]
  40. Guerrero-Latorre, L.; Gonzales-Gustavson, E.; Hundesa, A.; Sommer, R.; Rosina, G. UV disinfection and flocculation-chlorination sachets to reduce hepatitis E virus in drinking water. Int. J. Hyg. Environ. Health 2016, 219, 405–411. [Google Scholar] [CrossRef]
  41. Yeh, H.Y.; Hwang, Y.C.; Yates, M.V.; Mulchandani, A.; Chen, W. Detection of hepatitis A virus by using a combined cell culture-molecular beacon assay. Appl. Environ. Microbiol. 2008, 74, 2239–2243. [Google Scholar] [CrossRef] [Green Version]
  42. República Portuguesa. Decreto-Lei n. 152/2017; Diário da República: Lisboa, Portugal, 2017.
  43. Espinosa, A.C.; Arias, C.F.; Snchez-Colán, S.; Mazari-Hiriart, M. Comparative study of enteric viruses, coliphages and indicator bacteria for evaluating water quality in a tropical high-altitude system. Environ. Health A Glob. Access Sci. Source 2009, 8, 1–10. [Google Scholar] [CrossRef] [Green Version]
  44. Teixeira, P.; Costa, S.; Brown, B.; Silva, S.; Rodrigues, R.; Valério, E. Quantitative PCR detection of enteric viruses in wastewater and environmental water sources by the Lisbon municipality: A case study. Water 2020, 12, 544. [Google Scholar] [CrossRef] [Green Version]
  45. Zhu, H.; Yuan, F.; Yuan, Z.; Liu, R.; Xie, F.; Huang, L.; Liu, X.; Jiang, X.; Wang, J.; Xu, Q.; et al. Monitoring of Poyang lake water for sewage contamination using human enteric viruses as an indicator. Virol. J. 2018, 15, 1–9. [Google Scholar] [CrossRef] [Green Version]
  46. SNIRH Recursos Hídricos. Available online: https://snirh.apambiente.pt/ (accessed on 20 May 2020).
  47. APA Planos de Ordenamento de Albufeiras. Available online: https://apambiente.pt/index.php?ref=16&subref=7 (accessed on 20 July 2020).
  48. Salvador, D.; Neto, C.; Benoliel, M.J.; Filomena Caeiro, M. Assessment of the presence of hepatitis e virus in surface water and drinking water in Portugal. Microorganisms 2020, 8, 761. [Google Scholar] [CrossRef]
  49. Ikner, L.A.; Gerba, C.P.; Bright, K.R. Concentration and Recovery of Viruses from Water: A Comprehensive Review. Food Environ. Virol. 2012, 4, 41–67. [Google Scholar] [CrossRef]
  50. Fout, G.S.; Brinkman, N.E.; Cashdollar, J.L.; Griffin, M.; McMinn, B.R.; Rhodes, E.R.; Varughese, E.A.; Karim, M.R.; Grimm, A.C.; Spencer, S.K.; et al. Method 1615—Measurement of Enterovirus and Norovirus Occurrence in Water by Culture and RT-Qpcr; U.S. Environmental Protection Agency: Cincinnati, OH, USA, 2014; pp. 1–105.
  51. ISO. ISO 9308-2:2012. Available online: https://www.iso.org/standard/52246.html (accessed on 15 May 2020).
  52. ISO. ISO 9308-1:2014. Available online: https://www.iso.org/standard/55832.html (accessed on 18 May 2020).
  53. ISO. ISO 7899-2:2000. Available online: https://www.iso.org/standard/14854.html (accessed on 18 May 2020).
  54. Standard Methods for the Examination of Water and Wastewater. Chlorine (Residual). Available online: https://www.standardmethods.org/doi/abs/10.2105/SMWW.2882.078 (accessed on 1 June 2020).
  55. Standard Methods for the Examination of Water and Wastewater. pH Value. Available online: https://www.standardmethods.org/doi/abs/10.2105/SMWW.2882.082 (accessed on 1 June 2020).
  56. Prevost, B.; Lucas, F.S.; Goncalves, A.; Richard, F.; Moulin, L.; Wurtzer, S. Large scale survey of enteric viruses in river and waste water underlines the health status of the local population. Environ. Int. 2015, 79, 42–50. [Google Scholar] [CrossRef]
  57. Pang, X.; Qiu, Y.; Gao, T.; Zurawell, R.; Neumann, N.F.; Craik, S.; Lee, B.E. Prevalence, levels and seasonal variations of human enteric viruses in six major rivers in Alberta, Canada. Water Res. 2019, 153, 349–356. [Google Scholar] [CrossRef]
  58. Elmahdy, M.E.I.; Fongaro, G.; Magri, M.E.; Petruccio, M.M.; Barardi, C.R.M. Spatial distribution of enteric viruses and somatic coliphages in a Lagoon used as drinking water source and recreation in Southern Brazil. Int. J. Hyg. Environ. Health 2016, 219, 617–625. [Google Scholar] [CrossRef]
  59. Pordata Valor da Produção Agrícola: Total e Por Tipo. Available online: https://www.pordata.pt/Municipios/Valor+da+produção+agrícola+total+e+por+tipo-956 (accessed on 26 March 2020).
  60. Tandukar, S.; Sherchand, J.B.; Id, D.B.; Sherchan, S.P.; Malla, B.; Shrestha, R.G.; Haramoto, E. Presence of Human Enteric Viruses, Protozoa, and Indicators of Pathogens in the Bagmati River, Nepal. Pathogens 2018, 7, 38. [Google Scholar] [CrossRef] [Green Version]
  61. Megchún-García, J.V.; Landeros-Sánchez, C.; Soto-Estrada, A.; del Refugio Castañeda-Chávez, M.; Martínez-Dávila, J.P.; Nikolskii-Gavrilov, I.; Galaviz-Villa, I.; Lango-Reynoso, F. Total Coliforms and Escherichia coli in Surface and Subsurface Water from a Sugarcane Agroecosystem in Veracruz, Mexico. J. Agric. Sci. 2015, 7, 110–119. [Google Scholar] [CrossRef] [Green Version]
  62. Onyango, A.E.; Okoth, M.W.; Kunyanga, C.N.; Aliwa, B.O. Microbiological Quality and Contamination Level of Water Sources in Isiolo County in Kenya. J. Environ. Public Health 2018, 2018, 1–10. [Google Scholar] [CrossRef] [Green Version]
  63. Olasoji, S.O.; Oyewole, N.O.; Abiola, B.; Edokpayi, J.N. Water quality assessment of surface and groundwater sources using a water quality index method: A case study of a peri-urban town in southwest, Nigeria. Environments 2019, 6, 23. [Google Scholar] [CrossRef] [Green Version]
  64. Yuan, T. A consecutive centrifugal method for concentration of human enteric viruses in water samples. Arch. Virol. 2016, 161, 3323–3330. [Google Scholar] [CrossRef]
  65. Haramoto, E.; Kitajima, M.; Hata, A.; Torrey, J.R.; Masago, Y.; Sano, D.; Katayama, H. A review on recent progress in the detection methods and prevalence of human enteric viruses in water. Water Res. 2018, 135, 168–186. [Google Scholar] [CrossRef]
  66. Da Silva, A.K.; Le Saux, J.C.; Parnaudeau, S.; Pommepuy, M.; Elimelech, M.; Le Guyader, F.S. Evaluation of removal of noroviruses during wastewater treatment, using real-time reverse transcription-PCR: Different behaviors of genogroups I and II. Appl. Environ. Microbiol. 2007, 73, 7891–7897. [Google Scholar] [CrossRef] [Green Version]
  67. Wurtzer, S.; Prevost, B.; Lucas, F.S.; Moulin, L. Detection of enterovirus in environmental waters: A new optimized method compared to commercial real-time RT-qPCR kits. J. Virol. Methods 2014, 209, 47–54. [Google Scholar] [CrossRef]
  68. Gregory, J.B.; Litaker, R.W.; Noble, R.T. Rapid one-step quantitative reverse transcriptase PCR assay with competitive internal positive control for detection of enteroviruses in environmental samples. Appl. Environ. Microbiol. 2006, 72, 3960–3967. [Google Scholar] [CrossRef] [Green Version]
  69. Fout, G.S.; Cashdollar, J.L.; Varughese, E.A.; Parshionikar, S.U.; Grimm, A.C. EPA Method 1615. Measurement of Enterovirus and Norovirus Occurrence in Water by Culture and RT-qPCR. I. Collection of Virus Samples. J. Vis. Exp. 2016, 107, 1–13. [Google Scholar] [CrossRef]
  70. Seo, M.; Lee, H.; Kim, Y. Relationship between Coliform bacteria and water quality factors at weir stations in the Nakdong River, South Korea. Water 2019, 11, 1171. [Google Scholar] [CrossRef] [Green Version]
  71. Addo, M.G.; Woods, C.A.; Andoh, L.A.; Obiri-Danso, K. Effect of varying storage temperatures on the microbiological quality of street sold water in the Kumasi metropolis, Ghana. Res. J. Microbiol. 2016, 11, 56–63. [Google Scholar] [CrossRef] [Green Version]
Figure 1. Volumes of water sampled in 2019 at the five sampling sites under survey, aimed at detection and quantification of enteric viruses. (A) River and dam reservoir (n = 27). (B) WTP_R, WTP_D, and point in the water distribution network (n = 36).
Water 12 02824 g001
Figure 2. Microbiological characterization of the surface water collected during the 2019 sampling campaign (n = 96). The graphs represent the variation in concentration values from the four groups of FIB evaluated (coliform bacteria, E. coli, fecal coliforms, and intestinal enterococci) registered throughout the sampling campaign, in the surface water sources under survey (River and Dam reservoir).
Water 12 02824 g002
Figure 3. Variation in the NoV II RNA concentration throughout the 2019 sampling campaign, in River and WTP_R (n = 34) (first graph) and in Dam reservoir and WTP_D (n = 20) (second graph). Each concentration value, in gc/L, is the average of two independent RT-qPCR results.
Water 12 02824 g003
Figure 4. Physical-chemical characterization of the surface water and drinking water sampled during the 2019 sampling campaign (n = 96). The first and second graphs represent variations in water temperature and water pH, respectively, throughout the sampling campaign, at the five sampling sites (River, Dam reservoir, WTP_R, WTP_D, point in the distribution network). The third graph represents the variation in total chlorine concentration, in the drinking water sampled throughout the sampling campaign, at the three sampling sites: WTP_R, WTP_D and point in the distribution network.
Water 12 02824 g004
Table 1. RT-qPCR conditions for detection and quantification of enteric viruses.
StepTimeTemperatureNumber of Cycles
EnterovirusReverse Transcription10 min55 °C1
Enzyme activation2 min95 °C1
Denaturation10 seg95 °C50
Data collection1 min60 °C
NoV
(NoV I and NoV II)
and HAV
Reverse Transcription10 min45 °C1
Enzyme activation10 min95 °C1
Denaturation15 seg95 °C45
Data collection45 seg60 °C
Table 2. Detection and quantification of enteric viruses in surface water (n = 27) and drinking water (n = 36) sampled in 2019.
SamplingRiverDam ReservoirWTP_RWTP_DPoint in the Distribution Network
EnteroNoV INoV IIHAVEnteroNoV INoV IIHAVEnteroNoV INoV IIHAVEnteroNoV INoV IIHAVEnteroNoV INoV IIHAV
gc/Lgc/Lgc/Lgc/Lgc/L
JanuaryNDNDNDND0.2NDNDNDNDNDNDNDNDNDNDNDNDND12.5ND
February (A)NDND0.4ND----NDND2.6ND--------
February (B)ND3.619.6NDNDND2.0NDNDND9.7NDNDND7.90.1NDNDNDND
March (A)4.40.2NDND----NDNDNDND--------
March (B)ND5.3NDNDNDNDNDNDNDNDNDNDNDNDNDND----
AprilND10.62.4NDNDND0.8NDNDNDNDNDNDND1.4NDNDNDNDND
MayNDNDNDNDNDND1.4NDNDND1.5NDNDND4.5NDNDND4.6ND
JuneNDND0.5NDNDND78.6NDNDND0.6NDNDND0.9NDNDND0.1ND
JulyNDNDNDND----NDND0.2ND----NDND0.7ND
August (A)NDNDNDND----NDNDNDND----NDND0.2ND
August (B)NDNDNDND----NDND0.2ND--------
September (A)ND0.4NDND----NDND0.1ND----NDND0.1ND
September (B)ND2.00.8NDNDNDNDNDNDNDNDNDNDND0.9ND----
October (A)ND137.0NDND----NDND0.2ND--------
October (B)NDNDNDNDNDNDNDNDNDND0.1NDNDNDNDNDNDND0.1ND
NovemberNDNDNDNDNDNDNDNDNDNDNDNDNDNDNDND----
DecemberNDNDNDNDNDNDNDNDNDNDNDNDNDNDNDND----
(A): sampling performed in the first half of the month; (B): sampling performed in the second half of the month; Entero: Enterovirus; HAV: hepatitis A virus; NoV I: Norovirus genogroup I; NoV II: Norovirus genogroup II; gc/L: genomic copies per liter of sampled water, based on the average value of two independent RT-qPCR results; ND: RNA not detected; -: absence of sampling.
Table 3. Spearman’s correlation coefficients relating enteric viruses, microbiological, and physicochemical parameters of water quality.
EnteroNoV INoV IIHAVColiform BacteriaFecal ColiformsE. coliIntestinal EnterococciTemppHTotal Chlorine
Entero1 0.2 −0.16 −0.02 0.14 0.01 0.1 0.17 −0.1 −0.09 −0.19
NoV I0.21 0.03 −0.05 −0.01 −0.1 −0.16 0.48 ** 0.1 −0.11 −0.08
NoV II−0.160.031 0.2 −0.08 −0.05 −0.1 −0.15 −0.12 0.17 0.06
HAV−0.02−0.050.21 −0.11 −0.09 −0.09 −0.09 −0.2 0.14 0.2
Coliform bacteria0.14−0.01−0.08−0.111 0.92 *** 0.92 *** −0.04 0.30 * −0.45 ** −0.85 **
Fecal coliforms0.01−0.1−0.05−0.090.92 ***1 0.94 *** −0.17 0.16 −0.39 * −0.76 **
E. coli0.1−0.16−0.1−0.090.92 ***0.94 ***1 −0.16 0.22 −0.41 ** −0.73 **
Intestinal enterococci0.170.48 **−0.15−0.09−0.04−0.17−0.161 0.19 −0.16 −0.16
Temp−0.10.1−0.12−0.20.30 *0.160.220.191 −0.34 * −0.29
pH−0.09−0.110.170.14−0.45 **−0.39 *−0.41 **−0.16−0.34 *1 0.36 *
Total chlorine−0.19−0.080.060.2−0.85 **−0.76 **−0.73 **−0.16−0.290.36 *1
Entero: Enterovirus; HAV: Hepatitis A virus; NoV I: Norovirus genogroup I; NoV II: Norovirus genogroup II; Temp: temperature; *: weak correlation; **: moderate correlation; ***: strong correlation.

