Article

Sustainable Intensification of Agriculture in the Context of the COVID-19 Pandemic: Prospects for the Future

by
Prasanna Venkatesh Sampath
1,*,
Gaddam Sai Jagadeesh
1 and
Chandra Sekhar Bahinipati
2
1
Department of Civil and Environmental Engineering, IIT Tirupati, Tirupati 517 506, India
2
Department of Humanities and Social Sciences, IIT Tirupati, Tirupati 517 506, India
*
Author to whom correspondence should be addressed.
Water 2020, 12(10), 2738; https://doi.org/10.3390/w12102738
Submission received: 7 September 2020 / Revised: 24 September 2020 / Accepted: 28 September 2020 / Published: 30 September 2020
(This article belongs to the Special Issue Sustainable Irrigation Management in Agriculture)

Abstract

:
The COVID-19 pandemic is adversely impacting food and nutrition security and requires urgent attention from policymakers. Sustainable intensification of agriculture is one strategy that attempts to increase food production without adversely impacting the environment, by shifting from water-intensive crops to other climate-resistant and nutritious crops. This paper focuses on the Indian state of Andhra Pradesh by studying the impact of shifting 20% of the area under paddy and cotton cultivation to other crops like millets and pulses. Using FAO’s CROPWAT model, along with monsoon forecasts and detailed agricultural data, we simulate the crop water requirements across the study area. We simulate a business-as-usual base case and compare it to multiple crop diversification strategies using various parameters—food, calories, protein production, as well as groundwater and energy consumption. Results from this study indicate that reduced paddy cultivation decreases groundwater and energy consumption by around 9–10%, and a calorie deficit between 4 and 8%—making up this calorie deficit requires a 20–30% improvement in the yields of millets and pulses. We also propose policy interventions to incentivize the cultivation of nutritious and climate-resistant crops as a sustainable strategy towards strengthening food and nutrition security while lowering the environmental footprint of food production.

1. Introduction

The disruptions caused by the COVID-19 pandemic extend across the world and to all spheres of human activity. As a result, emerging and developing nations are likely to see a negative growth rate in 2020 according to the World Economic Outlook, and in the case of India, the growth rate is estimated to be 1.9% [1]. In particular, in the context of agriculture, Food and Agriculture Organization (FAO) and World Food Programme (WFP) have predicted that the COVID-19 pandemic may result in food crises of “biblical proportion” [2,3]. The causes are not far to seek: (i) disruption to supply chains at different levels, such as global, national, and regional, (ii) lack of consumer demand due to plummeting income, and (iii) unavailability of agricultural inputs, such as seed, fertilizer, pesticide, and, most importantly, labor. The shortage of labor, followed by outward migration due to COVID-19, can be particularly disruptive in the more impoverished regions of the world (e.g., developing nations like India), where small-holdings farmers typically do not rely extensively on farm mechanization. Labor-intensive crops, such as paddy, which is one of the staple food grains around the world, could be severely impacted, particularly in India. In some regions, policymakers are planning to promote crops, such as maize, in place of paddy in anticipation of labor shortages [4]. The International Monetary Fund (IMF) has also noted an almost 20% decline in the price of cotton compared to October 2019 [5]. With further sluggish consumer demand predicted in the remainder of 2020 and an uncertain future, this can result in economic hardships for cotton farmers all over the world. What impact these challenges will have on crop cultivation in the upcoming monsoon agriculture season all over South Asia is as yet unclear.
At the policy level, the most significant issue is to sustain farm incomes in a nation like India, where there are around 140 million farm households. [6]. The Indian economy has been experiencing an economic slowdown in recent years; we have already witnessed a declining trend in consumption expenditure [7]. The lockdown implemented following the COVID-19 outbreak may lead to a demand-supply failure [1]. Further, following the classic work by Sen [8], the present situation could be viewed as a failure of exchange and lack of entitlement capacity. For instance, the pandemic could affect peoples’ endowment capacity, i.e., labor, and as a result, there would be a deficiency of demand [1], which further aggravates food and nutritional insecurity. It is anticipated that such a situation could push a large number of households, especially farming and informal labor, into the poverty trap, resulting in malnutrition and hunger. Overcoming these challenges will be critical in tiding over the current crisis and may help imbibe useful lessons for the future.
As the global population inches towards 10 billion by the year 2050 [9], meeting the growing food demands while reducing the environmental impacts of agriculture will be of prime importance for policymakers, practitioners, and researchers. While the green revolution was successful in considerably increasing food production and also in improving the economic status of farmers [10], intensive groundwater-fed agriculture across the world has resulted in plummeting groundwater levels, increased energy costs, biodiversity loss, greenhouse gas emissions, losses in soil fertility, and also the migration of farmers from rural to urban areas [11,12,13,14,15,16,17,18,19]. Sustainable intensification, conservation agriculture, and nutrition-sensitive agriculture are some of the approaches that attempt to reduce these negative impacts [20,21,22,23,24,25]. Sustainable intensification (SI) of agriculture attempts to increase agricultural output without causing adverse environmental impacts, and this could be viewed as a win-win situation, given the pandemic condition [23,26,27]. One of the common strategies adopted in SI is the cultivation of millets and pulses rather than the staple cereals.
Some researchers argue that SI strategies may not be advantageous as the staple cereals have higher yields and are more calorie-dense, thereby contributing significantly to food security [26]. Nonetheless, in the context of the COVID-19 pandemic, it becomes imperative to look at food and nutrition security at multiple scales—from a household to a global level. While the world at large may have enough food to feed the entire population, supply chain disruptions and export restrictions on essential items may make it difficult for food to reach many impoverished households [2]. For instance, India depends on the import of pulses since its production does not satisfy demand [28]. Additional transaction costs associated with the demand side, such as psychological restrictions on visiting the market for fear of possible contraction of the disease, and lack of confidence about the future, as well as the supply side, such as costs required to bring back labor, and the possibility of increasing wage due to shortage of labor [1], may further worsen production and demand for agricultural output. In the current scenario, this may endanger nutrition security in countries like India. Thus, by adopting SI practices in food production, nations can aim to achieve self-sufficiency.
Many researchers have opined that millets, due to their relative climate resilience and high nutritional value, hold an edge over other staples like wheat and rice [29,30,31]. Similarly, FAO has also noted that pulses will play an essential role in furthering the food and nutritional security in the coming decades [32]. However, the global per capita consumption of both millets and pulses is relatively low [32,33]. Moreover, the cultivation of pulses is beneficial to soil health as they naturally fix nitrogen in the soil, which reduces the need for fertilizers, thereby reducing greenhouse gas emissions [32]. Thus, diversifying cropping patterns, smoothening income in the present situation, by increasing the cultivation of millets and pulses, will not only address food and nutrition security but will also help as a climate adaptation strategy.
Bringing about reforms in the agricultural sector that can have far-reaching consequences on water, food, and nutrition security is a daunting task. The notion of never letting a “good crisis go to waste” applies in this context [34]. The International Crops Research Institute for the Semi-Arid Tropics (ICRISAT) has suggested that the post-COVID situation has given a unique opportunity to design agricultural policies to transform food systems [6]. They suggest it is imperative to stop favoring the traditional staple cereals (rice and wheat), which have severe environmental impacts and move towards a model where greater emphasis is laid on nutrition by diversifying diets. Indeed, the Indian government, along with the World Food Programme (WFP), has brought out a policy document recommending crop diversification into millets and pulses, among a slew of other measures, to ensure food and nutrition security while ensuring sustainability in food production. For example, the Indian state of Odisha has implemented a special program for the promotion of millet cultivation in tribal areas of the state in 2016 [35]. The state government of Odisha has planned to improve the cultivation and production of millets by including them in the Public Distribution System (PDS). Similarly, the state of Andhra Pradesh launched a program calling for a “comprehensive revival of millets” in seven districts in 2016 [36].
The objectives of this research are to evaluate the effect of adopting various crop diversification strategies on food production and its implications on water resources and energy consumption. In particular, this study aims to quantify the impact of diversifying from labor-intensive crops like paddy and cotton to include millets and pulses without increasing the quantum of arable land. The quantification incorporates various metrics, such as the tons of food produced, their nutritional content (calories and grams of protein), and also the savings in groundwater and energy consumption by adopting the crop diversification strategies. This research also aims to extract lessons for the future in adopting SI practices in the coming decades.

2. Methodology

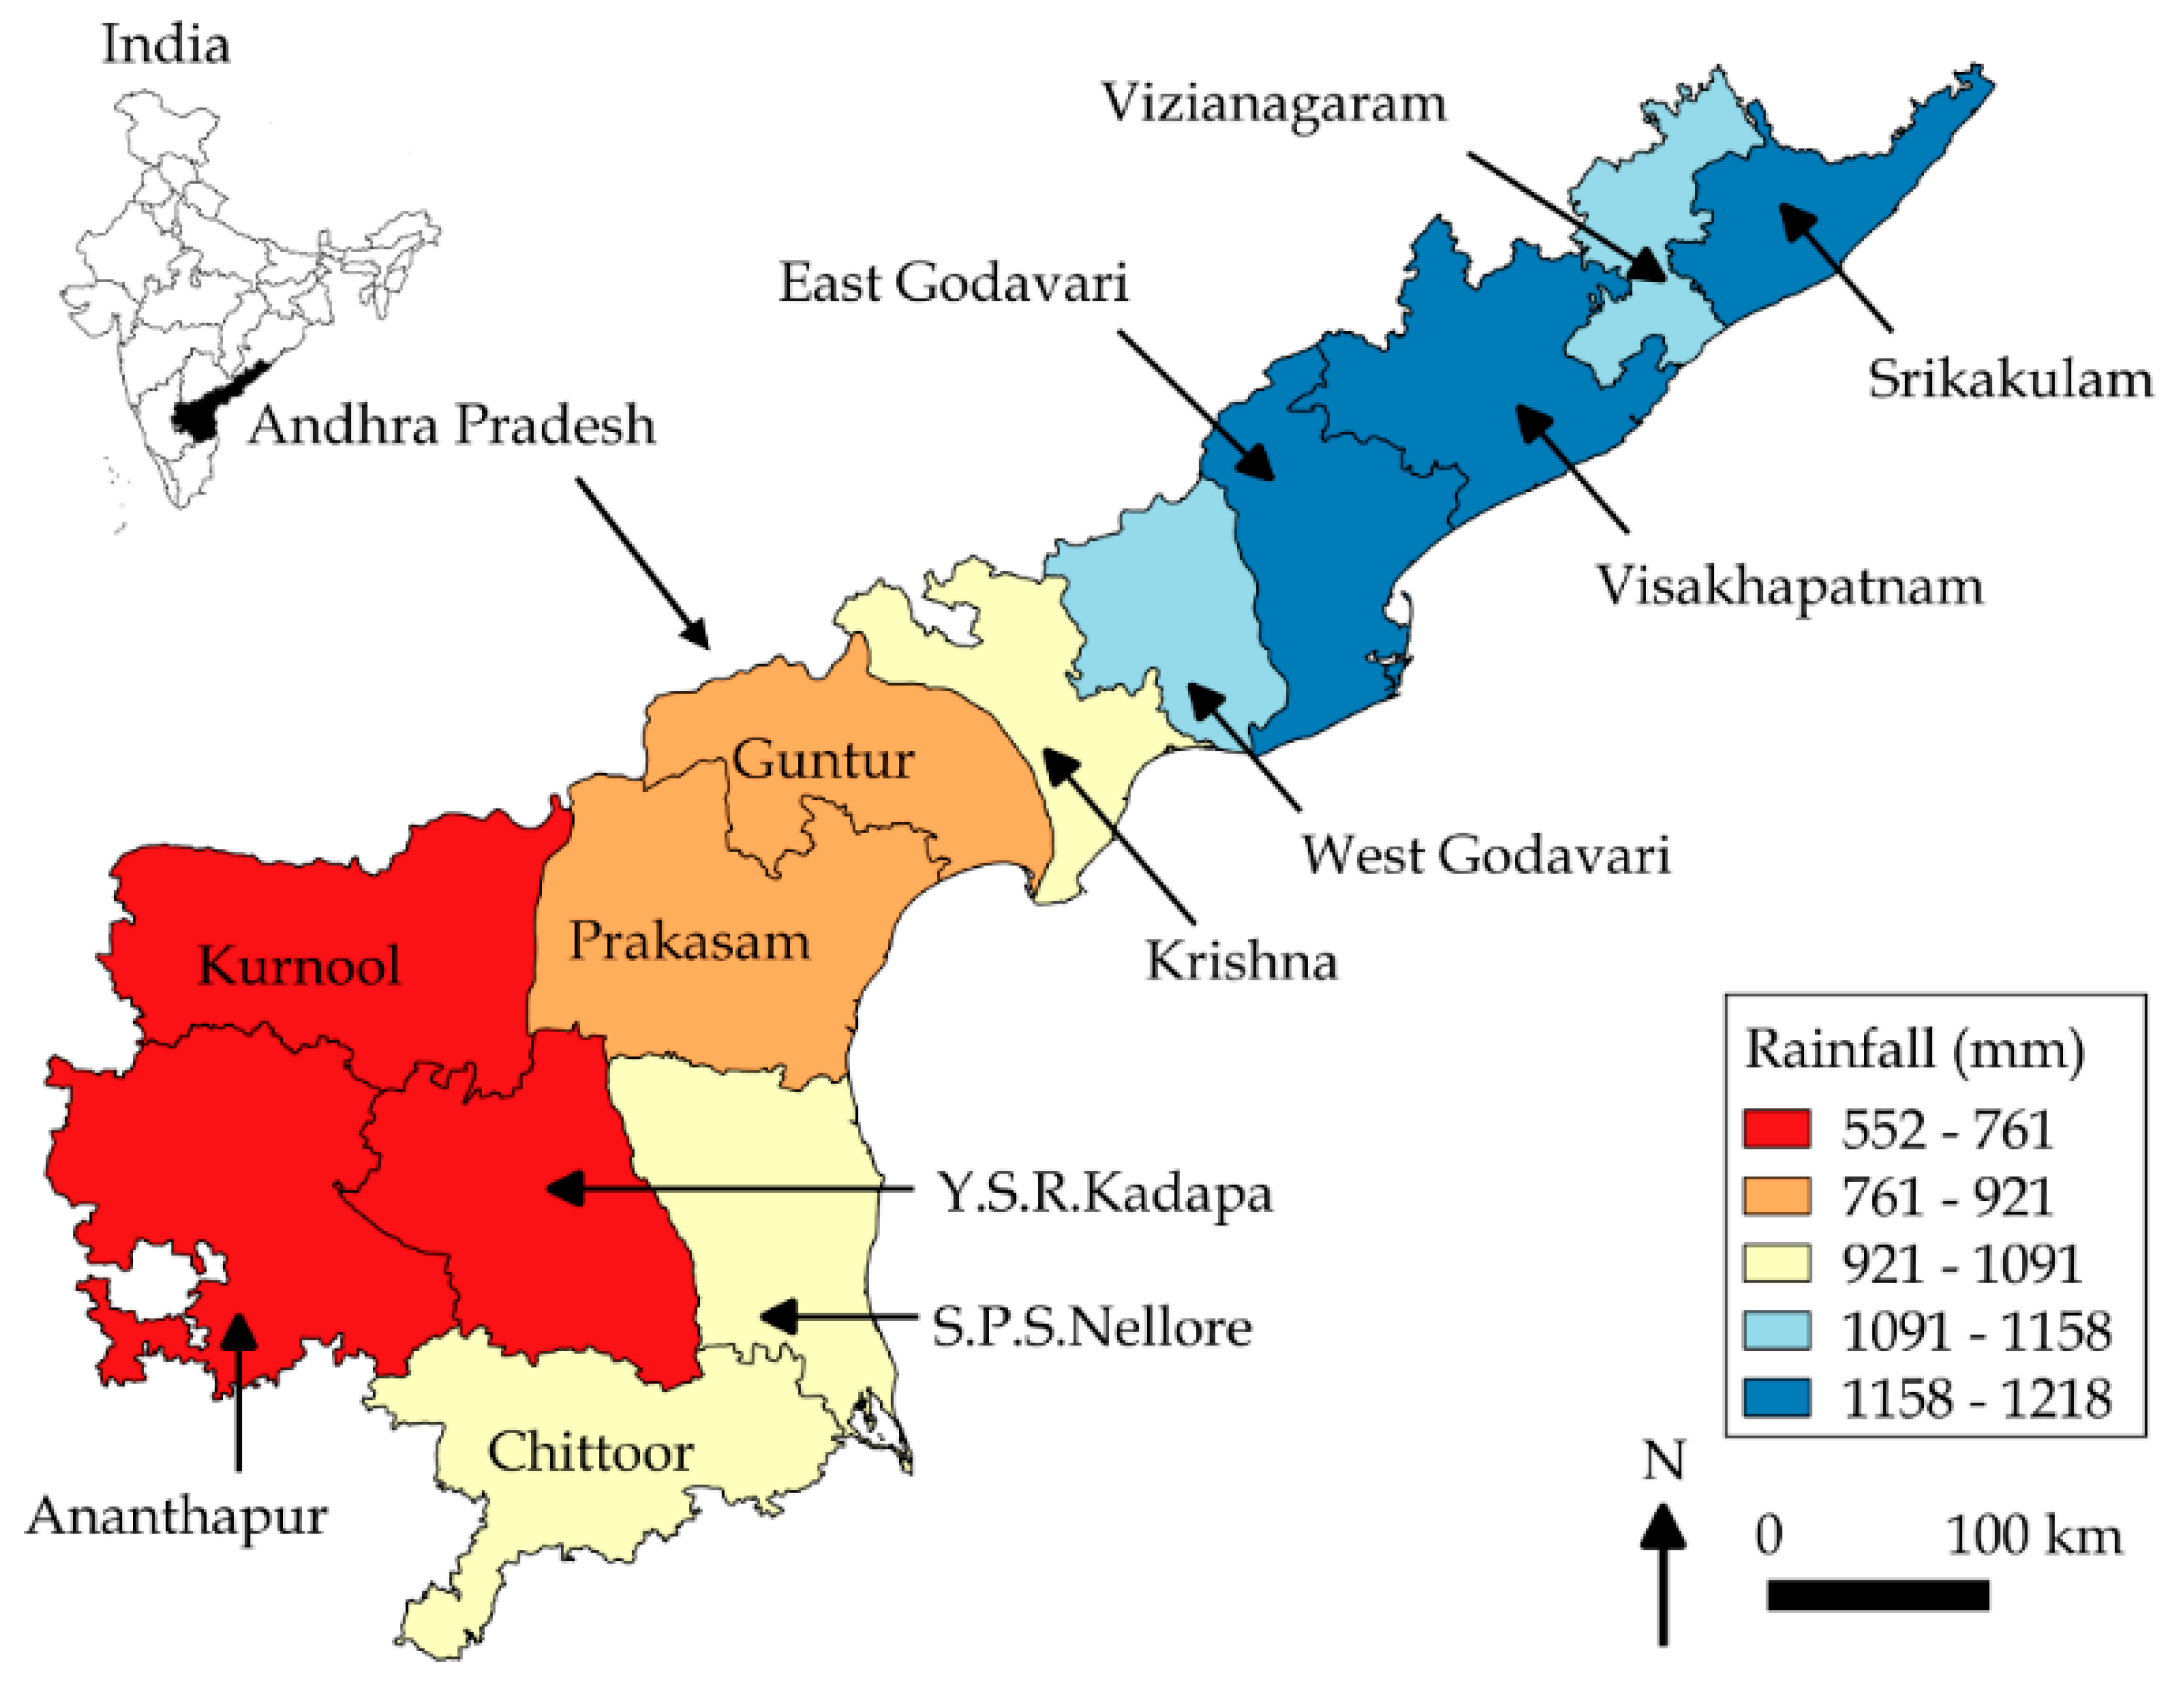
2.1. Estimating Crop Water Requirement

This research uses FAO’s CROPWAT 8.0 model for estimating irrigation water requirements for various crops [37]. CROPWAT uses rainfall, reference evapotranspiration (ETo), soil type, and crop information in its simulation. It uses a soil water balance approach to estimate the irrigation water requirement for each crop in its cropping period.
This study focuses on the south-Indian state of Andhra Pradesh for this analysis (Figure 1). The state occupies an area of more than 160,000 km2, of which almost 40% is under agriculture [38]. This region is characterized by semi-arid and sub-humid climatic zones, with an average rainfall of around 940 mm, which it receives over two monsoon spells—southwest and northeast. Agriculture creates employment opportunities for approximately 60% of the population in the state [39]. After the bifurcation of the state in 2014, the state government has adopted various interventions to provide sustainable livelihood opportunities to the farmers [39]. As per Suryanarayana et al.’s [40] estimation, the state stood at 11th position in terms of human index value in 2011, i.e., 0.485.
A large amount of data on agriculture is available for the study area, including the different crops cultivated (see Table 1) and their corresponding acreages and yields [41]. This information is available for all 13 districts in the state. The Indian Meteorological Department’s (IMD) long-range forecast for the upcoming 2020 southwest monsoon has predicted that there is an 82% chance that the 2020 southwest monsoon rainfall amounts would be within 10% of the normal rainfall [42]. Therefore, CROPWAT simulations have incorporated three rainfall scenarios—normal rainfall, 90% of normal rainfall, and 110% of normal rainfall. Normal rainfall for each district in the study area is obtained from the Andhra Pradesh Water Resources Information and Management System (APWRIMS) [43]. Historical ETo data is obtained from the publicly-available India Water Portal [44]. For each district, minimum, maximum, and average ETo rates are obtained and used in the CROPWAT simulations. Crop sowing dates for each crop in each district are incorporated in the CROPWAT simulations based on available data [41]. It is assumed that the sowing date for every crop within each district varies within a one-month window of time.
For each crop, nine simulations are run with three rainfall values, viz. normal, 90% of normal, and 110% of normal, and three ETo values, viz. minimum, average, and maximum from historical ETo data. The final predicted irrigation water requirement for each crop is obtained as the average of all nine simulations. This water requirement is multiplied by the area under cultivation for the corresponding crop to obtain the total water consumption of each crop, which are then summed to obtain the total irrigation groundwater requirement. We have restricted the area under cultivation to the area under groundwater irrigation in each district. The total area under groundwater irrigation in the study area is around half a million hectares.

2.2. Evaluating Crop Diversification Strategies

Given the current context of the COVID-19 pandemic, it is proposed to reduce the area under paddy and cotton cultivation by 20%. Accordingly, three scenarios are tested: (A). Base case (no reductions), (B). Reduction in paddy cultivation by 20%, and (C). Reduction in both paddy and cotton cultivation by 20% each. While there is no direct evidence on whether there will indeed be such declines in the upcoming sowing season, initial reports suggest an almost 20% decline in the procurement of wheat from the preceding harvest season (Rabi), which has also been impacted by the pandemic [45]. The price of cotton has fallen by almost 20% due to the pandemic [5], which may disincentivize its cultivation this season. Taking these factors into account, we have proposed reductions in paddy and cotton cultivation by 20% each in the upcoming sowing season. The objective of this research is to evaluate the consequences of these scenarios, which may offer us valuable lessons for the future.
The proposed reduction in paddy cultivation will naturally result in lower food production and a corresponding decline in calories and grams of proteins. For overcoming this nutrition deficit, the land “freed” from paddy and cotton cultivation is distributed among other crops. To maintain crop diversity, the land is distributed among a variety of crops: one crop each from amongst cereals (other than paddy), millets, oilseeds, and pulses. Table 2 lists the various crops grown in the study area, their average yields, calorific, and protein contents. By selecting those crops with the highest yields and calorific content, the following four crops are chosen: maize, pearl millet, groundnut, and black gram. Although black gram has a relatively lower yield and a marginally lower calorific value than Bengal gram, it is more widely grown in the study region (see Table 1). Therefore, it is decided to choose black gram over other pulses.
Several strategies for distributing the land among the four chosen crops are attempted:
  • Equal distribution
  • Proportionate distribution
  • Crop-ranking distribution based on average yield
  • Crop-ranking distribution based on maximum yield
  • Crop-ranking distribution based on a modified average yield
In the first and most straightforward approach, the area to be distributed is split evenly among all the crops. In the second strategy, the area is distributed in the proportion of the existing area cultivated of each crop. For instance, if crops P, Q, and R are currently cultivating areas of A1, A2, and A3, respectively, then crop P would be allocated an area in the proportion of A1/∑Ai. In the third strategy, the crops are ranked in ascending order based on their average yields over the period 2013–2017 [41]. The crop with the highest rank, i.e., highest average yield, would get the largest proportion (ratio of its rank to the sum of all ranks) of the area to be redistributed. In strategy 4, the crops are ranked in ascending order based on their maximum yields over the period 2013–2017 [41]. The crop proportions are then computed similar to strategy 3. In strategy 5, the ranking of the crops is the same as in strategy 3, but the average yield is multiplied by a common factor F (F ≥ 1). The objective of this strategy is to identify the value of F that would be sufficient to “break-even” with the base case in terms of food produced and its nutrition content.
The objective of attempting these different strategies is to quantify and compare them with the base case (where paddy and cotton are unchanged). For each strategy, the total tons of food, calories, and grams of protein produced are computed using the yield, calorific, and protein content values presented in Table 2. (Note: The calculation has used yield values at the district scale, while Table 2 lists the average for the whole state.) Strategy 4 uses maximum yields obtained between 2013 and 2017, while the remaining strategies use average yields [41]. The groundwater consumed in producing these crops is estimated by multiplying the area under cultivation of each crop with the corresponding irrigation water requirement, as computed in Section 2.1. The energy consumed in extracting this groundwater is computed using the following equation:
E = ρ g V H η ,
where E is the energy consumed (in kW-h) in extracting the groundwater volume V (m3) from an average depth of H (m) below the ground level, and ρ, g, and η are the density of water (1000 kg/m3), acceleration due to gravity (9.81 m/s2), and the efficiency of the pumps (assumed to be 70%) that extract the groundwater, respectively. The average depth to groundwater level data is obtained for May (pre-monsoon) and November (post-monsoon) from 2014–2019 [47]. The average depth to groundwater level is used in the energy computation.

3. Results and Discussion

3.1. Irrigation Water Requirement

The irrigation water requirement for each crop is obtained, as shown in Table 3. Based on the average water required, it is clear that sugarcane, paddy, and cotton are the most water-intensive crops in this region, while crops like millets and pulses are better suited to regions with low rainfall.
The crop water requirements for each crop and their corresponding areas are used to estimate the total water requirement for each district and the entire study area and are given in Table 4. Figure 1 shows the spatial distribution of food production and its associated attributes for the base case across the study area. On closer analysis of the results, we find that while paddy accounts for around 50% of the total area under groundwater irrigation across the region, it accounts for almost 56% of the total groundwater consumption. Paddy, cotton, and sugarcane together account for 73% of the area under cultivation but consume almost 90% of the total groundwater. Millets and pulses, on the other hand, while occupying 1.4% and 5.2% of the total cultivated area, only account for 0.4% and 1.7% of the total groundwater consumed, respectively.

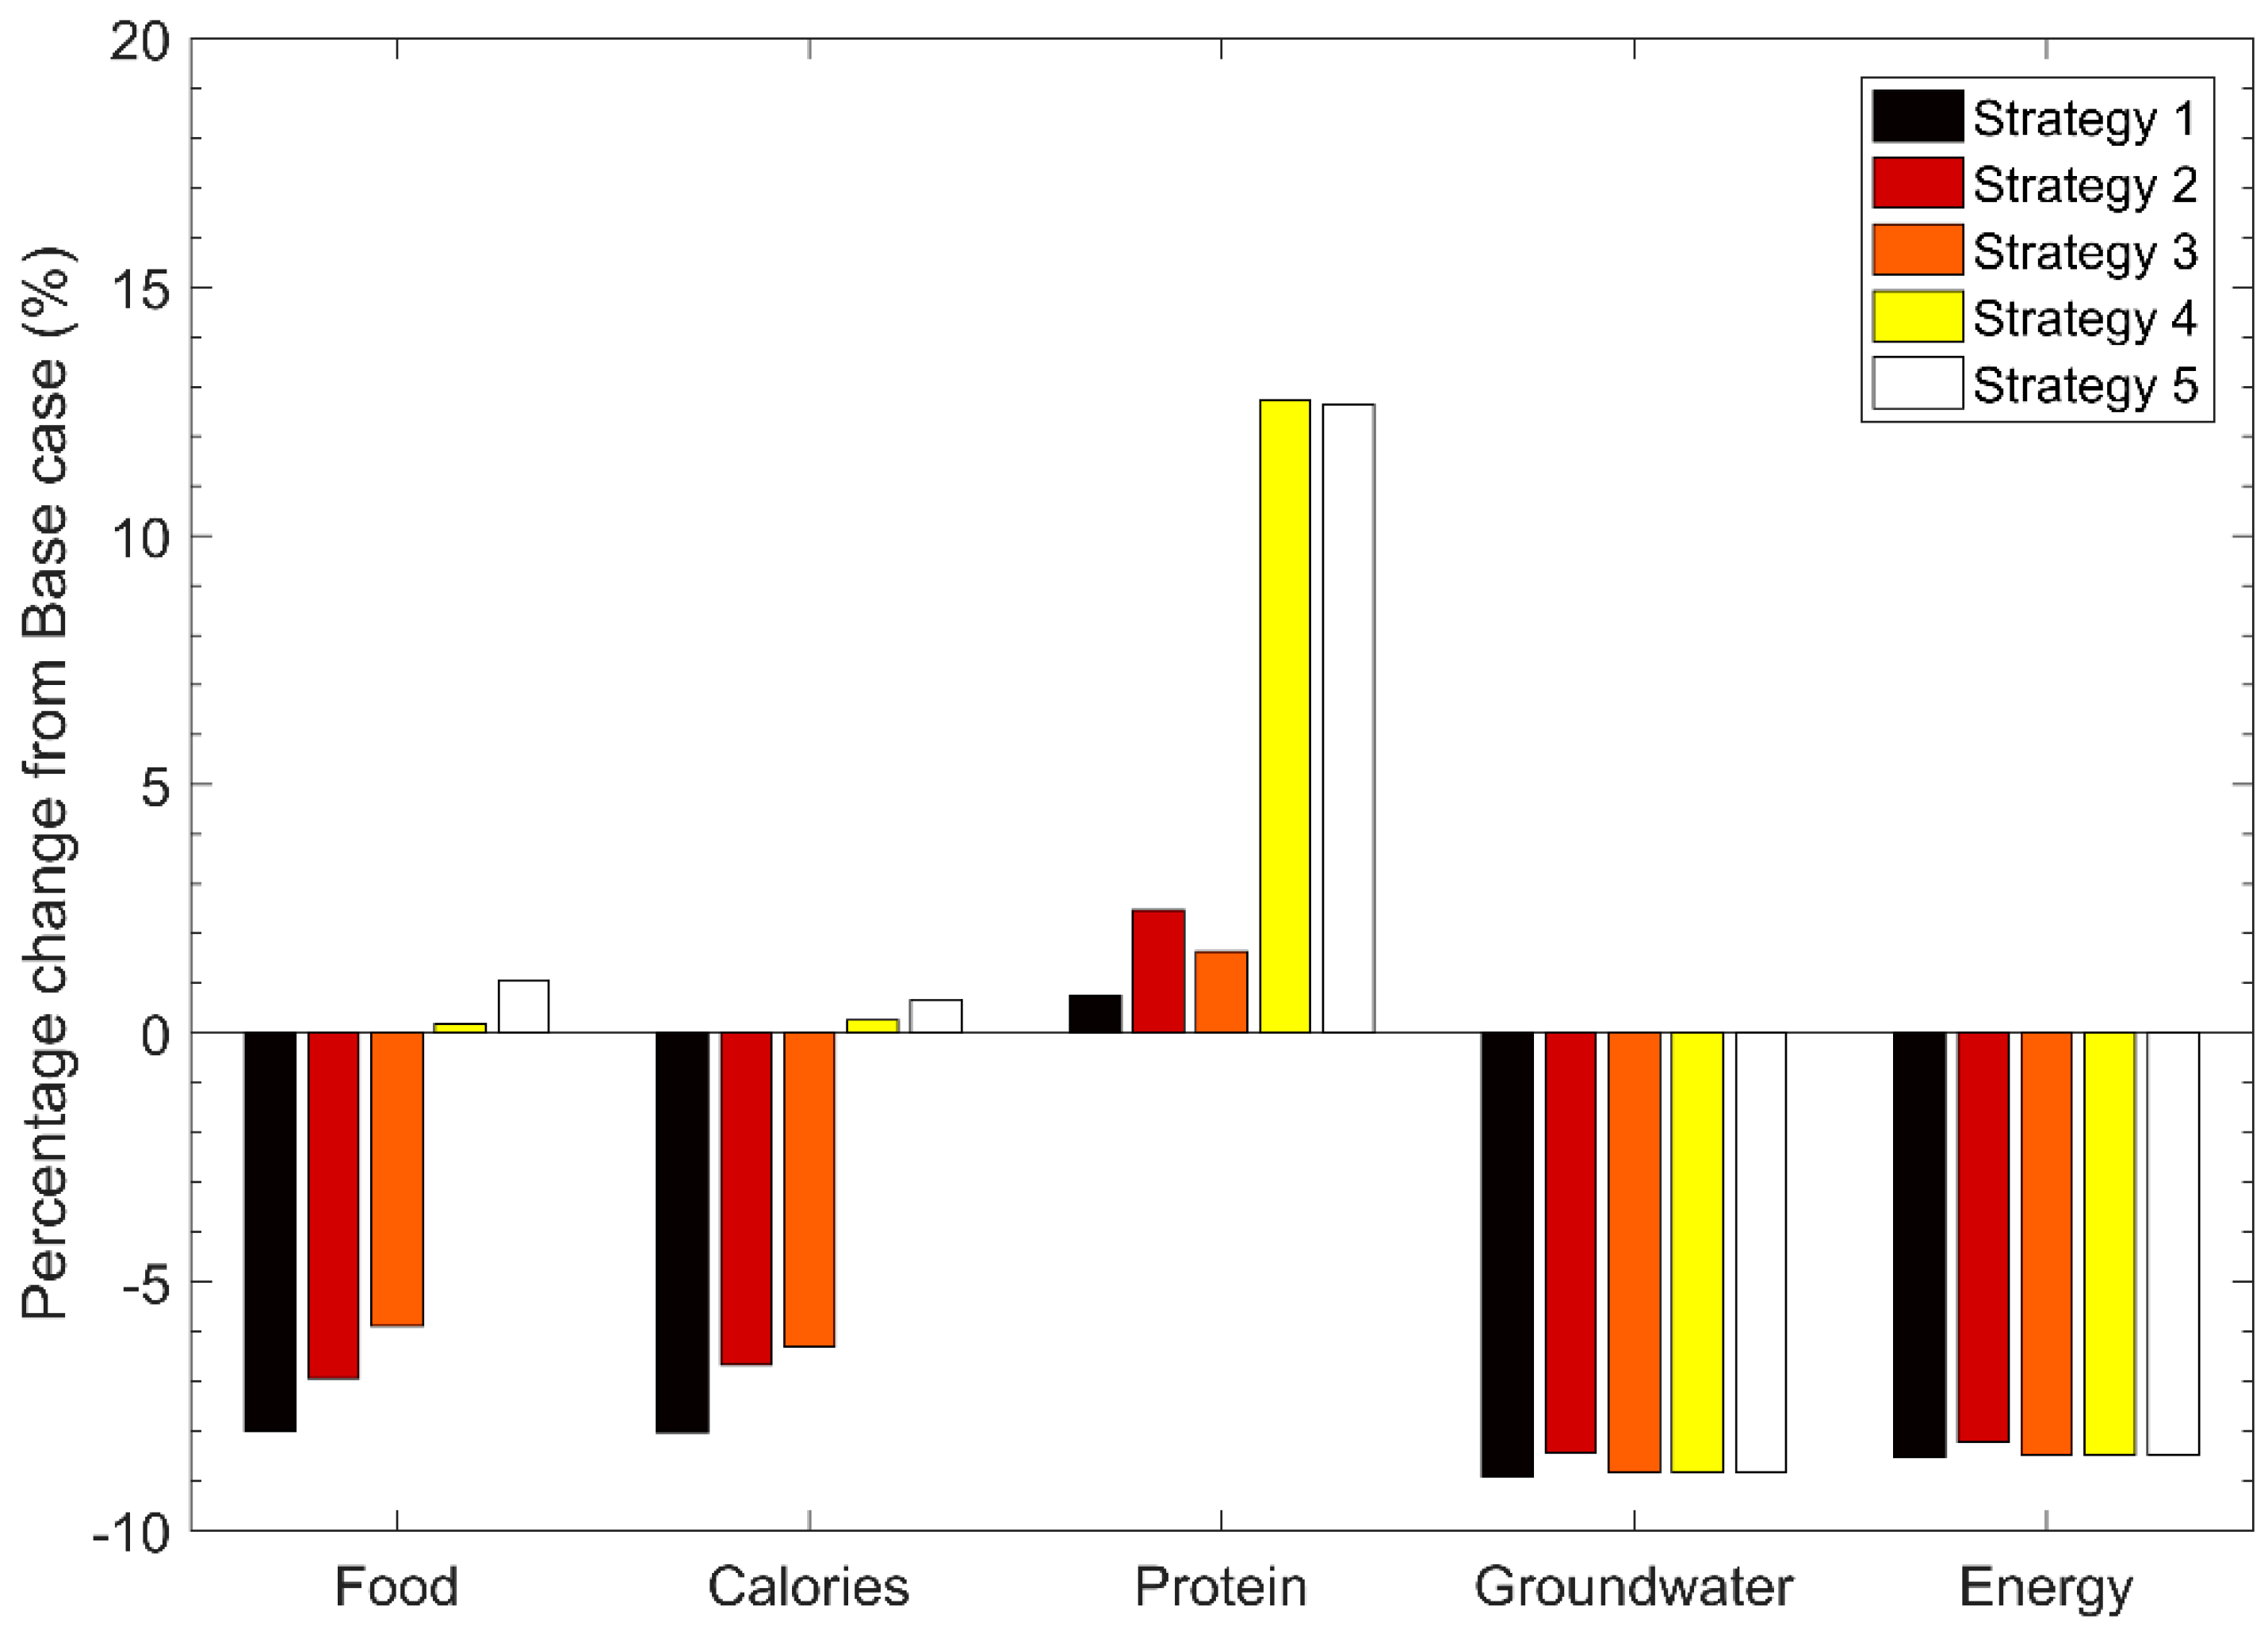
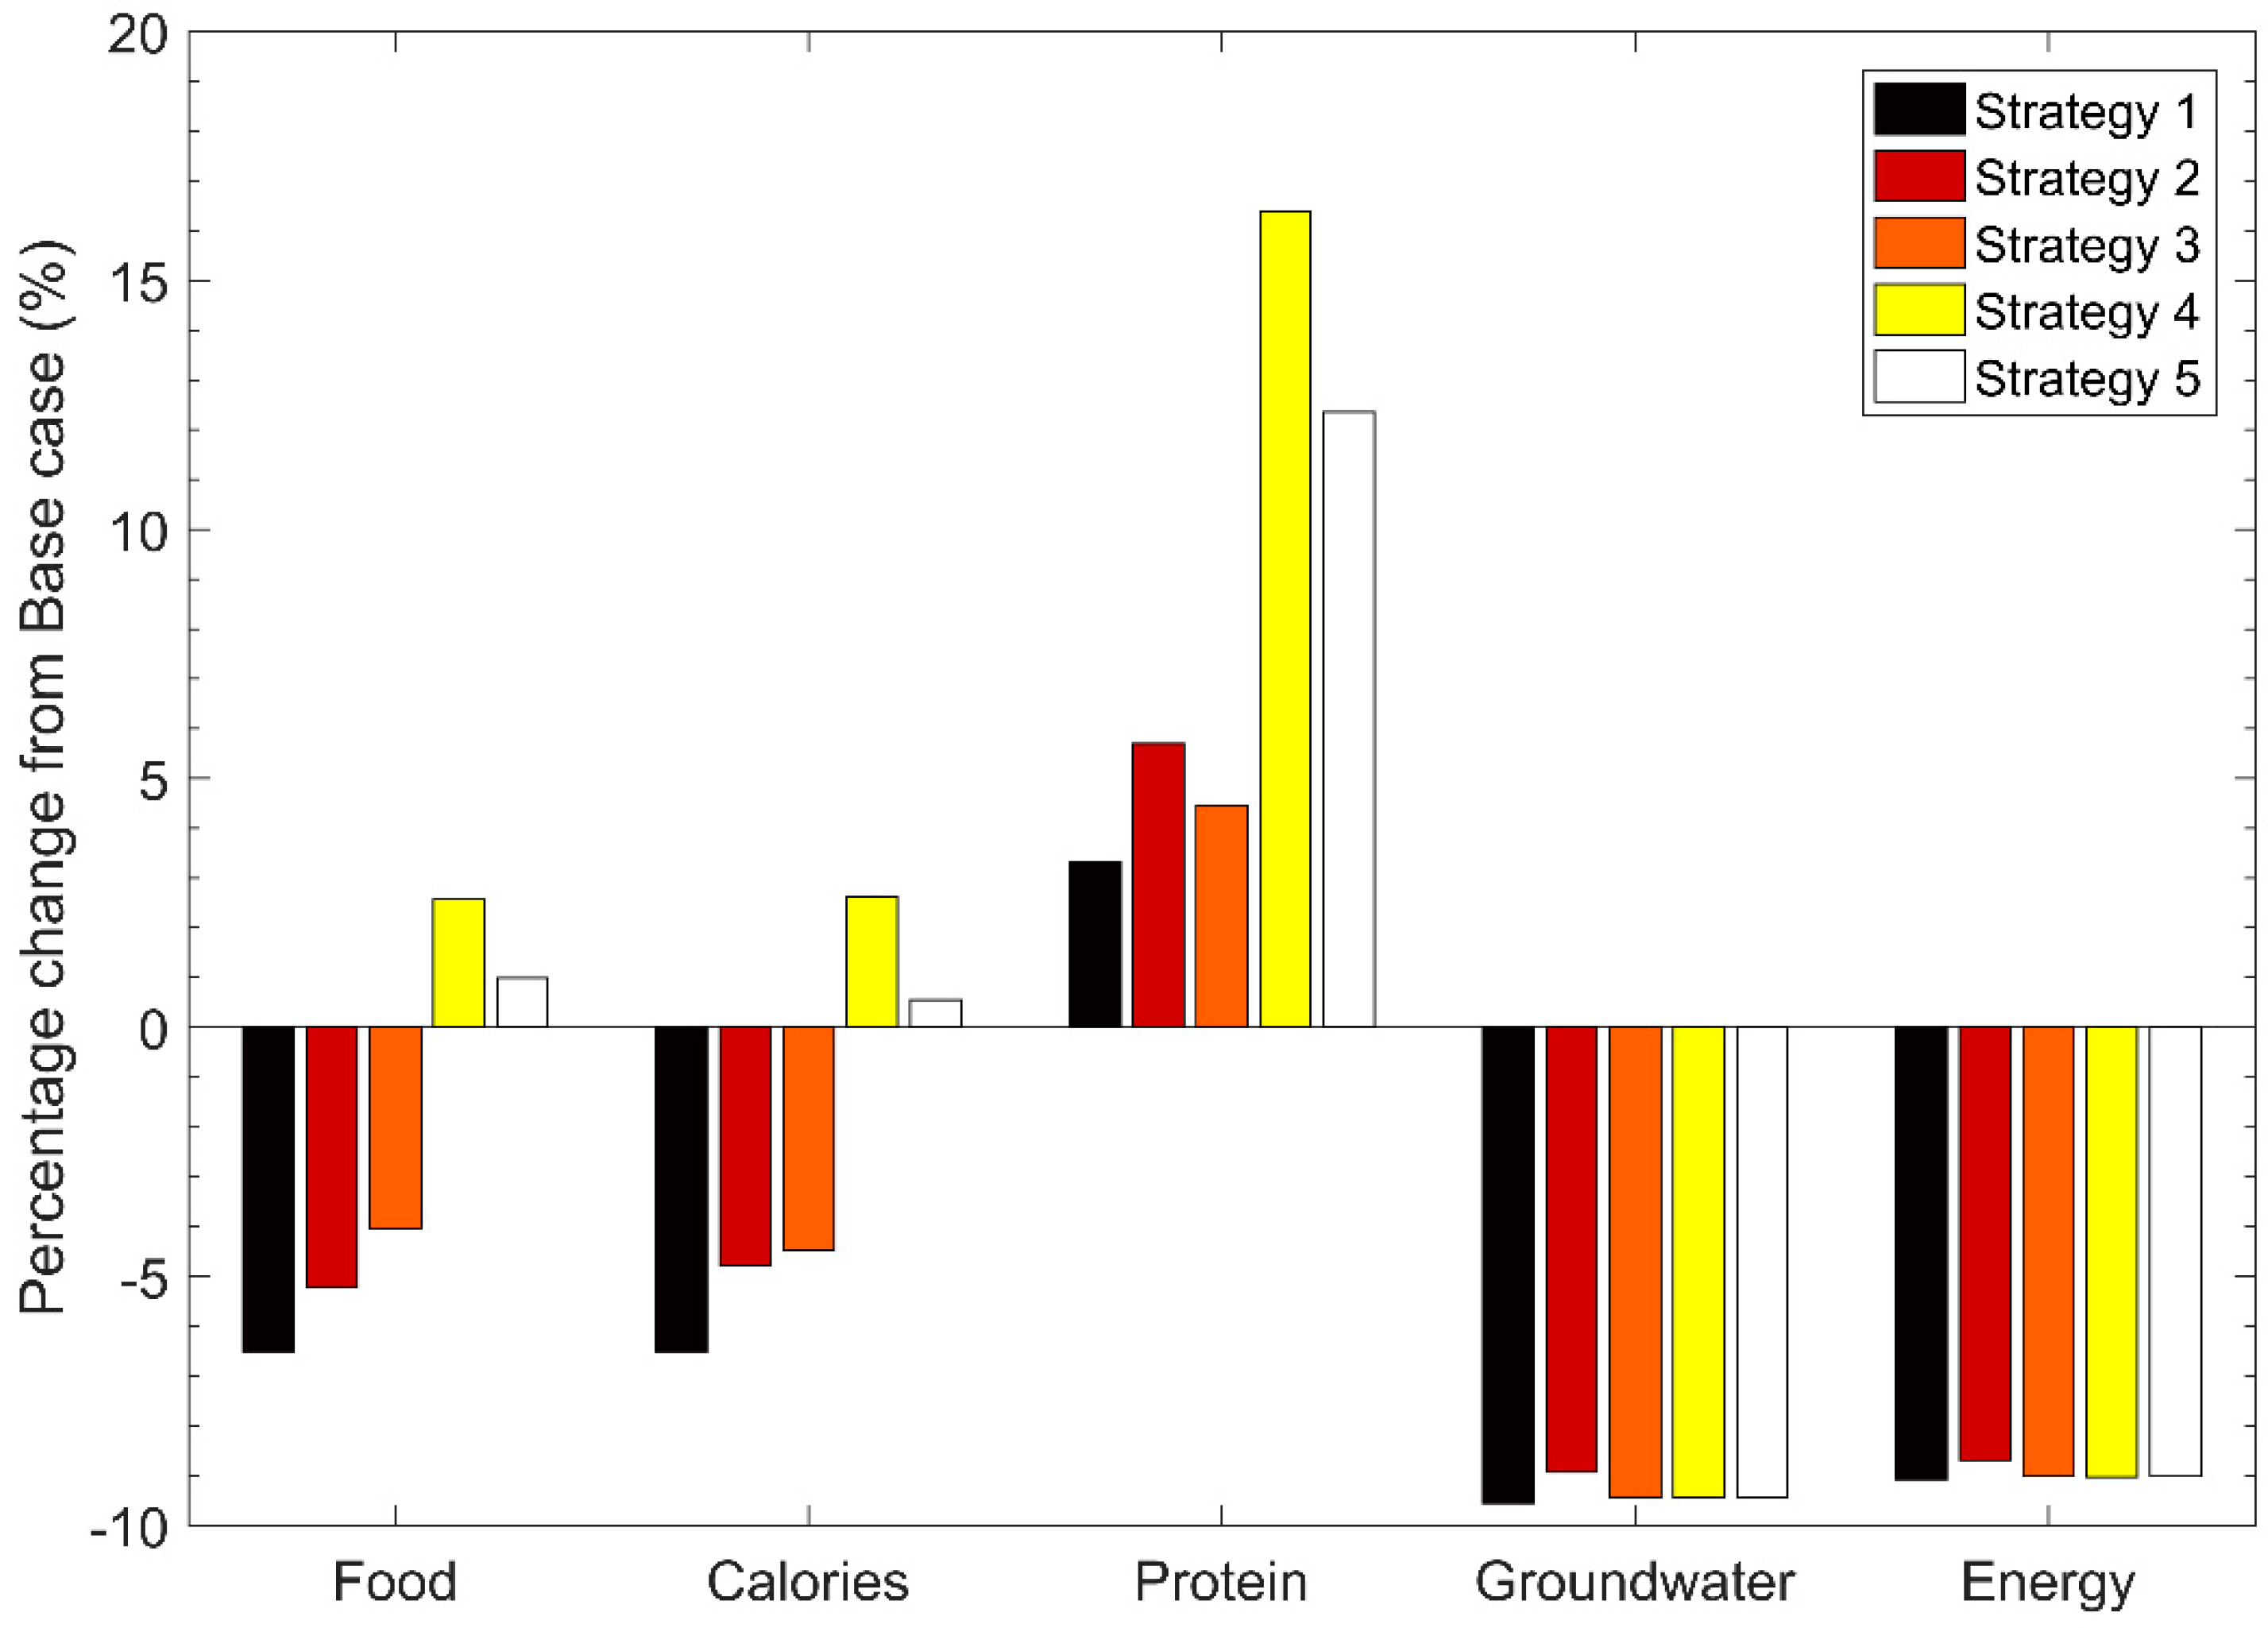
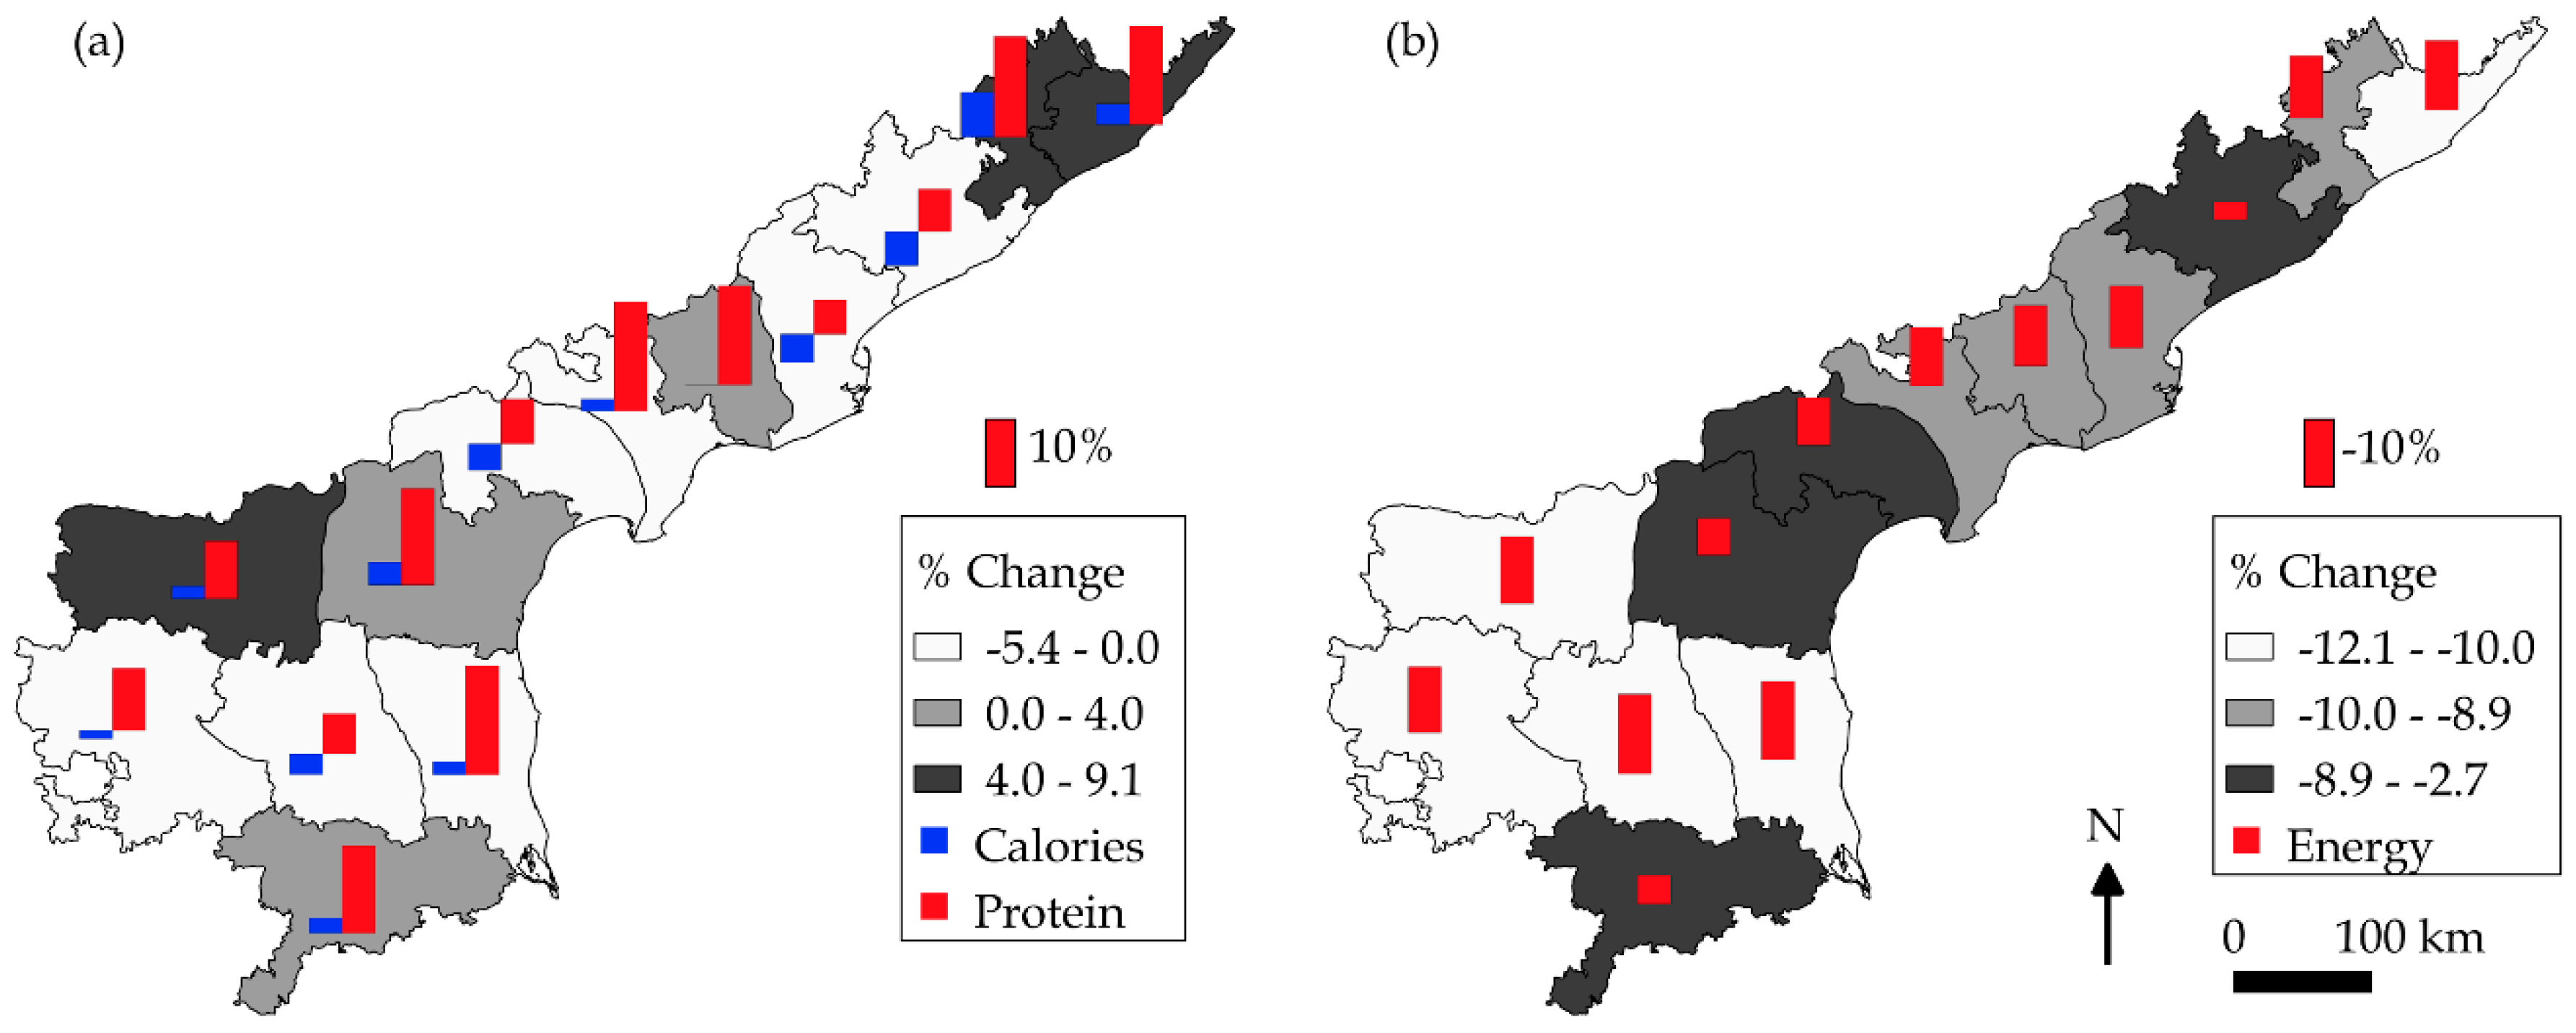
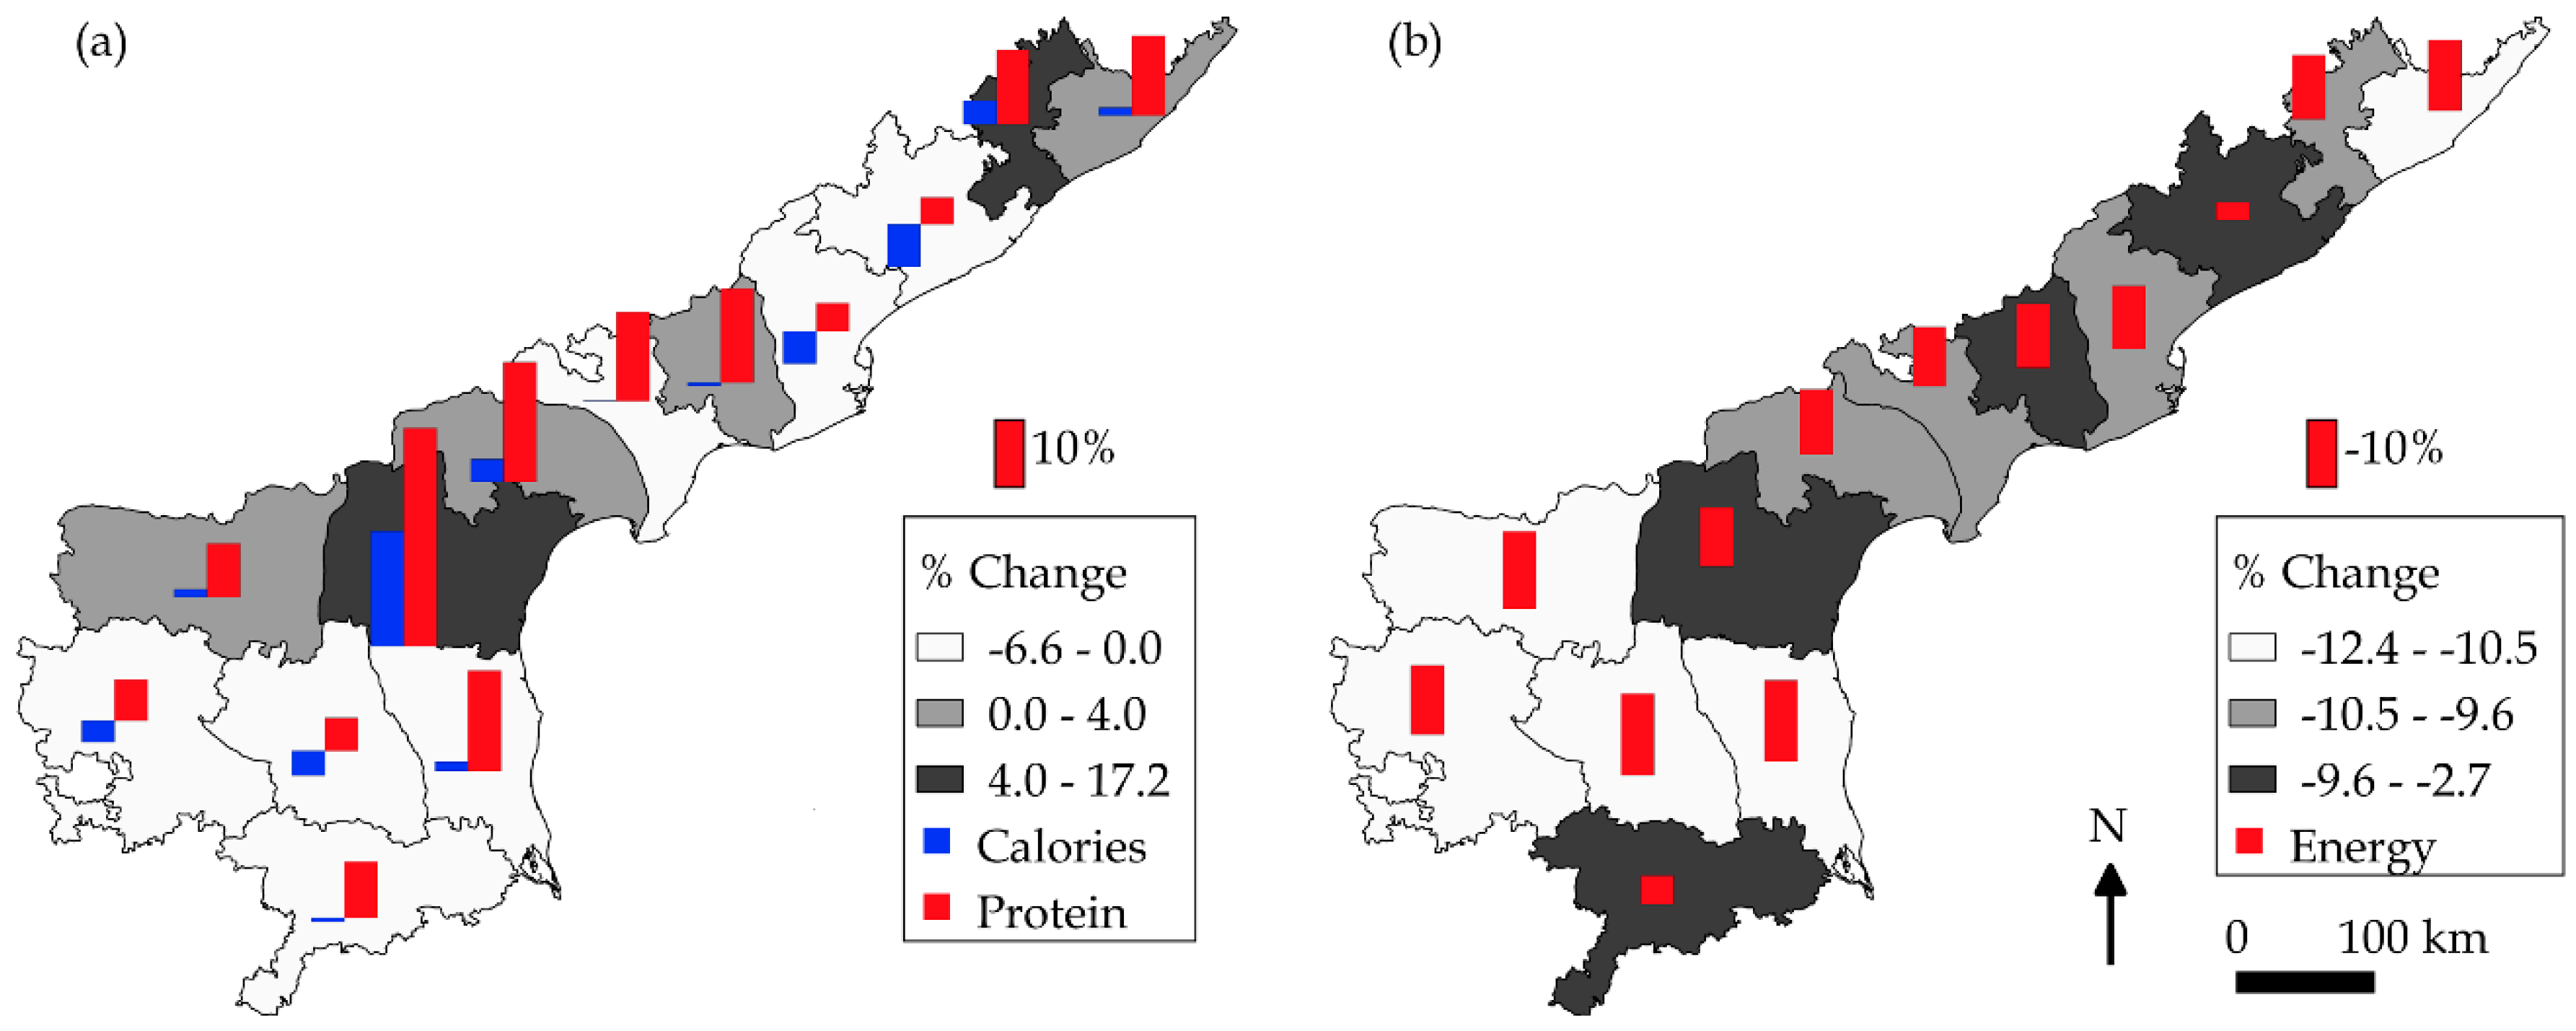
3.2. Crop Diversification

Crop diversification is implemented using the five strategies, as detailed in Section 2.2, and a comparison of results between Scenarios A, B, and C is displayed in Table 5. We first discuss the results of strategies 1–3. From the results, it is clear that these strategies fall short of fully matching the food and calorific production of the base case by around 5.9–8.0% and 6.3–8.0% in scenario B, and 4.0–6.5% in scenario C, respectively (see Figure 2 and Figure 3). The reason for this decline is evident since paddy has a higher yield and calorific content than the crops that replaced it. However, all three strategies produce more grams of protein (ranging from 0.7–5.7%) than the base case. This increase, too, is evident since the crops that replace paddy have higher protein content than it. Besides, all three strategies consume less groundwater than the base case, ranging from 8.4–8.9% for scenario B and 8.9–9.6% for scenario C. The energy consumption values also show similar reductions.
While strategies 1–3 are unable to match the food production and calorific content of the base case, strategy 4 surpasses the food production by 0.2% and 2.6%, and calorific content by 0.3% and 2.6% in scenarios B and C, respectively. While this increase is relatively small, the protein content shows a remarkable increase of 12.7% and 16.4% in scenarios B and C, respectively. Groundwater and energy consumption values are comparable to other strategies. In the case of strategy 5, the average yield is multiplied by a factor K, such that food production and nutritional content would “break-even” with the base case. For scenario B, the K value is found to be 1.3 (rounded to the first decimal). In other words, the average yield of the four crops has to be increased by 30% to produce the same amount of food grains and nutritional content as the base case. In this strategy, food production, calorific content, and protein content surpass the base case by 1.1%, 0.7%, and 12.6%, respectively. For scenario C, the K value is found to be 1.2 (i.e., a 20% increase in average yield). In this strategy, food production, calorific content, and protein content surpass the base case by 1.0%, 0.6%, and 12.4%, respectively. The savings in groundwater and energy consumption are comparable to the previous strategies.
It is interesting to note that while groundwater and energy savings are almost uniform across all strategies, the food production and nutritional content vary widely from one to the other. In other words, irrespective of the distribution strategy for crop diversification, the net irrigation water requirement for the entire region remains almost the same. However, in terms of food and nutrition security, the choice of distribution strategy is crucial. An even more important finding from this study is that increased yields of crops, such as millets and pulses, are vital to improving nutritional security. In India, the average yield of millets and pulse is around 25% of that of the yield of cereals [28,32]. There is tremendous scope for improvement in this yield: for instance, many countries around the world have yields of chickpea and pigeon pea that are 30–125% higher than India’s. The results from this study indicate a minimum increase in yields of 20–30% to make crop diversification a genuinely successful strategy for the sustainable intensification of agriculture.
Across the entire study area, there is a net improvement in food production, nutritional content, as well as in groundwater and energy consumption in strategy 5 (scenarios B and C). However, the spatial distribution of these attributes sheds more light on the various regions and their contribution to the changes observed over the study area (Figure 4 and Figure 5). For instance, more than 50% of the districts show lower food production (negative change) compared to the base case. Most districts (five out of seven) that have a net decline in food production also show a decline in calories. However, in terms of protein, all districts show a positive change irrespective of the decline in food production. The magnitudes of these changes vary from one district to the other. In terms of groundwater and energy consumption, there is a marked reduction across the entire study region. Thus, while the food and nutritional security aspects may be variable across the region, the environmental benefits due to reduced groundwater and energy consumption will be felt all over the study area. In this study, the approach used is uniform for the entire region. If instead, a hierarchy of strategies can be developed from global to regional to local levels tailored to suit local conditions, it may be possible to obtain favorable outcomes on all fronts.

4. Future Perspectives and Conclusions

Although the full impact of the COVID-19 pandemic on agriculture may become evident in the coming years, this study has attempted to quantify the potential impacts of diversifying crops on food and nutritional security. This study has illustrated the efficacy of crop diversification strategies for sustainable intensification of agriculture by improving food and nutritional security while simultaneously reducing the associated groundwater and energy footprint. The results from this study show that crop diversification can indeed be successful in reducing groundwater and energy consumption by about 9% in the entire study area. It is difficult, from a policy perspective, to impose a Pigouvian tax to minimize externalities associated with water and energy, and hence, diversifying towards low water-intensive crops would be a soft and effective measure to plunge over-extraction of groundwater and energy consumption. By choosing the appropriate crops and distribution strategy, the availability of proteins can be increased by about 12%, while also marginally increasing the calorific content of food grains by almost 1%. This study shows that the average yield of millets and pulses must increase by 30% to offset a 20% decline in paddy cultivation. This study also highlights the need for developing a hierarchy of strategies from the global to the local levels such that solutions can be tailored to suit local conditions.
In terms of policy interventions, we suggest the following: (1). Enabling the availability of seeds for millet cultivation through agricultural extension, (2). Minimum support price has to be fixed for millet products and their procurement through the Agricultural Produce Market Committees (APMCs), (3). Facilitating agricultural credit for farmers cultivating millets, (4). Inclusion of millets in the PDS basket across the state (at present, finger millet is distributed in Ananathpur and Chittoor districts, and Sorghum in Kurnool, Kadapa, and Krishna districts; [48]), (5). An additional incentive for millets cultivating farmers through ‘YSR RythuBharosa’—implemented in 2019, and under this scheme, each farming family receives Rs. 12,500 per year [48], (6). The state government should adopt a nudging approach by providing information about benefits and schemes related to the cultivation of millets through soil health cards, (7). Promote the consumption of millets by conducting fairs at the village, district, and state levels, and (8). Special package for promotion of millet cultivation across the states. Further, as the state of Andhra Pradesh is quite progressive in the context of zero-budget natural farming, there could be a possibility of the increasing area under millets under this program. While millets may not be a significant part of household diets at present, their inclusion in future diets may become inevitable due to their nutritional benefits and drought-resistance [29,30,49]. Several researchers have highlighted the need for moving towards diets with lower environmental impacts [16,50], in which millets and pulses can play an important role. Future research must focus on increasing yields of millets and pulses, which can help in transitioning away from extensive rice and wheat cultivation [51]. With an eye on future food demand, strategies for sustainable intensification of agriculture must equally prioritize higher yields and environmental conservation.

Author Contributions

Conceptualization: P.V.S.; methodology: P.V.S. and G.S.J.; data collection: P.V.S. and G.S.J.; analysis: P.V.S. and C.S.B.; writing—original draft preparation: P.V.S., G.S.J. and C.S.B.; writing—review and editing: P.V.S. All authors have read and agreed to the published version of the manuscript.

Funding

This research received no external funding.

Conflicts of Interest

The authors declare no conflict of interest.

References

  1. Dasgupta, D.; Rajeev, M. Paradox of a Supply Constrained Keynesian Equilibrium. Econ. Political Wkly. 2020, 55, 23. [Google Scholar]
  2. Food and Agriculture Organization. Available online: http://www.fao.org/2019-ncov/q-and-a/impact-on-food-and-agriculture/en/ (accessed on 5 May 2020).
  3. United Nations. Available online: https://news.un.org/en/story/2020/04/1062272 (accessed on 14 May 2020).
  4. Business Standard India Labour Issues: Punjab to Promote Maize Cultivation in Coming Kharif Season. Available online: https://www.business-standard.com/article/economy-policy/labour-issues-punjab-to-promote-maize-cultivation-in-coming-kharif-season-120041900798_1.html (accessed on 9 May 2020).
  5. IMF World Economic Outlook, April 2020: The Great Lockdown. Available online: https://www.imf.org/en/Publications/WEO/Issues/2020/04/14/weo-april-2020 (accessed on 5 May 2020).
  6. ICRISAT Containing COVID19 impacts on Indian Agriculture—ICRISAT. Available online: https://www.icrisat.org/containing-covid19-impacts-on-indian-agriculture/ (accessed on 5 May 2020).
  7. Subramanian, A.; Felman, J. India’s Great Slowdown. Available online: https://www.hks.harvard.edu/centers/cid/publications/faculty-working-papers/india-great-slowdown (accessed on 1 June 2020).
  8. Sen, A. Food, economics and entitlements. Political Econ. Hunger 1990, 1, 34–50. [Google Scholar]
  9. UN World Population Prospects—Population Division—United Nations. Available online: https://population.un.org/wpp/ (accessed on 5 May 2020).
  10. Shah, T.; Scott, C.; Kishore, A.; Sharma, A. Energy-Irrigation Nexus in South Asia: Improving Groundwater Conservation and Power Sector Viability; International Water Management Institute: Colombo, Sri Lanka, 2004; Volume 70. [Google Scholar]
  11. Tilman, D.; Balzer, C.; Hill, J.; Befort, B.L. Global food demand and the sustainable intensification of agriculture. Proc. Natl. Acad. Sci. USA 2011, 108, 20260–20264. [Google Scholar] [CrossRef] [PubMed] [Green Version]
  12. Aeschbach-Hertig, W.; Gleeson, T. Regional strategies for the accelerating global problem of groundwater depletion. Nat. Geosci. 2012, 5, 853–861. [Google Scholar] [CrossRef]
  13. Scanlon, B.R.; Mukherjee, A.; Gates, J.; Reedy, R.C.; Sinha, A.K. Groundwater recharge in natural dune systems and agricultural ecosystems in the Thar Desert region, Rajasthan, India. Hydrogeol. J. 2010, 18, 959–972. [Google Scholar] [CrossRef]
  14. Famiglietti, J.S. The global groundwater crisis. Nat. Clim. Chang. 2014, 4, 945–948. [Google Scholar] [CrossRef]
  15. Phalan, B.; Green, R.E.; Dicks, L.V.; Dotta, G.; Feniuk, C.; Lamb, A.; Strassburg, B.B.; Williams, D.R.; Zu Ermgassen, E.K.; Balmford, A. How can higher-yield farming help to spare nature? Science 2016, 351, 450–451. [Google Scholar] [CrossRef] [Green Version]
  16. Willett, W.; Rockström, J.; Loken, B.; Springmann, M.; Lang, T.; Vermeulen, S.; Garnett, T.; Tilman, D.; DeClerck, F.; Wood, A.; et al. Food in the Anthropocene: The EAT–Lancet Commission on healthy diets from sustainable food systems. Lancet 2019, 393, 447–492. [Google Scholar] [CrossRef]
  17. Wada, Y.; van Beek, L.P.H.; Bierkens, M.F.P. Nonsustainable groundwater sustaining irrigation: A global assessment: Nonsustainable groundwater sustaining irrigation. Water Resour. Res. 2012, 48. [Google Scholar] [CrossRef]
  18. Blakeslee, D.; Fishman, R.; Srinivasan, V. Way Down in the Hole: Adaptation to Long-Term Water Loss in Rural India. Am. Econ. Rev. 2020, 110, 200–224. [Google Scholar] [CrossRef] [Green Version]
  19. Fishman, R. Running Out of Water, Walking Away from Farming. Available online: http://www.ideasforindia.in/topics/environment/running-out-of-water-walking-away-from-farming.html (accessed on 30 May 2020).
  20. Sachs, J.D. From millennium development goals to sustainable development goals. Lancet 2012, 379, 2206–2211. [Google Scholar] [CrossRef]
  21. Grigss, D. Sustainable developmnet goals for people and planet. Nature 2013, 495, 305–307. [Google Scholar] [CrossRef] [PubMed]
  22. FAO. Nutrition-sensitive Agriculture. In Proceedings of the Second International Conference on Nutrition, Rome, Italy, 19–21 November 2014; pp. 29–36. [Google Scholar] [CrossRef]
  23. Davis, K.F.; Rulli, M.C.; Seveso, A.; D’Odorico, P. Increased food production and reduced water use through optimized crop distribution. Nat. Geosci. 2017, 10, 919–924. [Google Scholar] [CrossRef]
  24. Giller, K.E.; Witter, E.; Corbeels, M.; Tittonell, P. Conservation agriculture and smallholder farming in Africa: The heretics’ view. Field Crops Res. 2009, 114, 23–34. [Google Scholar] [CrossRef]
  25. Ruel, M.T.; Quisumbing, A.R.; Balagamwala, M. Nutrition-sensitive agriculture: What have we learned so far? Glob. Food Secur. 2018, 17, 128–153. [Google Scholar] [CrossRef]
  26. Cassman, K.G.; Grassini, P. A global perspective on sustainable intensification research. Nat. Sustain. 2020, 3, 262–268. [Google Scholar] [CrossRef] [Green Version]
  27. Hunter, M.C.; Smith, R.G.; Schipanski, M.E.; Atwood, L.W.; Mortensen, D.A. Agriculture in 2050: Recalibrating targets for sustainable intensification. Bioscience 2017, 67, 386–391. [Google Scholar] [CrossRef] [Green Version]
  28. Government of India. Food and Nutrition Security Analysis. Available online: http://www.indiaenvironmentportal.org.in/files/file/Food%20and%20Nutrition%20Security%20Analysis.pdf (accessed on 5 May 2020).
  29. Kumar, A.; Tomer, V.; Kaur, A.; Kumar, V.; Gupta, K. Millets: A solution to agrarian and nutritional challenges. Agric. Food Secur. 2018, 7, 31. [Google Scholar] [CrossRef]
  30. Saxena, R.; Vanga, S.K.; Wang, J.; Orsat, V.; Raghavan, V. Millets for Food Security in the Context of Climate Change: A Review. Sustainability 2018, 10, 2228. [Google Scholar] [CrossRef] [Green Version]
  31. Davis, K.F.; Chhatre, A.; Rao, N.D.; Singh, D.; Ghosh-Jerath, S.; Mridul, A.; Poblete-Cazenave, M.; Pradhan, N.; DeFries, R. Assessing the sustainability of post-Green Revolution cereals in India. Proc. Natl. Acad. Sci. USA 2019, 116, 25034–25041. [Google Scholar] [CrossRef] [Green Version]
  32. Rawal, V.; Navarro, D.K. The Global Economy of Pulses; FAO: Rome, Italy, 2019; p. 190. [Google Scholar]
  33. Awika, J.M. Major Cereal Grains Production and Use around the World. In Advances in Cereal Science: Implications to Food Processing and Health Promotion; Awika, J.M., Piironen, V., Bean, S., Eds.; American Chemical Society: Washington, DC, USA, 2011; Volume 1089, pp. 1–13. ISBN 978-0-8412-2636-4. [Google Scholar]
  34. OECD Never Let A Good Water Crisis Go To Waste—OECD. Available online: https://www.oecd.org/agriculture/never-waste-a-good-water-crisis/ (accessed on 8 May 2020).
  35. Satpathi, S.; Saha, A.; Basu, S. Millets as a Policy Response to the Food and Nutrition Crisis—Special Reference to the Odisha Millets Mission. Available online: https://www.brlf.in/brlf2/wp-content/uploads/2020/01/Odisha-Millet-Mission.pdf (accessed on 30 May 2020).
  36. Government of Andhra Pradesh. India Comprehensive Revival of Millets Program (Cmrp)—Andhra Pradesh. Available online: https://www.wassan.org/Millets.htm (accessed on 1 June 2020).
  37. Clarke, D.; Smith, M.; El-Askari, K. CropWat for Windows: User Guide. Available online: http://www.fao.org/land-water/databases-and-software/cropwat/en/ (accessed on 6 May 2020).
  38. Government of Andhra Pradesh. India Agricultural Statistics At A Glance 2017–18. Available online: https://core.ap.gov.in/CMDashBoard/Download/Publications/ASAG-%202017-18.pdf (accessed on 6 May 2020).
  39. Government of Andhra Pradesh. India Socio-Economic Survey 2018–19, Government of Andhra Pradesh. Available online: https://www.apfinance.gov.in/downloads/SocioEconomicalSurvey2018-19.pdf (accessed on 1 June 2020).
  40. Suryanarayana, M.H.; Agrawal, A.; Prabhu, K.S. Inequality-adjusted Human Development Index for India’s States. Available online: https://www.undp.org/content/dam/india/docs/inequality_adjusted_human_development_index_for_indias_state1.pdf (accessed on 1 June 2020).
  41. Government of Andhra Pradesh, India. Available online: https://core.ap.gov.in/CMDashBoard/UserInterface/EconomicsandStatistics/AgricultureStatisticsReport.aspx (accessed on 6 May 2020).
  42. IMD Long Range ForecastFor the 2020 Southwest Monsoon Season Rainfall. Available online: https://mausam.imd.gov.in/Forecast/marquee_data/1st_Stage_LRF_apr_2020_English.pdf (accessed on 12 May 2020).
  43. APWRIMS. Available online: http://www.apwrims.ap.gov.in/ (accessed on 6 May 2020).
  44. India Water Portal Meteorological Datasets. Available online: https://www.indiawaterportal.org/met_data/ (accessed on 6 May 2020).
  45. Tribune India Wheat Procurement 18.35 per cent Less Than Last Year. Available online: https://www.tribuneindia.com/news/nation/wheat-procurement-18-35-per-cent-less-than-last-year-82196 (accessed on 9 May 2020).
  46. Davis, K.; Seveso, A.; Rulli, M.; D’Odorico, P. Water Savings of Crop Redistribution in the United States. Water 2017, 9, 83. [Google Scholar] [CrossRef] [Green Version]
  47. Government of Andhra Pradesh, India. Available online: https://core.ap.gov.in/CMDashBoard/userinterface/groundwater/groundwaterreports.aspx (accessed on 7 May 2020).
  48. Government of Andhra Pradesh. India White paper on Agriculture, Horticulture, Animal Husbandry, Sericulture, Dairy Development, Fisheries, Agricultural Marketing Departments. Available online: https://www.ap.gov.in/wp-content/uploads/2018/12/White-paper-on-Agriculture-Horticulture-Animal-Husbandry-Sericulture-Dairy-Development-Fisheries-Agricultural-Marketing-Departments.pdf (accessed on 1 June 2020).
  49. Jain, M.; Solomon, D.; Capnerhurst, H.; Arnold, A.; Elliott, A.; Kinzer, A.; Knauss, C.; Peters, M.; Rolf, B.; Weil, A.; et al. How much can sustainable intensification increase yields across South Asia? A systematic review of the evidence. Environ. Res. Lett. 2020, 15. [Google Scholar] [CrossRef]
  50. Davis, K.F.; Gephart, J.A.; Emery, K.A.; Leach, A.M.; Galloway, J.N.; D’Odorico, P. Meeting future food demand with current agricultural resources. Glob. Environ. Chang. 2016, 39, 125–132. [Google Scholar] [CrossRef]
  51. Kayatz, B.; Harris, F.; Hillier, J.; Adhya, T.; Dalin, C.; Nayak, D.; Green, R.F.; Smith, P.; Dangour, A.D. “More crop per drop”: Exploring India’s cereal water use since 2005. Sci. Total Environ. 2019, 673, 207–217. [Google Scholar] [CrossRef] [PubMed]
Figure 1. The state of Andhra Pradesh in southern India and the spatial distribution of normal annual rainfall across the districts of Andhra Pradesh.
Water 12 02738 g001
Figure 2. Impact of crop diversification in Scenario B (strategy 5) as compared to Scenario A (base case). In the plot, positive values indicate an increase in the given attribute as compared to the base case and vice versa.
Water 12 02738 g002
Figure 3. Impact of crop diversification in Scenario C (strategy 5) as compared to Scenario A (base case). In the plot, positive values indicate an increase in the given attribute as compared to the base case and vice versa.
Water 12 02738 g003
Figure 4. Spatial distribution of the impact of crop diversification across the study area for Scenario B (strategy 5). The values plotted are the percentage change compared to the base case: (a) Food production (the bar charts represent the corresponding changes in calories and protein production); (b) Groundwater consumption (the bar chart represents the changes in energy consumption).
Water 12 02738 g004
Figure 5. Spatial distribution of the impact of crop diversification across the study area for Scenario C (strategy 5). The values plotted are the percentage change compared to the base case: (a) Food production (the bar charts represent the corresponding changes in calories and protein production); (b) Groundwater consumption (the bar chart represents the changes in energy consumption).
Water 12 02738 g005
Table 1. Major crops cultivated in Andhra Pradesh in the Kharif season. The area represents the average area under cultivation from 2013–2018. The last column is the overall percentage of area under groundwater irrigation in the study area [41].
CropArea under Cultivation (′000 ha)Percentage Irrigated by Groundwater (%)
Maize106.820.7
Paddy1477.714.7
Bengal gram0.34.3
Black gram44.212.7
Green gram14.39.1
Horse gram24.10.5
Red gram266.42.2
Bajra (pearl millet)40.219.2
Jowar (sorghum)40.83.5
Ragi (finger millet)26.91.8
Groundnut673.24.9
Chilies87.335.4
Cotton644.55.9
Sugarcane98.841.4
Table 2. Average yields and nutritional content (energy and protein) of various crops. Yield data is the average of yields from 2013–2017 [41]. Data on the nutritional content of various crops obtained from multiple sources [29,32,46].
CropAverage Yield (kg ha−1)Energy (kcal kg−1)Protein (g kg−1)
Maize3764.73008.372.7
Paddy4073.73695.469.5
Bengal gram1322.53320212
Black gram856.63160239
Green gram644.03250209
Horse gram269.23090253
Red gram595.13060206
Bajra (pearl millet)1738.33630114
Jowar (sorghum)1294.93290108.2
Ragi (finger millet)959.3334074.4
Groundnut1658.25373.8230.4
Table 3. Irrigation water requirement for major crops cultivated in the study area. The numbers listed represent the range (minimum to maximum) and average across the entire region.
CropRange of Irrigation Water Requirement (mm)Average Irrigation Water Requirement (mm)
Maize9–320117
Paddy153–1037478
Bengal gram3–387150
Black gram0–22597
Green gram3–290102
Horse gram14–206109
Red gram3–21688
Bajra (pearl millet)0–23577
Jowar (sorghum)0–29485
Ragi (finger millet)0–23539
Groundnut0–400135
Chilies20–232127
Cotton35–490266
Sugarcane554–14711039
Table 4. Total groundwater consumption across the study area.
DistrictTotal Groundwater Consumption (mm3)
Ananthapur118.2
Chittoor335.8
East Godavari84.9
Guntur104.3
Krishna143.9
Kurnool220.0
Prakasam111.1
S.P.S. Nellore425.4
Srikakulam17.1
Visakhapatnam81.7
Vizianagaram32.2
West Godavari374.9
Y.S.R. Kadapa191.1
Total2240.6
Table 5. Comparison of food production and associated groundwater and energy consumption between Scenarios A, B, and C.
ScenarioStrategyFood
(million tons)
Energy
(1012 kCal)
Protein
(1011 g)
Groundwater (billion m3)Energy
(GW h)
A-1.304.811.052.24119.9
B 11.194.421.052.04109.7
21.214.491.072.05110.1
31.224.501.062.04109.8
41.304.821.182.04109.8
5 (K = 1.3)1.314.841.182.04109.8
C 11.214.491.082.03109.0
21.234.581.112.04109.5
31.244.591.092.03109.1
41.334.931.222.03109.1
5 (K = 1.2)1.314.831.182.03109.1

