Abstract
Reservoir sedimentation reduces the gross storage capacity of dams and also negatively impacts turbine functioning, posing a danger to turbine inlets. When the sediment delta approaches the dam, further concerns arise regarding sediments passing through turbine intakes, blades abrasion due to increased silt/sand concentration, choking of outlets, and dam safety. Thus, slowing down the delta advance rate is a worthy goal from a dam manager’s viewpoint. These problems can be solved through a flexible reservoir operation strategy that prioritize sediment deposition further away from the dam face. As a case study, the Mangla Reservoir in Pakistan is selected to elaborate the operational strategy. The methodology rests upon usage of a 1D sediment transport model to quantify the impact of different reservoir operating strategies on sedimentation. Further, in order to assess the long-term effect of a changing climate, a global climate model under representative concentration pathways scenarios 4.5 and 8.5 for the 21st century is used. The reduction of uncertainty in the suspended sediments concentration is achieved by employing an artificial neural networking technique. Moreover, a sensitivity analysis focused on estimating the impact of various parameters on sediment transport modelling was conducted. The results show that a gradual increase in the reservoir minimum operating level slows down the delta movement rate and the bed level close to the dam. However, it may compromise the downstream irrigation demand during periods of high water demand. The findings may help the reservoir managers to improve the reservoir operation rules and ultimately support the objective of a sustainable reservoir use for the societal benefit.
1. Introduction
Climate change has impacted the environment in many ways, and today, considerable attention is being paid to the hydrological impact of climate change, and more specifically, the evaluation of the potential impacts of climate change on future water availability and extreme events [1,2]. An important corollary of this focus is the review of reservoir operational strategies and water distribution policies under climate change scenarios. In this regard, an integrated approach will be used to propose the best doable actions and policies to cope with potential climate changes.
Reservoirs plays an important role in fulfilling the water demands of a growing world population. However, its impoundment leads to delta formation due to reduced sediment transport capacity and faster deposition rate [3]. The result is the depletion of the reservoir storage volume. According to an estimate by White [4], worldwide gross storage capacity of reservoirs has declined by about one percent annually due to sedimentation. Besides, sediment deposition in narrow channels increases the probability of flooding in the riparian areas upstream of the reservoir. Additionally, water released from a reservoir exerts a key influence on the downstream river morphology, sediment balance, and changes in the ecological properties of the river. It has been found that the reservoir storage loss due to sediment deposition is one of the key impediments in sustainable use of water resources at existing or in future reservoir management [5].
The useful life span of a reservoir is generally less than 100 years, but in some cases, it filled up much earlier than its designed life [6]. For instance, the well-known Sanmenxia Dam on the Yellow River in China faced severe deposition. It had to be reconstructed to provide an additional outlet to increase the sediment flushing capacity [5]. Similarly, the Tarbela Reservoir in Pakistan lost about one third of its storage capacity over 40 years, and the Warsak Reservoir in Pakistan almost filled with sediments after just 30 years of operation [7]. The Girba Reservoir in Sudan lost more than 53% of its storage capacity in 40 years of operation due to sedimentation [8].
There are a number of sediment removal techniques, e.g., dry excavation, hydraulic dredging, sluicing, and siphoning [4]. Flushing is a technique, in which the sediment-laden flows are passed through a reservoir downstream during the flood season, as well as re-suspending and removing the already deposited sediment [9]. However, all these possible solutions consume large proportions of water that will not be available for the intended purposes of the reservoir; similarly, drawing down the reservoir level during operation may cause the problems to shift to other regions. Further ways to enhance reservoir life by managing the incoming sediment load outside of the reservoir include the decrease of incoming sediment load either by modified watershed management, upstream sediment trapping, controlling soil erosion, or bypassing the turbid flows [10].
Thus, reservoir sedimentation reduces the useful life of a dam and leads to a failure to discharge the intended functions for which the dam was built in the first place, i.e., provision of irrigation water, municipal water supply, production of hydropower, and navigation [11]. Further, the sediment deposition may cause damage to the dam structure by choking the outlets and threatening the dam’s safety [12,13].
Reservoir operation significantly affects the reservoir sediment dynamics. Normally the maximum proportion of sediment load enters the reservoir during the high flow events. Most of the incoming sediments are deposited in a reservoir during such events if a high reservoir level is maintained. On the other hand, if the reservoir water level has been kept low, a large quantity of incoming sediments travels through the reservoir and often leads to degradation of already deposited sediments [14,15]. Rehman (2018) [14] and Petkovsek (2014) [15] estimated that sediment delta advancement is reduced by increasing the minimum reservoir operating level, but it also decreases the storage volume of the reservoir and vice versa. It is therefore clear that the reservoir operation policy has a critical influence on the life span of the reservoir.
Generally, numerical models have been used to analyze and quantify the impact of different measures adopted for sediment management. Normally, 1D models were often applied to simulate long-term sedimentation because of its computational efficiency in comparison to 2D/3D models [16]. The 1D models can give better performance if the reservoir has a broader width, as well as varying lateral forces of hydraulic and morphodynamics are not dominant [17]. However, 1D models cannot predict bed levels accurately on the channel bends and near to the hydraulic structures where the helical flow is formed due to the secondary currents, which can only be simulated by 3D flow and sediment models [18]. In this study, a well-known sediment model, HEC-RAS [19], developed by the Hydrological Engineering Center, USA, is used to simulate the long-term sedimentation trend in the reservoir.
This paper mainly focuses on different operational strategies for reservoirs to manage sediments. As a case study, we have selected the Mangla Reservoir in northern Pakistan. A few studies have been performed in the Jhelum River Basin (JRB) and its tributaries regarding the change in future precipitation and flows under the impact of climate change [20,21,22]. Further, only three studies have been carried out regarding incoming suspended sediment yield into the Mangla Reservoir [1,23,24]. So far, no studies have been conducted to find the potential impacts of climate change with different reservoir operating strategies on sedimentation of the Mangla Reservoir.
The sedimentation in the Mangla Reservoir is a big challenge for its management, similar to any other large reservoirs. The chief objective of the Mangla Reservoir is to supply irrigation water to an extensive network of canals in the Punjab province, the so-called food basket of Pakistan. In order to fulfill this objective, the flows of the Jhelum River and its tributaries are stored in the reservoir up to the conservation level during the high flow period. Moreover, water is released through the reservoir down to the minimal operating level to fulfill the downstream irrigation water demand. When the incoming flows are high and the reservoir level is low, then previously settled sediments are reworked and are moved towards the dam outlets [25]. However, this is not without pitfalls, as it might affect the power production, which is a secondary but a valuable objective for the power-starved economy of Pakistan. Thus, the operating level stands out as a key parameter that critically influences the reservoir’s sustainability and the yield from irrigation flows and hydroelectricity from the reservoir. Clearly, the operational policy should be such as to maximize the yield without jeopardizing the longevity of the reservoir. The objective of the present study is to explore the risk to the Mangla Dam’s future reservoir operations under a changing climate by devising a set of plausible scenarios (operation rules) and examining its effect by using 1D modeling.
In this research, several basic theoretical operational rules were developed and analyzed to assess the reservoir sedimentation in a generalized way. These rules should be of value to dams having no special flushing outlets for sediments, as numerous reservoirs commissioned during 1960s to 1970s had no such facilities. To analyze the future sedimentation in the reservoir, projected flows that derived from the Global Climate Model (GCM) under Representative Concentration Pathways (RCP) scenarios 4.5 and 8.5 (projected rise in mean temperature 1.10–2.60 °C under RCP4.5 and 2.60–4.80 °C under RCP8.5) for 21st century were used [26]. Similarly, missing and future suspended sediments predicted by the artificial neural networking technique were used as the boundary conditions in the 1D sediment model to calculate the bed level changes and sediment delta advancement rate with greater precision. The outcome of this study will help to improve the reservoir operation rules related to reservoir sedimentation and ultimately support the mission of a sustainable reservoir use for societal benefit.
2. Study Area
2.1. Description of the Study Area
Mangla Dam is a multifunction dam situated on Jhelum River in Mirpur, Azad Kashmir, Pakistan. The dam was constructed in 1967 and is located about 108 km south-east from Pakistan’s capital, Islamabad. The total catchment area of the Jhelum River Basin (JRB) up to the dam site is 33,397 km2, while the river length is about 725 km. The dam is geographically located at 33°00′ N–35°12′ N and longitudes of 73°07′ E–75°40′ E (Figure 1). A majority of the catchment area consists of hills and rugged mountains with elevations varying from 272 m above sea level (a.s.l.) to 6290 m a.s.l. The northern part of the basin is covered by snowcapped mountains. About 45% of the watershed areas of JRB is found in Pakistan administered Kashmir, while the remaining 55% lies in Indian-administered Kashmir [27]. The slope of the JRB watershed is distributed into three ranges: undulating lands: 0–3%, steep slopes: 8–30%, and mountainous landL more than 30% [21]. A major part of the watershed consists of mountainous land and steep slopes.
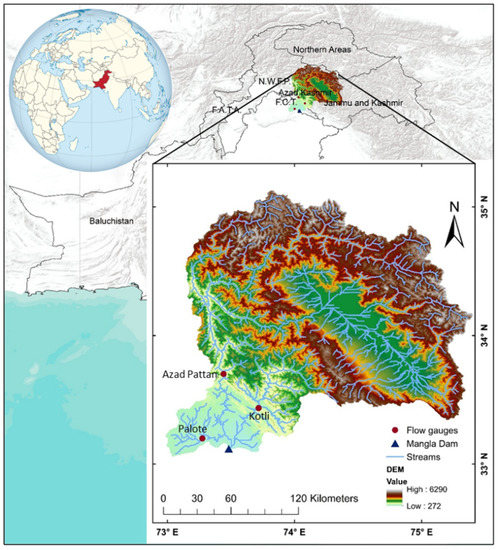
Figure 1.
The Mangla Reservoir catchment area.
The Jhelum River emerges from the Verinag Spring that lies amid the Pir Panjal and Himalayan mountain ranges in the state of Jammu and Kashmir. Two main tributaries of the Jhelum River are the Kunhar and Neelum Rivers that confluence the main stream at Kohala Bridge and Muzaffarabad, respectively. The Mangla Reservoir is fed by two perennial rivers (Jhelum and Poonch) and one non-perennial river (Kanshi). The Jhelum River is the major tributary of the Mangla Reservoir, and the Kanshi, Poonch, Khad, and Jari are the minor tributaries. The Surface Water Hydrology (SWH) Department has installed gauging stations to measure the daily runoff and sediment loads at different sites of the Jhelum, Poonch, and Kanshi Rivers at Kohala and Azad Pattan, Kotli, and Palote, respectively.
The dam was constructed to store the surplus water of JRB and, primarily, supply the water for irrigation during the low flow period i.e., October–March. Its secondary purpose is to generate hydro-electricity from the outflows and also acts to control the floods during the months of monsoon (July–September) [28]. Its benefits to Pakistan’s agriculture-based economy are immense, as it irrigates 6 million hectare area of land and contributes about 6% of the total power production of the country with an installed capacity of 1000 MW [28].
The Mangla Reservoir has a total initial gross storage capacity (GSC) of 7.25 billion cubic meters (BCM) at the normal conservation level (NCL) of 366.35 m a.s.l., while it has a dead storage capacity of 0.66 BCM at the previous minimum operating level (MOL) of 316.99 m a.s.l. Between the years 1967–2010, the reservoir lost storage capacity equal to 1.59 BCM (21.93%) owing to reservoir siltation. To enhance the impounding capacity and raise the hydropower potential of Mangla dam, a dam raising Project in 2012 was undertaken, which led to an increase in dam height by 9 m (from 366.35 m a.s.l. to 378.543 m a.s.l.). Thus, the net enhanced storage capacity of the upraised Mangla Dam is 3.451 BCM with a GSC of 9.11 BCM at the updated conservation level. The additional 3.451 BCM of water that is greater than the lost storage capacity during 1967–2010 will also produce an additional 644 million energy units annually and irrigate 0.53 million hectares of land. Moreover, the raised Mangla Dam would reduce the flood menace by decreasing the magnitude of flood as well as fulfilling the increasing irrigation demand. Reservoir levels and corresponding GSC are shown in Figure 2.
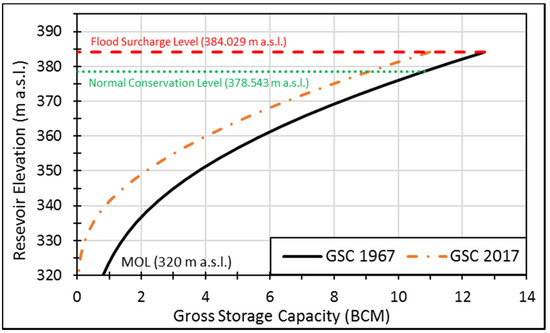
Figure 2.
Stage-storage capacity curve for the Mangla Reservoir.
The total inflow of Mangla Reservoir is coming through three main rivers i.e., Jhelum, Poonch, and Kanshi and their contribution to total annual inflow of reservoir is 83%, 16%, and 1% respectively. The mean annual runoff from 1979–2017 of the Jhelum River at Azad Pattan station is 833 m3/s, Poonch River at Kotli Station is 133 m3/s and Kanshi River at Palote station is 6.5 m3/s (Figure 1).
Seventy five percent of the total inflow in Mangla reservoir arrives during the March to August period, mostly due to monsoon rainfall with a small snowmelt component. Thus, river runoff starts to increase from March–April onward, and peak flows are observed in May–July due to superimposed of snowmelt and monsoon rainfall (June–August) [21]. The mean monthly discharge of the Jhelum River varies between 309 m3/s and 1929 m3/s at the Mangla Dam. The Jhelum River is known to be a flood-prone river, and the September 2014 flood was extremely severe, with a maximum flow of 17,950 m3/s recorded at Mangla [29].
A perusal of the data from 1979 to 2010 showed that the precipitation is spatially varying over the Mangla watershed and heavy precipitation occurred in northern part of the basin. Whereas in the mean annual precipitation in the southern and northern part of the Mangla Basin is 846 mm and 1893 mm, respectively. About 1196 mm avg. annual precipitation from 1961–2012 is observed in the Mangla Basin. Almost 50% of the precipitation occurs in the northern part of the basin during December–March in the form of snow [21]. Apart from the rain and snowfall, glaciers are another source of river flow. The average annual minimum and maximum temperatures of the Mangla Basin are 0.3 °C in December–January and 29.5 °C in June–July, respectively [1].
2.2. Sources of Sediment in the Jhelum River Basin
The catchment area of the Jhelum, Poonch, Khad, and Kanshi Rivers above Mangla being mountainous is subjected to weathering due to severe climatic condition. The major causes of sediment mobilization are deforestation, developments in the area, earthquakes, and heavy rainfall, which ultimately finds its way into the rivers [1,24].
Since 1967 to 2012, the Mangla Reservoir lost 22.15% of its GSC at a conservation level of 366.36 m a.s.l. due to the natural phenomenon of reservoir siltation. In the period after the dam raising in 2012, it lost 15.45% of total capacity until 2017, with reference to the conservation level 378.56 m a.s.l. The Mangla Reservoir has been losing its capacity at the rate of 0.31% per annum. The average sediment deposition during 1967–2017 was 0.03 BCM per annum, and the total sediment deposition was 1.67 BCM. Reservoir sedimentation not only leads to a dwindled impounding capacity of reservoir but also affects the long-term reservoir operational pattern.
Since 1960, the Water & Power Development Authority, Pakistan (WAPDA) has been running different watershed management programs in the Jhelum River Basin to slow down the sediment inflow into the channels and to control soil erosion. Numerous tasks have been performed to improve the Mangla watershed by planting more than 133 million trees along with the construction of earthen and stone structures measuring 3.45 Mm3 in the form of retaining walls and check dams, and improving cultivated land of about 34 km2, with provision of special training to farmers [30]. Consequently, the sediment load has declined to 33.6 MCM/annum from 51.8 MCM/annum, as predicted by the Mangla Dam Consultant during 1950–1960.
2.3. Impact of Sediments on Turbines
As sediment delta moves toward the dam, more silt and sand particles are carried with the flow that pass through the turbines. During high flood events, the sediment quantity can dramatically increase. This carries the risk of abrasion caused to turbine blades as well as the choking of the turbine intake tunnels.
In 1992, an exceptionally high flood peak of 30,865 m3/s passed through the reservoir, which triggered the deposited sediment movement towards the dam. In this flood event, both the main spillway and the power tunnels were operational. The measured sediment concentrations passing through the outlet structures were in excess of 10% by weight for over 100 h, with peak concentrations being three times that value [31]. Although the turbines remained unscathed, the cooling system was choked with sediment and subsequently had to be shut-off for cleaning. Further, this event prompted the authorities to close the power tunnels during future high floods.
The advancing delta could increase the risk of foreset slumping under earthquake loading as well as due to the effect of changes in operating rules. Thus, the delta movement has serious consequences for a safe and efficient functioning of the dam as well as on its stability. The delta movement is dependent on the sediment deposition trend and on the dam regulation.
3. Data Description
3.1. Reservoir Geometric Data
The geometric data describes the physical characteristics of the shape and size of the river and reservoir. The Mangla Reservoir has a complex geometry and is divided into six pockets, namely, the main Mangla (MM), lower Jhelum (LJ), upper Jhelum (UJ), Poonch, Kanshi, and Khad pockets (Figure 3). The Jhelum River is the main source of the Mangla Reservoir, which is considered as the main stem composed of upper Jhelum, lower Jhelum, and main Mangla pockets.
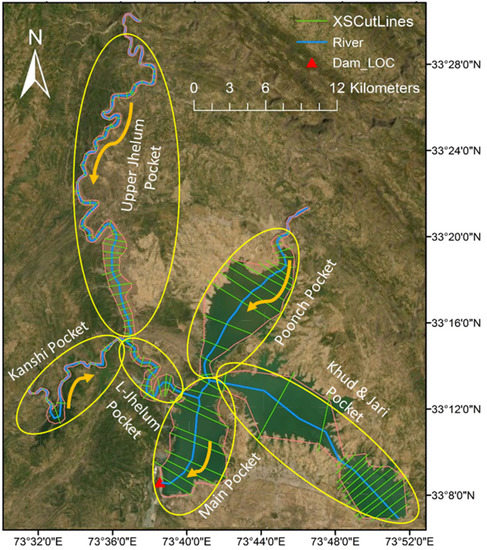
Figure 3.
Mangla Reservoir pockets and cross sections location.
A total of 136 cross sections measured by the hydrographic survey division of WAPDA, for the year 2005 were used to build the reservoir geometry in the numerical model. The distribution of the number of cross sections for different pockets shows that 88 cross sections are for the main stem of Jhelum River, 17 for Kanshi pocket, 16 for the Poonch pocket, and 15 for the Khad and Jari pocket. A schematic diagram showing the Jhelum River and its tributaries along with the location of cross sections representing river geometry in the HEC-RAS model is presented in Figure 3.
3.2. River Flow Data
Daily gauged river flow data from different gauging stations of WAPDA were used to set up the flow and sediment transport model in HEC-RAS. The river gauging stations for the Jhelum, Kanshi, and Poonch Rivers are located at Azad Pattan, Palote, and at Kotli, respectively. The flow data related to years 2005–2017 was used for the modeling.
To envisage the impact of climate change on sedimentation at the Mangla Dam, future projected hydrological data (2018–2100) of all the tributaries of the Mangla Reservoir under RCP4.5 and RCP8.5 by Naeem et al. [22,32] were used in the numerical model as the upstream boundary condition. Naeem et al. [22,32] conducted a study on the Mangla watershed and explored the impacts of climate change on Mangla Dam hydrology using the soil and water assessment tool (SWAT). For assessing the climate change impacts on flow regimes for three future periods (2011–2040, 2041–2070, and 2071–2100), three Global Circulation Models (GCMs) (CanESM2, BCC-CSM1-1, and MICROC5), and two representative concentration pathways (RCP4.5 and RCP8.5) with two downscaling methods (Statistical Downscaling Model (SDSM) and Long Ashton Research Station Weather Generator (LARS-WG)). According to his statistical analysis results, BCC-CSM1-1 with SDSM performed better as compared to other models for the Mangla Dam watershed. Under RCP4.5 and RCP8.5, percent increase in observed discharges is shown in Figure 4.
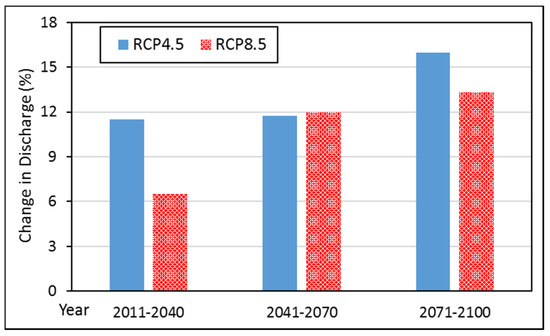
Figure 4.
Percent changes in annual runoff.
3.3. Sediment Data
The sediment yield can be estimated by correlating observed sediment load and water discharge at the time of measurement and applying the same relation to the daily flows of a year, thereby estimating the sediment load at different gauging stations of Mangla reservoir. In 1979, the Surface Water Hydrology Project (SWHP) of WAPDA started discharge measurements along with suspended sediment concentration (SSC) at the Azad Pattan gauging station of Jhelum River, Kotli gauging station of Poonch River from 1960, and similarly at Palote station of Kanshi River. Since then, daily river flow data and occasional SSC measurements at the gauging stations were recorded to ultimately estimate the sediment inflow into the Mangla Reservoir. Furthermore, to account for the unmeasured bed load, the practice followed by the dam designers has been to take it as equal to 10% of the suspended sediment load (SS) and adding it to the latter to get the total sediment load for the Mangla Reservoir [33,34].
The SSC data is recorded in units of parts per million (ppm). The breakup of the SSC data expresses the percentage of its three constituents i.e., sand, silt, and clay. The average percentage of clay, silt and sand in the SS at Azad Pattan gauging station is 26%, 62%, and 12%; that at Kotli gauging station is 27%, 65%, and 8%; and at Palote gauging station is 32%, 58%, and 10%, respectively. Figure 5 presents the SSC for the Jhelum River at the Azad Pattan gauging station of Jhelum River for different flows. From the pit sample, the riverbed gradation curve for different Mangla Reservoir pockets is shown in Figure 6.
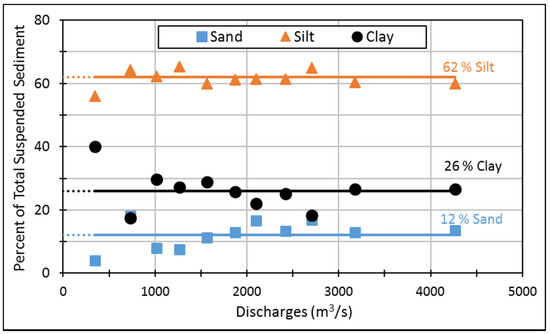
Figure 5.
Percentage variation of sand, silt and clay for Jhelum River.
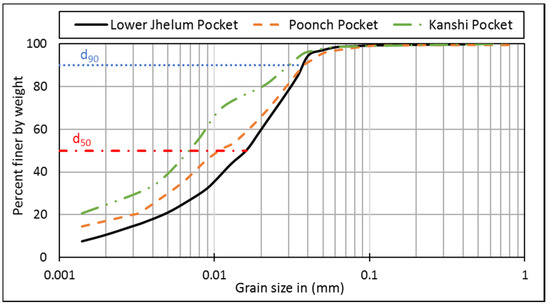
Figure 6.
Bed gradation curve of different Mangla pockets.
The data related to sediment concentrations along with water discharges are collected according to United States Geological Survey (USGS) specifications for random days throughout the year at controlled section of the river [35,36,37]. Therefore, to predict the missing sediment data, researchers employed different methods i.e., the conventional sediment rating curves (SRCs) method [38] and the artificial neural networking (ANN) technique [39].
It has been observed in several reservoir sedimentation studies that missing and future sediment inflows predicted by SRCs are often in error by as much as 50% [40,41].
In the current study, both methods were applied to predict the missing sediment load, and then statistical analysis were employed to determine the best estimation technique. Thereafter, predicted data from leading technique was used in numerical modeling to calibrate and perform future analysis estimation.
3.4. Reservoir Operational Levels
Daily reservoir level data measured by the Mangla Dam Organization (MDO) of WAPDA for the duration of 2005–2017 (18 years) was employed as a downstream boundary condition to calibrate the numerical model. For the future prediction after year 2017, the reservoir levels have been derived through various management scenarios of the reservoir operational rules.
Seasonal variations in river flows along with demands for irrigation, hydroelectric power generation, and flood control reservoir operation combine to create a reservoir operating rules curve for filling and drawing down the reservoir [42].
Incoming water discharges and reservoir operation (water level and outflow) both affect the reservoir sediment dynamics. As the future pool levels are not known at the dam, various scenarios have to be developed and simulated to establish the uncertainties inherent in predictions of future trends. It is surmised that the future reservoir operation levels have a greater impact on reservoir sedimentation than the water inflow time series [14,15].
The reservoir operational levels at the dam site follow an annual fill and drawdown cycle: the water level starts to increase in April, reaches a maximum during the months of August and September, and then drop, attaining a minimum level in the month of March (Figure 7).
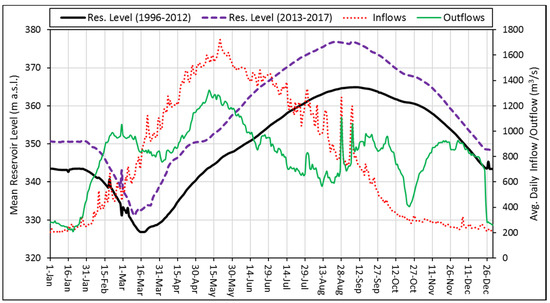
Figure 7.
Daily mean reservoir inflow/outflow and level before and after the Mangla upraising.
Generalized reservoir-operating rule curves have been proposed to analyze the reservoir operational impact on reservoir sedimentation and its movement (Figure 8). These curves represent the minimum and maximum level along with their duration. The curves depict a linear behavior, which indicates the filling of reservoir and fall and corresponds to maximum outflows, respectively. This approach is followed in engineering studies that treat reservoir sedimentation [14,15,43].
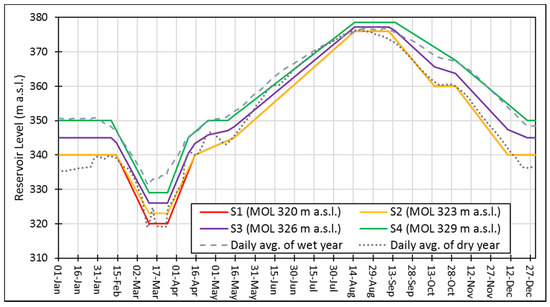
Figure 8.
Future reservoir operation curves.
This paper analyzes five feasible scenarios (S1–S5) with the change in minimum operation level (MOL) for up-to year 2065. For the first (S1), second (S2), third (S3), and fourth scenarios (S4), the MOL was kept at 320 m a.s.l., 323 m a.s.l., 326 m a.s.l., and 329 m a.s.l., respectively, for the next 58 years from year 2017 onward, as shown in Figure 8. Further, the fifth scenario (S5), envisaged an increase of 0.75 m in MOL of every year starting from 320 m a.s.l. to 329 m a.s.l. for next 12 year, then MOL remained fixed at 329 m a.s.l. for the remainder of the duration up to the year 2065. In practical terms, the above strategies are a measure to reduce the rate of sediment delta movement towards the dam face.
The aforementioned reservoir operating scenarios are formulated based on the past pool level fluctuations in a wet and dry year depending upon the observed irrigation demand since its upraising and Mangla Reservoir operating rule curves.
4. Methodology
4.1. Statistical Measures for Model Performance Evaluation
The goodness-of-fit measures applied to assess various simulations showing different selections of parameters are Nash–Sutcliffe efficiency (NSE), coefficient of determination (R2), root mean square error (RMSE), and percent bias (PBIAS) [44,45]. The NSE exhibits how good the observed plot fits the simulated plot and R2 defines the degree of collinearity between observed and simulated data, i.e., the proportion of the variance. Both NSE and R2 lies between 0–1, with higher values showing less error, and values larger than 0.5 are normally considered acceptable. RMSE is a standard method to calculate the error of a model in forecasting quantitative data. PBIAS estimate the mean tendency of the computed data to be greater or lesser than observed. The optimal value of PBIAS is 0, while values falling in between ±15% are considered acceptable. Positive and negative values indicate the model overestimation and underestimation, respectively. The above-cited parameters were calculated by the following equations:
where S is the simulated value, O is the observed value at each cross section, n is the number of observed data entries, and avg is the average of the total values.
4.2. Missing and Future Sediment Prediction Techniques
4.2.1. Sediment Rating Curves (SRCs)
SRCs for different gauging stations have been derived from recorded data. Thus, the daily suspended sediment load was calculated through SRCs. The daily-suspended sediment load has been expressed in power law form as a function of daily flows [38,46] at different gauging stations, as represented by following equations.
where Qs is the daily-suspended sediment load (Tons/day) and Q is the daily avg. river flow (m3/s).
For Jhelum River, Qs = (7.7 × 10⁻²) × Q1.9638
For Poonch River, Qs = 0.208 × Q1.8748
For Kanshi River, Qs = (1.159 × 10⁻⁹) × Q2.9873
4.2.2. Artificial Neural Network Model (ANN)
Today, artificial intelligence (AI)-based techniques are being used more and more for problem solving in hydrology. A number of researchers predicted the hydrological parameter by developing artificial neural network (ANN)-based models [47,48]. For many years, ANN-based models have been used for rainfall estimation, runoff estimation, reservoir inflow prediction, suspended sediment prediction, reservoir level estimation, and reservoir operation [39,49,50,51,52]. In this study, missing and future suspended sediment data were predicted by ANN-based data-driven technique for the efficient estimation of incoming suspended sediment.
The adopted technique has been developed using different input parameters i.e., antecedent river discharges, sediment, precipitation, and temperature information. For the development of a smooth and reliable model, state of the art mathematical tools—gamma test and M-test—were used for the estimation of the best model input combination and data length selection, respectively [53,54]. Model training was performed through two types of feed forward ANN model that are formed on back propagation (BP) and a two-layer Broyden–Fletcher–Goldfarb–Shanno (BFGS) training algorithm.
Assessment for the best technique was done based on simple statistical parameters, namely NSE, R2, and PBIAS. Outcomes from both training and validation stages clearly indicated the efficiency of both the conventional SRCs method and ANN-based prediction technique for missing and future sediment data. Results showed that the ANN-based model outperformed the SRCs method with higher values of NSE, R2. Further, PBIAS shows that SRCs significantly underestimate the sediment load and ANN gave best estimation of suspended sediment load (Table 1).

Table 1.
Statistical analysis of the performance of the sediment ratings curve (SRC) and artificial neural network (ANN) models in predicting the daily suspended sediment load.
4.3. Hydraulic Model Description
The evaluation of reservoir life entails modelling the spatial sediment deposition with given water and sediment discharges and channel geometry as inputs and driven by the reservoir operation policy that determines the reservoir levels. This step requires the realization of comprehensive numerical simulations to cover the full extent of reservoir operations under varying conditions of water and sediment flow.
In this study, the numerical model HEC-RAS 5.0.7 is run to predict the future sedimentation patterns in the Mangla Reservoir. It is a one-dimensional sediment transport model that predicts reservoir sedimentation trends from moderate to long-term period and loss of reservoir impounding capacity along with other exhaustive info, like bed composition, sediment concentrations, etc., at specific locations. HEC-RAS can perform four types of hydraulic analysis, i.e., steady-flow analysis for water surface profile, one- and two-dimensional unsteady flow simulations, one-dimensional sediment transport computation, and water quality analysis modelling [19].
To compute the flow depth and velocity, a flow profile equation is used to estimate water depth, water level, and mean velocity variation within two consecutive sections in the reservoir for a given computation time interval. The backward standard step method is applied for computing the water surface profile. Further, the Manning equation is used to calculate the flow rate within each section [55].
The Exner equation (Equation (7)), also known as the sediment continuity equation, is used in the HEC-RAS model for sediment routing in each section between two consecutive cross sections along the river reach.
where Qs, sediment load (m3/s); B, width of channel (m); active layer porosity; , channel bed level elevation (m); t, Time (s); x, distance (m).
The Exner equation relates the net sediment entering the control volume during a small time step dt to the change in the channel bed level. In the field, the control volume is replaced by a given river reach and the aggradation or degradation of the channel bed is due to the imbalance between the sediment entering and the sediment leaving the reach. This highlights the importance of sediment transport capacity of a river reach, which is determined via uniform flow sediment transport formulae/functions.
The HEC-RAS model have eight sediment transport functions Ackers and White (A&W) (1973) [56], Laursen (1958) [57], Englund–Hansen (E&H) (1967) [58], Meyer-Peter and Müller (1948) [59], Copeland (1989) [60], Yang (1973, 1984) [61,62], Toffaleti (1968) [63], and Wilcock and Crowe (2003) [64] to calculate the sediment transport capacity. Among all the functions, the Ackers and White sediment transport formula was found to be best by sensitivity analysis and it was also used in studies conducted on JRB [16,65]. It takes account of parameters of transport, particle size, and mobility. It has a dimensionless parameter for distinguishing between fine sediment (less than 0.04 mm), transitionary particles (0.04–2.5 mm), and coarse sediments (greater than 2.5 mm). The general sediment transport rate is determined in terms of some dimensionless parameters by Equation (8) in the following form.
where Fgr, mobility number for sediment; , shear velocity (m/s); n, Transition component, depending on sediment size; α, coefficient equal to 10 in rough turbulent equation; V, mean flow velocity (m/s); d, size of sediment particles (mm); and D, depth of water (m).
Bed volume changes owing to the finer particles, e.g., clay and silt are estimated by using other transport functions to account for cohesive characteristics. HEC-RAS offers the possibility of using the standard transport equations or the Krone (1962) [66] and Partheniades (1965) [67] approach. A comprehensive explanation of the model is available in HEC-RAS reference manuals [19].
To compute the bed sorting and armoring, HEC-RAS uses the Thomas mixing method (formerly Exner 5 and 7) that computes the coarse armor or inactive layer, which limits the transport capacity of a river [19]. This method defines the gradations of the active layer, which comprises the cover and subsurface layers, in order to estimate the transport capacity of a river.
5. Results and Discussion
5.1. Sensitivity Analysis for Calibration and Validation of the Numerical Model
A river system model was created in the HEC-RAS according to Figure 3. It includes Jhelum River and its tributaries. The river x-sections helped to create the bathymetry and bank geometry. Water and sediment discharges (divided into sediment fractions of sand, silt and clay) on daily basis were applied to each river at its upper most x-section as upstream boundary conditions. The dam face formed the model end section on the downstream side where the daily reservoir level in a.s.l. was applied as the downstream boundary condition.
Sensitivity analysis for the selection of certain parameters like roughness coefficients, computational time step, sediment transport functions, and fall velocity was performed to simulate bathymetric changes in the reservoir. After importing all the input data to the HEC-RAS model, the model was run for different Manning’s values going from 0.02 to 0.04 with the incremented by 0.005 and by keeping a computational time step of 12 h with the model default sediment parameters (the Ackers and White method as the sediment transport function, Exner 5 as the bed sorting method, and Report 12 as the fall velocity method). It is found that low values of n lead to high erosion and cause high sediment transport rates because of the higher flow velocities. The simulated bed profile for Manning’s value of 0.03 was found to agree closely with the observed bed level (Figure 9), and statistical analysis also showed that the value of n = 0.03 is the most suitable one because it has a minimum RMSE value and NSE, R2 value is close to 1 as shown in Table 2. Thus, n = 0.03 was adopted as the project default value. Further, it has also been observed that the increasing value of n from 0.02 to 0.03 leads to the computed bed profile closer to the measured profile, and its further increased value (n = 0.035) shows more deviation from the observed. Thus, it is observed that a nonlinear relation exists between reservoir sedimentation and the Manning’s roughness coefficient.
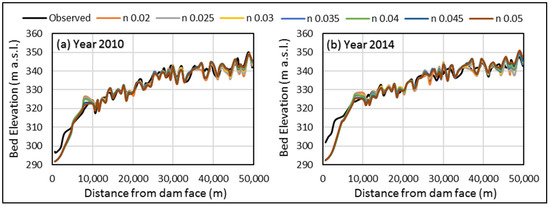
Figure 9.
Comparison of the observed and simulated bed elevation for different Manning’s roughness coefficients.

Table 2.
Statistical analysis for sensitivity analysis for calibration and validation.
Further, to analyze the effect of time step, the model was run for the computational increment as 24, 12, 9, 6, and 3 h, by keeping other parameters same as default. It is observed that the computed results are sensitive to the varying computational increment. The smaller time step gives more stability to the numerical model, but it increases the run time. Therefore, it is an important model parameter that directly influences the model’s efficiency. The comparison of the observed and computed results for the year 2010 and 2014 are shown in Figure 10, and from statistical analysis (Table 2), it is observed that similar results were found for the computational increment equal or less than 6 h. Hence, in the present study, 6 h is selected as computational increment time step as the project default value for further analysis.
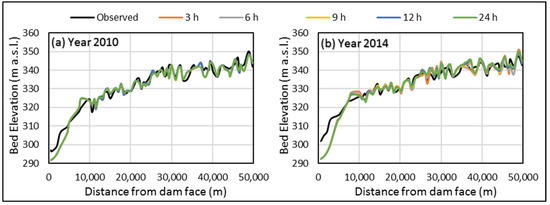
Figure 10.
Comparison of observed and simulated bed elevation for different computational increments.
Furthermore, the model was calibrated on observed longitudinal bed profile data and delta advance rate, from 2005 to 2010, by selecting one by one all the sediment transport functions and different fall velocity methods available in HEC-RAS software by keeping the 6-h computational increment time and the Manning’s roughness coefficient value as 0.03. The results showed that the Ackers and White sediment transport function combined with the Van Rijn fall velocity method was found to be the best among the lot. All other transport functions underestimated the location of the delta pivot point, but overall, a good agreement was found between the observed and simulated longitudinal bed profiles, as shown in Figure 11. The original ground level (OGL) of the reservoir in 1967 is also shown in Figure 11.
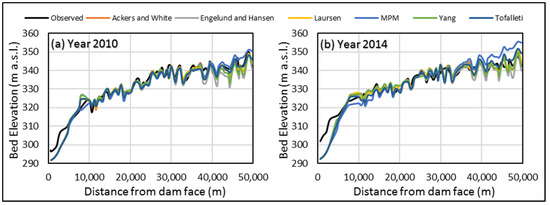
Figure 11.
Comparison of observed and simulated bed elevation for different sediment transport functions.
All functions underestimated the deposition close to the dam face; the earthquakes of 2005 and 2008 could be the reason behind the movement of the foreset slope. The result of the calibration in 2010 is shown in Figure 12.
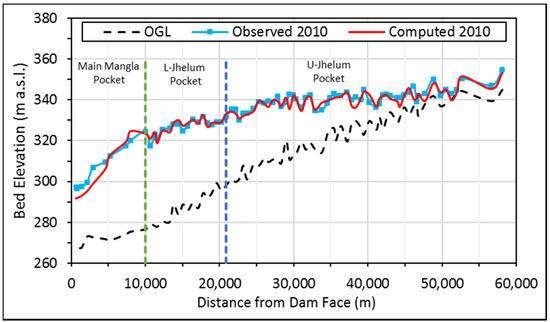
Figure 12.
Calibration of the numerical model for the year 2010.
Model Validation
The numerical model was validated for the years 2014 and 2017 by comparing the computed and observed longitudinal bed profiles of the reservoir, as illustrated in Figure 13. From Figure 13, it is revealed that the topset slope closely matches the topset slope of the observed delta profile. A fairly good agreement was found between the simulated and observed measurement of the bed profile exclusively on the far and near of the topset slope and on the pivot point of the sediment delta. However, minor discrepancies have been observed on locations where the river channel is narrow and on the river bends. This is due to the presence of 3D effects, i.e., helical flow due to secondary currents, which can only be resolved by a 3D flow and sediment model [18]. Further, the model underestimated the sediment deposition close to the dam embankment. Overall, the results of the calibration and validation of the numerical model indicate that the model was able to compute the bed levels with reasonable accuracy, thus pointing to its suitability for the reservoir sedimentation studies.
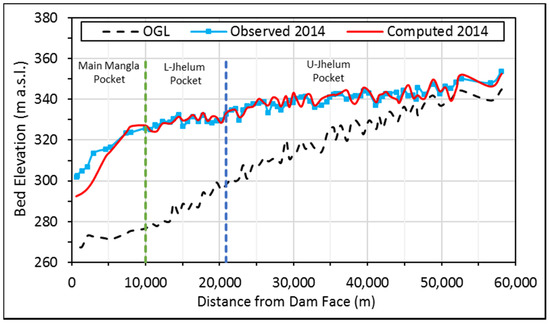
Figure 13.
Validation of the numerical model for the year 2014.
The statistical analysis was performed to evaluate the calibration and validation of sediment transport model efficiency. The results show that the model performed well in both phases of calibration and validation by considering the combination of the Ackers and White equation as the transport function, the van Rijn equation as the fall velocity method, a Manning’s roughness coefficient of 0.03, and a computational increment of 6 h. The minimum RMSE (calibration 2.18 and validation 3.18) with NSE (0.96, 0.90), R2 (0.97, 0.93), and PBIAS is close to the perfect values of 1 and 0%, respectively, as shown in Table 2.
The model efficiency was also assessed by comparing the sediment deposition in different pockets of the Mangla Reservoir as given in Table 3. It has been observed that the computed volume of deposited sediments in different reservoir pockets are quite close to the observed amount as reported by the dam authorities.

Table 3.
Sediment deposition in different pocket of reservoir from 2005 to 2010.
At the majority of the x-section locations, a good agreement between the observed and simulated bed levels was noted, although the results were poor in the lower Jhelum River reach. This is because the said reach is sandwiched between the upper Jhelum and the lower Jhelum reach. It is a short river reach, which connects the two reaches transversally. The channel width is narrow and marked by the presence of bends where a complex 2D or even 3D flow prevails, hence, the wide gap between the observed and simulated sediment results in Table 3.
However, bed levels near the dam are not well simulated by the numerical model. In the period 2005–2017, the bed levels simulated with HEC-RAS do not follow the increase shown in the surveys (Figure 12 and Figure 13). One probable explanation could be the devastating earthquakes of October 2005, 2008, 2011, 2013, 2014, and 2015 (having magnitudes of 7.6, 6.4, 7.2, 7.7, 4.5, and 6.3, respectively) in northern Pakistan, which may have caused landslide/subsidence of the foreset slope of the sediment delta. It is clear that such phenomena cannot be modeled by HEC-RAS.
In Figure 13, it can be seen that, in the year 2014, the bed levels near to the dam embankment are higher than the tunnel intake levels. The fact that the tunnels still function and have not been choked by the higher flow velocity is the eroding of the sediment deposits. These localized phenomena, of course, cannot be replicated by a 1D model, as they occur due to lateral variation of the flow velocity, which requires at least a 2D model for its description.
5.2. Impact of Future Reservoir Operating Scenarios
The reservoir operation depends upon a number of factors, i.e., inflows and its seasonal variation, downstream water level, MOL, sediment movement pattern and rate, flow rate change due to variable climate, trap efficiency, live and dead storage, etc. Clearly, determining the optimum reservoir operation strategy is by no means evident. Thus, we adopted a heuristic approach that allows us to select the best strategy and at the same time explains the trade-offs between the main factors by developing a set of plausible operating scenarios as listed in Table 4.

Table 4.
Model boundary condition for future simulation.
The results for Scenario S1 with projected future discharges from RCP4.5 and the simulation outcomes for the years 2025, 2035, 2045, and 2055 are shown in Figure 14. As the future projections for the Mangla Basin predict an increase in flows, Scenario 1, which keeps the MOL equal to the existing 319 m a.s.l., leads to rapid sedimentation. As a result, the delta moves rapidly toward the dam face. In this scenario, the bed levels close to the main embankment aggraded rapidly and reached the level 320 m a.s.l. in the year 2045, thus, rapidly filling the dead storage space.
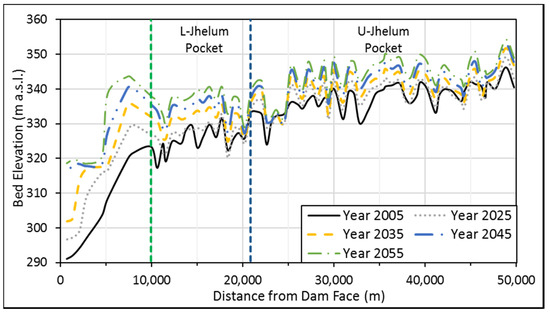
Figure 14.
Bed profile of the deposited sediment for S1-45 scenario.
Figure 15 represents the pivot point location and the bed profiles after 30 years for the five reservoir operation scenarios.
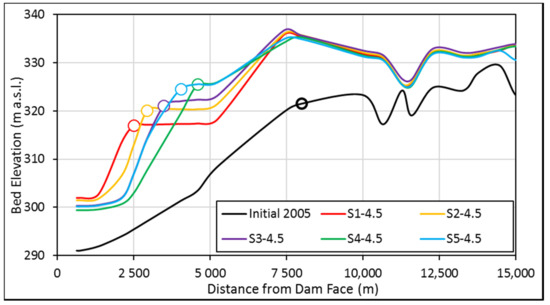
Figure 15.
The pivot point of the deposited sediment delta of the year 2035 for all operational scenarios.
This shows that the raise in MOL slows down the rate of delta movement towards the turbine intakes as more and more sediments are deposited along the topset slope and in the upstream river reaches. Furthermore, it is clearly observed that by increasing the minimum reservoir level, the live storage capacity decreases gradually and the dead storage remains intact. In Scenarios S3 and S4, the movement of the delta reduced significantly as the high water level slowed down the velocity in areas far upstream from the dam, thus promoting deposition at those locations. Table 5 shows the mean advancement rate of the Mangla delta toward the dam face.

Table 5.
Delta advance rate towards the dam face.
Table 6 shows the total volume lost as percentage of gross storage capacity (including the upraised Mangla Dam capacity) for the analyzed scenarios using future discharges derived from RCP4.5 and 8.5, which varies from 30.98% to 32.75%. The results reveal that there is a maximum difference of 1.77% in the total storage lost among different operational scenarios. It also shows the impact between the two sets of future discharges (RCP4.5 and 8.5) on reservoir sedimentation up to the year 2065 and has minor influence in view of comparative volume lost (i.e., <1%). Therefore, further results for the RCP4.5 are discussed because RCP8.5 has similar impact as RCP4.5 on Mangla Reservoir sedimentation.

Table 6.
Total volume loss of the reservoir in percentage.
The results indicate that the total volume loss because of sedimentation is around 3.0 BCM in GSC for all the scenarios. In view of these results for all operational scenarios, sediment-trapping capacity is high, but there is a small difference among all of them because of the vast reservoir area and capacity. However, the storage loss by sedimentation in the main Mangla pocket close to the dam has a greater impact, as compared to the total volume lost due to sedimentation in the reservoir, as illustrated in Figure 16. Scenarios S1 and S2 having a minimum reservoir level show maximum deposition in the main Mangla pocket as compared to other scenarios until 2045. Afterward, a gradual fall has been observed because of increase sediment outflows, as shown in Figure 17. Further, Scenarios S3, S4, and S5 have progressively increased sediment deposition in the main pocket (Figure 16) with the lowest sediment outflows (Figure 17) and minimum delta advancement rate with the highest reduced level of sediment bed at the pivot point (Figure 15) as compared to Scenarios S1 and S2. This reveals that the rising drawdown level of the reservoir reduced the sediment delta advancement rate and kept the pivot point far away from the dam face for a longer period, but it has also increased the upstream bed level because of high sedimentation. However, keeping the minimum drawdown level in the reservoir triggers high advancement of sediment deposits toward the dam face.
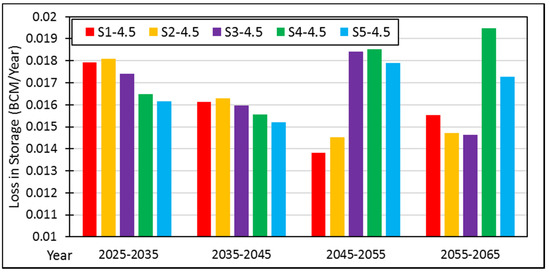
Figure 16.
Storage loss due to sedimentation in the main Mangla pocket.
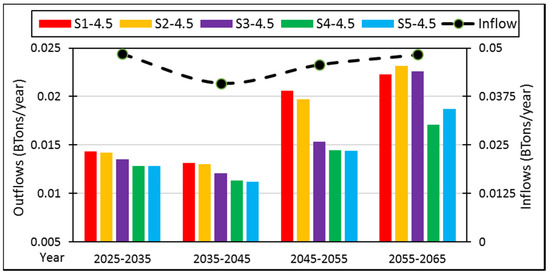
Figure 17.
Total sediment inflows and outflows from the reservoir.
Outflowing sand particles significantly contribute to the wear and tear of the turbine blades and at the outlet surfaces. Table 7 provides information on the proportion of sand outflows and inflows for four scenarios.

Table 7.
Comparison of the sand outflow with respect to sand inflow in percentage.
The sand outflows increase with time as lower drawdown levels are maintained and decreases with higher drawdown levels. Simulation S1 has the least drawdown level among the four simulations, demonstrating this problem to the fullest. Initially, the sand outflows are small during the decade 2035–2045 i.e., 0.005 million tons/year but after about a decade as the availability of sand increases, the outflows increase by about 14% to reach 9 million tons/year (Table 7). Further, no sand outflows were observed through the turbine intakes in Simulation S4 having a minimum reservoir level of 329 m a.s.l.; in Simulation S5, every year, the minimum drawdown level of the reservoir is increased by 0.75 m. Thus, the objective of deterring the volume loss by operating the reservoir at MOL may contravene the objective of passing less concentrated sediment water through turbine intake to prevent wear and tear and vice versa.
The low drawdown level also increases the sand particles proportion in water. When this sand-laden water passes through the hydropower tunnels, it causes abrasion of the mechanical surfaces exposed to high-speed flow, e.g., to turbine blades. Generally, this phenomenon occurs for the particle size exceeding 0.1 mm but may also happen for smaller particles in case of high operation heads and angular quartz particles [6]. As a result, it may cause clogging or blocking of the outlets. The risk is higher if the dam is situated in a seismically active zone, as Mangla is, due to liquefaction of the accumulated sediments.
The composition of the sediment outflow through the reservoir vary from the low flow season to the high flow season. During the low flow season (February and March), the outflow consists of coarse silt and sand, while in the high flow season (May and June), the composition changes to clay and fine silts. Maximum sediment outflows of coarse silt and sand from the reservoir therefore do not occur at the same time as the peak flows in the river. Hence, this coarser material is deposited in the river downstream of the dam and subsequently re-scoured once the higher flows are released from the dam later in the year. This depositing and reworking of the sediment in the river could cause additional and significant environmental damage. Furthermore, these highly concentrated sediment outflows are also very harmful to biota in downstream river reaches. Recent case studies have estimated detailed biological and physical alterations, reductions of benthic organisms due to bed siltation, and severe fish mortality [68].
Table 8 gives information regarding outflows of sand fraction, which is pertinent to the above-mentioned risks.

Table 8.
Outflows of different sand fractions from the reservoir for S1-4.5.
The observed sediment deposition rate at the Mangla Reservoir from 2005–2017 was about 0.023 BCM per year, while rates of deposition for future years under impact of climate change with different reservoir operational rules are show in Table 9. The sediment deposition rate increases from 0.023 BCM to 0.032 BCM per year due to the increase in summer precipitation and discharges due to climate change, which causes more weathering and erosion in the Mangla catchment area. It also indicates that the deposition rate decreases gradually with the passage of time because total sediments outflows are increasing, as shown in Figure 17.

Table 9.
Prediction of sediment deposition (BCM/year).
To summarize, the minimum reservoir operation level has a significant impact on reservoir sedimentation. The results showed that, by keeping the reservoir MOL lower, a higher volume of water can be made availability for useful purposes e.g., irrigation and hydropower. However, it leads to a rapid increase of the bed levels near to the dam (Scenarios 1 and 2). Additionally, low MOL enhances the sediment outflows, which increases the risk of turbine abrasion and tunnel choking. An opposite measure is to keep the MOL high, which has the disadvantage of reducing water availability, but on a positive note, it slows down the delta advance (Scenarios 3 and 4). A further negative effect of high MOL is the increased foreset slope of the sediment delta, which might collapse, thus leading to mass movements of the bed load into the power tunnel(s). Considering all these factors, a strategy (Scenario S5) that leads to a gradual increase in MOL of the reservoir with time is the optimal strategy because it slowly introduces the change on yearly basis, arresting the delta advancement, preserving the live storage, and keeping the sand outflows within their reasonable limits.
5.3. General Lessons Learnt from the Present Study
The present study results can be generalized to multi-purpose reservoirs situated in water stressed, arid, or semi-arid zones. The reservoir can have multiple objectives e.g., irrigation supplies, hydropower, flood control, etc. It is also well known that streams in arid zones carry far more sediment than temperate regions that arrive in great quantities during flood seasons. Thus, reservoir sediment management has a very vital role to play in prolonging the life of a reservoir.
From the reservoir operations viewpoint, it is of paramount importance to ensure sustainable use of the reservoir by reducing sedimentation and not allowing sediment to approach the power tunnels or water intakes too closely. This would prevent the clogging of the latter. The threat is all the more palpable in a seismically active zone where sand liquefaction can cause highly turbid water to invade the installations, leading to its shut-off and degradation.
The sediment management is greatly dependent upon the reservoir operations policy, which fixes the reservoir minimum water level. If the water level is low, more turbid water can be made to pass through the tunnels, thus promoting flushing of the sediment. However, it has the inconvenience of allowing the sediment to deposit more closely to the tunnels/intakes and degrading the turbines. The other option is to keep the reservoir water level high, which may not be possible due to end-users being dependent on the water, or, the reservoir has to be depleted to a certain level before the arrival of a flood season to store a flood peak. Further, the high water level can cause sediment mounds to form far from the intakes, but this also increases the susceptibility to slope failure or slumping. The MOL may be set low in initial years after the commissioning of the reservoir, but it may have to be raised gradually to reduce the sediment accumulation in later years.
The suggestions that can be advanced based on the present case study recognize the fact that flows may need to be passed through the installations housing hydraulic machinery; however, at the design stage, it would be prudent to reserve some low-level outlets only for flushing and not to install turbines on those. A maximum “shut off” sediment load has to be defined for an installation at which it must be immediately shut down to protect the installation. To avoid the risk of installation clogging during an earthquake or slumping, a “deep water suction dredging system” of adequate capacity should be procured in advance to clear the blockage as soon as possible. Further, regular repair of exposed hydraulic surfaces should be undertaken to repair the damage done by silt-laden water. The turbines selected should be able to withstand the high sediment load. Further, options may be explored to protect the machinery through specialized coatings e.g., ceramics and polyurethane. Furthermore, outflows near to the MOL should be strictly monitored to assess its effect on the downstream fish and benthic organisms, and measures may be taken to protect the vulnerable species during the occurrence of such flows.
6. Conclusions
This study evaluates the impact of climate change and reservoir operation curves on reservoir sedimentation and its sustainable management. Reservoir sedimentation management is a complicated and challenging task because some objectives might controvert others. For instance, the objective of deterring the volume loss may contravene the objective of passing less concentrated sediment water through turbine intake to prevent wear and tear and vice versa. To assess the impact of different operation strategies with future discharges derived through RCP4.5 and 8.5 under the impact of climate change, long-term numerical modeling has been carried out by the HEC-RAS model to assess the sediment dynamics in the reservoir. As a case study, the Mangla Reservoir in northern Pakistan, having complex geometry and critical sediment-related issues, was selected.
This study used an ANN technique over conventional SRCs method to estimate the missing past data and future suspended sediment load. Results showed that the ANN-based model outperformed the SRCs method, scoring relatively higher values of NSE-0.78 (ANN) to 0.29 (SRC). This shows that SRCs underestimate the sediment load, and ANN gave best estimation of the suspended sediment load.
Results indicate that the 1D HEC-RAS numerical model has described well the behavior of the reservoir sedimentation. Sensitivity analysis showed that the most appropriate values of Manning’s roughness coefficient and computational time step are identified as 0.03 and 6 h, respectively. It is observed that a nonlinear relation exists between reservoir sedimentation and the Manning’s roughness coefficient. Further, the most suitable sediment transport function and fall velocity method for the Mangla Reservoir are identified as Ackers and White and Van Rijn, respectively. The second-best formula after Ackers and White was that of Laursen.
The simulated outcomes match with the estimations based on observations within the expected tolerances. Some limitations are observed when estimating bed levels on the river bends and near the dam because of 3D flow phenomena e.g., turbidity currents, as these could not be simulated using 1D models.
Results showed that reservoir storage capacity has been reduced every year, and the delta of the deposited sediment has advanced toward the dam face at different rates (0.113–0.183 km/year) under projected flows of RCP4.5 and 8.5 and with various reservoir operational scenarios. Reservoir lost its maximum total storage capacity (9.11 BCM) by 32.75% and 31.80% by keeping the reservoir MOL at 329 m a.s.l. under RCP4.5 and 8.5, respectively. Minimum storage loss (30%) has been found in Scenario1 (MOL 320 m a.s.l.), but it fills the dead storage of the reservoir earliest than other cases. Simulation results showed that Scenario 5, in which every year MOL is increased by 0.75 m, significantly slows down the delta advance and also deters the transport of sand particles into turbine intakes.
Thus, by increasing the MOL of the reservoir by a certain value every year, the delta movement rate and the bed level at the upstream of the dam can be checked, which lessens the risk of tunnel choking. Hence, the probability of mass movements of coarse silts and fine sands into the power tunnels can be controlled by raising the MOL by certain level (≥0.75 m) every year. Consequently, reservoir operation rules and their outcomes regarding reservoir sedimentation pattern have to be considered most important parameter in view of sustainable reservoir management. Reservoir operation rules provides optimal solutions to the environmental, economic, and social requirements related to reservoir.
Recommendations
Detailed hydrographic surveys of the main pocket close to dam will be performed to investigate the exact position of sediment delta pivot point with its reduced level and bed levels near to turbine intakes will be measured at least once per year. To avoid the slumping or mass movements towards the dam face, reservoir MOL will be raised by certain amount every year for reduction of delta rate. As the Mangla Reservoir has greater amount of silt deposits in main pocket, it is recommended to pass these sediments every year as a maximum wash load through intake tunnels during MOL. Further, in order to prevent the entry of slide mass into power tunnels, construction of sub-aqueous dyke will be considered as an effective protective measure for the near future. At last replacing of older turbines with modern turbines that are designed for highly erosion resistant material will be installed.
Author Contributions
Conceptualization, M.A.K. and J.S.; methodology, M.A.K., J.S. and S.H.; software, M.A.K.; validation, M.A.K.; formal Analysis, M.A.K.; investigation, M.A.K.; data curation, M.A.K. and S.H.; writing-original draft preparation, M.A.K.; writing-review & editing, J.S. and S.H.; visualization, S.H.; supervision, J.S. All authors have read and agreed to the published version of the manuscript.
Funding
This research received no external funding.
Acknowledgments
The first author was financially supported by the doctoral scholarship from the Higher Education Commission of Pakistan (HEC) and the German Academic Exchange Service (DAAD). The authors wish to acknowledge the Mangla Dam Authority, the Surface Water Hydrology Project (SWHP) of WAPDA, and Naeem Saddique for providing data that was used in this study. The first author is also thankful to Torsten Heyer from IWD, TU Dresden for their constructive guidance, suggestions and cooperation during research work. We extend our thanks to the Institute of Hydraulic Engineering and Technical Hydromechanics (IWD), Technische Universität Dresden, for providing the opportunity to perform this research. Open Access Funding by the Publication Fund of the TU Dresden.
Conflicts of Interest
The authors declare no conflict of interest.
References
- Babur, M.; Shrestha, S.; Bhatta, B.; Datta, A.; Ullah, H. Integrated assessment of extreme climate and landuse change impact on sediment yield in a mountainous transboundary watershed of India and Pakistan. J. Mt. Sci. 2020, 17, 624–640. [Google Scholar] [CrossRef]
- Azmat, M.; Wahab, A.; Huggel, C.; Qamar, M.U.; Hussain, E.; Ahmad, S.; Waheed, A. Climatic and hydrological projections to changing climate under CORDEX-South Asia experiments over the Karakoram-Hindukush-Himalayan water towers. Sci. Total Environ. 2020, 703, 135010. [Google Scholar] [CrossRef] [PubMed]
- Anari, R.; Hotchkiss, R.H.; Langendoen, E.J. Elements for the successful computer simulation of sediment management strategies for reservoirs. Water 2020, 12, 714. [Google Scholar] [CrossRef]
- White, R. Evacuation of Sediments from Reservoirs; Thomas Telford Publishing: London, UK, 2001. [Google Scholar] [CrossRef]
- Wang, G.; Wu, B.; Wang, Z.Y. Sedimentation problems and management strategies of sanmenxia reservoir, yellow river, china. Water Resour. Res. 2005, 41. [Google Scholar] [CrossRef]
- Morris, G.L.; Fan, J. Reservoir Sedimentation Handbook: Design and Management of Dams, Reservoirs, and Watersheds for Sustainable Use; McGraw Hill Professional: New York, NY, USA, 1998. [Google Scholar]
- Sabir, M.A.; Shafiq-Ur-Rehman, S.; Umar, M.; Waseem, A.; Farooq, M.; Khan, A.R.J. The impact of suspended sediment load on reservoir siltation and energy production: A case study of the Indus River and Its tributaries. Pol. J. Environ. Stud. 2013, 22, 219–225. [Google Scholar]
- Abdallah, M.; Stamm, J. Evaluating the impacts of sedimentation and water balance computations on reservoir operation, a case study of Girba Dam-Atbara River. Nile Basin Water Sci. Eng. J. 2012, 5, 14–24. [Google Scholar]
- Lai, J.-S.; Shen, H.W. Flushing sediment through reservoirs. J. Hydraul. Res. 1996, 34, 237–255. [Google Scholar] [CrossRef]
- Kawashima, S.; Johndrow, T.; Annandale, G.; Shah, F. Reservoir conservation volume I: The RESCON approach, economic and engineering evaluation of alternative strategies for managing sedimentation in storage reservoirs. In A Contribution to Promote Conservation of Water Storage Assets Worldwide. The International Bank for Reconstruction and Development; The World Bank: Washington, DC, USA, 2003. [Google Scholar]
- Schleiss, A.J.; Franca, M.J.; Juez, C.; De Cesare, G. Reservoir sedimentation. J. Hydraul. Res. 2016, 54, 595–614. [Google Scholar] [CrossRef]
- Garcia, M. Sedimentation engineering: Processes, measurements, modeling, and practice. Am. Soc. Civ. Eng. 2008. [Google Scholar] [CrossRef]
- Annandale, G.W.; Morris, G.L.; Karki, P. Extending the Life of Reservoirs: Sustainable Sediment Management for Dams and Run-of-River Hydropower; The World Bank: Washington, DC, USA, 2016. [Google Scholar] [CrossRef]
- Petkovsek, G.; Roca, M. Impact of reservoir operation on sediment deposition. In Proceedings of the Institution of Civil Engineers-Water Management; ICE Publishing: London, UK, 2014; pp. 577–584. [Google Scholar] [CrossRef]
- Rehman, M.A.; Naeem, U.A.; Hashmi, H.N.; Shakir, A.S. Possible options to slow down the advancement rate of Tarbela delta. Environ. Monit. Assess. 2018, 190, 39. [Google Scholar] [CrossRef]
- Iqbal, M.; Ghumman, A.R.; Hashmi, H.N.; Haider, S. Planning of Hydraulic Flushing Schedule for Prolonging the Life of a Hydropower Plant. IJST-T Civ. Eng. 2019, 43, 487–501. [Google Scholar] [CrossRef]
- Simoes, F.; Yang, C. Sedimentation modeling for rivers and reservoirs. In Erosion and Sedimentation Manual; United States Department of the Interior: Denver, CO, USA, 2006. [Google Scholar]
- Ferreira da Silva, A.M.; Ebrahimi, M. Meandering morphodynamics: Insights from laboratory and numerical experiments and beyond. Am. Soc. Civ. Eng. 2017. [Google Scholar] [CrossRef]
- USACE. HEC-RAS River Analysis System Hydraulic Reference Manual. Version 5.0. In Hydrologic Engineering Center Davis; US Army Corps of Engineers, Hydrologic Engineering Center: Davis, CA, USA, 2016. [Google Scholar]
- Mahmood, R.; Jia, S. Assessment of impacts of climate change on the water resources of the transboundary Jhelum River basin of Pakistan and India. Water 2016, 8, 246. [Google Scholar] [CrossRef]
- Babur, M.; Babel, M.S.; Shrestha, S.; Kawasaki, A.; Tripathi, N.K. Assessment of climate change impact on reservoir inflows using multi climate-models under RCPs—The case of Mangla Dam in Pakistan. Water 2016, 8, 389. [Google Scholar] [CrossRef]
- Saddique, N.; Usman, M.; Bernhofer, C. Simulating the Impact of Climate Change on the Hydrological Regimes of a Sparsely Gauged Mountainous Basin, Northern Pakistan. Water 2019, 11, 2141. [Google Scholar] [CrossRef]
- Butt, M.J.; Mahmood, R.; Waqas, A. Sediments deposition due to soil erosion in the watershed region of Mangla Dam. Environ. Monit. Assess. 2011, 181, 419–429. [Google Scholar] [CrossRef]
- Sarwar, S. Reservoir Life Expectancy in Relation to Climate and Land-Use Changes: Case Study of the Mangla Reservoir in Pakistan. Ph.D. Thesis, University of Waikato, Hamilton, New Zealand, 2013. [Google Scholar]
- Iqbal, M.; Ghumman, A.R.; Haider, S.; Hashmi, H.N.; Khan, M.A. Application of Godunov type 2D model for simulating sediment flushing in a reservoir. Arab. J. Sci. Eng. 2019, 44, 4289–4307. [Google Scholar] [CrossRef]
- Mastrandrea, M.D.; Field, C.B.; Stocker, T.F.; Edenhofer, O.; Ebi, K.L.; Frame, D.J.; Held, H.; Kriegler, E.; Mach, K.J.; Matschoss, P.R. Guidance Note for Lead Authors of the IPCC Fifth Assessment Report on Consistent Treatment of Uncertainties. 2010. Available online: https://pure.mpg.de/rest/items/item_2147184/component/file_2147185/content (accessed on 3 February 2020).
- Azmat, M.; Choi, M.; Kim, T.-W.; Liaqat, U.W. Hydrological modeling to simulate streamflow under changing climate in a scarcely gauged cryosphere catchment. Environ. Earth Sci. 2016, 75, 186. [Google Scholar] [CrossRef]
- Archer, D.R.; Fowler, H.J. Using meteorological data to forecast seasonal runoff on the River Jhelum, Pakistan. J. Hydrol. 2008, 361, 10–23. [Google Scholar] [CrossRef]
- Siddiqui, M.J.; Haider, S.; Gabriel, H.; Shahzad, A. Rainfall–runoff, flood inundation and sensitivity analysis of the 2014 Pakistan flood in the Jhelum and Chenab river basin. Hydrol. Sci. J. 2018, 63, 1976–1997. [Google Scholar] [CrossRef]
- Di Silvio, G.; Zanke, U.C.; Wang, Z.Y. World association for sedimentation and erosion research (WASER). Int. J. Sediment Res. 2016, 2. Available online: http://www.cnki.com.cn/Article/CJFDTotal-GJNS201602002.htm (accessed on 7 September 2019).
- Sheikh, M.S. Mangla Dam—Past, Present & Future. In Proceedings of the Centenary Celebration (1912–2012), Pakistan, 2012; pp. 131–147. Available online: https://pecongress.org.pk/images/upload/books/6-M.%20Saleem%20Sheikh.pdf (accessed on 13 October 2019).
- Saddique, N.; Bernhofer, C.; Kronenberg, R.; Usman, M. Downscaling of CMIP5 models output by using statistical models in a data scarce mountain environment (Mangla Dam Watershed), Northern Pakistan. Asia Pac. J Atmos Sci. 2019, 55, 719–735. [Google Scholar] [CrossRef]
- Binnie, G.; Gerrard, R.; Eldridge, J.; Kirmani, S.; Davis, C.; Dickinson, J.; Gwyther, J.; Thomas, A.; Little, A.; Clark, J. Mangla. Part 1. Engineering Of Mangla. Proc. Inst. Civ. Eng. 1967, 38, 338–544. [Google Scholar] [CrossRef]
- Binnie, G.; Gerrard, R.; Eldridge, T.; Kirmani, S.; Davis, C.; Paton, T.; Penman, A.; Skempton, A.; Copping, T.; Bartlett, C. Mangla: Part 1 and Part 2. Discussion: Includes corrigenda. Proc. Inst. Civ. Eng. 1968, 41, 119–202. [Google Scholar] [CrossRef]
- Porterfield, G. Computation of fluvial-sediment discharge. Techniques of Water-Resources Investigations of the United States Geological Survey, Book 3. US Geol. Surv. 1972. [Google Scholar] [CrossRef]
- Rantz, S.E. Measurement and Computation of Streamflow; US Department of the Interior, Geological Survey: Washington, DC, USA, 1982; Volume 2175. [Google Scholar]
- Edwards, T.K.; Glysson, G.D.; Guy, H.P.; Norman, V.W. Field Methods for Measurement of Fluvial Sediment; US Geological Survey: Denver, CO, USA, 1999. [Google Scholar]
- Colby, B. Relationship of Sediment Discharge to Streamflow; 2331–1258; US Dept. of the Interior, Geological Survey, Water Resources Division: Washington, DC, USA, 1956. [Google Scholar] [CrossRef]
- Roushangar, K.; Shahnazi, S. Determination of influential parameters for prediction of total sediment loads in mountain rivers using kernel-based approaches. J. Mt. Sci. 2020, 17, 480–491. [Google Scholar] [CrossRef]
- Ateeq-Ur-Rehman, S.; Bui, M.D.; Hasson, S.U.; Rutschmann, P. An innovative approach to minimizing uncertainty in sediment load boundary conditions for modelling sedimentation in reservoirs. Water 2018, 10, 1411. [Google Scholar] [CrossRef]
- Tarar, Z.R.; Ahmad, S.R.; Ahmad, I.; Khan, Z.M.; Washakh, R.M.A.; Ateeq-Ur-Rehman, S.; Bui, M.D. Effect of Sediment Load Boundary Conditions in Predicting Sediment Delta of Tarbela Reservoir in Pakistan. Water 2019, 11, 1716. [Google Scholar] [CrossRef]
- Abdallah, M.; Stamm, J. Developing an optimum multipurpose reservoir operation policy under uncertain conditions. Nile Basin Water Sci. Eng. J. 2012, 5, 35–47. [Google Scholar]
- Roca, M. Tarbela Dam in Pakistan. Case Study of Reservoir Sedimentation. Available online: http://eprints.hrwallingford.com/id/eprint/891 (accessed on 21 May 2019).
- Bennett, N.D.; Croke, B.F.; Guariso, G.; Guillaume, J.H.; Hamilton, S.H.; Jakeman, A.J.; Marsili-Libelli, S.; Newham, L.T.; Norton, J.P.; Perrin, C.J.E.M.; et al. Characterising performance of environmental models. Environ. Model. Softw. 2013, 40, 1–20. [Google Scholar] [CrossRef]
- Rahman, K.U.; Shang, S.; Shahid, M.; Wen, Y. Hydrological evaluation of merged satellite precipitation datasets for streamflow simulation using SWAT: A case study of Potohar Plateau, Pakistan. J. Hydrol. 2020, 125040. [Google Scholar] [CrossRef]
- Glysson, G.D. Sediment-Transport Curves. U.S. Geological Survey. 1987. Available online: https://pubs.usgs.gov/of/1987/0218/report.pdf (accessed on 9 December 2019).
- Hussain, D.; Hussain, T.; Khan, A.A.; Naqvi, S.A.A.; Jamil, A. A deep learning approach for hydrological time-series prediction: A case study of Gilgit river basin. Earth Sci. Inform. 2020, 1–13. [Google Scholar] [CrossRef]
- Yaseen, Z.M.; Naganna, S.R.; Sa’adi, Z.; Samui, P.; Ghorbani, M.A.; Salih, S.Q.; Shahid, S. Hourly river flow forecasting: Application of emotional neural network versus multiple machine learning paradigms. Water Resour Manag. 2020, 1–17. [Google Scholar] [CrossRef]
- Pham, B.T.; Le, L.M.; Le, T.-T.; Bui, K.-T.T.; Le, V.M.; Ly, H.-B.; Prakash, I. Development of advanced artificial intelligence models for daily rainfall prediction. Atmos. Res. 2020, 237, 104845. [Google Scholar] [CrossRef]
- Moradi, A.M.; Dariane, A.B.; Yang, G.; Block, P. Long-range reservoir inflow forecasts using large-scale climate predictors. Int. J. Climatol. 2020. [Google Scholar] [CrossRef]
- Üneş, F.; Demirci, M.; Taşar, B.; Kaya, Y.Z.; Varçin, H. Estimating dam reservoir level fluctuations using data-driven techniques. Pol. J. Environ. Stud. 2019. [Google Scholar] [CrossRef]
- Ladanu, A.A.; Akanmu, S.; Adeyemo, J. Enhancing artificial neural network with multi-objective evolutionary algorithm for optimizing real time reservoir operations: A review. Am. J. Water Resour. 2020, 8, 118–127. [Google Scholar] [CrossRef]
- Malik, A.; Kumar, A.; Kisi, O.; Shiri, J. Evaluating the performance of four different heuristic approaches with Gamma test for daily suspended sediment concentration modeling. Environ. Sci. Pollut. Res. 2019, 26, 22670–22687. [Google Scholar] [CrossRef]
- Roshni, T.; Jha, M.K.; Drisya, J. Neural network modeling for groundwater-level forecasting in coastal aquifers. Neural. Comput. Appl. 2020, 1–18. [Google Scholar] [CrossRef]
- Chow, V.T. Open Channel Hydraulics; McGraw-Hill: New York, NY, USA, 1959; pp. 26–27. [Google Scholar] [CrossRef]
- Ackers, P.; White, W.R. Sediment transport: New approach and analysis. J. Hydraul. Div. 1973, 99, 2041–2060. [Google Scholar]
- Laursen, E.M. The total sediment load of streams. J. Hydraul. Div. 1958, 84, 1–36. [Google Scholar]
- Engelund, F.; Hansen, E. A Monograph on Sediment Transport in Alluvial Streams. Technical University of Denmark Ostervoldgade 10, Copenhagen K. 1967. Available online: http://resolver.tudelft.nl/uuid:81101b08-04b5-4082-9121-861949c336c9 (accessed on 5 January 2020).
- Meyer-Peter, E.; Müller, R. Formulas for Bed-Load Transport. In Proceedings of the IAHSR 2nd Meeting, Stockholm, Appendix 2. 1948. Available online: http://resolver.tudelft.nl/uuid:4fda9b61-be28-4703-ab06-43cdc2a21bd7 (accessed on 10 January 2020).
- Copeland, R.R.; Thomas, W.A. Corte Madera Creek Sedimentation Study. US Army Engineer Waterways Experiment Station, Vicksburg, MS. TR-HL-89-6. 1989. Available online: http://hdl.handle.net/11681/13578 (accessed on 11 January 2020).
- Yang, C.T. Incipient motion and sediment transport. J. Hydraul. Div. 1973, 99, 1679–1704. [Google Scholar]
- Yang, C.T. Unit stream power equation for gravel. J. Hydraul. Eng. 1984, 110, 1783–1797. [Google Scholar] [CrossRef]
- Toffaleti, F.B. A Procedure for Computation of the Total River Sand Discharge and Detailed Distribution, Bed to Surface; Committee On Channel Stabilization (ARMY): 1968. Available online: https://hdl.handle.net/11681/1822 (accessed on 12 January 2020).
- Wilcock, P.R.; Crowe, J.C. Surface-based transport model for mixed-size sediment. J. Hydraul. Eng. 2003, 129, 120–128. [Google Scholar] [CrossRef]
- Raza, R.A.; Khan, N.M.; Akhtar, N. Exploring sediment management options of Mangla Reservoir using RESSASS. Sci. Int. 2015, 27, 3347–3352. [Google Scholar]
- Krone, R.B. Flume Studies of Transport of Sediment in Estrarial Shoaling Processes; Final Report; Hydraulic Engineering Laboratory and Sanitary Engineering Research Laboratory, University of California: Berkeley, CA, USA, 1962. [Google Scholar]
- Partheniades, E. Erosion and deposition of cohesive soils. J. Hydraul. Div. 1965, 91, 105–139. [Google Scholar]
- Espa, P.; Crosa, G.; Gentili, G.; Quadroni, S.; Petts, G. Downstream ecological impacts of controlled sediment flushing in an Alpine valley river: A case study. River Res. Appl. 2015, 31, 931–942. [Google Scholar] [CrossRef]
© 2020 by the authors. Licensee MDPI, Basel, Switzerland. This article is an open access article distributed under the terms and conditions of the Creative Commons Attribution (CC BY) license (http://creativecommons.org/licenses/by/4.0/).