Article

Long-Term (2001–2020) Nutrient Transport from a Small Boreal Agricultural Watershed: Hydrological Control and Potential of Retention Ponds

Lammi Biological Station, Ecosystems and Environment Research Programme, Faculty of Biological and Environmental Sciences, Helsinki University, 16900 Lammi, Finland
*
Author to whom correspondence should be addressed.
Water 2020, 12(10), 2731; https://doi.org/10.3390/w12102731
Submission received: 3 August 2020 / Revised: 24 September 2020 / Accepted: 24 September 2020 / Published: 30 September 2020

Abstract

:
Agriculture contributes significantly to phosphorus and nitrogen loading in southern Finland. Climate change with higher winter air temperatures and precipitation may also promote loading increase further. We analyzed long-term nutrient trends (2001–2020) based on year-round weekly water sampling and daily weather data from a boreal small agricultural watershed. In addition, nutrient retention was studied in a constructed sedimentation pond system for two years. We did not find any statistically significant trends in weather conditions (temperature, precipitation, discharge, snow depth) except for an increase in discharge in March. Increasing trends in annual concentrations were found for nitrate, phosphate, and total phosphorus and total nitrogen. In fact, phosphate concentration increased in every season and nitrate concentration in other seasons except in autumn. Total phosphorus and total nitrogen concentrations increased in winter as well and total phosphorus also in summer. Increasing annual loading trend was found for total phosphorus, phosphate, and nitrate. Increasing winter loading was found for nitrate and total nitrogen, but phosphate loading increased in winter, spring, and summer. In the pond system, annual retention of total nitrogen was 1.9–4.8% and that of phosphorus 4.3–6.9%. In addition, 25–40% of suspended solids was sedimented in the ponds. Our results suggest that even small ponds can be utilized to decrease nutrient and material transport, but their retention efficiency varies between years. We conclude that nutrient loading from small boreal agricultural catchments, especially in wintertime, has already increased and is likely to increase even further in the future due to climate change. Thus, the need for new management tools to reduce loading from boreal agricultural lands becomes even more acute.

1. Introduction

Finland is among the few areas where agriculture has traditionally been carried out above the 60th parallel north. As climate change has already been most rapid in the North, Finnish agriculture is facing major challenges relating to rising air temperatures and losses of snow and freezing of ground in winter. As a result, erosion of soil may substantially increase, and higher nutrient loading from agricultural lands may be expected [1]. The importance of agriculture in nutrient loading is evident as 58% of phosphorus (P) and 51% of nitrogen (N) inputs to the Finnish waterways originate from agriculture [2]. Any increases in erosion and runoff will almost certainly enhance nutrient loading to inland waters, but specifically coastal waters, as the agricultural activities are most intensive in southern and western parts of Finland. Eutrophication is especially affecting the coastal waters of Finland and the entire Baltic Sea [3], but it is also deteriorating many inland lakes and rivers as well. High availability of nutrients together with higher water temperatures may result in toxic algal blooms, which create health risks for recreational and agricultural use of water as well as fish farming.
According to climate predictions, precipitation will increase in Northern Europe [4,5]. Between 1847 and 2013, the annual mean temperature in Finland increased 0.14 °C per decade [6], which is more than the corresponding increase globally [7]. Typically in Finland, the highest discharge and nutrient loads have been detected during the spring melt or in autumn, but future scenarios state that periods of high discharge shift from spring towards winter months [8], a period when the warming has already been strongest [7]. As a result of increased winter air temperature and precipitation, snow depth has decreased in southern, western, and central parts of Finland [9]. Besides the increase in dissolved inorganic nutrients, mild and wet winters may also result in increased suspended sediment transport [1] and increased organic matter mineralization [10], which may further challenge the nutrient loss mitigation measures and regulations.
In Finland, the use of P and N fertilizers relative to field area was highest during late 1980s and early 1990s. To reduce agricultural nutrient loading, a fertilizer tax was set in 1992 until 1995, when Finland became part of the European Union (EU). Since the mid-1990s, water protection measures and agro-environmental subsidies, together with changes in agricultural cultivation practices, decreased the amounts of fertilizers consumed. However, the nutrient loss reductions have not reached the set targets [11]. As excessive amounts of N is harmful to people and nature, the EU adopted the Nitrates Directive (91/676/EEC) to reduce nitrate–nitrogen (NO3-N) pollution. Although NO3-N levels of surface and groundwaters are generally low in Finland in comparison to many other EU countries, increasing NO3-N trends have been found in Finnish rivers and lakes, and very high NO3-N concentration over 25 mg L−1 has been found in nine river sites [12].
Wetlands have been reported as efficient ecosystems in mitigating nutrient and sediment load from agricultural areas [13,14]. Besides, they can provide many other important ecosystem services such as biodiversity [15]. Wetland N removal is based on microbially driven denitrification and is temperature-dependent [16], which raises a question of its efficiency in cold climate [17,18]. N and P retention consists also of sedimentation and biomass accumulation, which is only partially permanent. Several studies suggest great variation in nutrient retention in wetlands between different seasons. Regardless of wetlands, during storm events in particular, nutrient leaching from agricultural fields may dramatically increase. In an agricultural stream with ponds, the combination of low temperature and high discharge can result in negative retention, while base flow and summertime often result in positive retention [19,20,21,22].
The trend in atmospheric N deposition at the Finnish Integrated Monitoring Catchment Area Valkea-Kotinen in Southern Finland, from 1988 to 2011, showed a decline [23], thus suggesting even stronger contribution of agricultural N today than some 20–30 years earlier. Despite the decreasing domestic atmospheric N loading, an increase was detected between 2002 and 2008, and the main source was suggested to be increased emission from abroad [23]. Another issue to be considered is the enrichment of N and P in soils [24,25]. It has been found that it may take a long time before any major water quality improvements can be detected in the recipient water bodies after decreasing fertilization of agricultural fields [24].
Nutrient loading from Finnish rivers to the Baltic Sea remains too high, and especially N concentrations have shown increasing trends in surface waters impacted by agriculture [26,27]. This study investigated the long-term nutrient trends in a small stream collecting waters from a small agricultural watershed in southern Finland. Boreal area having a large network of streams, canals, and ditches of small catchments is a potential site for high N retention [28]. Recently, a great number of small sedimentation ponds have been built in Finland to prevent loading from agricultural land. In this study, combining long-term weekly measured water chemistry with daily hydrological and meteorological data, we analyzed nutrient transport patterns relative to the hydrological and climatic conditions.
We have raised three key questions to be answered:
  • Has nutrient transport out of the watershed changed in the long run, and can it be explained by changes in weather and hydrological conditions?
  • Are there seasonal differences in nutrient transport relative to weather and hydrological conditions?
  • How do constructed retention ponds affect nutrient and suspended solids transport from a small agricultural watershed to the recipient lake?

2. Materials and Methods

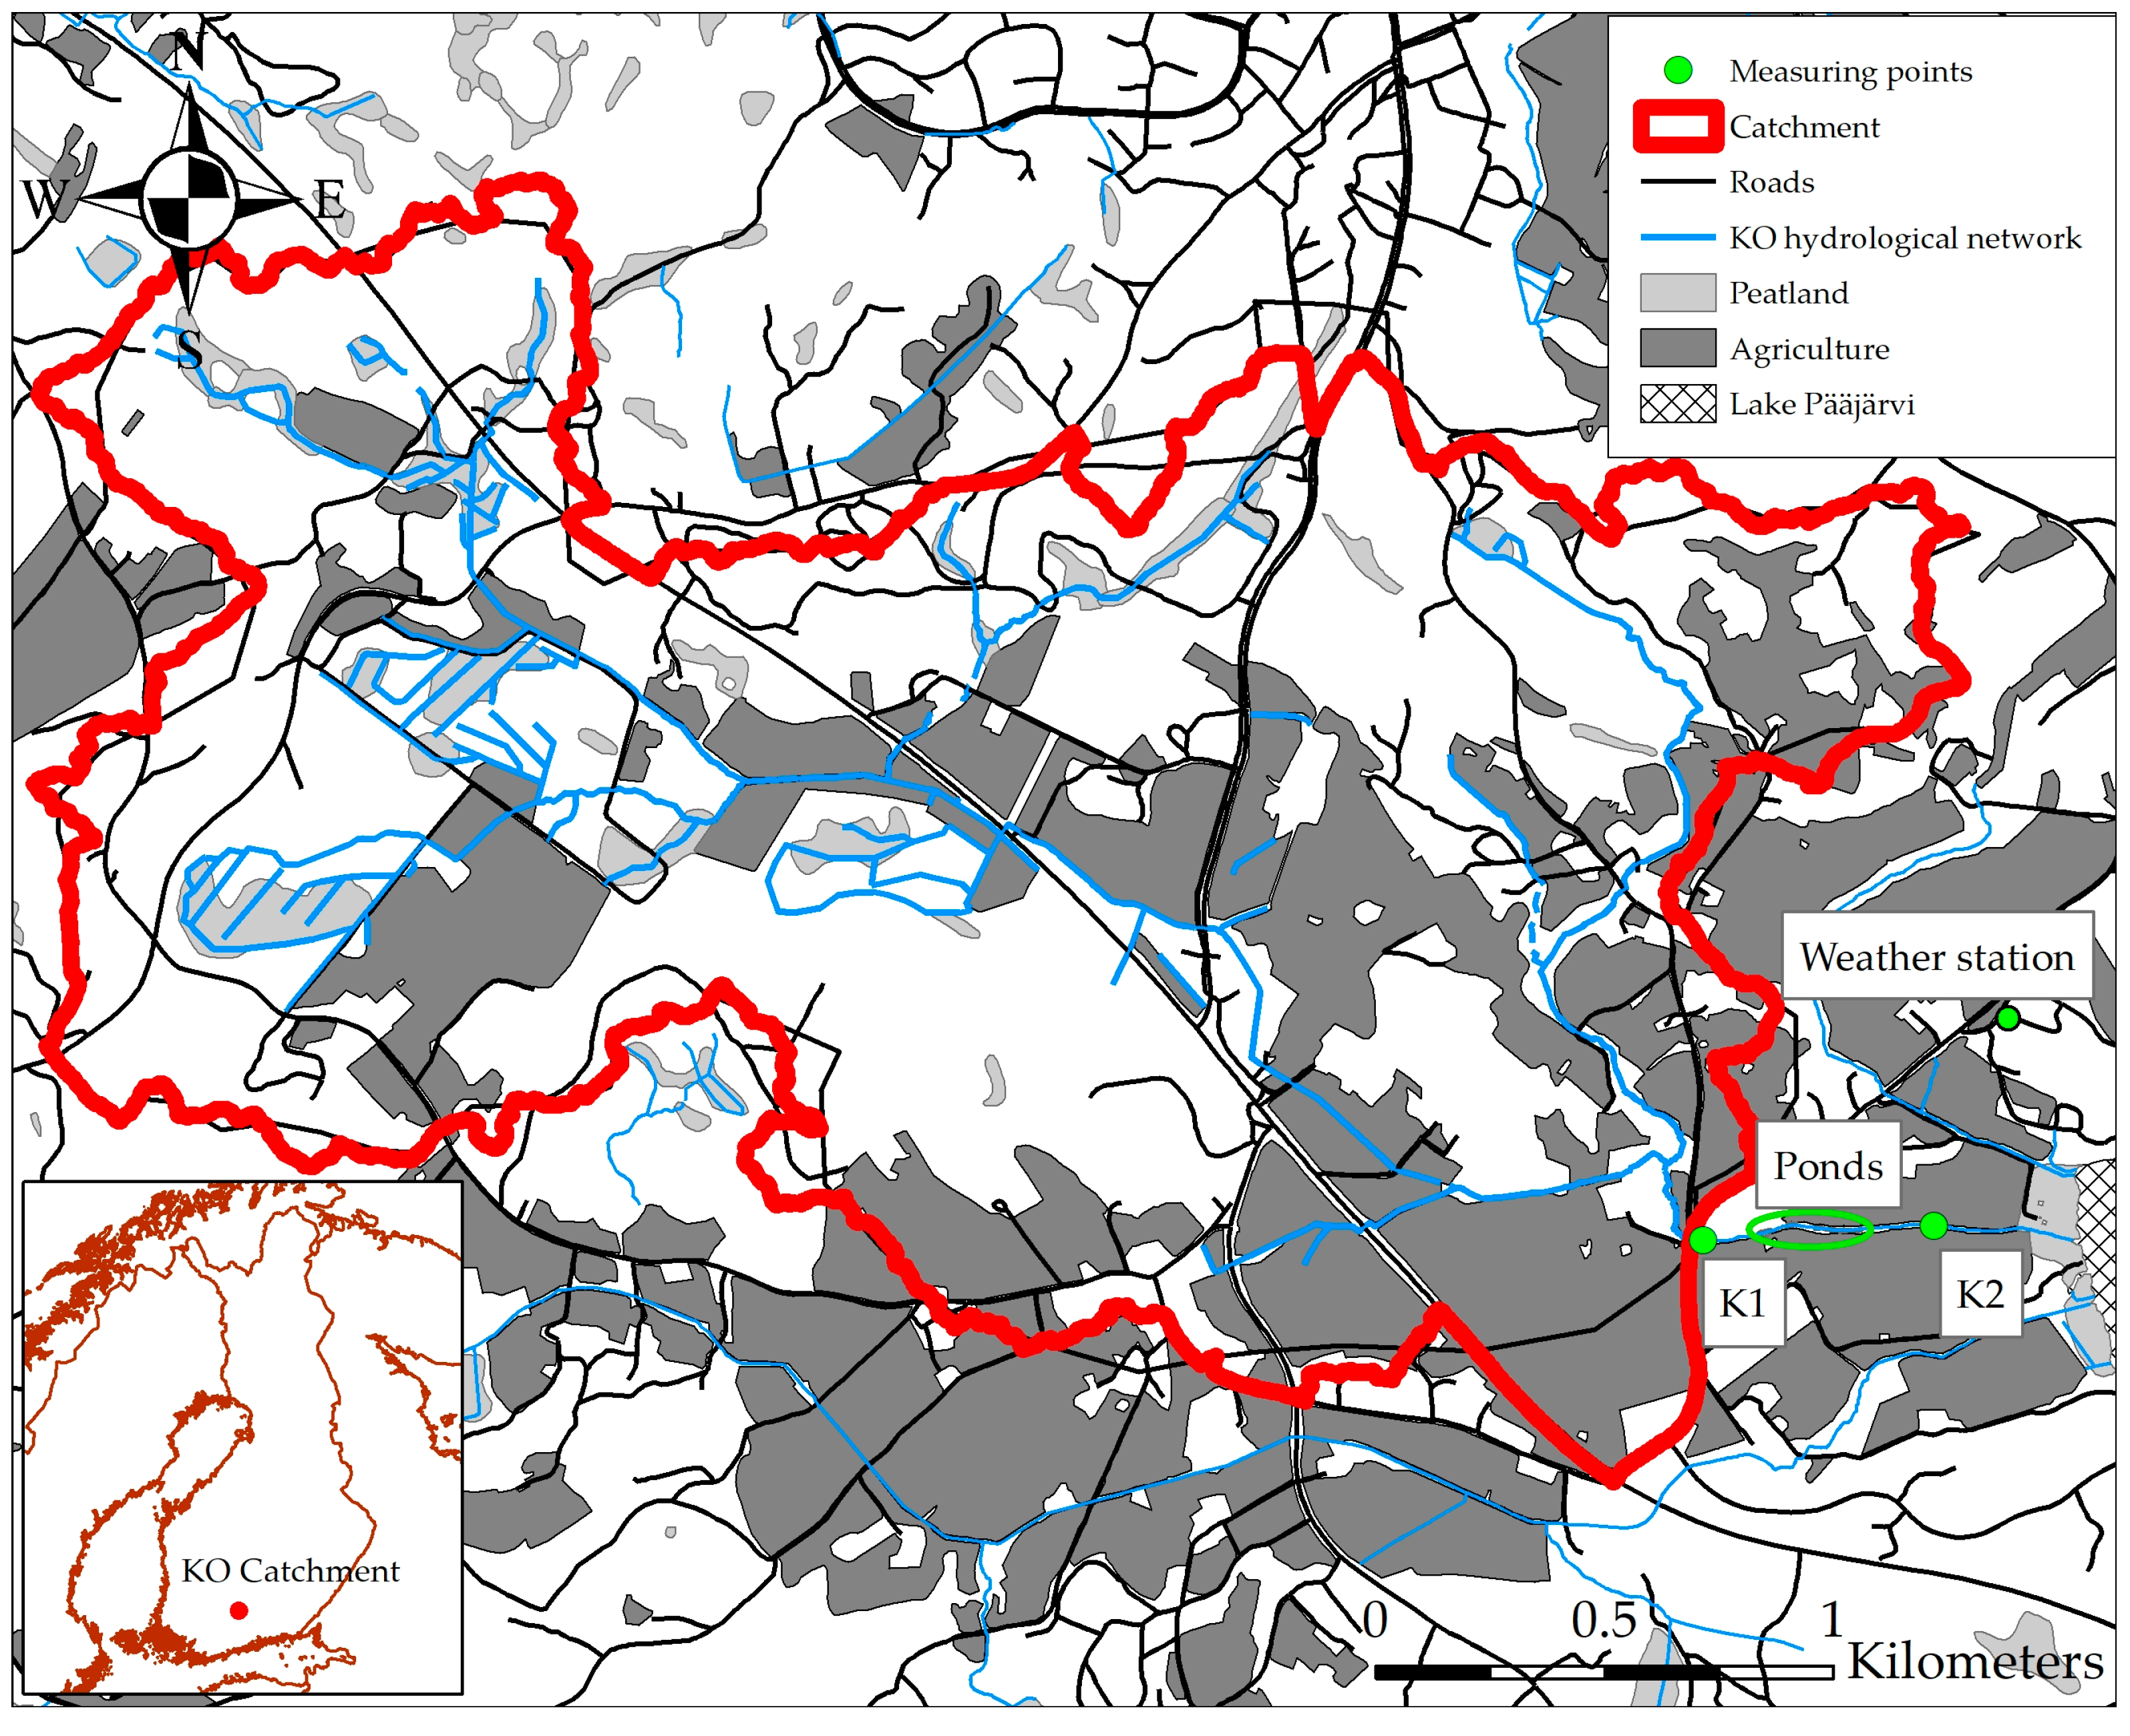
2.1. Study Area and the Constructed Pond System

The studied stream, Koiransuolenoja, is in southern Finland in the watershed of Lake Pääjärvi. The size of the Koiransuolenoja catchment in the monitoring point K1 (61°04′97′′ N, 25°02′89′ E) is 6.8 km2 (Figure 1). Most of the watershed is dominated by forestry (71%), but the stream is strongly influenced by agriculture with 24% of the catchment being cultivated fields. Koiransuolenoja has a high N content, consisting mainly of NO3-N. Between 1995 and 2012, the mean Tot-N concentration in the stream was 2.5 ± 1.0 mg L−1, and the mean annual precipitation 630 ± 81 mm [29]. Within the same time frame, the mean stream discharge (Q) in high season was 0.152 m3 s−1 and in low season 0.020 m3 s−1 [29]. Almost half of the catchment surface soil is easily erodible [30].
In March 2013, a set of 3 sedimentation ponds and bottom stone dams before and after them were constructed 450–700 m upstream from the lake inlet in the previously straightened Koiransuolenoja. The maximum depth of the ponds was 1.5–1.8 m. To investigate the efficiency of the pond system, water samples for nutrient and dissolved organic carbon (DOC) analyses were taken from two points from April 2013 to April 2015. Samples for suspended solids were taken once or twice a week from March to November in 2013 and 2014. The first sampling point was K1, about 127 m upstream from the first pond. The second sampling point was K2, located after the last pond and the bottom dam 510 m downstream from K1. The pond and stream surface area between the sampling points was 1247 m2, representing 0.027% of the watershed size. The annual average theoretical hydraulic retention time between the sampling points during July 2014–June 2015 [18] was 5.5 h.

2.2. Long-Term Nutrient and DOC Sampling and Laboratory Analyses

Water samples for chemical analyses were collected manually from Koiransuolenoja stream monitoring point K1 (Figure 1) every week, year-round, from February 2001 until May 2020. The water temperature and flow rate were measured with a flowmeter (MiniAir2, Schiltknecht, Gossau, Switzerland) simultaneously with water level. The daily discharge was calculated from the curve based on the weekly measured flow rate and water level at site K1 during 2013–2015 and on regression model between Koiransuolenoja´s measurements and automatic discharge measurements from River Mustajoki (Finnish Environment Institute) situated in the same watershed area of Lake Pääjärvi. From water samples, dissolved organic carbon (DOC), NO3-N (indicating the NO2 + NO3), ammonium-nitrogen (NH4-N), phosphate-phosphorus (PO4-P), total N and P (Tot-N, Tot-P), and suspended solids were analyzed in the laboratory at Lammi Biological Station. Air temperature, precipitation, and snow depth data were obtained from the weather station of the Finnish Meteorological Institute (situated approximately 800 m northeast from the studied stream).
After sampling, water samples were kept dark and cold (+4 °C) and analyzed within 1–3 h from sampling. Total nutrients were analyzed from nonfiltered samples. Tot-N was analyzed according to SFS-EN ISO 11905-1. Tot-P and phosphate-phosphorus (PO4-P) were analyzed following standard ISO/DIS 15681-2, except using persulfate digestion in the Tot-P analysis. For dissolved fractions, the samples were filtered with pre-rinsed (deionized water MQ; Millipore, Billerica, MA, USA) 0.45 μm filters (Millex-HA, Merck KGaA, Darmstadt, Germany). DOC was analyzed according to standard SFS-EN 1484 with a carbon analyzer (Ordior TOC-V, Shimadzu, Tokyo, Japan). NO3-N was analyzed following SFS-EN ISO 13395 and NH4-N analyzed according to standard SFS-EN ISO 11732 using the salicylate method. Nutrients were measured with a spectrophotometer (Gallery Plus, Thermo Fisher Scientific, Helsinki, Finland). Organic N (ON) and organic P (OP) were calculated by subtracting the concentrations of dissolved fractions from totals (i.e., ON = Tot-N-NO3-N-NH4-N and OP = Tot-P-PO4-P). Concentrations of suspended solids were measured by filtering sample water through a Whatman GF/C fiberglass filter (Millipore, Billerica, MA, USA), and weighting and drying filters at 105 °C for 1 h. Finally, the concentrations and discharge rates were used to calculate rates of nutrient and material transport.

2.3. Data Analyses

We used non-parametric Mann–Kendall trend tests and Sen slope value (S) to analyze long-term (annual, seasonal, and monthly) weather conditions (air and stream water temperature, precipitation, discharge, snow depth), nutrient concentrations and nutrient loading from February 2001 to May 2020. The statistical significance limit (p-value) used was 0.05. Pearson correlation analysis was used to investigate the relationships between weather conditions and nutrient concentrations. In seasonal analysis, we divided the year into four seasons as follows: winter (December–February, XII–II), spring (March–May, III–V), summer (June–August, VI–VIII) and autumn (September–November, IX–XI). The nutrient and material retention of the pond system was calculated using loading rates between sampling points K1 and K2 for two years. The average annual retention was calculated for two periods (from mid-April 2013 to mid-April 2014 and similarly in 2014–2015) and separately for summer seasons in 2013 and 2014 (from mid-May to mid-September). The software used in the analysis was Microsoft Excel for Mac 16.37 with the XLSTAT package.

3. Results

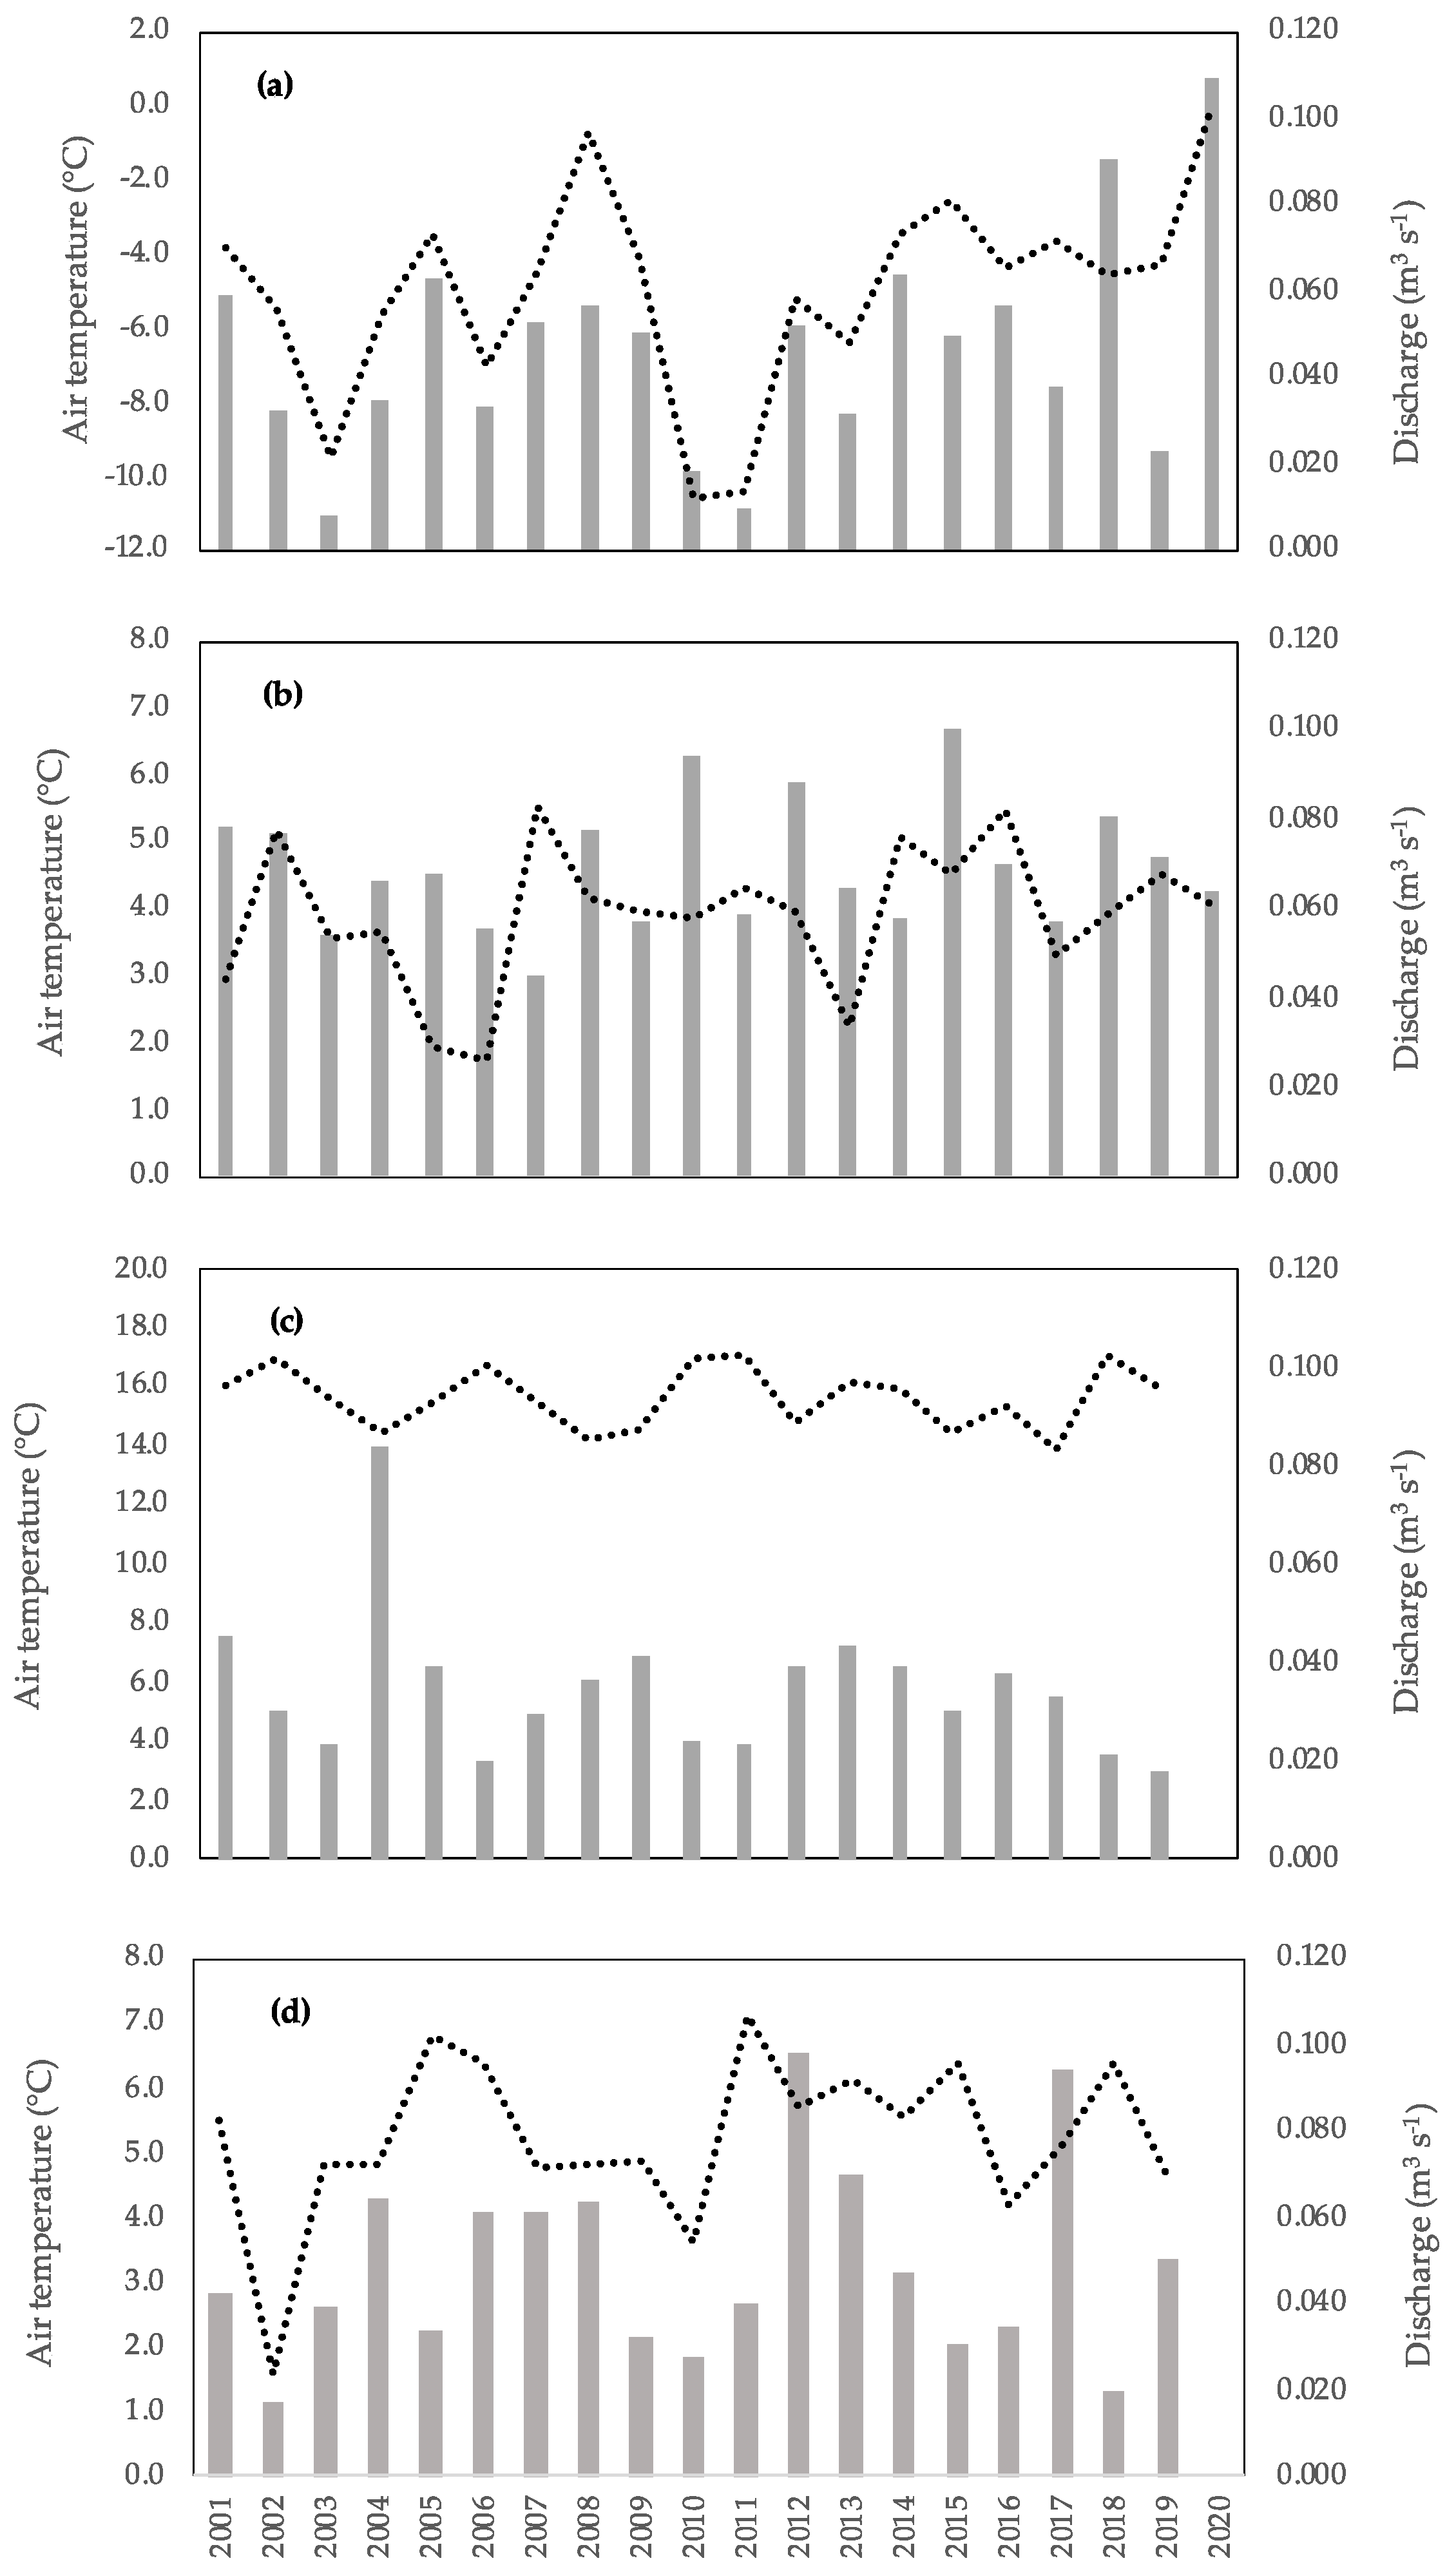
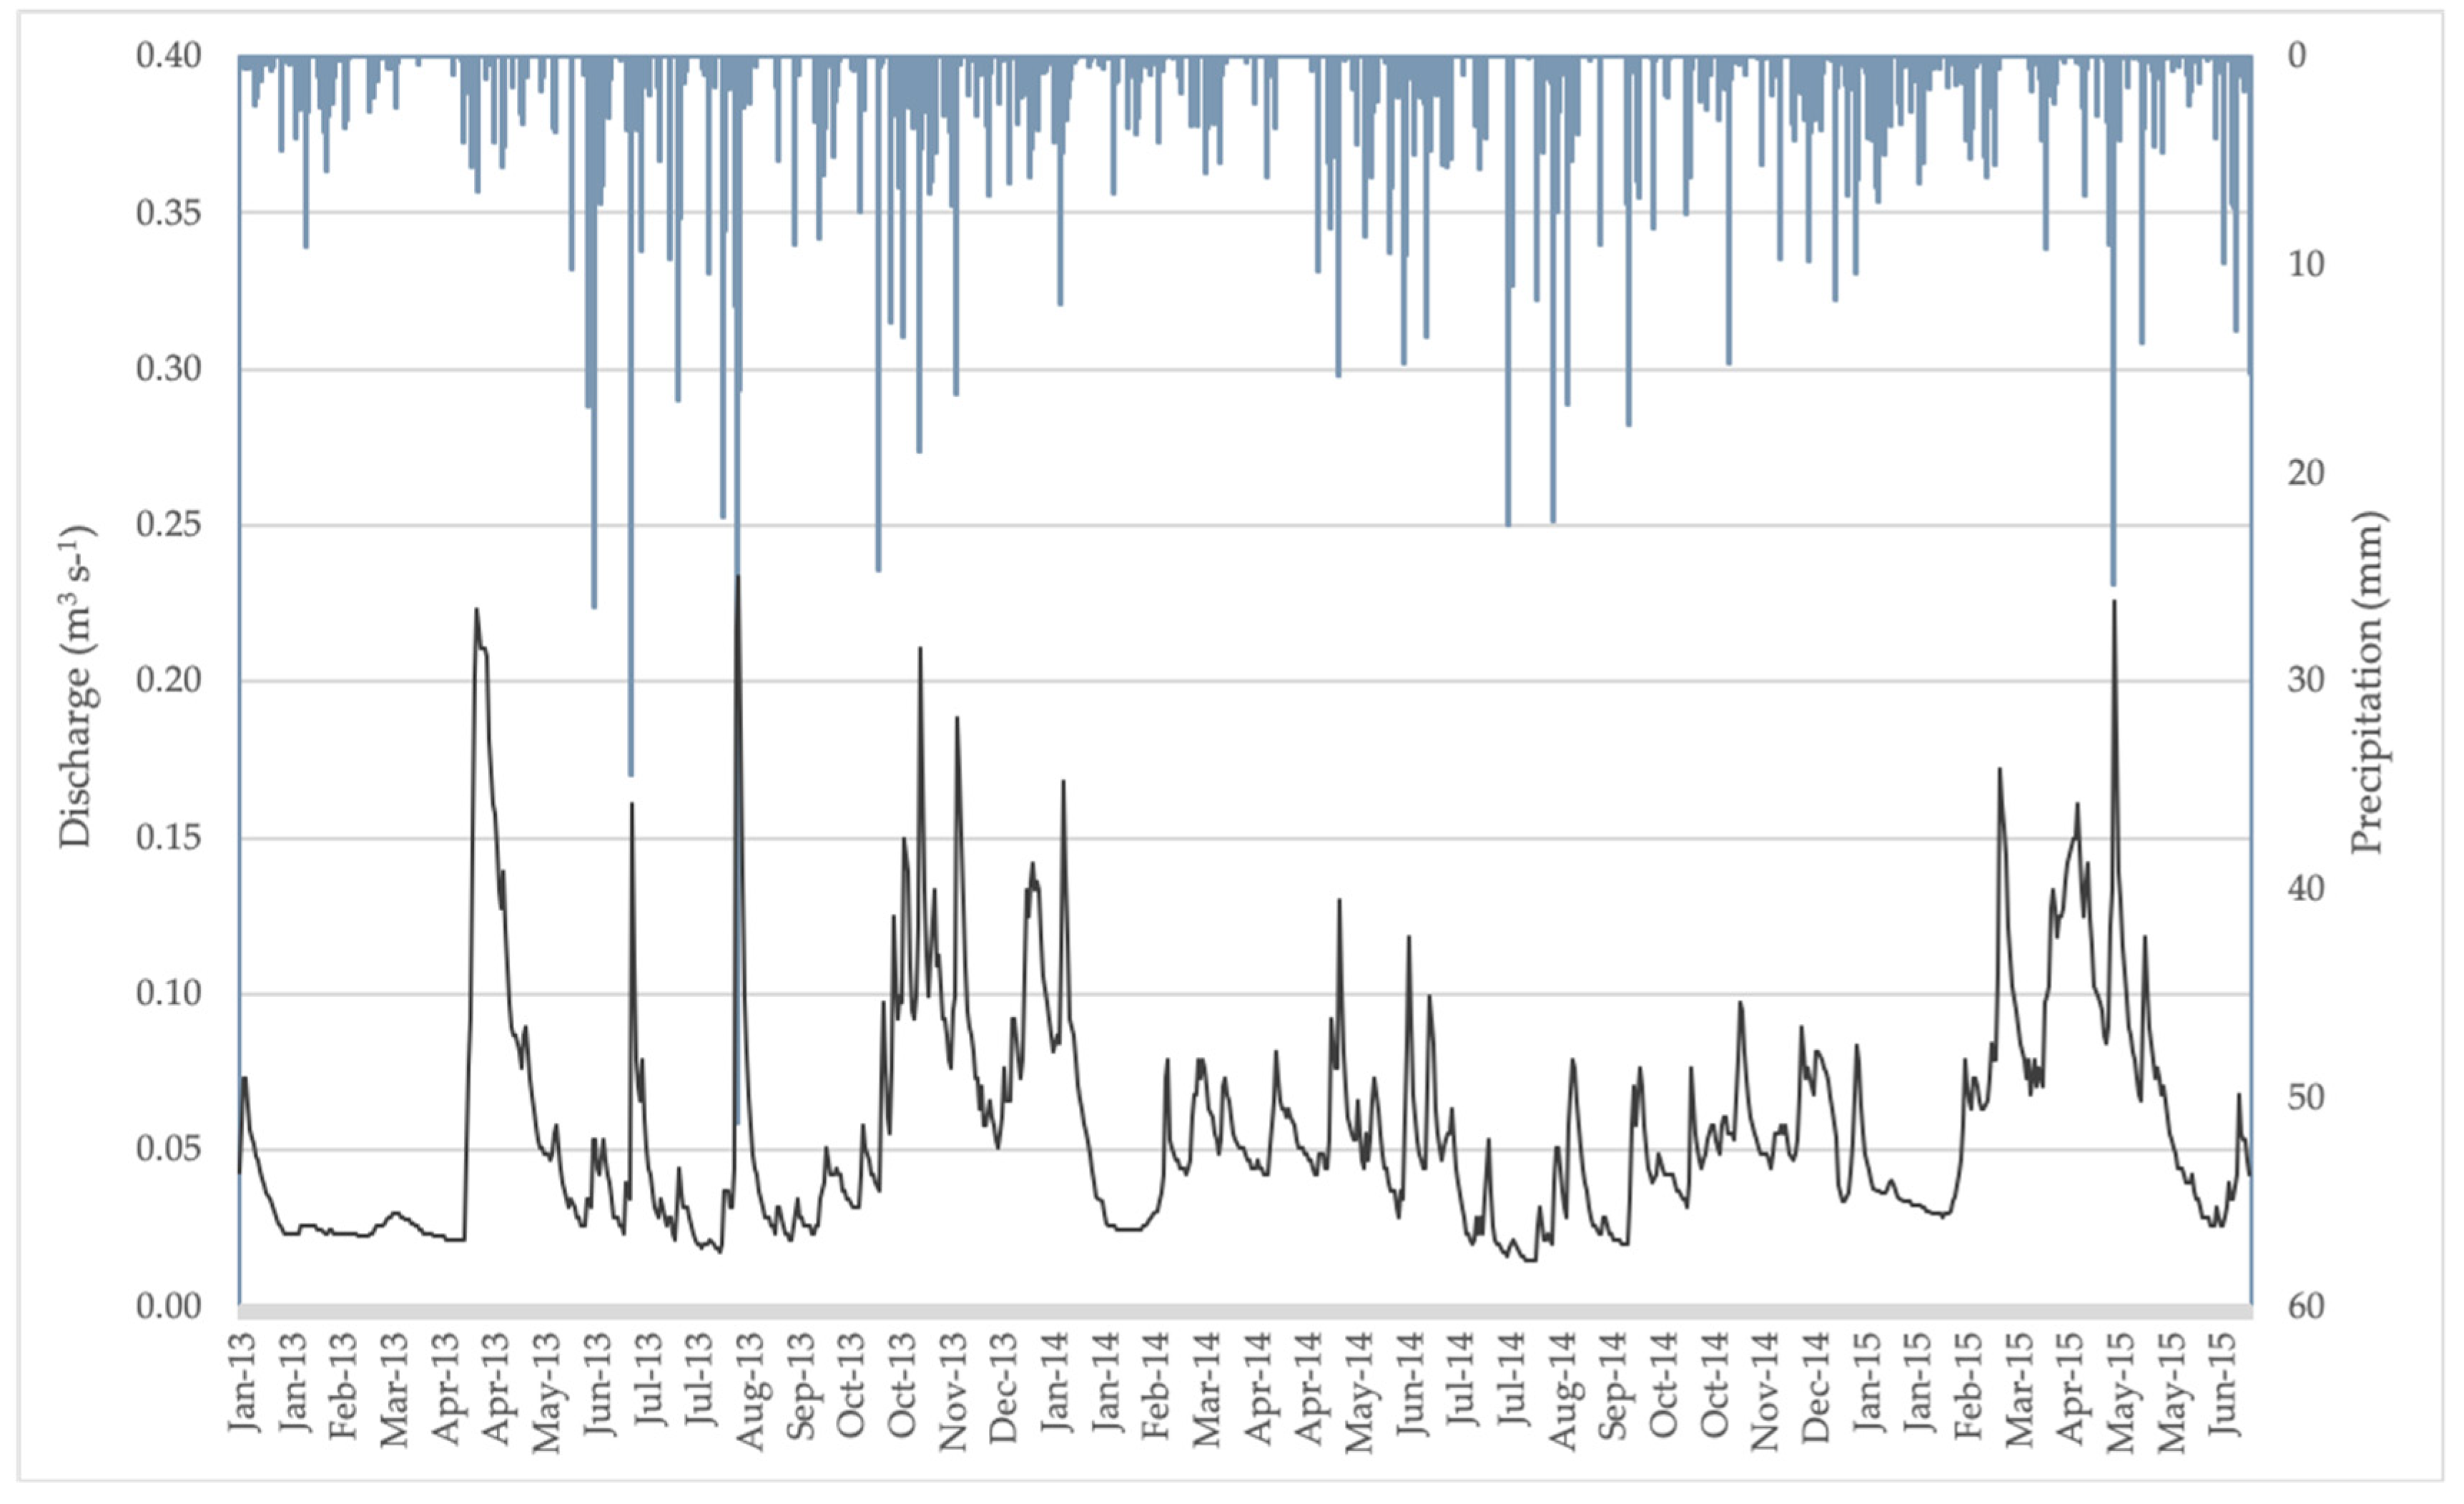
3.1. Annual Weather Conditions and Fluctuation of Nutrient Delivery 2001–2019

During the 19 years study period, the average air temperature varied annually between 3.2 °C in 2010 and 6.0 °C in 2015 (sd ± 0.7). The highest annual precipitation was 816 mm measured in 2012 and the lowest 435 mm in 2018 (sd ± 112). The average stream discharge varied between 0.035 m3 s−1 in 2003 and 0.064 m3 s−1 in 2012. The snow depth (December–March) varied between the minimum of winter 2019–2020 (mean 2.5, max 9 cm) and the maximum of winter 2010–2011 (mean 42.9, max 62 cm). We did not find any trends in the annual weather conditions (Table 1). The air temperature became close to an increasing trend, however.
Mean annual Tot-N loading was 6.6 kg (sd ± 2.1) N ha−1 a−1 and Tot-P loading 0.093 (sd ± 0.037) kg P ha−1 a−1. The maximum Tot-N load from the watershed was 11.1 kg ha−1 a−1 in 2012 simultaneously with maximum discharge, and Tot-P load 0.210 kg ha−1 a−1 in 2017. The minimum loading values 3.6 kg Tot-N ha−1 a−1 and 0.058 kg Tot-P ha−1 a−1 occurred during the same year in 2003 together with minimum discharge (and precipitation). Mean annual NO3-N loading was 5.2 (sd ± 1.7) kg ha−1 a−1, varying between 2.4 and 8.3 kg ha−1 a−1 similarly during the same years as Tot-N. Mean NH4-N loading was 0.26 (sd ± 0.11) kg ha−1 a−1 and PO4-P loading 0.028 (sd ± 0.028) kg ha−1 a−1. The maximum NH4-N load (0.53 kg ha−1 a−1) was observed in 2017 as the maximum PO4-P (0.096 kg ha−1 a−1) and Tot-P load (0.21 kg ha−1 a−1). The annual mean DOC transport from the watershed was 20.8 (sd ± 6.7) kg ha−1 a−1, varying between 12.5 and 33.3 kg ha−1 a−1.
Increasing trends were found for mean annual Tot-N-, Tot-P-, NO3-N-, and PO4-P-concentrations, but not for NH4-N concentrations. Increasing loading trends were found for Tot-P, PO4-P, and NO3-N. No trend was found for DOC concentration or loading. However, the Sen slope value for DOC concentration was the only one having a negative value.
Pearson correlation analysis showed that mean annual precipitation correlated significantly with the concentration of Tot-N (r = 0.522, p = 0.022) and DOC (r = 0.744, p = 0.000), as well as with the loading of Tot-N (r = 0.718, p = 0.001), Tot-P (r = 0.584, p = 0.009), NH4-N (r = 0.661, p = 0.002), NO3-N (r = 0.608, p = 0.006), and DOC (r = 0.827, p < 0.0001).

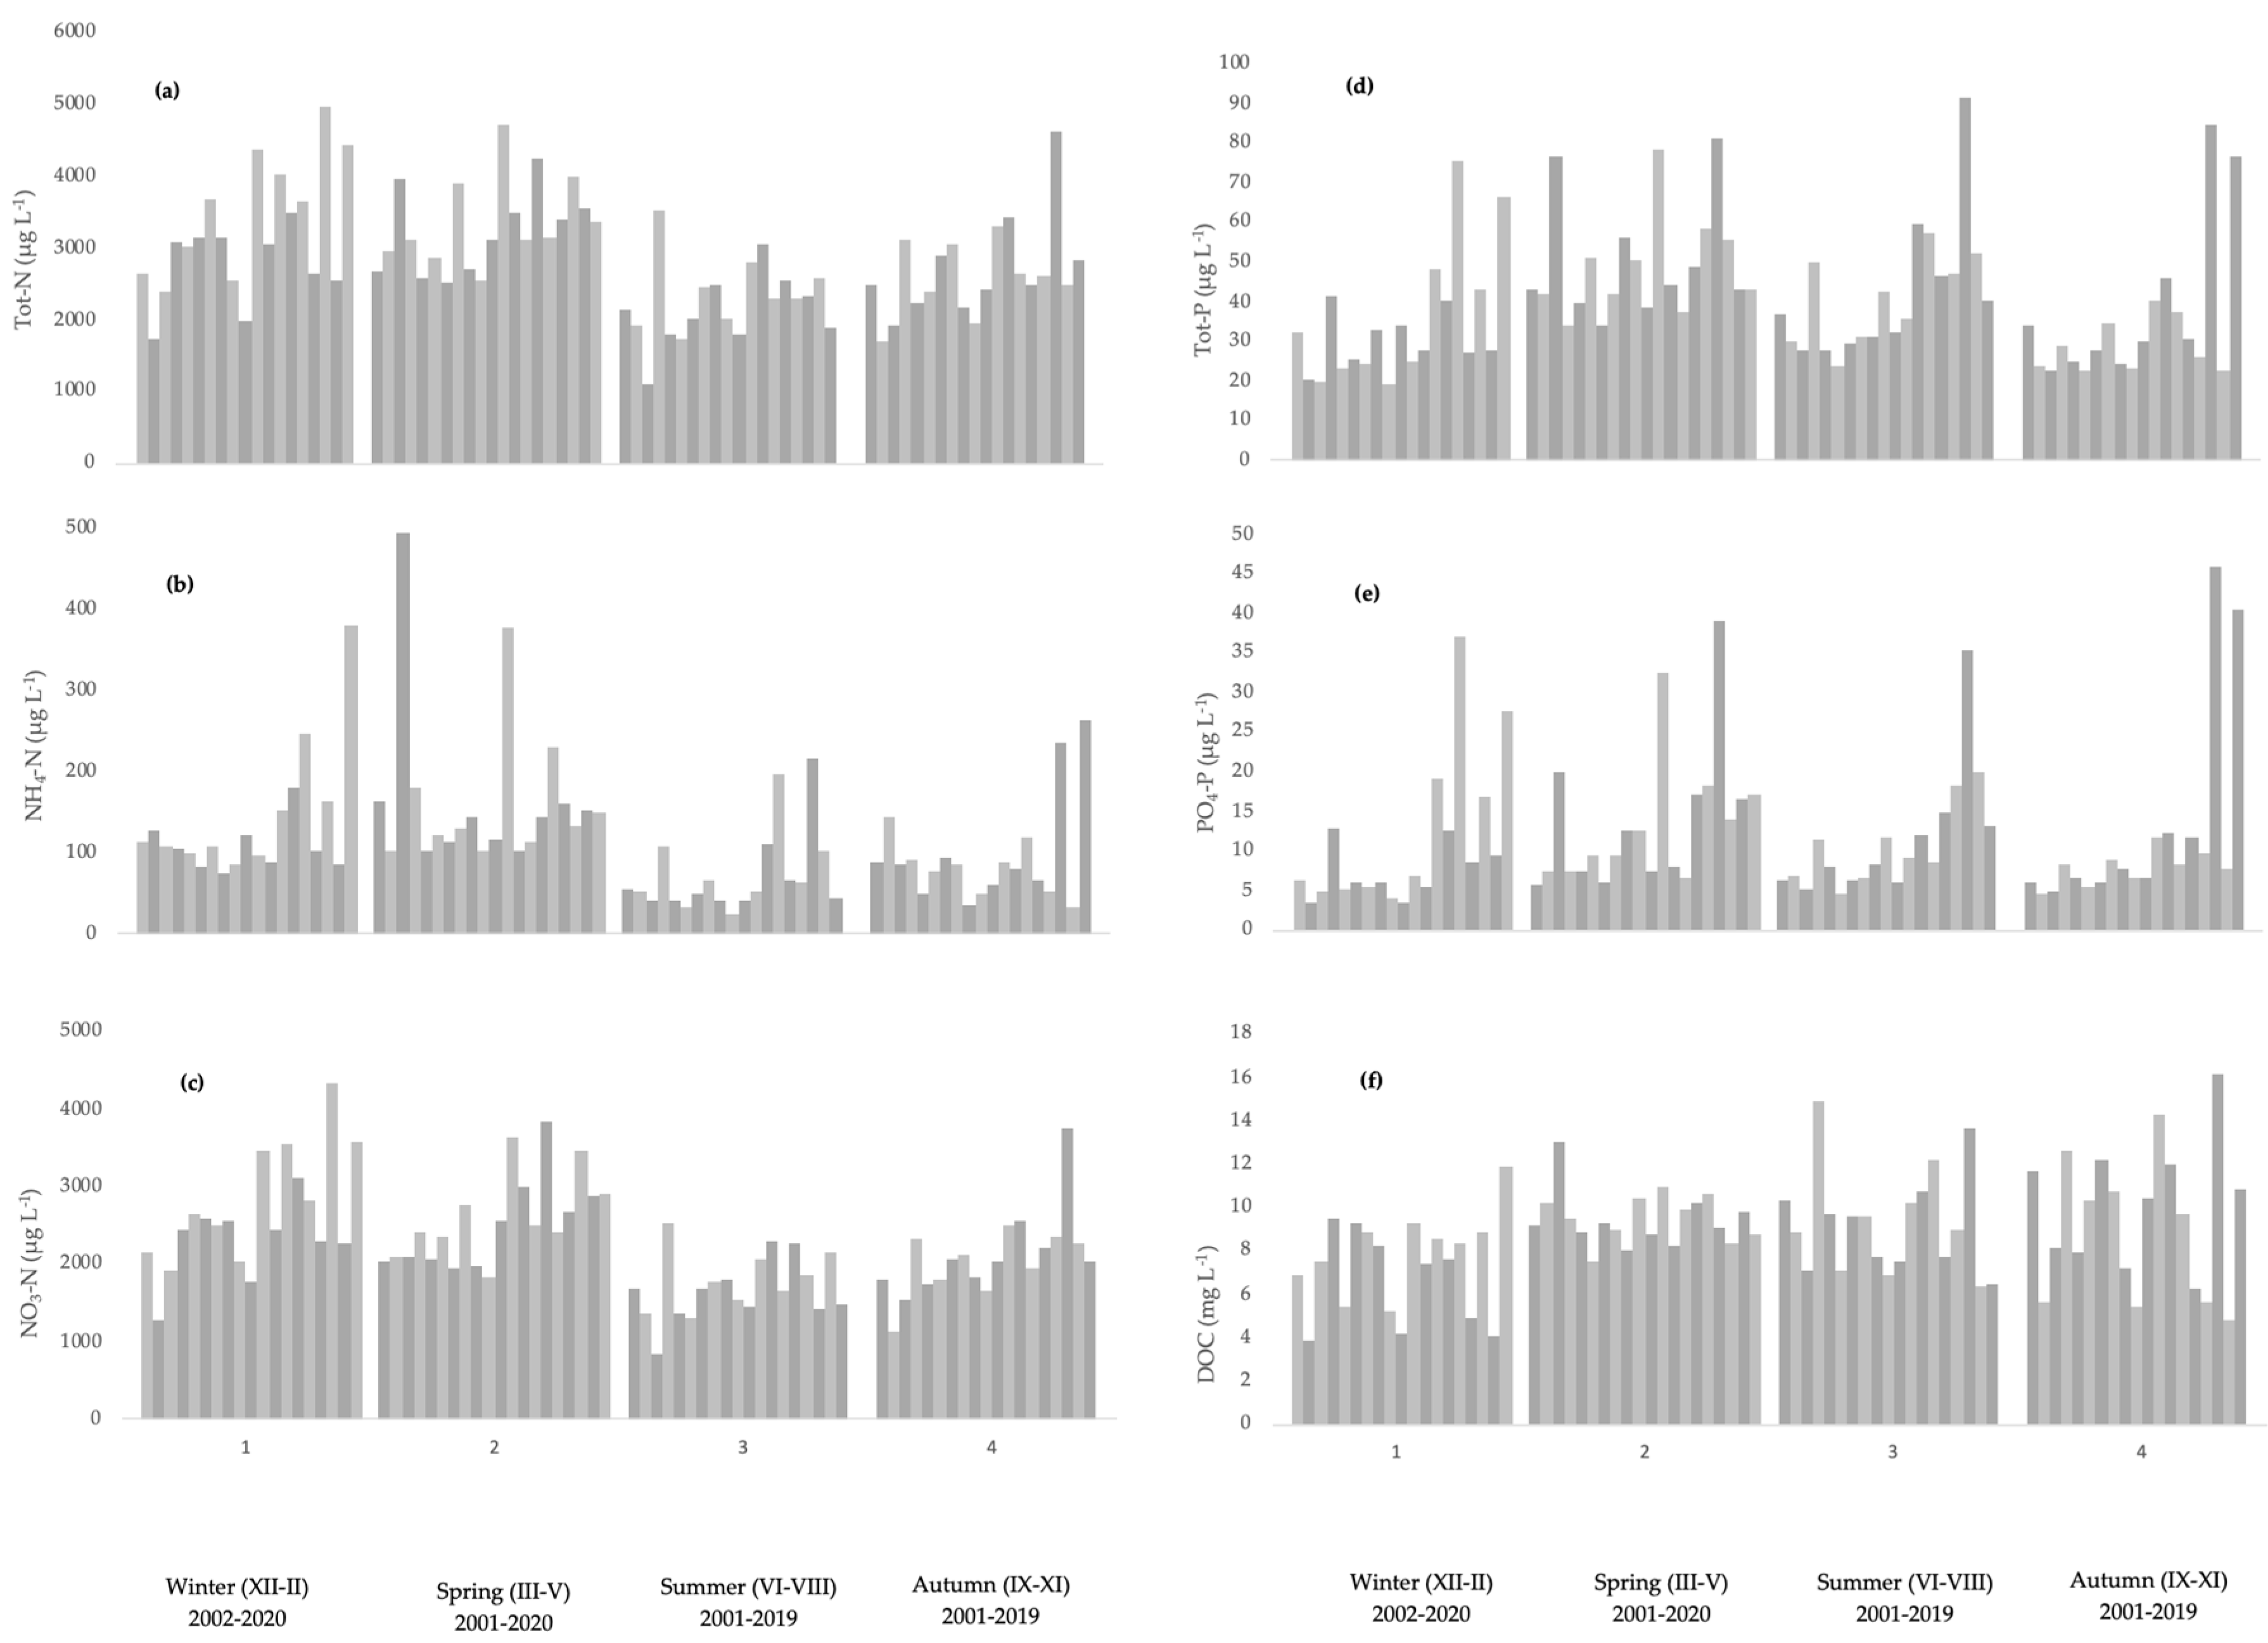
3.2. Seasonal Trends in Weather, Nutrient Concentrations, and Loading

The average winter (months XII–II) air temperature was −5.1 °C (± 2.8), with a minimum of −10.6 °C in 2010 and a maximum of 0.0 °C in 2020 (Figure 2). During other seasons, the average air temperature in spring (III–V) was 3.9 °C, in summer (VI–VIII) 15.6 °C, and in autumn (IX–XI) 5.2 °C. The average stream discharge was highest in spring (0.07 m3 s−1) and lowest in summer (0.03 m3 s−1) (Figure 2), and the average stream water temperature was 0.9, 4.2, 13.6, and 6.3 °C for winter, spring, summer, and autumn, respectively (Table S1). The mean precipitation in summer (2.3 mm day−1) was nearly twice the amount compared with spring (Table S1).
The highest Tot-N (3301 ± 615 µg L−1), Tot-P (49.8 ± 14.3 µg L−1), NH4-N (166 ± 99 µg L−1) and PO4-P (13.7 ± 8.9 µg L−1), ON (545 ± 242 µg L−1) and OP (35.2 ± 8.4 µg L−1) concentrations were measured in spring, whereas the highest NO3-N concentrations were measured in winter (2614 ± 729 µg L−1) and spring (2571 ± 580 µg L−1) (Figure 3, Table S1). In contrast, DOC concentrations were highest in autumn and in spring, with averages of 9.6 and 9.5 mg L−1, respectively (Figure 3, Table S1).
We did not find statistically significant trends in the seasonal weather data including average air and stream water temperature, precipitation, and stream discharge 2001–2020. However, in monthly data, March discharge values increased significantly (S = 0.002, p = 0.047). The stream water temperature had an indicative value for decreasing trend without statistical significance in spring (S = −0.067, p = 0.074).
Winter concentration of Tot-N increased during the study period, but during spring and autumn the increase was not statistically significant (Table 2). Tot-P concentration showed an increasing trend during winter and summer. NO3-N concentrations increased in winter, spring, and autumn, but PO4-P concentration increased during every season. NH4-N concentration did not show any trend. From organic fractions, only OP had an increasing trend in summer.
Winter Tot-N loading increased, and the elevation of Tot-P and NH4-N loading was close to statistical significance (Table 2). NO3-N loading had an increasing trend in winter, but springtime loading was only close to statistical significance. PO4-P loading increased during winter, spring, and summer. Wintertime increase in OP loading was evident, but no trend was found in DOC loading.
Most nutrient fractions were positively correlated with air temperature, precipitation, and discharge (Table S2). During spring, only discharge was positively correlated with NO3-N (r = 0.474, p = 0.035). Summertime nutrient concentrations and organic fractions were negatively correlated with air temperature, but only ON and DOC showed statistical significance (r = −0.458, p = 0.048, r = −0.535, p = 0.018, respectively). Increased summertime precipitation and discharge indicated mainly positive relationships with nutrients. In autumn, air temperature did not show any strong correlations with nutrients. However, increased autumn precipitation and stream discharge had a clear elevating effect on nutrient levels in Koiransuolenoja (Table S2).

3.3. Nutrient Retention of the Pond System

The two-year monitoring period showed clearly that precipitation peaks on a regular basis were followed by high water flow rates in Koiransuolenoja, with exceptions during the snow melt in spring (Figure 4). Water residence time in the pond system varied from hours to a few days. In the first year after construction of the pond system, mean annual water temperature and discharge were higher than in the second year, which resulted in higher delivery of total nutrients, suspended solids, NO3-N, and PO4-P (Table 3 and Table 4). The difference between the years was not as clear with ammonium load. During the first year, on average 4.8% of Tot-N load and 4.3% of Tot-P load stayed in the pond system. The next year, Tot-N retention was only 1.9%, but Tot-P retention increased, being on average 6.9%. Mean loss of suspended solids was 74 kg day−1 in 2013 with almost 40% of material sedimented in the pond system (in 2014, 33 kg day−1 and 25%, respectively). On a yearly basis, NO3-N retention was low (−0.1 and 1.0%), but retention of NH4-N was significantly higher (13.7 and 22.0%). Retention of PO4-P was 15.8% in the first year, but dropped to slightly negative during the second year.
In consecutive summers, water temperatures were equal, but discharge was slightly higher during the second summer. Tot-N transport was lower in summer than on a yearly basis and retention was higher. Summer retention of dissolved N compounds was clearly higher than the annual mean value (Figure 5). In summer, the loss of NO3-N was 6–8%, but leakage of nitrate from the pond system was obvious in the cold season. Transport of suspended solids was 0.15 kg day−1 ha−1 in 2013 and 0.24 kg day−1 ha−1 in 2014. Retention of suspended material decreased from 40% to 19% in consecutive summers.

4. Discussion

Despite only 20 years of data, we found a statistically significant increasing trend in discharge during March and transport of nutrients in the study area. Pearson correlation analysis revealed that especially wintertime nutrient and DOC concentrations were sensitive to changes in weather. According to the analysis, the increased NO3-N and PO4-P loading during winters can be explained by changes in precipitation, discharge, and daily temperature. The results confirmed that mean annual precipitation and discharge are important factors contributing nutrient concentrations and delivery into recipient waters. Should winter and spring temperatures rise as predicted in the northern latitudes, it would mean increased nutrient loading and the need for even more efficient water protection measures in agricultural watersheds.
It should be kept in mind that water quality of a small stream can be very sensitive to rain and storm events compared with larger rivers [31,32]. Generally, in small streams, even short-term storm events can propagate an increase in discharge and a consequent increase in loading. Therefore, a middling increase in discharge may cause a rather dramatic increase in loading, if the nutrient concentrations remain at high level. Moreover, mild winters with unpredictable liquid rain events can cause rapid and high variability in the wintertime water quality and discharge. Recently, new sensor-based continuous monitoring methods have been found to be even more beneficial and more reliable in loading assessment when compared with sporadic water sampling [33].
Agricultural practices have not changed during the study period, though they vary annually to some extent depending on cultivation history, situation on the market, and weather conditions. In our study, the annual mean Tot-N and Tot-P loads were similar or lower compared with other long-term data from small agricultural watersheds in Finland [34,35]. The increasing PO4-P concentration and loading in every season found in our data was a surprise. P fertilization in Finnish fields peaked in the 1980s, and it was estimated that the P content of the plough layer of fields had been doubled in the 1900s [36]. The increase of wintertime organic P and PO4-P loading may refer to wetter soil with less oxygen, which would add P solubility into pore water from soil particles [37]. The question is, are we still measuring the legacy P from the 1980s, or are the soil processes changing due to higher winter temperatures, liquid rain, and wetter unfrozen soil, or perhaps both? In the case of increased soil organic matter mineralization, NH4-N concentration would have likely also increased, which, however, was not found in this study; neither did we find any sign of elevated transport of dissolved organic compounds, which have been reported in several studies [38,39,40]. The issue of upward trend in long-term nutrient loading does need further investigation.
In recent decades, constructed wetlands and sedimentation ponds have been applied to remove excess nutrients and suspended solids from agricultural runoffs. Their nutrient removal efficiency has been highly variable [14,41,42,43], depending on the wetland surface area relative to the watershed area, as well as residence time of the water, which is dependent on the volume of the wetland relative to the runoff. In this study, the area of the sedimentation pond system was very small compared to most of the studied wetlands, but still our intensive data revealed clear retention of nutrients, especially in summertime, despite the leakage of nitrate in autumn and in winter when low temperatures slowed down the denitrification rate of sediment microbes [18]. Our results of P indicate that even a minor restoring effort of agricultural stream could decrease, at least periodically, P loading to recipient aquatic ecosystems. The sedimentation pond removed a substantial amount of suspended material, which is important, especially in the long-term, as agricultural catchments are sensitive to erosion and shallow shore areas will be filled up.
If major hydrological changes take place in the future with a higher proportion of annual runoff in winter, it will be challenging to the efficiency of constructed wetlands in the North, especially to remove N. The existing knowledge and the size recommendations (0.5–2% of the watershed area) for efficient wetlands for Finnish latitudes have been available [44], but their implementation in practice has been challenging [45]. In addition, weather-driven control in discharge and nutrient loss from arable fields has been recognized [30,46], thus the need for better economic support and construction policy for larger wetlands arises even more under the warming climate. In our study, the pond area corresponded only to 0.027% of the watershed area and removed a high percentage of particulate matter from the inflow to the lake. This is contradictory to the recommendations, and in this way the finding is novel. In addition, given the ownerships of Finnish agricultural land with their predominantly small and medium-sized fields, it may be unrealistic to assume that the farmers are willing to build larger sedimentation ponds and wetlands to reduce loading from agricultural fields, at least without sufficient economic compensation. Nevertheless, sedimentation ponds and smaller wetlands can provide ecosystem services under future climatic conditions and need to be included in the important management methods in reducing loading from boreal agricultural lands.
To fill the large data gap concerning the response of boreal and arctic environments to climate change, it has been emphasized to use frequent sampling conducted also during the periods after the plant senescence and before snowmelt [47]. Based on our frequent, year-round water sampling, nutrient transport has changed in the long run, as increasing trends in annual concentrations in the stream water were found for nitrate, phosphate, total phosphorus, and total nitrogen. No changes in annual air temperature or precipitation were found; however, we detected an increase in monthly discharge in March during the study period 2001–2020. Annually, nutrient loading has indeed increased for total phosphorus, phosphate, and nitrate. Seasonally, winter was the time we found elevated nutrient loading for most of the nutrient fractions, which suggests that wintertime nutrient loading from agricultural areas in Finland is increasing. Traditionally, wintertime nutrient loading has been low due to freezing of soil. Now, increasing wintertime loading might have unknown effects on the conditions in the receiving boreal waterbodies. For example, we do not know if P is sedimented before the spring bloom, or if the higher availability of NO3-N will result in increased emissions of greenhouse gas nitrous oxide N2O under cold conditions. Finally, we recommend the construction of smaller ponds and wetlands as well, as they decrease loading into recipient waters with their individual potential. We need to harness all the available retention potential into use to protect the shallow Finnish waters.

Supplementary Materials

The following are available online at https://www.mdpi.com/2073-4441/12/10/2731/s1. Table S1: Seasonal minimum, maximum, mean, and standard deviation in air and stream water temperature, precipitation, discharge, and nutrient concentrations 2001–2020, Table S2: Pearson correlation matrix for weather and nutrient concentrations during each season in the Koiransuolenoja stream 2001–2020.

Author Contributions

Conceptualization, L.A. and T.T.; methodology, L.A. and T.T.; formal analysis, S.U., T.T., J.H., and L.A.; investigation, S.U., T.T., and J.H.; writing—original draft preparation, S.U., T.T., J.H., and L.A.; writing—review and editing, S.U.; visualization, J.H.; supervision, L.A.; project administration, T.T. and L.A. All authors have read and agreed to the published version of the manuscript.

Funding

This research was funded by The Maj and Tor Nessling Foundation (grant numbers 2014397, 201500233, 201600261) and by The European Regional Development Fund (grant number A75357).

Acknowledgments

We want to thank Vanajavesikeskus for funding the construction of the Koiransuolenoja ponds. Special thanks goes to the laboratory and technical staff in the Lammi Biological Station and also Tuukka for the language revision. Open access funding provided by University of Helsinki.

Conflicts of Interest

The authors declare no conflict of interest. The funders had no role in the design of the study; in the collection, analyses, or interpretation of data; in the writing of the manuscript, or in the decision to publish the results.

References

  1. Puustinen, M.; Tattari, S.; Koskiaho, J.; Linjama, J. Influence of seasonal and annual hydrological variations on erosion and phosphorus transport from arable areas in Finland. Soil Tillage Res. 2007, 93, 44–55. [Google Scholar] [CrossRef]
  2. Ympäristö.fi. Available online: https://www.ymparisto.fi/fi-FI/Kartat_ja_tilastot/Vesistojen_kuormitus_ja_luonnon_huuhtouma (accessed on 18 June 2020).
  3. HELCOM. State of the Baltic Sea—Second HELCOM Holistic Assessment 2011–2016; Baltic Sea Environment Proceedings; HELCOM: Helsinki, Finland, 2018; p. 155. Available online: http://stateofthebalticsea.helcom.fi/wp-content/uploads/2018/07/HELCOM_State-of-the-Baltic-Sea_Second-HELCOM-holistic-assessment-2011-2016.pdf (accessed on 25 September 2020).
  4. Dore, M.H.I. Climate change and changes in global precipitation patterns: What do we know? Environ. Int. 2005, 31, 1167–1181. [Google Scholar] [CrossRef] [PubMed]
  5. Falloon, B.; Betts, R. Climate impacts on European agriculture and water management in the context of adaptation and mitigation—The importance of an integrated approach. Sci. Total Environ. 2010, 408, 5667–5687. [Google Scholar] [CrossRef]
  6. Mikkonen, S.; Laine, M.; Mäkelä, H.; Gregow, H.; Tuomenvirta, H.; Lahtinen, M.; Laaksonen, A. Trends in the average temperature in Finland, 1847–2013. Stoch. Environ. Res. Risk Assess. 2015, 29, 1521–1529. [Google Scholar] [CrossRef] [Green Version]
  7. Ruosteenoja, K.; Jylhä, K.; Kämäräinen, M. Climate Projections for Finland Under the RCP Forcing Scenarios. Geophysica 2016, 51, 17–50. [Google Scholar]
  8. Veijalainen, N.; Lotsari, E.; Alho, P.; Vehviläinen, B.; Käyhkö, J. National scale assessment of climate change impacts on flooding in Finland. J. Hydrol. 2010, 391, 333–350. [Google Scholar] [CrossRef]
  9. Luomaranta, A.; Aalto, J.; Jylhä, K. Snow cover trends in Finland over 1961–2014 based on gridded snow depth observations. Int. J. Climatol. 2019, 39, 3147–3159. [Google Scholar] [CrossRef] [Green Version]
  10. Mattsson, T.; Kortelainen, P.; Räike, A. Export of DOM from boreal catchments: Impacts of land use cover and climate. Biogeochemistry 2005, 76, 373–394. [Google Scholar] [CrossRef]
  11. Hildén, M.; Huhtala, A.; Koikkalainen, K.; Ojanen, M.; Grönroos, J.; Helin, J.; Isolahti, M.; Kaljonen, M.; Kangas, A.; Känkänen, H.; et al. Verotukseen Perustuva Ohjaus Maatalouden Ravinnepäästöjen Rajoittamisessa; Ympäristöministeriön raportteja 15; Ympäristöministeriö: Helsinki, Finland, 2007; pp. 1–72. (In Finnish) [Google Scholar]
  12. Mitikka, S. (Ed.) Nitraattidirektiivin täytäntöönpano Suomessa Raportointijakso 2012–2015; Suomen ympäristökeskuksen raportteja 1; Suomen ympäristökeskus: Helsinki, Finland, 2017; pp. 1–71. (In Finnish) [Google Scholar]
  13. Saunders, D.L.; Kalff, J. Nitrogen retention in wetlands, lakes and rivers. Hydrobiology 2001, 443, 205–212. [Google Scholar] [CrossRef]
  14. Vymazal, J. The Use of Constructed Wetlands for Nitrogen Removal from Agricultural Drainage: A Review. Sci. Agric. Bohem. 2017, 48, 82–91. [Google Scholar] [CrossRef] [Green Version]
  15. Mitsch, W.J.; Gosselink, J.G. Wetlands, 5th ed.; John Wiley & Sons, Inc.: Hoboken, NJ, USA, 2015. [Google Scholar]
  16. Dawson, R.W.; Murphy, K.L. The temperature dependency of biological denitrification. Water Res. 1972, 6, 71–83. [Google Scholar] [CrossRef]
  17. Song, K.; Hernandez, M.E.; Batson, J.A.; Mitsch, W.J. Long-term denitrification rates in created riverine wetlands and their relationship with environmental factors. Ecol. Eng. 2014, 72, 40–46. [Google Scholar] [CrossRef]
  18. Uusheimo, S.; Tulonen, T.; Aalto, S.L.; Arvola, L. Mitigating agricultural nitrogen load with constructed ponds in northern latitudes: A field study on sedimental denitrification rates. Agric. Ecosyst. Environ. 2018, 261, 71–79. [Google Scholar] [CrossRef] [Green Version]
  19. Fink, D.F.; Mitsch, W.J. Seasonal and Storm Event Nutrient Removal by a Created Wetland in an Agricultural Watershed. Ecol. Eng. 2004, 23, 313–325. [Google Scholar] [CrossRef]
  20. Rücker, K.; Schrautzer, J. Nutrient retention function of a stream wetland complex–A high-frequency monitoring approach. Ecol. Eng. 2010, 36, 612–622. [Google Scholar] [CrossRef]
  21. Valkama, P.; Mäkinen, E.; Ojala, A.; Vahtera, H.; Lahti, K.; Rantakokko, K.; Vasander, H.; Nikinmaa, E.; Wahlroos, O. Seasonal variation in nutrient removal efficiency of a boreal wetland detected by high-frequency on-line monitoring. Ecol. Eng. 2017, 98, 307–317. [Google Scholar] [CrossRef]
  22. Wahlroos, O.; Valkama, P.; Mäkinen, E.; Ojala, A.; Vasander, H.; Väänänen, V.M.; Halonen, A.; Lindén, L.; Nummi, P.; Ahponen, H.; et al. Urban wetland parks in Finland: Improving water quality and creating endangered habitats. Int. J. Biodivers. Sci. Ecosyst. Serv. Manag. 2015, 11, 46–60. [Google Scholar] [CrossRef]
  23. Ruoho-Airola, T.; Hatakka, T.; Kyllönen, K.; Makkonen, U.; Porvari, P. Temporal trends in the bulk deposition and atmospheric concentration of acidifying compounds and trace elements in the Finnish Integrated Monitoring catchment Valkea-Kotinen during 1988–2011. Boreal Environ. Res. 2014, 19, 31–46. [Google Scholar]
  24. Van Meter, K.J.; Basu, N.B.; Veenstra, J.J.; Burras, C.L. The nitrogen legacy: Emerging evidence of nitrogen accumulation in anthropogenic landscapes. Environ. Res. Lett. 2016, 11, 1–12. [Google Scholar] [CrossRef]
  25. Nieminen, M.; Sarkkola, S.; Hellsten, S.; Marttila, H.; Piirainen, S.; Sallantaus, T.; Lepistö, A. Increasing and Decreasing Nitrogen and Phosphorus Trends in Runoff from Drained Peatland Forests—Is There a Legacy Effect of Drainage or Not? Water Air Soil Pollut. 2018, 229. [Google Scholar] [CrossRef]
  26. Ekholm, P.; Rankinen, K.; Rita, H.; Räike, A.; Sjöblom, H.; Raateland, A.; Vesikko, L.; Bernal, J.E.C.; Taskinen, A. Phosphorus and nitrogen fluxes carried by 21 Finnish agricultural rivers in 1985–2006. Environ. Monit. Assess. 2015, 187. [Google Scholar] [CrossRef] [PubMed]
  27. Räike, A.; Taskinen, A.; Knuuttila, S. Nutrient export from Finnish rivers into the Baltic Sea has not decreased despite water protection measures. AMBIO 2019, 49, 460–474. [Google Scholar] [CrossRef] [PubMed] [Green Version]
  28. Castaldelli, G.; Soana, E.; Racchetti, E.; Vincenzi, F.; Fano, E.A.; Bartoli, M. Vegetated canals mitigate nitrogen surplus in agricultural watersheds. Agric. Ecosyst. Environ. 2015, 212, 253–262. [Google Scholar] [CrossRef]
  29. Arvola, L.; Einola, E.; Järvinen, M. Landscape properties and precipitation as determinants for high summer nitrogen load from boreal catchments. Landsc. Ecol. 2015, 30, 429–442. [Google Scholar] [CrossRef]
  30. Tikkanen, M.; Seppälä, M.; Heikkinen, O. Environmental properties and material transport of two rivulets in Lammi southern Finland. Fennia 1985, 163, 217–282. [Google Scholar]
  31. Uusheimo, S.; Tulonen, T.; Arvola, L.; Arola, H.; Linjama, J.; Huttula, T. Organic carbon causes interference with nitrate and nitrite measurements by UV/Vis spectrometers: The importance of local calibration. Environ. Monit. Assess. 2017, 189. [Google Scholar] [CrossRef] [PubMed]
  32. Linjama, J.; Puustinen, M.; Koskiaho, J.; Tattari, S.; Kotilainen, H.; Granlund, K. Implementation of automatic sensors for continuous monitoring of runoff quantity and quality in small catchments. Agric. Food Sci. 2009, 18, 417–427. [Google Scholar] [CrossRef]
  33. Koskiaho, J.; Lepistö, A.; Tattari, S. On-line measurements provide more accurate estimates of nutrient loading: A case of the Yläneenjoki river basin, southwest Finland. Water Sci. Tech. 2010, 62, 115–122. [Google Scholar] [CrossRef]
  34. Tattari, S.; Koskiaho, J.; Kosunen, M.; Lepistö, A.; Linjama, J.; Puustinen, M. Nutrient loads from agricultural and forested areas in Finland from 1981 up to 2010—Can the efficiency of undertaken water protection measures seen? Environ. Monit. Assess. 2017, 189. [Google Scholar] [CrossRef] [Green Version]
  35. Stålnacke, P.; Aakerøy, P.A.; Blicher-Mathiesen, G.; Iital, A.; Jansons, V.; Koskiaho, J.; Kyllmar, K.; Lagzdins, A.; Pengerud, A.; Povilaitis, A. Temporal trends in nitrogen concentrations and losses from agricultural catchments in the Nordic and Baltic countries. Agric. Ecosyst. Environ. 2014, 198, 94–103. [Google Scholar] [CrossRef]
  36. Saarela, I. Phosphorus in Finnish soils in the 1900s with particular reference to the ammonium acetate soil test. Agric. Food Sci. Finl. 2002, 11, 257–271. [Google Scholar] [CrossRef] [Green Version]
  37. Uusitalo, R.; Närvänen, A.; Rasa, K.; Salo, T.; Koskiaho, J.; Puustinen, M.; Brax, A.; Erkkilä, E.; Vilhunen, S.; Joki-Heiskala, P.; et al. Active Wetlands–the Use of Chemical Amendments to Intercept Phosphate Runoffs in Agricultural Catchments; Final Report of the Active Wetlands Interreg IVA Project, MTT Report 92; MTT: Jokioinen, Finland, 2013; pp. 1–54. [Google Scholar]
  38. Finstad, A.G.; Andersen, T.; Larsen, S.; Tominaga, K.; Blumentrath, S.; de Wit, H.A.; Tømmervik, H.; Hessen, D.A. From greening to browning: Catchment vegetation development and reduced S-deposition promote organic carbon load on decadal time scales in Nordic lakes. Nat. Sci. Rep. 2016, 6. [Google Scholar] [CrossRef] [PubMed] [Green Version]
  39. Garmo, Ø.A.; Skjelkvåle, B.L.; de Wit, H.A.; Colombo, L.; Curtis, C.; Fölster, J.; Hoffmann, A.; Hruška, J.; Høgåsen, T.; Jeffries, D.S.; et al. Trends in surface water chemistry in acidified areas in Europe and North America from 1990 to 2008. Water Air Soil Pollut. 2014, 225, 1880. [Google Scholar] [CrossRef] [Green Version]
  40. Monteith, D.T.; Stoddard, J.L.; Evans, C.D.; de Wit, H.A.; Forsius, M.; Høgåsen, T.; Wilander, A.; Skjelkvåle, B.L.; Jeffries, D.S.; Vuorenmaa, J.; et al. Dissolved organic carbon trends resulting from changes in atmospheric deposition chemistry. Nat. Lett. 2007, 450. [Google Scholar] [CrossRef] [PubMed]
  41. Strand, J.A.; Weisner, S.E.B. Effects of wetland construction on nitrogen transport and species richness in the agricultural landscape—Experiences from Sweden. Ecol. Eng. 2013, 56, 14–25. [Google Scholar] [CrossRef]
  42. Koskiaho, J. Retention Performance and Hydraulic Design of Constructed Wetlands Treating Runoff from Arable Land. Ph.D. Thesis, University of Oulu, Oulu, Finland, 2006. [Google Scholar]
  43. Braskerud, B.C. Factors affecting nitrogen retention in small constructed wetlands treating agricultural non-point source pollution. Ecol. Eng. 2002, 18, 351–370. [Google Scholar] [CrossRef]
  44. Puustinen, M.; Koskiaho, J.; Jormola, J.; Järvenpää, L.; Karhunen, A.; Mikkola-Roos, M.; Pitkänen, J.; Riihimäki, J.; Svensberg, M.; Vikberg, P. Maatalouden Monivaikutteisten Kosteikkojen Suunnittelu Ja Mitoitus; Suomen ympäristö: Vammala, Finland, 2007; p. 21. ISBN 978-952-11-2720-5. [Google Scholar]
  45. Berninger, K.; Koskiaho, J.; Tattari, S. Constructed wetlands in Finnish agricultural environments: Balancing between effective water protection, multi-functionality and socio-economy. J. Water Land Dev. 2012, 17, 19–29. [Google Scholar] [CrossRef]
  46. Vuorenmaa, J.; Rekolainen, S.; Lepistö, A.; Kenttämies, K.; Kauppila, P. Losses of nitrogen and phosphorus from agricultural and forest areas in Finland during the 1980s and 1990s. Environ. Monit. Assess. 2002, 76, 213–248. [Google Scholar] [CrossRef]
  47. Shogren, A.J.; Zarnetske, J.P.; Abbott, B.W.; Iannucci, F.; Bowden, W.B. We cannot shrug off the shoulder seasons: Addressing knowledge and data gaps in an Arctic headwater. Environ. Res. Lett. 2020, 15, 104027. [Google Scholar] [CrossRef]
Figure 1. Koiransuolenoja watershed, land cover, and weather station (air temperature, precipitation, and snow depth), sampling sites K1 and K2, and the study ponds between them.
Water 12 02731 g001
Figure 2. Average seasonal air temperature (dotted line) and Koiransuolenoja stream discharge (columns) for each year during (a) winter (2001–2020), (b) spring (2001–2020), (c) summer (2001–2019), and (d) autumn (2001–2019).
Water 12 02731 g002
Figure 3. Average seasonal (a) Tot-N-, (b) NH4-N-, (c) NO3-N-, (d) Tot-P-, (e) PO4-P-, (f) DOC-concentrations in the Koiransuolenoja stream between 2001 and 2020 (even years with light gray, odd years with dark gray). XII–II = December–February, III–V = March–May, VI–VIII = June–August, IX–XI = September–November.
Water 12 02731 g003
Figure 4. Koiransuolenoja stream discharge (black line) and precipitation (columns, light grey) from January 2013 to June 2015.
Water 12 02731 g004
Figure 5. NO3-N loading (blue line) from the Koiransuolenoja stream watershed, as well as NO3-N retention (positive) or release (negative) (red columns) in the constructed pond system from April 2013 to April 2015.
Water 12 02731 g005
Table 1. Mann–Kendall trend test result for mean annual weather conditions, nutrient concentrations and nutrient loading 2001–2019. Statistically significant results (<0.05) in bold. Positive Sen slope indicates increasing values and negative slope indicates decreasing values.
Variablep-ValueSen´s Slope
Stream water temperature (°C)0.783−0.003
Air temperature (°C)0.0580.061
Stream discharge (m3 s−1)0.4890.000
Precipitation (mm)1.000−0.233
Mean snow (cm)0.456−0.369
Max. snow (cm)0.454−0.563
Tot-N (µg L−1)0.00842.574
Tot-P (µg L−1)0.0011.030
NO3-N (µg L−1)0.00153.458
NH4-N (µg L−1)0.2982.124
PO4-P (µg L−1)<0.00010.712
DOC (µg L−1)0.836−0.013
Tot-N (kg ha−1 a−1)0.1640.130
Tot-P (kg ha−1 a−1)0.0130.002
NO3-N (kg ha−1 a−1)0.0410.129
NH4-N (kg ha−1 a−1)0.2380.006
PO4-P (kg ha−1 a−1)0.0010.002
DOC (kg C ha−1 a−1)0.8360.068
Table 2. Mann–Kendall trend test results for Tot-N-, Tot-P-, NO3-N-, NH4-N-, PO4-P-, ON-, OP-, and DOC concentrations and loadings in Koiransuolenoja during each season 2001–2020. Statistically significant p-values (<0.05) written in bold.
SeasonConcentrationp-ValueSen’s SlopeLoadingp-ValueSen’s Slope
WinterTot-N (µg L−1)0.03475.889(kg day−1)0.0490.724
Spring 0.05543.370 0.2880.207
Summer 0.18629.148 0.783−0.032
Autumn 0.05846.397 0.5340.246
WinterTot-P (µg L−1)0.0131.098(kg day−1)0.0580.010
Spring 0.3190.426 0.5860.003
Summer 0.0021.231 0.3320.003
Autumn 0.0930.650 0.2980.004
WinterNO3-N (µg L−1)0.03472.238(kg day−1)0.0410.646
Spring 0.00752.495 0.0550.312
Summer 0.21123.436 0.945−0.026
Autumn 0.00547.508 0.4470.229
WinterNH4-N (µg L−1)0.2982.427(kg day−1)0.0580.037
Spring 0.5011.040 0.9240.003
Summer 0.1721.757 0.5340.003
Autumn 0.836−0.341 0.7300.008
WinterPO4-P (µg L−1)0.0080.442(kg day−1)0.0160.003
Spring 0.0100.607 0.0400.003
Summer 0.0000.621 0.0340.002
Autumn 0.0010.440 0.0680.002
WinterON (µg L−1)0.679−3.476(kg day−1)0.4890.051
Spring 0.319−7.112 0.677−0.021
Summer 0.945−0.993 0.581−0.012
Autumn 0.401−12.183 0.890−0.010
WinterOP (µg L−1)0.0930.498(kg day−1)0.0490.006
Spring 0.631−0.123 0.9740.000
Summer 0.0130.731 0.5810.001
Autumn 0.3630.400 0.4470.002
WinterDOC (mg L−1)0.7830.053(kg day−1)0.3321.154
Spring 0.773−0.020 0.924−0.081
Summer 0.575−0.052 0.489−0.320
Autumn 0.783−0.075 1.0000.208
Table 3. Mean total (March–November) and summer (May–September) stream water temperature, discharge, nutrient load, and retention in the Koiransuolenoja sedimentation pond system.
Variable Unit 1. Year2. YearSummer 2013Summer 2014
Water temperature °C 7.95.613.413.6
Stream discharge m3 s−10.0730.0630.0330.041
Tot-Ng ha−1 day−141.431.213.513.7
retention %4.81.98.64.6
NO3-Ng ha−1 day−134.326.610.29.2
retention %−0.11.86.38.2
NH4-Ng ha−1 day−11.41.30.71.2
retention %13.722.014.126.4
Tot-Pg h−1 day−10.770.420.340.46
retention %4.36.93.94.2
PO4-Pg ha−1 day−10.200.110.070.06
retention %15.8−0.118.1−2.4
Table 4. Mean total and summer (May–September) loading and retention of suspended solids in the Koiransuolenoja stream sedimentation pond system in 2013 and 2014.
Variable 20132014
YearSummerYearSummer
Load kg ha−1 day−10.330.150.170.24
Retention kg day−174483328
Retention %39402519

