Article

The Role of Sewer Network Structure on the Occurrence and Magnitude of Combined Sewer Overflows (CSOs)

1
Institute for Urban Water Management, Department of Hydrosciences, TU Dresden, 01069 Dresden, Germany
2
Transmission and Distribution Unit, Guma Valley Water Company, Freetown 47235, Sierra Leone
*
Author to whom correspondence should be addressed.
Water 2020, 12(10), 2675; https://doi.org/10.3390/w12102675
Submission received: 19 August 2020 / Revised: 10 September 2020 / Accepted: 22 September 2020 / Published: 24 September 2020
(This article belongs to the Section Urban Water Management)

Abstract

:
Combined sewer overflows (CSOs) prevent surges in sewer networks by releasing untreated wastewater into nearby water bodies during intense storm events. CSOs can have acute and detrimental impacts on the environment and thus need to be managed. Although several gray, green and hybrid CSO mitigation measures have been studied, the influence of network structure on CSO occurrence is not yet systematically evaluated. This study focuses on evaluating how the variation of urban drainage network structure affects the frequency and magnitude of CSO events. As a study case, a sewer subnetwork in Dresden, Germany, where 11 CSOs are present, was selected. Scenarios corresponding to the structures with the lowest and with the highest number of possible connected pipes, are developed and evaluated using long-term hydrodynamic simulation. Results indicate that more meshed structures are associated to a decrease on the occurrence and magnitude of CSO. Event frequency reductions vary between 0% and 68%, while reduction of annual mean volumes and annual mean loads ranged between 0% and 87% and 0% and 92%. These rates were mainly related to the additional sewer storage capacity provided in the more meshed scenarios, following a sigmoidal behavior. However, increasing network connections causes investment costs, therefore optimization strategies for selecting intervention areas are needed. Furthermore, the present approach of reducing CSO frequency may provide a new gray solution that can be integrated in the development of hybrid mitigation strategies for the CSO management.

1. Introduction

Urbanization processes have led to an increase in the percentage of impervious areas, and therefore to an increase in the runoff volumes generated during rainfall events. Stormwater is collected and conveyed to a defined outlet, e.g., a wastewater treatment plant, through the urban drainage network (UDN). Separate sewer systems collect stormwater independently from sanitary wastewater and then discharge into nearby water bodies. In combined sewer systems, sewage and stormwater are mixed and transported towards a wastewater treatment plant. In this combined scheme, discharges of untreated wastewater can occur when the capacity of the network is exceeded, mainly due to large stormwater runoff volumes entering the system caused by intense precipitation events. Untreated wastewater is then released into nearby surface waterbodies to avoid surcharge of the network or an overload of the wastewater treatment plant, through relief structures referred as combined sewer overflows (CSOs) [1]. Their dimensioning and functioning depend not only on the connected upstream areas, but also on the characteristics of the UDN and the properties of the receiving water bodies.
Discharges from CSOs are a mixture of sanitary sewage and stormwater runoff, thus they contain various pollutants. Studies have reported the presence of solids, organic compounds, fecal contaminants, nutrients and heavy metals [2,3,4,5], as well as micropollutants [6,7,8,9,10,11]. The emission of such contaminants into receiving water bodies can cause adverse impacts in receiving water bodies, such as dissolved oxygen depletion, eutrophication, increase of toxics, sediments and pathogens [1,12,13,14,15,16,17].
Hence, management strategies need to control and limit the severe, predominantly acute impacts of CSO discharges on the environment. Traditionally, solutions focus on the implementation of grey infrastructures, mainly storage tanks, with the aim of improving or increasing the system’s capacity [18]. Although this type of infrastructures effectively control CSOs [19,20], research suggests that these strategies are less efficient and tend to be more costly than runoff reduction and management at the source, i.e., green solutions [21,22]. Recent results imply that hybrid strategies, i.e., combined solutions with green retrofits and grey rehabilitations, are more sustainable [23].
Although research extensively reflected the complex dynamic processes leading to CSO occurrence and the potential solution strategies [1], there is little understanding on the role that the structure (i.e., physical arrangement) of the network plays on the frequency of such events. In this context, the present research evaluates the variation of urban drainage system structure on the occurrence of CSO events, using a subnetwork of the city of Dresden, Germany as study case. The structure of a network is determined based on the meshness coefficient proposed by Reyes-Silva et al. [24]. In this approach, urban drainage networks are interpreted as graphs (G = (E,V)), where the edges (E) correspond to pipe sections, while the nodes (V) are the junctions between them, usually representing manholes. Meshness is determined based on the degree of connectivity of the inner nodes, i.e., the number of pipes connected to those junctions which are not source or outlet nodes. Meshness can vary between 0%, i.e., the UDN layout with the least number of pipes without causing any disconnection, and 100%, corresponding to the network configuration with the maximum number of connected pipes per inner node. In this context, the present study focuses on how different Meshness degrees of an urban drainage network affect the occurrence and magnitude of CSO events. Long-term hydrodynamic simulations provide information regarding CSO emission dynamics, and performance indicators are used to evaluate and compare the different meshness degree scenarios.

2. Materials and Methods
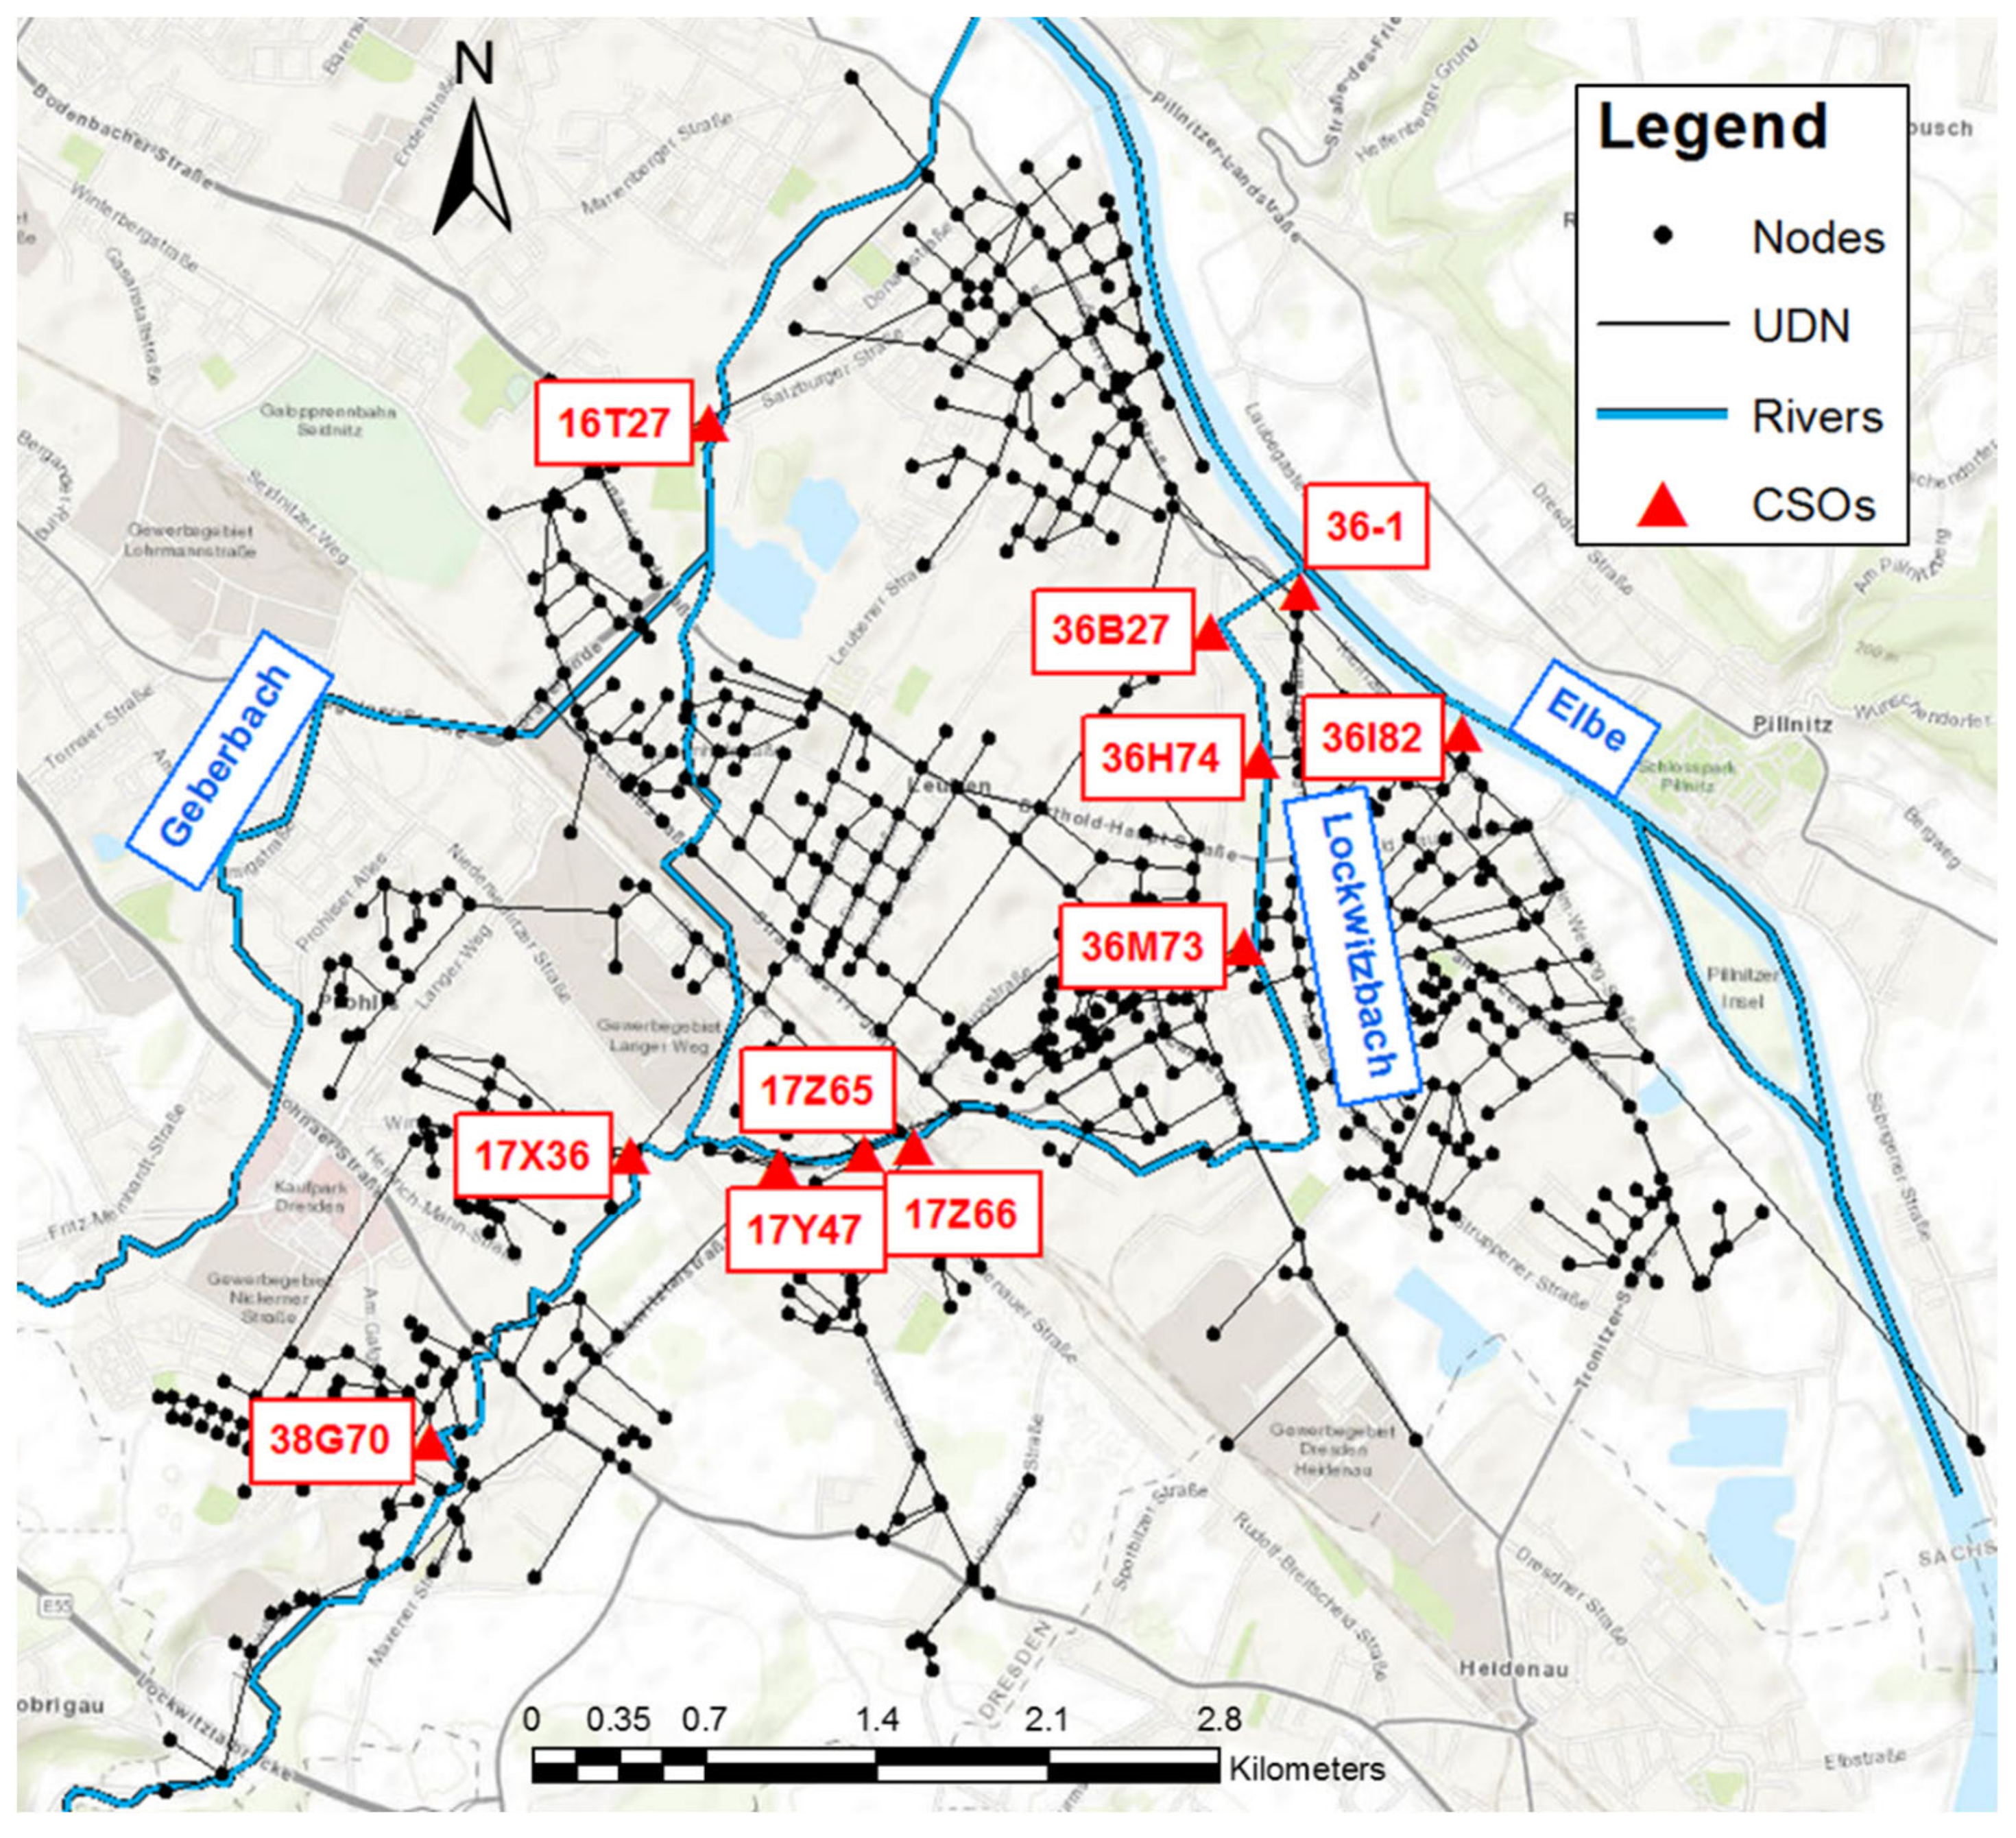
2.1. Case Study

A subnetwork from the Dresden UDN, in Germany with several CSO structures is selected, it allows to analyze the behavior of such elements under varying boundary conditions. Furthermore, waterbodies in the area have been reported to be strongly affected by urban wet weather discharges [25]. As can be seen in Figure 1, there are 11 CSOs in the area, which discharge into two small urban rivers, Geberbach and Lockwitzbach, or into the river Elbe. Information regarding the properties of each analyzed CSO-catchment can be found in Table 1. Connected areas vary approximately between 2 to 620 Ha, with imperviousness ranging between 34% and 46%. The structure of the sewer systems in each CSO catchment is determined based on the meshness coefficient proposed by Reyes-Silva et al. [24]. This parameter ranges between 0% and 100%, indicating a network structure with the minimum or maximum possible number connected pipes per node. Results indicate that the subnetworks connected to each CSO have a mainly branched or predominantly branched structure, i.e., meshness values between 0% and 34%. Meshness is directly related to the presence of multiple flow pathways. The specific sewer storage capacity per connected impervious area (St-IA) is calculated for each CSO-catchment, it promotes better understanding the relationship between meshness and storage volume. Higher meshness values are associated to higher storage capacities in the systems, due to the volume of additional pipes, and therefore to higher St-IA rates. A graphic relationship of this positive trend can be seen in Figure A1 in Appendix A.

2.2. Scenario Construction

Different meshness degrees scenarios for each CSO-catchment are developed. Besides the reference conditions, other two scenarios are analyzed, one corresponding to the structures with the lowest and one with the highest meshness possible. On the one hand, the lowest meshness scenario is obtained by determining the minimum spanning tree (MST) configuration of each network. This corresponds to a subset of the original network layout where all the nodes are connected without any redundant connections, thus representing the 0% meshness scenario, as stated by Reyes-Silva et al. [24]. Such layout and its elements are identified using Kruskal’s algorithm [26]. On the other hand, although theoretically a network configuration of 100% meshness can exist, it might not represent a realistic layout due to spatial restrictions, e.g., presence of rivers or large vegetated areas through which a pipe sections cannot be build. Therefore, the highest meshness that can be achieved in each CSO-catchment is case specific and needs to be determined. This is done according to the following iterative process:
  • Determine the inner nodes (i.e., nodes which are not source or outlet junctions) where further connections can be made. These correspond to junctions with a number of connected pipes sections lower than 4, assumed as the maximum possible.
  • Identify which of the inner nodes can be connected among them based on a defined distance threshold. In other words, determine if two inner nodes are close enough to create a new link. In this study, the maximum pipe length in the system (400 m) is used as the distance threshold.
  • Randomly select a pair of inner nodes that can be connected and add a new link to the network. Direction of the link is done based on the invert elevation of each node, i.e., the starting node is the one with the highest elevation and end node is the one with the lowest. This is done in order to ensure flow by gravity as it is the typical condition in sewer systems.
  • Update the number of connections for the inner nodes.
  • Repeat steps I through IV until no more possible connections among inner nodes can be identified.
  • Calculate final meshness.
Due to the different boundary conditions among the analyzed CSO-catchments, maximum meshness degrees are different for each case. A summary of these results can be seen in Table 2. In most cases, the obtained scenarios cover a relatively wide range of meshness, i.e., more than 25%, hence allowing to analyze the impacts of structural changes on the occurrence of CSO events. The only exceptions are the networks upstream of CSOs 17X36 and 17Z66. In the first case, only a small range of meshness (less than 15%) is obtained due to spatial constrains. Furthermore, since the contributing area and the connected network for the CSO 17Z66 are small, it is not possible to create different scenarios for it.

2.3. Hydrodynamic Simulations and CSO Characteristics

Hydrodynamic simulations of urban areas and UDNs can represent the complex dynamics of the processes leading to CSO events and provide a reliable estimation of their behavior and magnitude. In this context, a hydrodynamic model of the study area is developed and implemented in the EPA Stormwater Management Model (SWMM) [27]. Information regarding the sewer network structure and its hydraulic properties is provided by the local wastewater company Stadtentwässerung Dresden GmbH (Dresden, Germany). Subcatchments are delineated with the automatic subcatchments generator tool GisToSWMM [28]. Surface cover type is obtained from the European Settlement Map of the Copernicus Project [29] and reclassified to match the categories needed to run the GisToSWMM tool. Furthermore, a 2 × 2 m digital elevation model (DEM), obtained from the state service for geoinformation and geodesy Saxony (Staatsbetrieb Geobasisinformation und Vermessung Sachsen [GeoSN]), is used. In order to simplify the model, only the subcatchments corresponding to connected areas are considered. Their surfaces are aggregated based on land use type.
Distribution of dry weather inflows along the network is determined according to a 100 by 100 m population density raster, obtained from the last census in Germany [30]. The nearest sewer node for each grid cell is determined by selecting the node for which the Euclidean distance among the centroid of the grid cell and network nodes is minimum. This is done only for those population grid cells within a 150 m radius from the sewer network, under the assumption that this is the maximum possible length for a household sewer connection. Based on this spatial analysis, it is possible to estimate the number of people connected to each node of the network. This information is used to calculate mean flows at each node, based on a daily per capita consumption of drinking water. Observed data between July and September 2016 is used to derive hourly variations and contributions of groundwater to the dry-weather flow. Since CSO occurrence depends mainly on stormwater dynamics rather than on dry-weather flow variations, it is assumed that daily patterns and groundwater infiltration are constant throughout the year. Therefore, seasonal variations of dry-weather flows are not considered significant for this study and hence are not included in the model. Furthermore, chemical oxygen demand (COD) is selected as reference pollutant and implemented at each inflow. Reference mean daily concentrations and hourly patterns of COD are derived from a one-week time series of measured data with 5-min resolution.
The model is calibrated and validated based on three time frames of observed data in the system: 76 days between July and September 2016, and 110 days between June and October 2017 for calibration, and 85 days, from April and July 2018 for validation. Information regarding these processes can be seen in Table A1 from Appendix B.
Subsequently, different SWMM models corresponding to the different scenarios are developed using the calibrated model as a baseline. The scenario with the minimum meshness is obtained by removing the pipes, which do not correspond to the MST. For the maximum meshness scenario, conduits are added to the reference model incrementally to obtain the desired meshness. The location of such links has been determined previously during the scenario development phase. Hydraulic properties of these pipes, i.e., type of profile, maximum depth and roughness, are inherited from the upstream link. Furthermore, length and slope are calculated from the locations of the upstream and downstream nodes. Other pipe parameters in SWMM, e.g., offsets or initial flow, are set to 0.
The CSO dynamics results obtained from long-term simulations of different meshness scenarios are compared and evaluated. For this, precipitation and climate records from the area are used, covering a time frame of 13 years, from 2005 and 2017. The rain data is obtained from the precipitation measurement network of the local water company Stadtentwässerung Dresden GmbH, in Dresden, Germany, and climatological data is obtained from nearby Klotzsche climate stations, operated by the German Weather Service [31].

2.4. CSO Perfromance Indicators

Three different performance indicators are used to compare the scenarios results. The first indicator corresponds the average number of events per year (NCSO), calculated as the ratio between the total number of events during the analyzed period and the number of simulated years. In this study, an event is defined when CSO discharge values are greater than zero. Furthermore, two events are considered independent from each other when they are separated by a minimum of five hours. The second and third performance indicators correspond to the annual mean volumes (AMV, in m3/year) and the annual mean loads (AML, in tons/year). These indicators are calculated as the ratio between the total discharged volumes or total loads for all events during the analyzed period and the number of simulated years.

2.5. Influencing Factor Analysis

One-way ANOVA tests are conducted to compare the effect size of respectively changing meshness, and changing the area specific sewer storage capacity, on the reduction rates of mean annual events, volumes and loads. Four categories for both changes in meshness and in specific sewer capacity are defined. They correspond to gradual increases compared to zero meshness. Furthermore, values corresponding to changes in sewer capacity are normalized by the total sewer storage capacity in the 0% meshness scenario. This is done in order to compare the different metrics on a common scale. Therefore, categories of storage capacity correspond to percentage increases. Table 3 summarizes the categories used.

3. Results

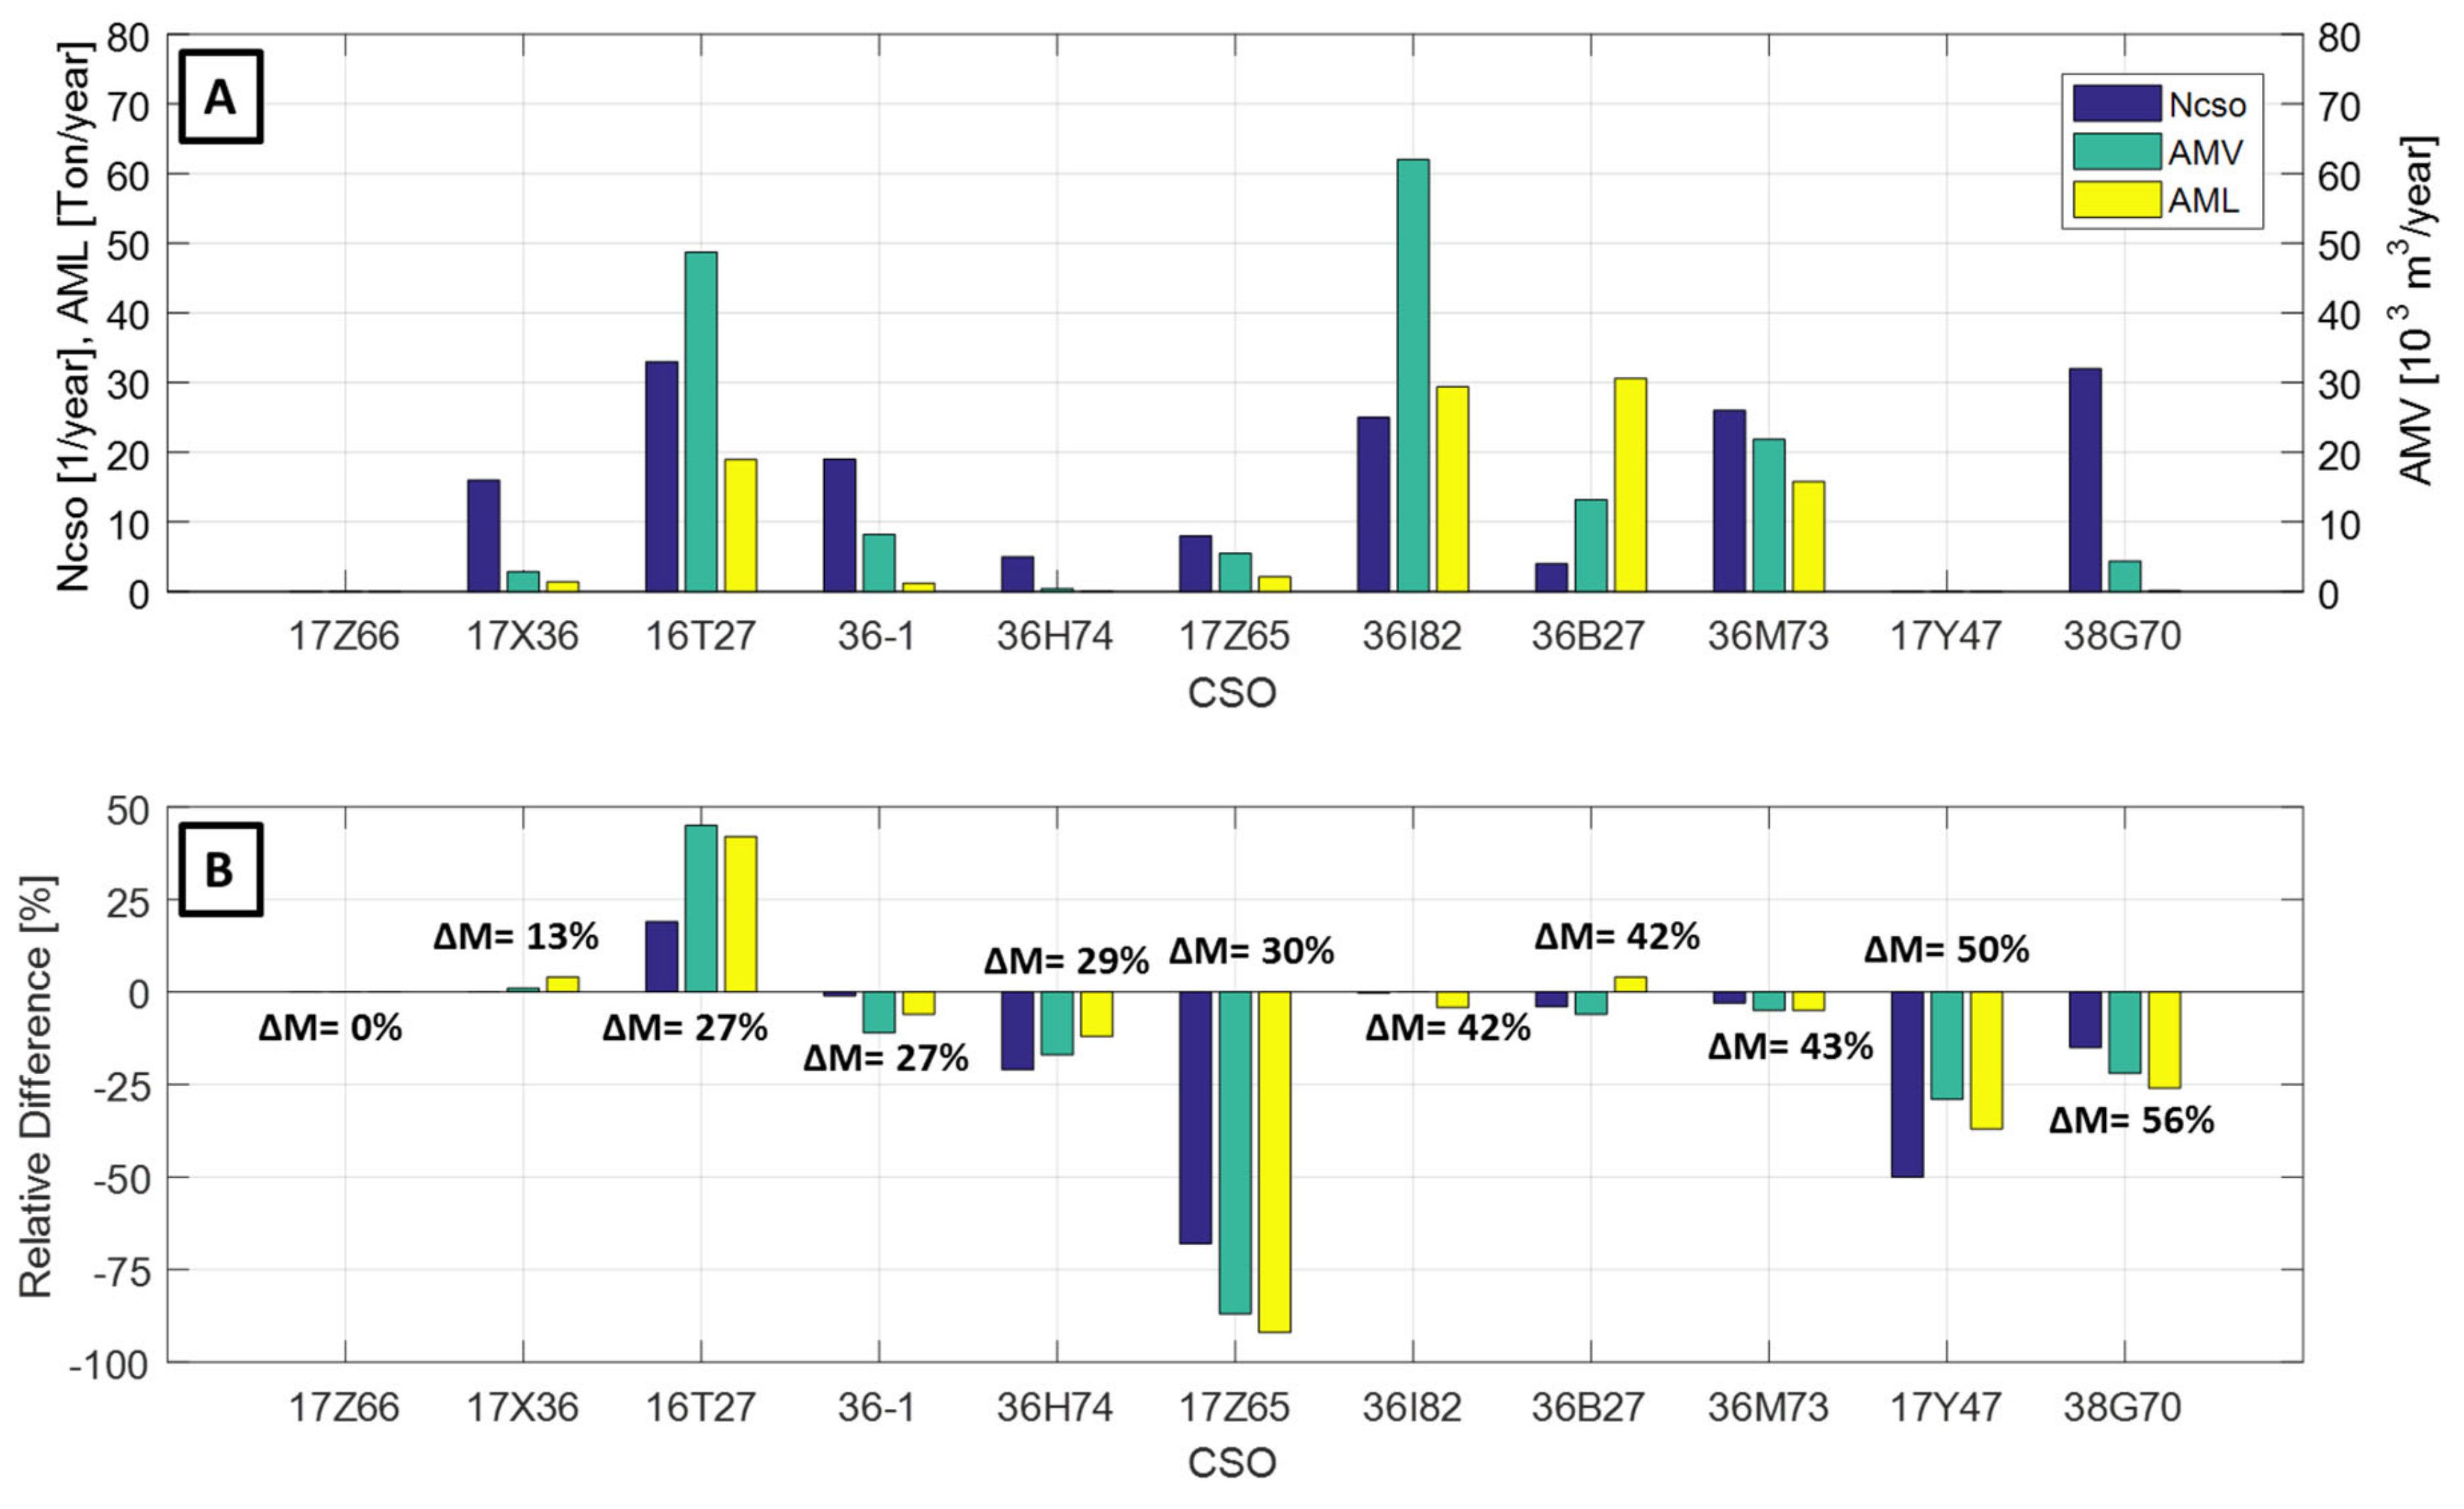
3.1. Reference Scenario

Figure 2A illustrates the indicators results for the reference scenario among the different areas. Frequency of CSO events varies greatly among the analyzed cases with NCSO values ranging from 1 up to 51 events per year. Simultaneously, AMVs (0.04 × 10³ to 68 × 103 m3/year), and AMLs (0 to 31 tons/year) exhibit a wide range of variation. The low NCSO, AMV and AML values reported in CSOs 17X36, 17Z65, 17Z66, 36-1 and 36H74 result from small (less than 30 ha) contributing impervious area for each of these CSOs. Therefore, the runoff produced during rain events does not exceed the threshold to cause an overflow. In the case of 17Y47, however, the low frequency of events is more likely to be related to the presence of an upstream CSO (38G70). CSO 36B27 exhibited a low frequency of events (NCSO value lower than 5), but relatively high AMV and AML (13 × 103 m3/year and 31 Ton/year respectively). This behavior can be explained by the fact that this CSO-catchment incorporates other six CSO subcatchments. In a similar way as for the 17Y47 case, the rare occurrence of events in 36B27 can be mainly attributed to the presence of multiple CSOs upstream (6 in total). Moreover, since it is located at the most downstream section of the network, contributing impervious areas and number of connected people are considerably larger than in previous cases thus explaining the relatively high AMV and AML values. Furthermore, higher NCSO, AMV and AML values obtained for 16T27, 36I82 and 36M73 confirm the influence of the size of connected impervious area on the occurrence and magnitude of events.

3.2. Effects of Meshness on CSO Reduction

In order to analyze the influence of meshness on CSO frequency and magnitude, the relative difference for each indicator in each CSO-catchment between the maximum and minimum scenarios are calculated, see Figure 2B. This is done by calculating the ratio between the difference among the indicators results for the lowest and highest meshness scenarios, and the indicators values for the minimum scenario. The obtained values represent then how much do indicators reduce or increase (negative and positive values respectively), in terms of percentage, between the two meshness scenarios. Furthermore, the difference in meshness, referred as ΔM, between both scenarios in each area is also included. Results indicate a general reduction on the NCSO, AMV and AML with increasing meshness, for almost all the analyzed catchments. No changes are identified for the 17Z66 catchment since its small area does not allow the implementation of new pipes. Furthermore, although meshness has an influence on the reduction, no clear trend can be identified. In fact, no significant changes (i.e., bigger than ±5%) on the occurrence and magnitude of CSO events in 36M73, 36B27 and 36I82 are reported even though there is a high increase in meshness, i.e., higher than 40%. Moreover, CSO 36B27, reported an increase rather than a reduction on the AMLs. This behavior might be attributed to the fact that a decrease on the stormwater volumes leads to less dilution of the COD in the system, since it is a pollutant associated mainly to dry-weather flows.
Contrary to the other cases, results from CSOs 17X36 and 16T27 indicate that an increase of meshness leads to an increase in the annual occurrence, volumes and loads of CSO events, as can be seen by the negative reduction rates. A potential reason for this is that the increase of meshness leads to a decrease of node flooding occurrence [24]. In this way, wastewater which is no longer lost from the network via node flooding remains in the system, thus increasing the volumes at the CSO and hence increasing the frequency and magnitude of such events. This can be analyzed through the contribution of CSOs and flood volumes to water balance as function of meshness, see Table 4.
For example, results of 16T27 indicate that CSO discharges increase with increasing meshness, from 6.0% to 9.7%, while flood contribution decrease (from 8.1% to 4.2%) and water drained to the downstream network, referred here as Outlet, remain constant in all scenarios. Moreover, results also indicate the opposite behavior, i.e., an increase of meshness leads to a decrease on the CSO contributions in the water balance while the contributions from flooding increase, see for example the case of 17Z65. Such results suggest that there might be a trade-off between flooding and CSO occurrence. Nevertheless, such trade-offs could be identified only in two of the analyzed subcatchments. Further studies regarding the potential factors influencing such trade-offs due to an increase in meshness, e.g., network properties or catchment characteristics, are then required.

3.3. Effects of Sewer Storage Capacity on CSO Reduction

Although high reduction rates are reported in other catchments for all analyzed indicators, see for example results for 17Z65, it is not possible to identify a clear trend between such rates and increments of meshness. The different efficiencies among the several CSO-catchments may be related to the storage volume added. Although there is an increase of meshness and therefore an increase in volume, the added pipe capacity might not be enough to have an impact on the CSO occurrence and magnitude. In order to test this, the St-IA differences are compared with the maximum reduction rates for each of the three parameters and each CSO catchment. The St-IA values are normalized by the corresponding results from the minimum meshness scenario (i.e., 0%) in order to facilitate comparisons among the different areas. Furthermore, it is hypothesized that the influence of storage capacity change on CSO frequency and magnitude reduction can be expressed as the following sigmoidal equation:
Reduction = e x p β 0 + β 1 × Δ S t I A 1 +   e x p β 0 + β 1 × Δ S t I A  
where Reduction corresponds to the maximum reduction rates of events, volumes and loads, measured as a percentage. ΔSt-IA corresponds to the normalized maximum storage differences, and β0 and β1 are parameters of the model determined by a nonlinear regression analysis. The selection of a sigmoidal relation was motivated by the assumptions that (i) reductions are constrained in a range from 0 to 100 %, (ii) change in reduction is monotonically and positively related to change in storage volume and iii) the change in reduction predominantly takes place in a “sensitive corridor” i.e., minor changes in specific storage do not instantly change reduction, likewise drastic increases in storage will not further increase the reduction. Results, including 95% prediction intervals, can be seen in Figure 3. The sigmoidal relation fits moderately for the NCSO reduction, and well for both AMV and AML reductions, with coefficients of determination (R2) of 0.99, 0.97 and 0.95 respectively. In all cases, both model parameters are highly significant at p-values below 0.05, with β0 = −5.42, −6.27 and −7.59 for the reductions of NCSO, AMV and AML respectively. Furthermore, values for β1 are 14.74, 18.94 and 23.31 for the reduction of events, volumes and loads respectively. These results indicate that in the analyzed areas, the increment of sewer storage capacity as a result of the installation of additional pipes, and hence as an increment of meshness, can exponentially reduce the frequency and magnitude of CSO events. There is, however, an inflection or optimal point in which a maximum reduction can be achieved, i.e., a reduction close to 100%. This stage is achieved faster, i.e., with a lower increase of meshness, in the case of CSO volumes and loads than on the occurrence of the events. This is reflected in the fact that β1 values of the fitted curves for volume and loads are higher than the ones for events, thus indicating that an increase in meshness (expressed as a change in St-IA), leads to higher reductions of CSO volumes and loads than in the number of events.
Furthermore, the values outside the prediction intervals in all panels of Figure 3 corresponds to the data for 17Y47 and 16T27. These are considered as outliers and therefore are excluded from the nonlinear regression analysis. In the first case, the low frequency of reported events in all analyzed scenarios (either one or none per year), did not allow to identify a clear influence of meshness. Furthermore, as mentioned before, 16T27 is a special case where the increase of meshness leads to an increase rather than a reduction of CSO occurrence due a tradeoff with regard to flooding events in the area.

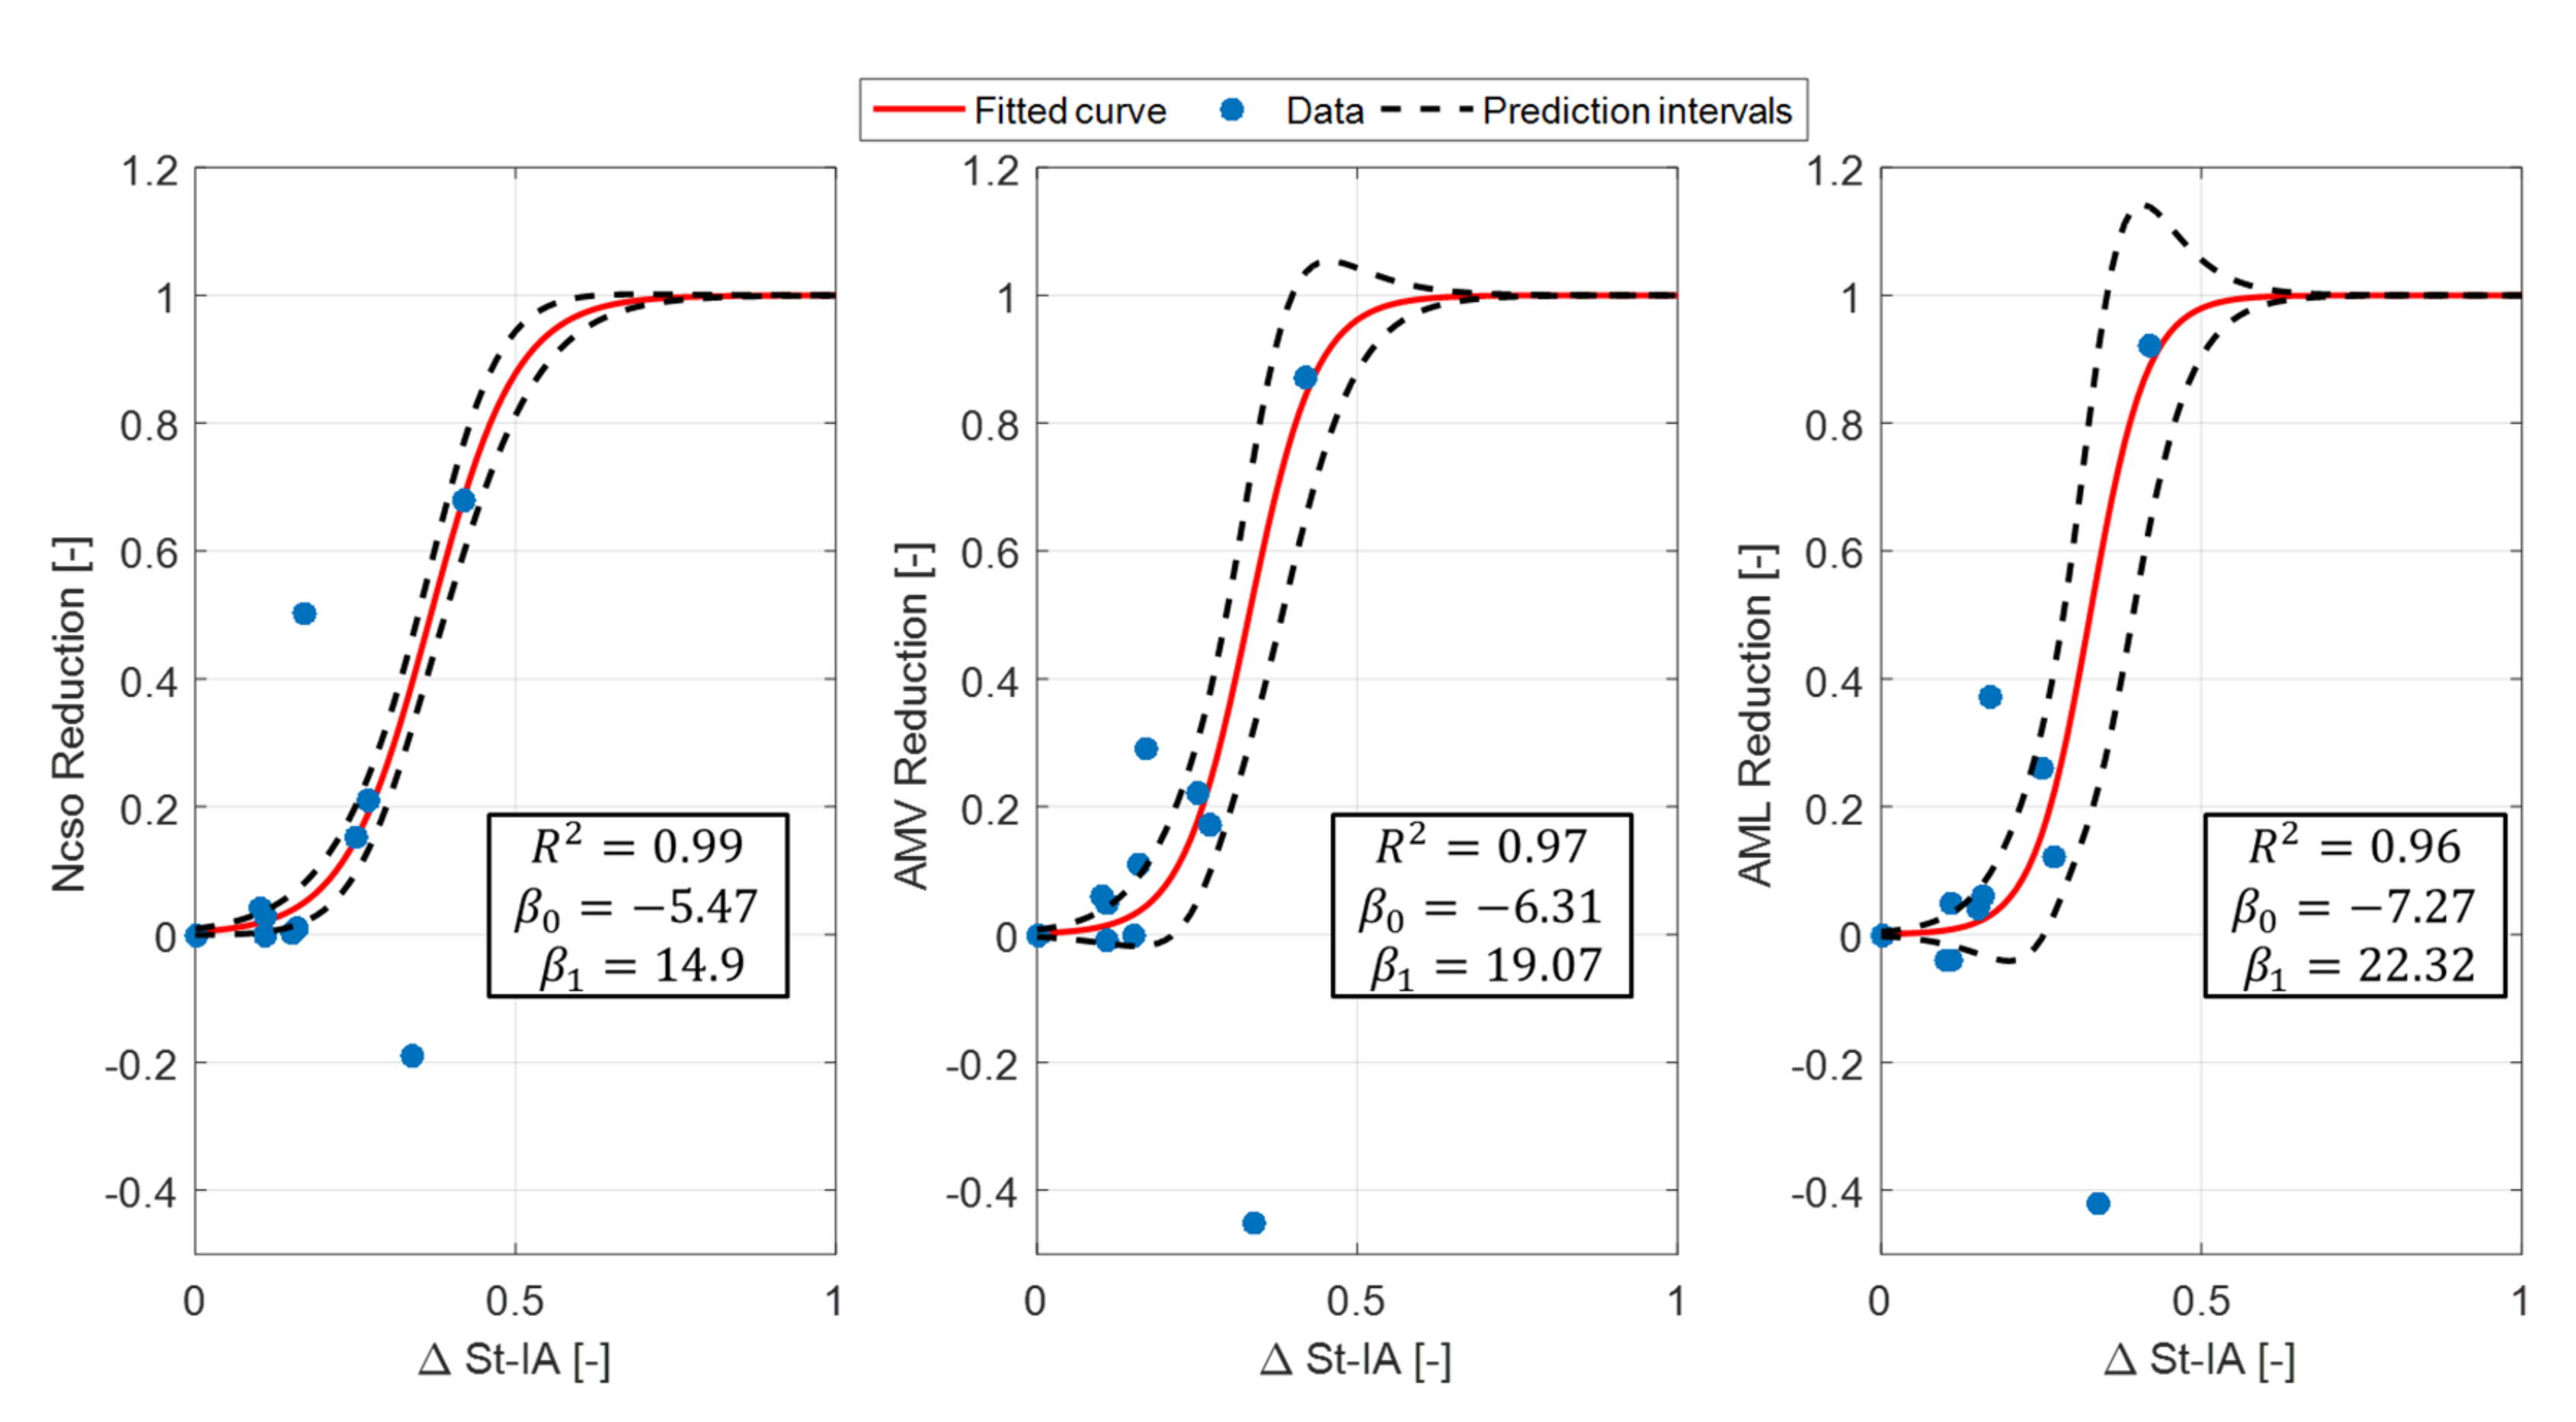
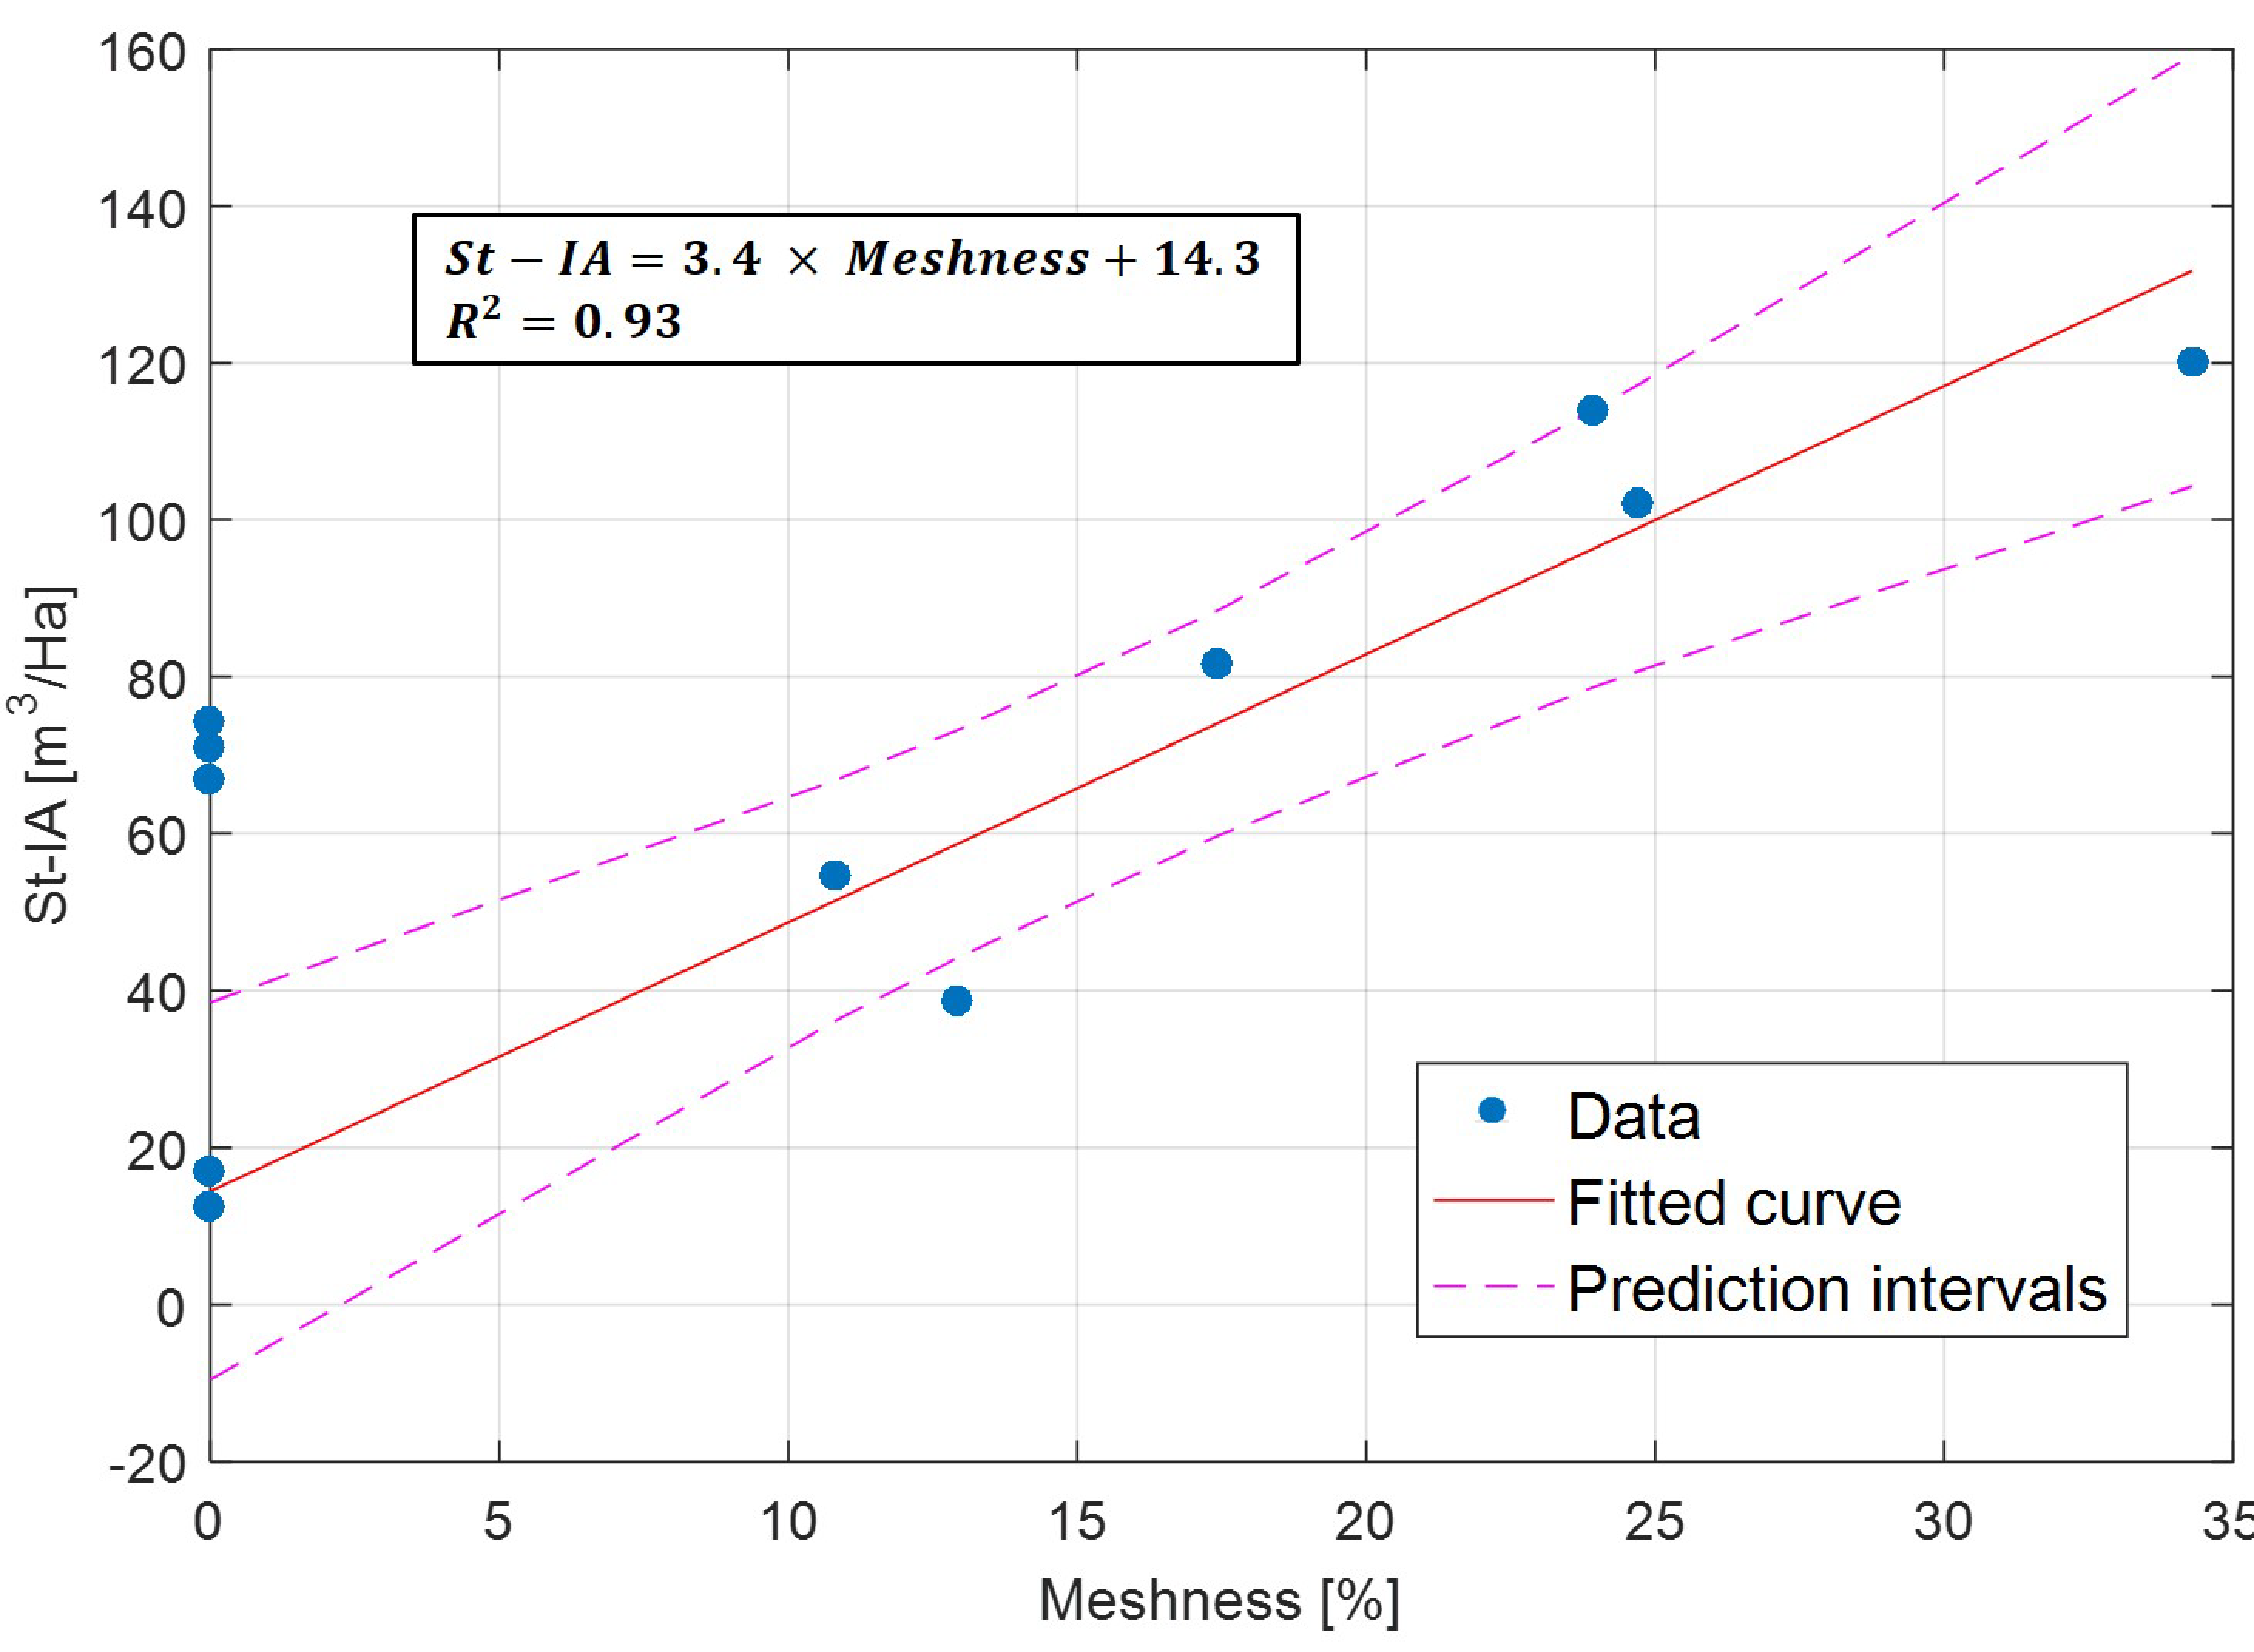
3.4. Influencing Factors

Although meshness and total sewer storage capacity are closely related, it was not possible to identify a clear influence of meshness on the reduction rates as it was for storage. In fact, results from the one-way ANOVA analysis indicate that there are no significant differences among the groups of meshness and the reduction rates of NCSO, AMV and AML (p-values obtained range between 0.31 and 0.33). Regarding changes in storage capacity, results from the ANOVA analyses indicate a significant difference between the different levels of added capacity and the reduction rates of mean annual volumes and loads (with p-values of 0.0042 and 0.0142 respectively), thus suggesting the importance of this factor. Nevertheless, no significant differences between the groups of storage capacity and reduction of mean annual events are found (p-values of 0.08). These preliminary results suggest that simply increasing meshness might not lead to a decrease of CSO occurrence, but it has to be done in a way that maximizes added volume.

4. Discussion

The structure of UDNs can play a relevant role on the occurrence and magnitude of CSO discharges. In fact, increasing meshness tends to reduce the frequency and intensity of such events. Results from the present study suggest that the efficiency of CSO reduction by increasing meshness relies on the additional storage capacity added by the presence of extra pipes. Previous studies have suggested that gray solutions such as increments of storage volumes in the system, e.g., by implementing storage tanks, are efficient measures to reduce CSO frequency [19,20]. Nevertheless, current investigations have identified hybrid solutions (i.e., the combination of green and gray solutions) to be more robust and sustainable [23]. In this context, the present approach of reducing CSO frequency by increasing meshness can be interpreted as a new gray solution that can be integrated in the development of hybrid solution strategies for the better management of CSOs and their environmental impact.
The presented impacts of meshness and storage capacity identified in this study might result from the local conditions and the approach used to place and design the additional pipes. In some cases, spatial restrictions allowed the implementation of additional pipes only at mid or upper sections of the corresponding drainage subnetwork. Since it was assumed that the added pipes should share the hydraulic properties of their corresponding upstream links, the resulting added storage capacity is not so significant since pipe diameters are usually smaller in the upstream section compared to lower areas of the network. Therefore, although there might be an increase of meshness, there will not be a considerable increase in storage capacity, hence the reduction of CSO frequencies will not be significant in comparison to the reference conditions. Identifying a proper location for the implementation of additional pipes to maximize the reduction effects associated to increasing meshness is required. Hesarkazzazi et al. [32] suggested that, in terms of general efficiency (i.e., rapid wastewater drainage), implementing additional pipes in the downstream sections of the system is more beneficial. Hence, the results presented here encourage further studies regarding optimal placement of additional pipes, e.g., for an efficient and fast flow distribution or reduction of adverse events such as CSOs or node flooding.
Although increase of storage is identified as a main driver for CSO reduction, other factors associated to increasing meshness, such as the generation of additional flow paths, might also play a big role on CSO reduction and therefore need to be further studied. In fact, the presence of additional flow paths can provide a better distribution of stormwater, ensuring a continuous drainage of wastewater. Lee et al. [33] suggested that networks with higher drainage density, i.e., with a more meshed layout, are inducing lower runoff peaks than branched systems. Based on this, the reduction of the annual number of CSO events might be explained by the fact that lower peaks in higher meshness networks implies lower water levels in the pipes, hence the threshold depth for activation of CSOs is then not so frequently exceeded. The relationship between meshness and flow peaks before CSO structures still remains to be analyzed.
Increasing meshness might be a solution for reducing CSO frequency, however, this approach is associated to a high investment cost due to pipe installation and maintenance. The conventional approach, to install retention tanks at selected locations might require less space and costs. It is necessary then to develop an optimization strategy for the selection of intervention areas. This should be done based on a cost-benefit analysis which takes into consideration the different water quality impacts on receiving water bodies. Particularly, the cascade effect of several CSOs discharging into a single river should be analyzed. Development of a tool to model not only dynamic flow but also water quality interactions is expected to enable a proper assessment the optimal intervention scenario.
Further research should improve understanding the effects of meshness on sewer network processes such as CSO events. On the one hand, analysis should be extended to cover not only a wider range of meshness but also intermediate levels. Results indicate that higher meshness may be related to higher reduction efficiencies, however this needs to be further analyzed by extending the maximum meshness possible in each area. This can be achieved by increasing the threshold used for the identification of potential locations to add new pipe sections (see Section 2.2). As a consequence, scenarios with higher meshness where longer pipe sections, and hence higher storage capacity, may become more frequent can be developed, thus allowing to a better analysis of the effects of meshness. This can be complemented by analyzing the effects of gradually increasing meshness, i.e., by developing and analyzing intermediate configurations. It is expected that this will provide a better insight on the effects of meshness and on the potential identification of an optimal configuration and might be a complementary approach for long-term UDN development strategies. This, however, needs to be done considering the technical and physical restrictions that exists in the area in order to achieve realistic results. On the other hand, the conditions of the sewer network should also be considered. In fact, detrimental status of pipe sections, e.g., presence of leakages or clogging of the pipes, may have a strong influence on the hydraulic behavior of the network. It is recommended that further studies should focus on analyzing the combined effects of increasing meshness while considering the potential deterioration of pipe sections.

5. Summary and Conclusions

The present work focused on analyzing the relationship between the structure (i.e., layout) of a sewer system and the occurrence of combined sewer overflows (CSOs). A subnetwork of the sewer system of the city of Dresden, Germany, was used as study case since several CSOs are present. Structure was measured in terms of meshness. Scenarios corresponding to the lowest and highest meshness possible for each CSO-catchment were developed and implemented in EPA SWMM. Long term simulations were performed to obtain data regarding the characteristics of CSO events.
Results suggested that, in general, an increment of meshness lead to a decrease in the occurrence and magnitude of overflow events, volumes and pollutant loads. Nevertheless, no clear relationship was found. In order to better understand this, the effect of added sewer storage capacity per connected impervious area, associated to an increase in meshness, on the frequency and magnitude of CSO events was analyzed. Results suggested a clear relationship between increments of total sewer storage capacity and decrease of the mean annual number of CSO events, volumes and loads. It was proposed that such relationship can be expressed as a sigmoidal function based on the fact that although reduction rates initially increase exponentially with increase of storage, they cannot be higher than 100% and therefore an inflexion point must be reached. Outcomes of this analysis indicate that this stage is achieved faster, i.e., with a lower increase of storage, in the case of CSO volumes and loads than on the occurrence of the events. In other words, increments of storage capacity have a bigger impact on reducing CSO volumes and loads rather than on the occurrence of such events.
A potential reason for which no clear relationship between meshness and CSO reduction was found despite the close relationship between meshness and total sewer storage capacity, may rely on the location of the extra pipes. Adding pipe sections in the upper parts of the network may lead only to small storage changes, hence to small CSO frequency reductions. Further studies regarding the identification of the proper location for implementing additional pipes to maximize the reduction effects associated to increasing meshness is required.
It is recommended, however, that such studies include a previous analysis on the potential changes on the trade-offs between CSO and flooding events due to increase of meshness. In fact, results suggest three possible relationships between CSO and flooding frequency changes. On the one hand, increasing meshness may lead to a decrease in CSO discharged volumes but to an increase on flooding. On the other hand, the opposite case was identified, i.e., increasing meshness led to a decrease in flooding rates but to an increase on CSO frequency. Notably, these behaviors occurred in only two out of eleven cases. In the remaining areas no trade-off between flooding and CSO discharge was identified. Nonetheless, further studies regarding potential factors influencing such trade-offs, e.g., network properties or catchment characteristics, are required.
Although increasing meshness might be a viable solution for the proper management of CSO discharges, studies regarding optimal location of pipe placement and most appropriate CSO-catchments to intervene are necessary. It is suggested that such kind of studies should focus on maximizing the advantages of increasing meshness while reducing not only investment costs, in terms of pipe installation and maintenance, but also in terms of reducing quality deterioration in receiving water bodies. Furthermore, it is expected that the outcomes could provide a new gray solution for the management of CSOs.

Author Contributions

Conceptualization, J.D.R.-S. and B.H.; methodology, J.D.R.-S.; software, E.B.; validation, E.B., J.D.R.-S. and B.H.; formal analysis, J.D.R.-S.; investigation, J.D.R.-S.; data curation, J.B.; writing—original draft preparation, J.D.R.-S.; writing—review and editing, J.D.R.-S; visualization, J.D.R.-S.; supervision, P.K.; funding acquisition, P.K. All authors have read and agreed to the published version of the manuscript.

Funding

This work was supported by the Excellence Initiative of the German Federal and State Governments, through the of the International Research Training Group ‘Resilient Complex Water Networks’ (PSP F-003661-553-A5E-1180101). Open Access Funding by the Publication Fund of the TU Dresden.

Acknowledgments

The presented work was conducted under the framework of the International Research Training Group ‘Resilient Complex Water Networks’. It is supported by TU Dresden’s Institutional Strategy. TU Dresden’s Institutional Strategy is funded by the Excellence Initiative of the German Federal and State Governments. The IRTG is a joint initiative of TU Dresden, Helmholtz-Centre for Environmental Research (UFZ) with their Center of Advanced Water Research (CAWR), Purdue University (USA) and University of Florida (USA). The authors gratefully acknowledge the cooperation with the Stadentwässerung Dresden GmbH.

Conflicts of Interest

The authors declare no conflict of interest

Appendix A

Figure A1 illustrates the relationship between total sewer storage capacity (St-IA) and meshness for the analyzed CSO-catchments, including results from a linear regression analysis.
Figure A1. Relationship between total sewer storage capacity (St-IA) and Meshness; including fitted lines, their 95% confidence intervals (red and magenta lines respectively) and fitted equation.
Water 12 02675 g0a1

Appendix B

Calibration of the developed SWMM model was done using a multi-objective optimization approach based on genetic algorithm. The surface parameters corresponding to imperviousness, depression storages (both in pervious and impervious areas), surface Manning coefficients and infiltration rates, are selected as calibration parameters for the 2505 subcatchments in the model. Three performance indicators are used for both calibration and validation: Nash-Sutcliffe Efficiency (NSE) [34], Kling-Gupta Efficiency (KGE) [35] and Volumetric Efficiency (VE) [36]. Based on available data on the node just before the CSO 36M73, two calibration time frames are used: 76 days between July and September 2016, and 110 days between June and October 2017. Regarding validation, observed data from 85 days, from April and July 2018, are used. Table A1 summarizes the results for both processes.
Table A1. Summary of calibration and validation periods and results.
ProcessDateNSEKGEVE
Calibration8 July 2016–22 September 20160.720.880.78
Calibration14 June 2017–2 October 20170.680.920.83
Validation25 April 2017–19 July 20170.650.710.74

References

  1. Butler, D.; Digman, C.; Makropoulos, C.; Davies, J.W. Urban Drainage, 4th ed.; Spon Press: London, UK; Taylor and Francis Group: New York, NY, USA, 2018. [Google Scholar]
  2. Gromaire, M.; Garnaud, S.; Saad, M.; Chebbo, G. Contribution of different sources to the pollution of wet weather flows in combined sewers. Water Res. 2001, 35, 521–533. [Google Scholar] [CrossRef]
  3. Soonthornnonda, P.; Christensen, E. Source apportionment of pollutants and flows of combined sewer wastewater. Water Res. 2008, 42, 1989–1998. [Google Scholar] [CrossRef] [PubMed]
  4. Passerat, J.; Ouattara, N.; Mouchel, J.; Servais, P. Impact of an intense combined sewer overflow event on the microbiological water quality of the Seine River. Water Res. 2011, 45, 893–903. [Google Scholar] [CrossRef] [PubMed]
  5. Ouattara, N.; Garcia-Armisen, T.; Anzil, A.; Brion, N.; Servais, P. Impact of wastewater release on the faecal contamination of a small urban river: The Zenne River in Brussels (Belgium). Water Ait Soil Pollut. 2014, 225, 2043. [Google Scholar] [CrossRef]
  6. Boyd, G.; Palmeri, J.; Zhang, S.; Grimm, D. Pharmaceutical and personal care products and endocrine disrupting chemicals in stormwater canals and Bayou St. John in New Orleans, Louisiana, USA. Sci. Total Environ. 2004, 333, 137–148. [Google Scholar] [CrossRef] [PubMed]
  7. Fono, L.; Sedlak, D. Use of chiral pharmaceutical propranolol to identify sewage discharges into surface waters. Environ. Sci. Technol. 2005, 39, 9244–9252. [Google Scholar] [CrossRef] [PubMed]
  8. Phillips, P.; Chalmers, A. Wastewater effluent, combined sewer overflows, and other sources of organic compounds to Lake Champlain. J. Am. Water Resour. Assoc. 2009, 45, 45–57. [Google Scholar] [CrossRef]
  9. Weyrauch, P.; Matzinger, A.; Pawlowsky-Reusing, E.; Plume, S.; von Seggern, D.; Heinzmann, B.; Rounault, P. Contribution of Combined sewer overflows to trace contaminant loads in urban streams. Water Res. 2010, 44, 4451–4462. [Google Scholar] [CrossRef]
  10. Musloff, A.; Leschik, S.; Reinstorf, F.; Strauch, G.; Schirmer, M. Micropollutant loads in the urban water cycle. Environ. Sci. Technol. 2010, 44, 4877–4883. [Google Scholar] [CrossRef]
  11. Phillips, P.; Chalmers, A.; Gray, J.; Kolpin, D.; Foreman, W.; Wall, G. Combined Sewer Overflow: An Environmental Source of Hormones and Wastewater Micropollutants. Environ. Sci. Technol. 2012, 46, 5336–5343. [Google Scholar] [CrossRef]
  12. House, M.; Ellis, J.; Herricks, E.; Hvitved-Jacobsen, T.; Seager, J.; Lijklema, I.; Clifforde, I. Urban drainage—Impacts on receiving water quality. Water Sci. Technol. 1993, 27, 117–158. [Google Scholar] [CrossRef]
  13. Hvitved-Jacobsen, T. The impact of combined sewer overflows on the dissolved oxygen concentration of a river. Water Res. 1982, 16, 1099–1105. [Google Scholar] [CrossRef]
  14. Riechel, M.; Matzinger, A.; Pawlowsky-Reusing, E.; Sonnenberg, H.; Uldack, M.; Heinzmann, B.; Rouault, P. Impacts of combined sewer overflows on a large urban river—Understanding the effect of different management strategies. Water Res. 2016, 105, 264–273. [Google Scholar] [CrossRef] [PubMed]
  15. Wang, J. Combined sewer overflows (CSOs) impact on water quality and environmental ecosystems in the Harlem river. J. Environ. Prot. 2014, 5, 1373–1389. [Google Scholar] [CrossRef] [Green Version]
  16. Andrés-Domenech, I.; Múnera, J.C.; Francés, F.; Marco, J. Coupling urban event-based and catchment continuous modeling for combined sewer overflow river impact assessment. Hidrol. Earth Syst. Sci. 2010, 14, 2057–2072. [Google Scholar] [CrossRef] [Green Version]
  17. Even, S.; Mouchel, J.; Servais, P.; Filpo, N.; Poulin, M.; Blan, S.; Paffoine, C. Modelling the impacts of combined sewer overflows on the riverine seine water quality. Sci. Total Environ. 2007, 375, 140–151. [Google Scholar] [CrossRef] [PubMed]
  18. Wang, J.; Guo, Y. An analytical stochastic approach for evaluating the performance of combined sewer overflow tanks. Water Resour. 2018, 54, 3357–3375. [Google Scholar] [CrossRef]
  19. Llopart-Mascaró, A.; Farreny, R.; Gabarrell, X.; Rieradevall, J.; Gil, A.; Martinez, M.; del Paraira, M. Storm tank against combined sewer overflow: Operation strategies to minimise discharges impact to receiving waters. Urban Water J. 2015, 12, 219–228. [Google Scholar] [CrossRef]
  20. Martino, G.D.; DePaola, F.; Fontana, N.; Marini, G.; Ranucci, A. Pollution Reduction in Receivers: Storm-Water Tanks. J. Urban Plan. Dev. 2011, 137, 29–38. [Google Scholar] [CrossRef]
  21. Lucas, W.C.; Sample, D.J. Reducing combined sewer overflows by using outlet controls for Green Stormwater Infrastructure: Case study in Richmond, Virginia. J. Hydrol. 2015, 520, 473–488. [Google Scholar] [CrossRef]
  22. Montalto, F.; Behr, C.; Alfredo, K.; Wolf, M.; Arye, M.; Walsh, M. Rapid assessment of the cost-effectiveness of low impact development for CSO control. Landsc. Urban Plan. 2007, 82, 117–131. [Google Scholar] [CrossRef]
  23. Casal-Campos, A.; Sadir, S.M.; Fu, G.; Butler, D. Reliable, Resilient and Sustainable Urban Drainage Systems: An Analysis of Robustness under Deep Uncertainty. Environ. Sci. Technol. 2018, 52, 9008–9021. [Google Scholar] [CrossRef] [PubMed] [Green Version]
  24. Reyes-Silva, J.D.; Helm, B.; Krebs, P. Meshness of sewer networks and its implications for flooding occurrence. Water Sci. Technol. 2020, 81, 40–51. [Google Scholar] [CrossRef] [PubMed]
  25. Benisch, J.; Wagner, B.; Förster, C.; Helm, B.; Grummt, S.; Krebs, P. Application of high-resolution measurement system with hydrodynamic modelling for the integrated quantification of urbanization effects on a creek. In Proceedings of the 14th IWA/IAHR International Conference on Urban Drainage, Prague, Czech Republic, 10–15 September 2017. [Google Scholar]
  26. Kruskal, J.B. On the shortest spanning subtree of a graph and the traveling salesman problem. Proc. Am. Math. Soc. 1956, 7, 48–50. [Google Scholar] [CrossRef]
  27. Rossman, L.A. Storm Water Management Model, User’s Manual, Version 5.1; Environmental Protection Agency (EPA): Cincinnati, OH, USA, 2015.
  28. Warsta, L.; Niemi, T.J.; Taka, M.; Krebs, G.; Haahti, K.; Koivusalo, H.; Kokkonen, T. Development and application of an automated subcatchment generator for SWMM using open data. Urban Water J. 2017, 14, 954–963. [Google Scholar] [CrossRef]
  29. Joint Research Centre (European Commission). The European Settlement Map 2017 Release; Methodology and Output of the European Settlement Map (ESM2p5m); Publications Office of the EU: Luxembourg, 2017; 2p. [Google Scholar] [CrossRef]
  30. European Union. Copernicus Land Monitoring Service 2017; European Environment Agency (EEA): Copenhagen, Denmark, 2017.
  31. Federal Statistical Office. Special Evaluation Results of the Census of 9 May 2011 per Grid Cell. Online Database. 2013. Available online: https://www.zensus2011.de/DE/Home/home_node.html (accessed on 18 October 2019).
  32. Deutscher Wetter Dienst, Wetter und Klima Aus Einer Hand (DWD). 2019. Available online: https://www.dwd.de/DE/wetter/wetterundklima_vorort/sachsen/dresden/_node.html (accessed on 16 November 2019).
  33. Hesarkazzazi, S.; Hajibabaei, M.; Reyes-Silva, J.D.; Krebs, P.; Sitzenfrei, R. Assessing Redundancy in Stormwater Structures under Hydraulic Design. Water 2020, 12, 1003. [Google Scholar] [CrossRef] [Green Version]
  34. Lee, J.; Chung, G.; Park, H.; Park, I. Evaluation of the Structure of Urban Stormwater Pipe Network Using Drainage Density. Water 2018, 10, 1444. [Google Scholar] [CrossRef] [Green Version]
  35. Nash, J.E.; Sutcliffe, J.V. River flow forecasting through conceptual models part I—A discussion of principles. J. Hydrol. 1970, 10, 282–290. [Google Scholar] [CrossRef]
  36. Gupta, H.V.; Kling, H.; Yilmaz, K.K.; Martinez, G.F. Decomposition of the mean squared error and NSE performance criteria:Implications for improving hydrological modelling. J. Hydrol. 2009, 377, 80–91. [Google Scholar] [CrossRef] [Green Version]
Figure 1. Urban drainage network (UDN), Combined sewer overflows (CSOs), and rivers in the study area.
Water 12 02675 g001
Figure 2. (A) Average number of CSO events per year (NCSO), annual mean volumes (AMV) and annual mean loads (AML) for all CSOs in the reference conditions, and (B) Relative differences of NCSO, AMV and AML in percentage among scenarios, including the difference of meshness among them (ΔM).
Water 12 02675 g002
Figure 3. Logistic regressions of average number of CSO events per year (NCSO, left panel), annual mean volumes (AMV, mid panel) and annual mean loads (AML, right panel) as a function of the maximum increase of storage capacity per impervious area (ΔSt-IA). Including fitted lines, their 95% prediction intervals (red and magenta lines respectively).
Water 12 02675 g003
Table 1. CSO-catchments and urban drainage network characteristics.
CSODrainage Area (Ha)Imperviousness (%)Meshness (%)St-IA * (m3/Ha)Number of Upstream CSOs
16T27111.7441154.60
17Y47118.335017.01
17X3666.4381338.60
17Z6551.4341781.50
17Z661.846070.80
36-114.443074.21
36B27618.44125102.06
36H747.643067.10
36I82125.74324113.80
36M7399.54134120.00
38G7054.835012.40
Note: * St-IA corresponds to total sewer storage capacity per connected impervious areas.
Table 2. Meshness of the three analyzed scenarios for each of the CSO-catchment in the study area.
CSO-CatchmentMinimum
Scenario (%)
Original (%)Maximum
Scenario (%)
16T2701127
17Y470050
17X3601313
17Z6501730
17Z66000
36-10027
36B2702542
36H740029
36I8202442
36M7303443
38G700056
Table 3. Classification of meshness and total sewer storage capacity.
CategoryChange in Meshness (%)Change in Capacity (%)
10–150–10
216–3011–20
331–4521–30
446–6031–40
Table 4. Percentage distribution of water pathways for each studied area and each analyzed meshness scenario.
AreaMinimum MeshnessOriginal MeshnessMaximum Meshness
CSO (%)Flood (%)Outlet (%)CSO (%)Flood (%)Outlet (%)CSO (%)Flood (%)Outlet (%)
16T276.08.185.99.34.786.09.74.286.1
17Y470.019.081.00.019.081.00.019.180.9
17Z652.91.196.02.11.196.80.92.396.8
17X361.25.493.41.25.393.51.25.393.5
36_18.90.091.19.00.091.06.90.093.1
36B270.43.596.10.43.596.10.33.596.2
36H740.90.099.10.90.099.10.90.099.1
36I828.41.889.88.51.789.88.31.690.2
36M733.30.995.83.40.895.83.20.896.0
38G702.49.787.92.49.787.92.310.687.1

