Article

Effect of Diverse Abiotic Conditions on the Structure and Biodiversity of Ichthyofauna in Small, Natural Water Bodies Located on Agricultural Lands

1
Institute of Technology and Life Sciences, al. Hrabska 3, 05-090 Falenty, Poland
2
Faculty of Food Sciences and Fisheries, West Pomeranian University of Technology in Szczecin, K. Królewicza 4 Street, 71-550 Szczecin, Poland
*
Author to whom correspondence should be addressed.
Water 2020, 12(10), 2674; https://doi.org/10.3390/w12102674
Submission received: 28 August 2020 / Revised: 16 September 2020 / Accepted: 22 September 2020 / Published: 24 September 2020
(This article belongs to the Section Biodiversity and Functionality of Aquatic Ecosystems)

Abstract

:
Mid-field natural ponds promote regional biodiversity, providing alternative habitats for many valuable animal species. The study’s objective was to determine the most important abiotic factors, including hydrochemical and morphometric parameters, affecting fish occurrence in natural, small water bodies on agricultural lands. The studies were conducted in nine randomly selected water bodies located in Poland (the North European Plain). Eleven species of fish were recorded in the waterbodies, with the most abundant being cyprinids (mainly crucian carp). Canonical correspondence analysis (CCA) showed that an increase in oxygenation, temperature, amount of macrophytes, and K concentration and a decrease in the concentration of phosphates, electrical conductivity (EC), Mg, and Cl is associated with the most beneficial living conditions for the most frequently occurring species in the studied water bodies—crucian carp and tench. Aside from the hydrochemical parameters of water in the natural ponds, the number of fish correlates with the basin area and the pond area, maximum depth, area of the buffer zone surrounding the water bodies, and the number of macrophytes. This last factor also has a significant influence on the species’ abundance in the water bodies. Fish occurrences in mid-field ponds and common knowledge on their important role in the environment require taking steps to provide fish protection.

1. Introduction

The agricultural landscape of the North European Plain comprises moraine hills, as well as numerous lakes and small water bodies with an area of about 1–5 ha each, which make up almost half of the waterbodies [1]. Due to their small area, in Northern America they are called prairie potholes or sloughs or kettle holes, and in Poland they are referred to as mid-field water bodies or ponds [2,3]. According to the Pond Conservation Group [4], this concept is understood as a small body of water (between 1 m2 and 2 ha) that maintains water for at least a few months in a year. Owing to their natural origin, they primarily occur in young glacial areas. They are characterized by rich topographical relief formed by the activity of the ice sheet and significant variability of soil moisture [3,5]. Significant impact on the water balance on these lands is exerted by meteorological conditions (e.g., rainfall and snowfall), evapotranspiration, water evaporation, runoff, and the largest groundwater exchange [6].
These natural ponds play many different roles, both in the economic and ecological aspect [7]. They are habitats for numerous aquatic animal and plant species [8], and their small size facilitates monitoring of the aquatic environment in the context of e.g., ecological relationships, as well as evolutionary biology and global climate changes and eutrophication of waters, which are a serious threat to these astatic water bodies [9,10]. In a broad perspective, it may be concluded that the condition of the pond environment is determined by numerous abiotic factors and human activity. A big threat to small ponds is climate changes, which are manifested by seasonal partial drying, and often complete disappearance [5,11].
In recent years, one can observe increased awareness of the significance of small water bodies, regarding their numbers, importance for freshwater biodiversity, rendering ecosystem services, and their sensitivity and susceptibility to anthropogenic disturbances [12,13]. Various scientific papers discuss the effect of abiotic factors on aquatic organisms living in water bodies, such as zooplankton or herpetofauna [14,15]. However, there is not much discussion on ichthyofauna, for which small, natural water bodies may serve as habitats and reproduction sites. Wetland and small water bodies are characterized by a significant variability of environmental conditions, which may determine the ability of aquatic organisms to spread and also pose a threat to species diversity [16,17]. It should be emphasized that natural, mid-field water bodies have no connections with other waters in the form of a network of tributaries and distributaries [18]. This means that the fish population in these waters is brought there mainly through restocking by fish farmers, transfer of fish by fishermen, or together with water birds.
The knowledge on the biodiversity and composition of ichthyofauna in large lakes and watercourses under environmental monitoring is extensive [19,20,21], but there is minimal information on small water bodies with an area of about 1–2 ha. Despite the fact that the primary productivity of these small waterbodies is often higher than that of large ones [22], fishing happens only occasionally [23], while these waterbodies are often a habitat of valuable and protected fish species—e.g., Phoxinus percnurus [24]. These ecosystems, being important on a European scale, as natural habitats specified in Annex I and habitats of species specified in Annex II to the EU Directive on the conservation of natural habitats and of wild fauna and flora [25], play an important role in the European Ecological Network Natura 2000. Their diverse abiotic conditions (water temperature, oxygen content, pH, content of biogenic substances) affect the food resources [26] and presence and dominance of various fish species [17,27,28]. In spite of this, small waterbodies are still the least examined part of environmental water resources and are largely excluded from water management planning [12].
The objective of this study was to determine the abiotic condition of fish habitats in small ponds located on agricultural lands of the North European Plain and to determine their ichthyological biodiversity. Additionally, it was to assess the effect of hydrochemical and morphometric parameters of the water bodies, including the basin area, the buffer zone area [29], the waterbody area, and depth, on ichthyofauna.

2. Materials and Methods
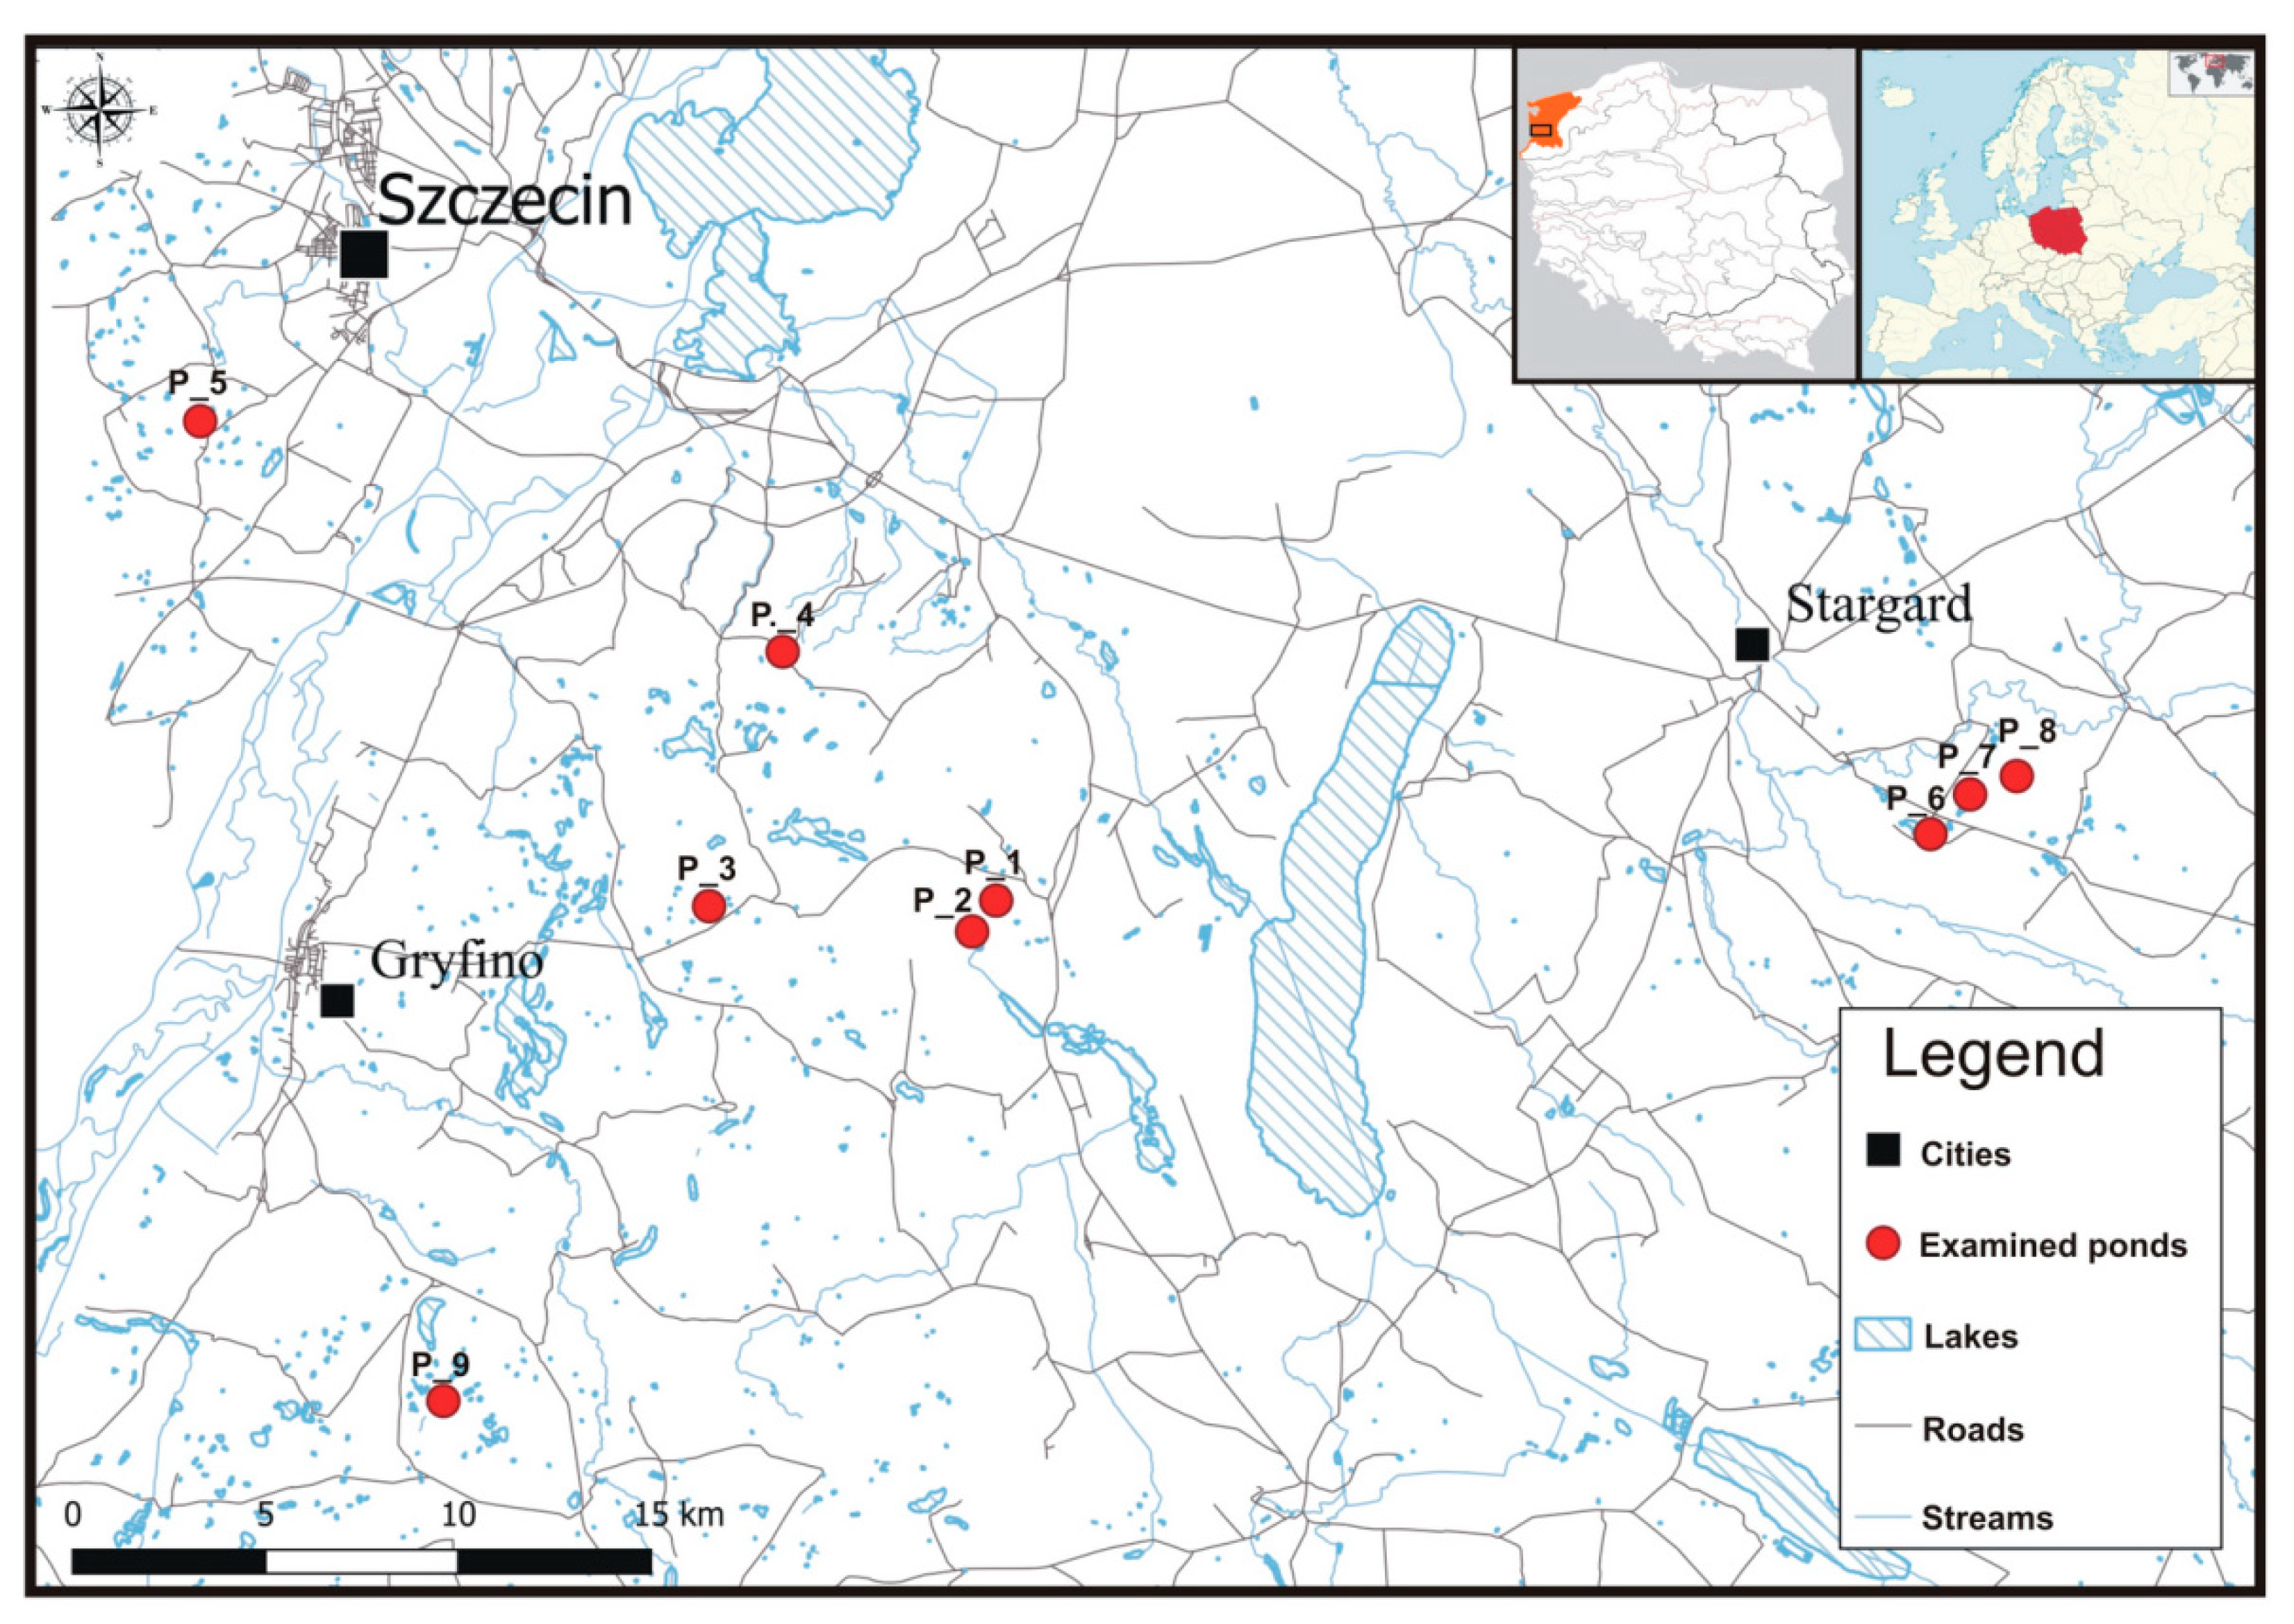
2.1. Study Area

The study site was located on agricultural lands in the macroregion Pobrzeże Szczecińskie, in north-western Poland. The studies were conducted in nine, randomly selected small (called P_1–P_9) mid-field water bodies (ponds) with an area between 1 and 2 ha (P_1, 53°16′07.9″ N 14°46′35.4″ E; P_2, 53°16′04.2″ N 14°46′06.1″ E; P_3, 53°16′10.3″ N 14°40′00.9″ E; P_4, 53°19′59.7″ N 14°40′09.0″ E; P_5, 53°22′20.0″ N 14°26′47.8″ E; P_6, 53°18′26.8″ N 15°06′32.2″ E; P_7, 53°18′42.0″ N 15°07′57.4″ E; P_8, 53°18′51.0″ N 15°08′21.0″ E; P_9, 53°09′05.4″ N 14°32′41.7″ E) (Figure 1).
All the study waterbodies probably had a natural origin. During the studies, they were unused by the owners of the arable lands on which they were situated. The water bodies were highly overgrown with submerged water plants and rush vegetation. They were silted up, but despite periodic changes in the water level, none of the water bodies was entirely dried up; short-term freezing of the surface layer was observed only sporadically (to a depth, on average of 1.5 cm) in winter. Moreover, no fish species had been placed in these waterbodies.
Small, mid-field water bodies were supplied only by meteoric waters, surface runoff, and as a result of soil percolation. The adjacent areas included arable land or meadows. Each pond was separated from agricultural lands by a diverse buffer zone, limiting to a certain extent the flow of fertilizer compounds from the fields [29].

2.2. Methods of Testing Selected Abiotic Factors

The samples were collected from the water for chemical analysis, and field measurements (maximum water depth in the water bodies and the areas of buffer zones) were conducted in a monthly cycle during the growing season (i.e., from April to October) in 2015–2017 (mean values of the measurements are presented in the paper). The macrophytes were determined during the growing season by marking the reservoirs covered with rush vegetation in the field and taking pictures, and then the water reservoir coverage area was calculated via the Geoportal online program.
Field tests included measurements of the pond areas, basin areas, and buffer zone areas, which were then calculated with the use of orthophoto-maps by QGIS software—Geographic Information System-GIS (version 3.14, https://www.qgis.org). Surface measurements and measurements of the range of individual patches of vegetation were made on the basis of panchromatic photogrammetric photos taken from a drone that passed overhead. Photo mosaics were combined into one image using AgiSoft software (version 1.6.4, Agisoft LLC, Petersburg, Russia). The resulting image was converted from the WGS84 (World Geodetic System 1984) (EPSG: 4326) coordinate system to the 1992 PUWG (Państwowy Układ Współrzędnych Geodezyjnych) (EPSG: 2180) system using QGIS software. The individual identified surfaces were digitized into a vector file in SHP format. Then the area of individual polygons was calculated in square meters with respect to the ellipsoid.
Water samples were collected from the water bodies in compliance with applicable standards. Three water samples were collected from each of the water bodies: one sample from the middle zone, and two samples from two sites located in the littoral zone. The samples were collected in sterile bottles (500 mL), supplied by Research Laboratory of Environmental Chemistry in Falenty in accordance with ISO 5667-24 [30] guidelines for the collection of water samples. The water samples were stored in temperature-controlled bags, protected from heat sources and sunlight during transportation to the laboratory.
The following concentrations were determined in the water: N-NO3, N-NH4, P-PO4, Cl, Na, K, Mg, Ca, Fe, Mn, and Zn. The concentrations of nitrogen species and phosphates were measured using a colorimetric method with an automatic flow analyzer from Skalar. Mg, Ca, Fe, Mn, and Zn levels were determined by flame atomic absorption spectrometry; Cl was determined by titration with silver nitrate, whereas Na and K levels were determined by an emission method with the use of SOLAAR (Thermo Elemental Solaar AA Series Spectrometer) atomic absorption spectrometer from Thermo Elemental. Moreover, field tests included the measurement of oxygen content (with the use of multi-parameter Multi 3400 m from WTW (Water Turbines Works), equipped with a Cellox 323 oxygen sensor). Temperature, pH, and specific conductance of water were measured with the use of a HACH (Hach Company) multi-parameter portable meter (HQ40D).

2.3. Control Catches of Fish and Ichthyological Studies

Control catches were performed with the use of gillnets according to the standard of the European Committee for Standardization EN 14,757 [31]. The gillnets were set up once each year of the studies, during the autumn period, at three different sites in each pond, perpendicularly to the shore. Each time they remained in the water for 12 h (i.e., between 19:00 and 7:00). Due to intense growth of macrophytes in the water bodies, an additional catch of fish was conducted, using Electric Fishing Device Type ELT 60 II GI in accordance with the standard CEN (European Committee for Standardization) [32,33], covering each year and in each pond a 100 m long and 3 m wide transect. Thus, the fishing effort was the same for each pond, which allowed comparison of the abundance and biomass of fish caught in particular water bodies.
The caught fish were each time grouped by species, and their abundance and biomass were recorded. The measurements of the fish unit weight were performed on an electronic Axis balance to the nearest 1 g, and body length was measured with the use of a graduated flume to the nearest 1 mm. Fulton’s factor (KF = 100 W TL−3) was calculated in order to evaluate the body condition of the fish [34]. After the activities were completed, all alive fish were released back to the fishing site.

2.4. Biodiversity Indices

Three indices of biological diversity were calculated in the studies: Margalef [35], Shannon, and Simpson indices [36]. The Margalef Index (MRI) was calculated using the following formula:
MRI = (S − 1)/log N
where S—number of all species, N—an abundance of individuals expressed as a percentage.
The Shannon Diversity Index (SHDI) and Simpson’s Index of Diversity (SIDI) were calculated using the formulas:
SHDI = 1 − ∑ pi × ln pi
SIDI = 1 − ∑ pi × pi
where pi—share (proportion) of i species in relation to the total share value of all species in the group.

2.5. Statistical Analyses
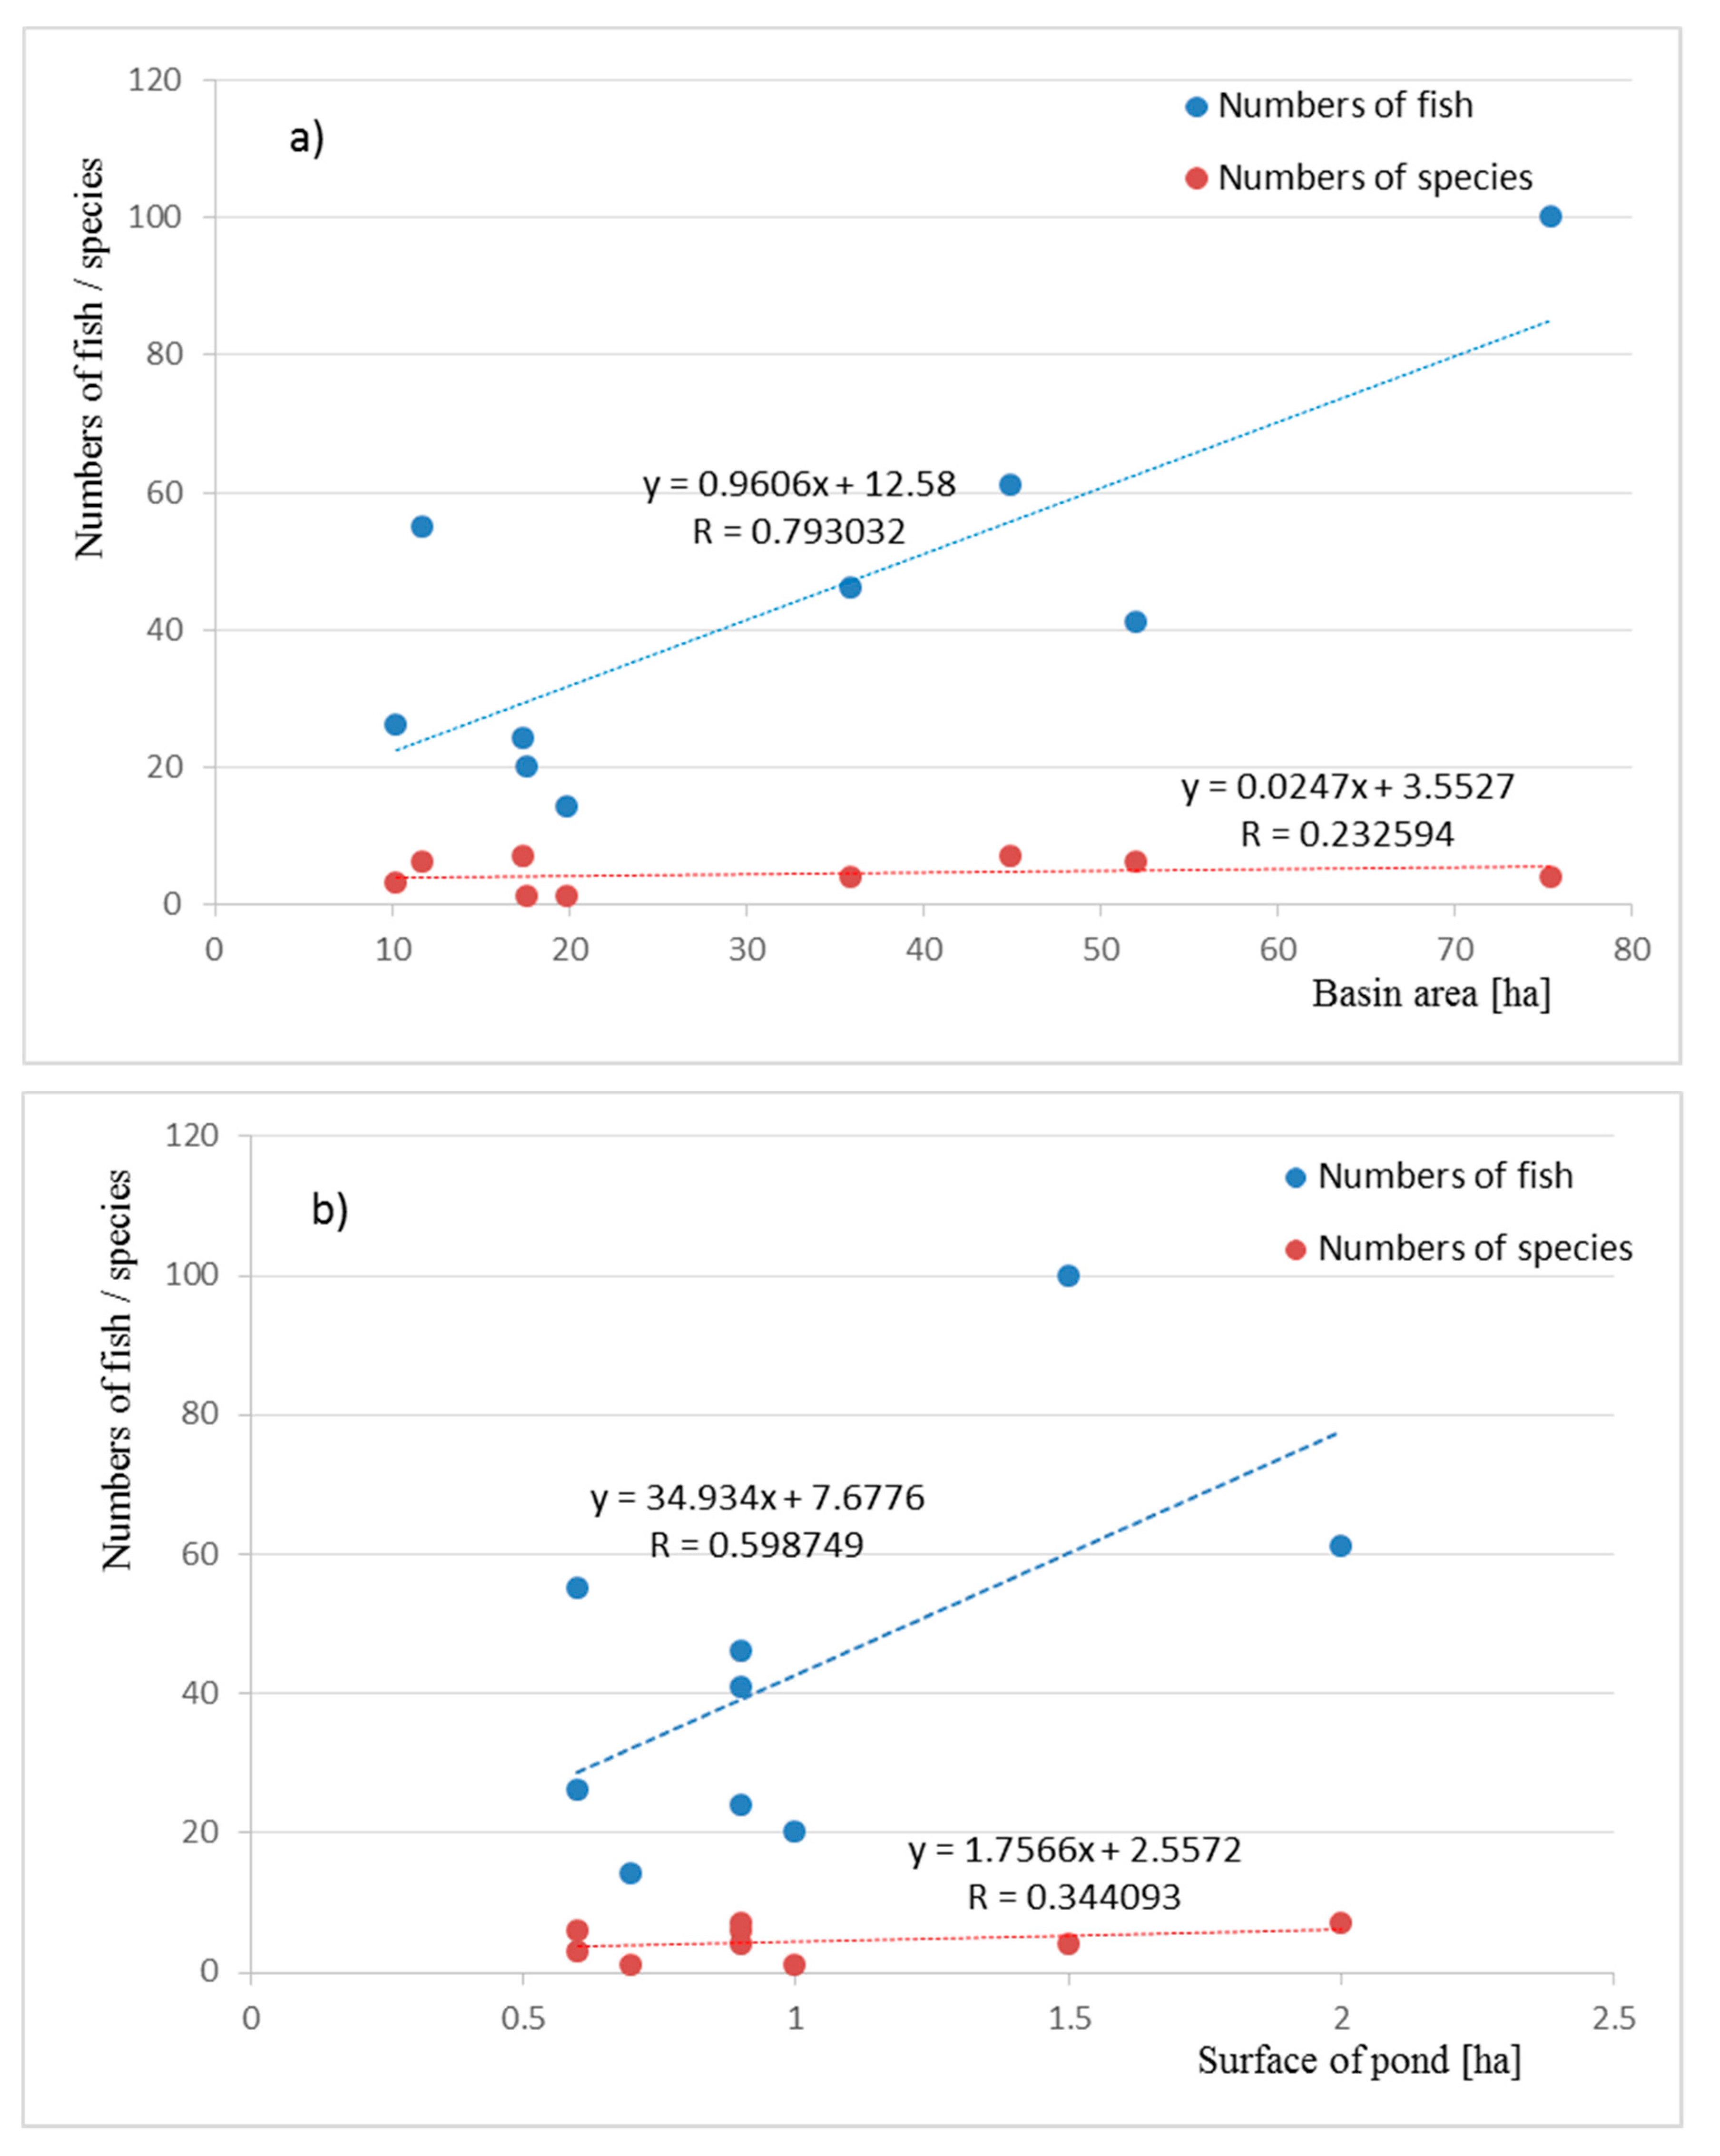
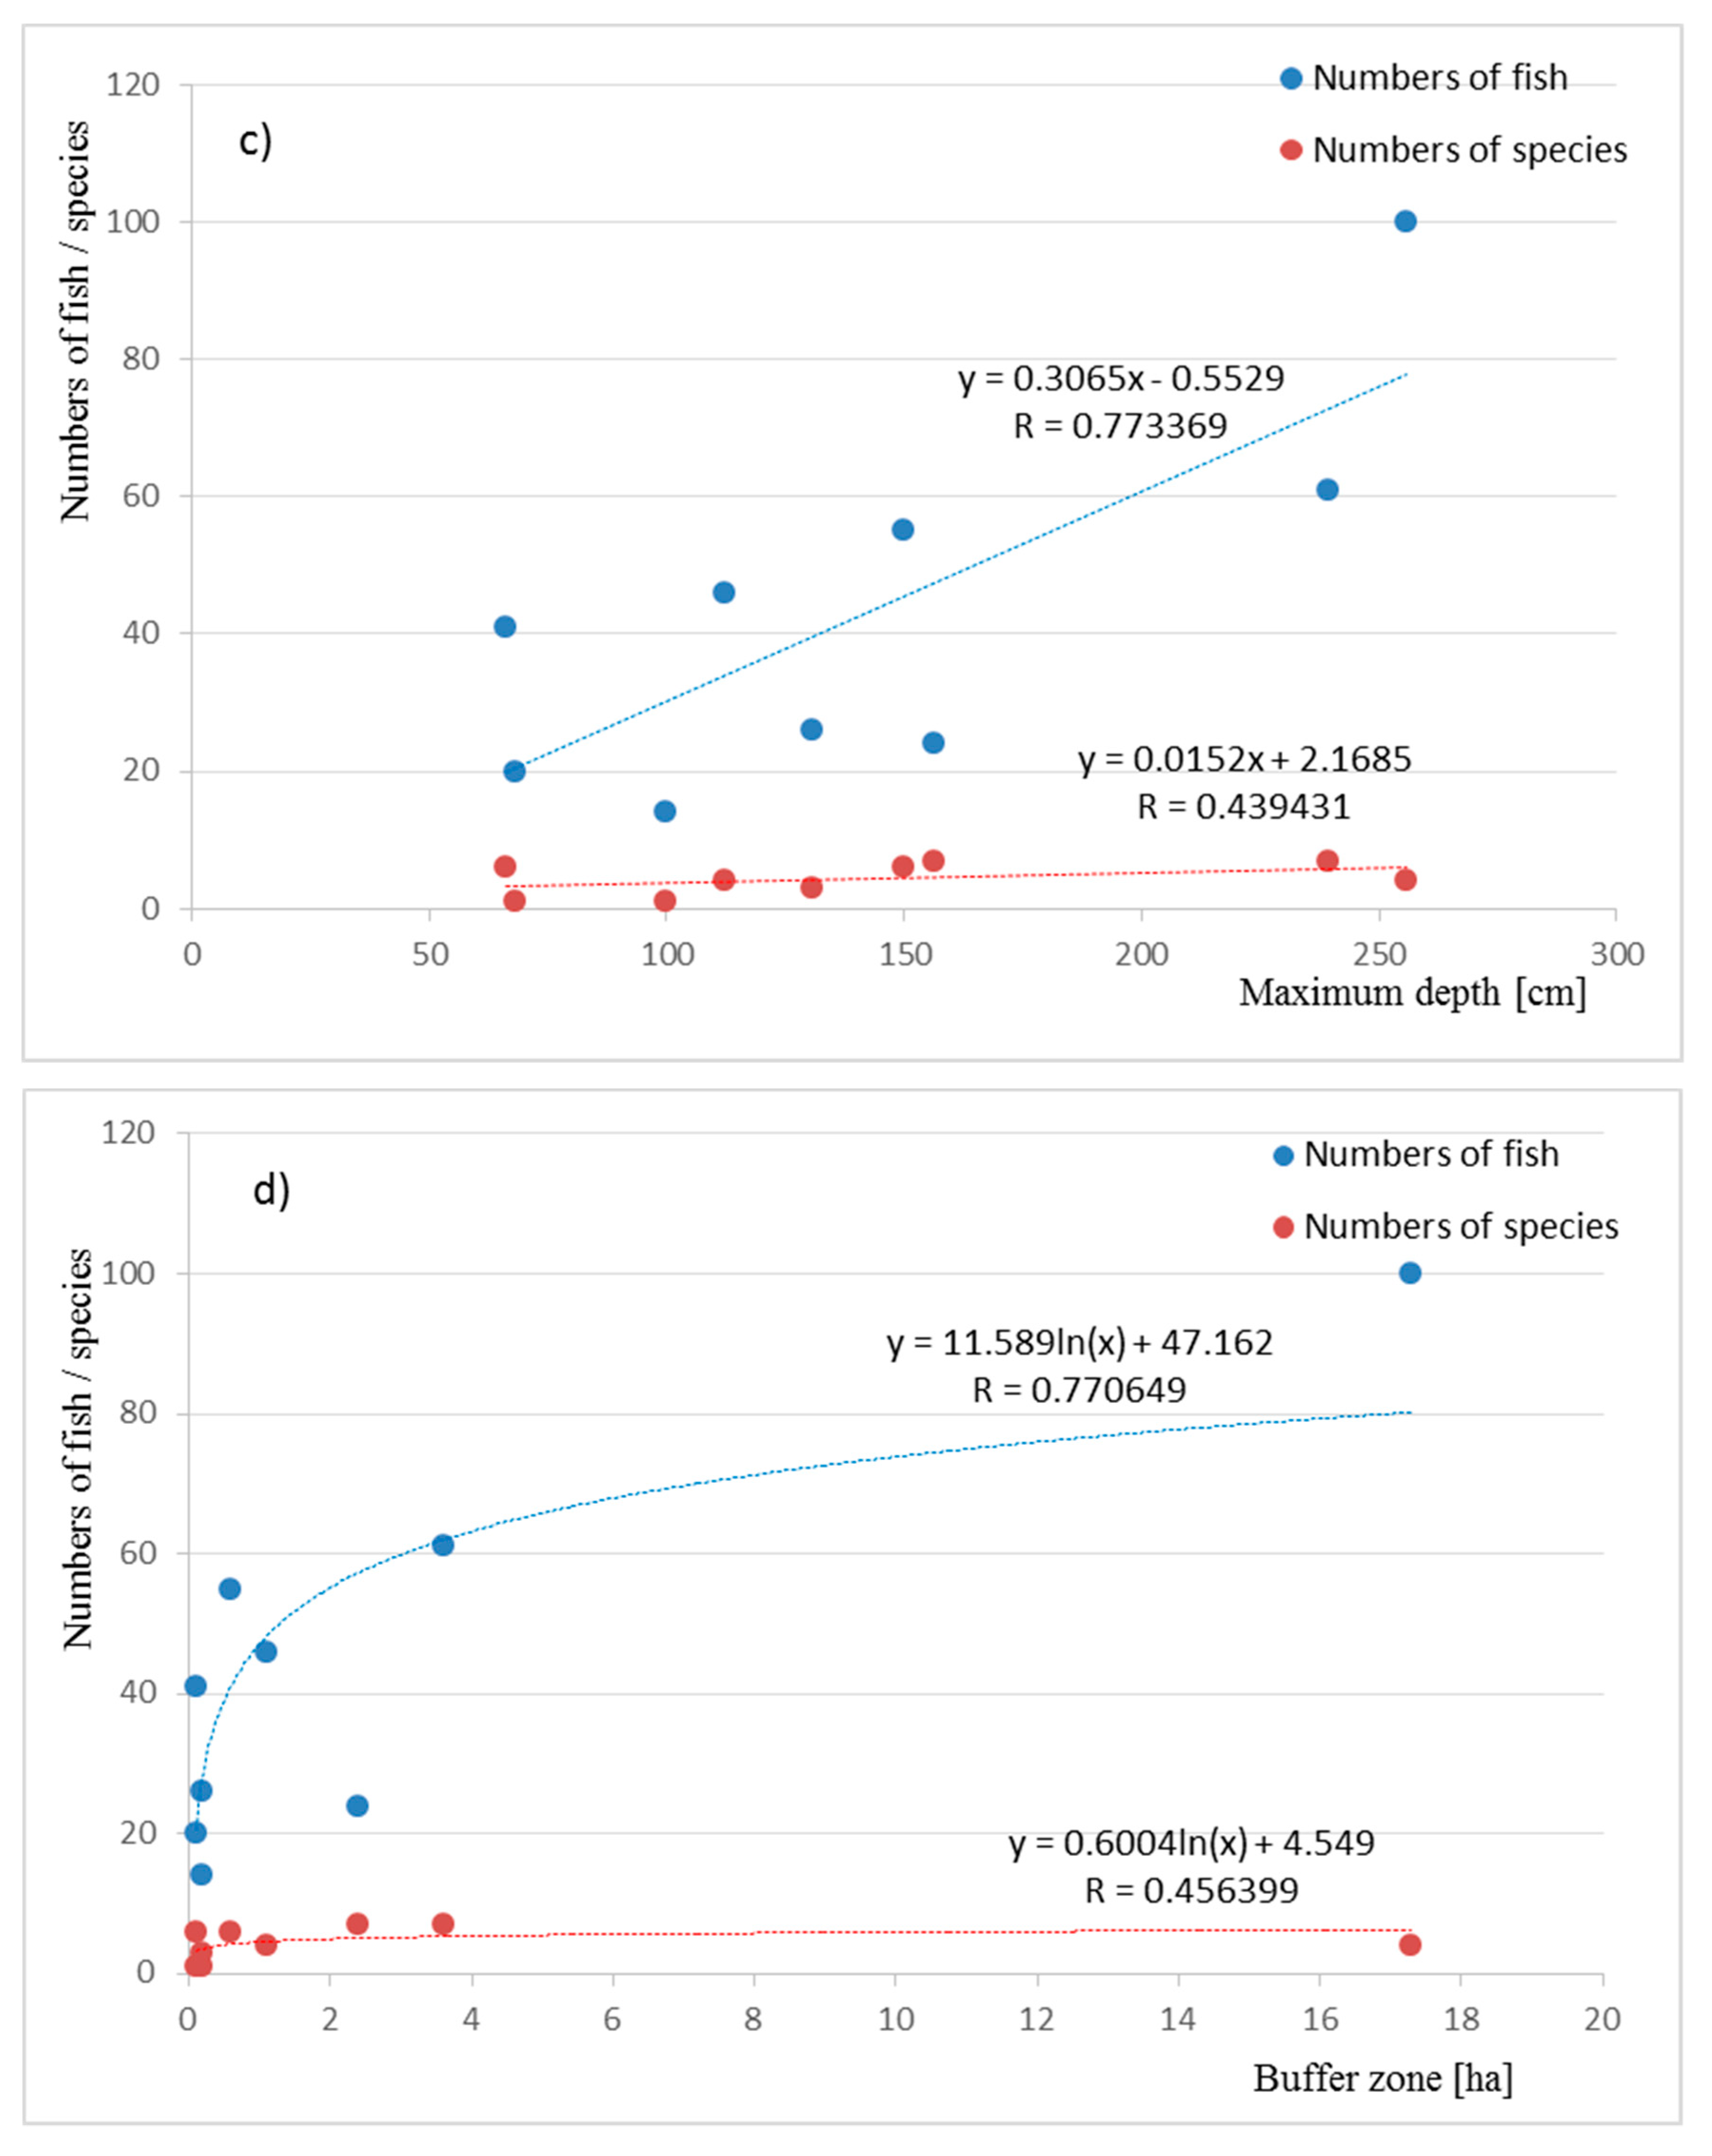
A principal component analysis (PCA) (on standardized data) was applied to reduce the number of environmental variables. Five principal components distinguished by this procedure (see Results) were used as explanatory variables in further analyses.
A canonical correspondence analysis (CCA) was run to determine relationships between species occurrences (abundances of the most frequent species: the crucian carp, tench, European perch, roach, Northern pike, rudd) and environmental factors (five principal components based on 20 raw environmental variables). The data were log-transformed prior to the analysis.
Multiple regression was used to check the relationships between abundances, total lengths, and Fulton indices of particular species (the most frequent ones: crucian carp, tench, European perch, and Northern pike), as well as species richness, and environmental factors (three first principal components). Species parameters were means calculated for each pond. Species richness was the number of species rarefaction for 14 individuals (the lowest number of individuals per pond) to control for differences in sample sizes.
PCA and CCA analyses were carried out using the Vegan 2.5–3 package for the R environment [37]. Multiple regression was run with IBM SPSS 25.0 and rarefaction was conducted in PAST 3.04 [38].
Ward’s Agglomerative Hierarchical Clustering Method was used to determine the similarity of ecological indices at particular study sites [39]. In addition, one-way analysis of variance (ANOVA, p < 0.05) was used to determine statistically significant differences under hydrochemical conditions at particular study sites. Then, a post hoc Tukey’s test (p ≤ 0.05) was used to compare mean parameters in the samples. The above statistical analyses were performed using STATISTICA 13.3 software.

3. Results

All the water bodies selected for the studies were located on agricultural lands with varied basin management and use, and with high differentiation of depth and areas of the waterbodies, which had a potential effect on the values of water’s chemical parameters (Table 1).
Among the nine study water bodies, the most favorable hydrochemical conditions for fish, a low level of plant growth, and the highest mean depth, were observed in the water bodies P_9 and P_7. A contrary situation was observed in the ponds P_2 and P_3 (Table 1).
In the waters of particular water bodies, there were 11 fish species in total (Table 2), among which was the Prussian carp, Carassius gibelio (Bloch, 1782), which was considered an invasive species. Among three fish families found in the study waters, the dominant group with regard to the number of species were cyprinids (nine species), and the groups of esocids and percids included one species each. Due to their habitat in the study waters, eurytopic fish were dominant (eight species), while there were only three species of limnophilic fish. Large amounts of emerged and submerged plants growing in the water bodies favored the development of phytophilic fish (six species). The other fish were phyto-litophilic (four species) and ostracophilic (one species).
Furthermore, the parameters of correlation between the number of fish and number of species in the waterbody versus selected hydrological features (basin area, pond area, buffer zone area, and maximum depth) and the number of macrophytes in the water bodies were determined. Figure 2a–e contains linear and logarithmic trend lines that were selected for their best fit to empirical points. The below analyses showed that abundance and number of fish species in the water bodies were statistically significantly (at p < 0.05) correlated with the number of macrophytes in the water bodies (Figure 2e). The other hydrological parameters were significantly correlated only with the fish abundance in the pond (Figure 2a–d).
The highest values of the Shannon Diversity Index and the lowest values of the Simpson’s Index of Diversity were recorded for the water bodies P_6, P_7, and P_8. These values are related to the highest number of species present and their high abundance (Table 3).
The Margalef Index, determining relative species abundance versus the total number of species and the total number of all individual fish in a given pond reached the highest value in P_8, as well as in P_3 and P_1 (Table 3).
Ward’s agglomerative hierarchical clustering method showed that the highest similarity in the values of ecological indices was seen in the water bodies P_2 and P_4, as well as in P_7 and P_6. The first group of ponds was characterized by the lowest biodiversity of ichthyofauna (according to the Shannon and Simpson indices). The other group had the most favorable values for these parameters. Additionally, significant similarity of these indices was recorded in the water bodies P_8, P_3, and P_1 (Figure 3), which showed the most favorable values of the Margalef Diversity Index.
The PCA distinguished five principal components (PCs), explaining altogether 88% of the total variability in the dataset (Table 4).
PC1 was mostly correlated with conductivity and Mg concentration. PC2 was positively correlated with oxygen concentration and temperature and negatively correlated with PO4 concentration. PC3 was positively correlated with concentrations of Mn, Zn, K, and Cl and negatively correlated with pond area. PC4 was positively correlated with concentrations of Cl and Mg and negatively correlated with K concentration and amount of macrophytes. PC5 was positively correlated with pH, conductivity, and K concentration and negatively correlated with Na concentration.
Due to a relatively constant occurrence of crucian carp, tench, European perch, roach, Northern pike, and rudd, further statistical analysis was based on the analysis of the abiotic indices of these species.
The two CCA axes explained altogether 81% of the total variability of the dataset (Figure 4).
CCA axis 1 associated mostly with PC2 (on the right of the bi-plot) and PC1 and PC4 (on the left). Thus, oxygen concentration, temperature, amount of macrophytes, and K concentration increased, while conductivity and concentrations of PO4, Mg, and Cl decreased along this axis. The crucian carp and tench were associated with the high scores of CCA axis 1, whereas roach and rudd avoided such conditions. CCA axis 2 was related to PC2 (the top of the bi-plot) and PC5 (the bottom). Hence, oxygen concentration, temperature, and Na concentration increased, while conductivity, pH, and concentrations of PO4 and K decreased along this axis. The crucian carp (roach and rudd to a lesser extent) were associated with the high scores of CCA axis 2, whereas the occurrence of tench (European perch and Northern pike to a lesser extent) coincided with low scores along this axis (Figure 4).
Multiple regressions did not reveal any statistically significant relationships between the analyzed environmental variables (principal components 1–3) and fish abundances, lengths, condition indices, and species richness (Table 5).

4. Discussion

In our studies, despite varied abiotic conditions and environmental and hydrochemical parameters, we have observed the presence of fish in all the small ponds studied. Normally, highly eutrophic, small water bodies located in agricultural lands are poor with regard to the number of fish species, but they may be a good place for the creation of artificial fishing ponds [42,43]. Factors limiting species biodiversity include the number of water plants growing in the small water bodies. Macrophytes in ponds are characterized by highly efficient biologic systems, which take up and metabolize nutrients [44]. As shown by regression analyses, the number of fish and species abundance in the pond is associated with the number of macrophytes growing therein. This is also confirmed by the studies of Mitsuoa et al. [45], who showed a negative influence of the excessive amount of macrophytes on the fish populations in the water bodies. However, an absence or small amount of plants may also have a negative impact. It is because macrophytes provide breeding areas, especially for phytophilic fish, which were dominant in the ponds studied, and they also provide shelter against potential predators [46]. Of great importance for fish resources in the ponds are also littoral zones with their trees and reed beds, which provide shading for the bottom, thus increasing biodiversity in the water bodies [47]. Our studies have also revealed a significant correlation between fish abundance and the area of the buffer zone. It must be mentioned here that the size of the buffer zone may limit the inflow of biogenic substances as a result of surface runoff from arable lands [48]. Studies conducted on amphibians showed that the presence of buffer zones around habitats had a significant influence on the increase of animal populations in small ponds [49].
In water bodies, the concentration of nutrients (nitrates, phosphates) depends on the development of biomass. A number of abiotic factors influence water quality. During the vegetation period of plants, the content of various forms of nitrogen and phosphorus changes (usually decreases), while in the autumn and winter it increases as a result of vegetation dying off and decomposition [50,51]. Such a system may be disturbed by an additional inflow of nutrients, which was characteristic of the ponds under study. This can lead to an oxygen deficiency. In the absence of oxygen in the water, nitrates and nitrites are reduced to free nitrogen or nitric oxide (denitrification process). The increase in temperature during the growing season may also accelerate the decomposition of organic substances, reduce the level of oxygen saturation in the water, and at the same time increase the oxygen demand of fish. Fish species that are not sensitive to the lack of oxygen can live in such tanks. Additionally, phosphorus may accumulate in organic and inorganic forms in bottom sediments, which may be released as a result of water mixing (e.g., P_2 and P_3).
A much higher amount of macrophytes in the ponds may be the result of too low a water level and the absence of natural, seasonal changes of water depth (caused by seasonal rainfall) in the water bodies, which has become a global problem [52]. A larger depth of water is usually positively correlated with fish abundance [53] since a higher volume provides more space for a higher number of individuals. In the ponds studied, fish abundance, rather than number of species, was more strongly correlated with the maximum depth of the water bodies. Thus, it may be concluded that the maximum depth itself does not determine species abundances in the fish population, although this factor is often considered important [46]. Depth changes in water bodies and seasonal lack of surface waters have a special importance for mid-field ponds. Studies of Escalera-Vázquez and Zambrano [17] have demonstrated that in the period of habitat drying, a high level of groundwaters is highly important, which, even with high water deficits, may provide sufficiently wet conditions to ensure the survival of certain tolerant species of fish. This primarily refers to closed water bodies were fish migrations are limited. This is true not only for tropical regions since European waters also have fish resistant to low water levels, the cyprinids, e.g., crucian carp [54], which was the most frequently occurring species in the study mid-field ponds.
The low water level in the water bodies is also associated with changes in physico-chemical water parameters, especially oxygenation. Oxygen deficits in water may have a significant influence on changes in the fish species occurrences [55]. This primarily refers to closed water bodies, where the fish have no possibility to escape to other surface waters providing better conditions during seasonal oxygen deficits. During our studies, no oxygen deficits causing fish mortality were recorded in the ponds, but in P_2 (Figure 5) the presence of crucian carp resistant to oxygen deficits was recorded. This may indicate a seasonal drop of oxygen amount in the water below the level tolerated by other fish species [56,57].
The conditions of fish habitats, similar to those in lakes with larger areas, are highly associated with biogenic compounds [58]. Increasing eutrophication of surface waters observed in recent years is caused primarily by a rapid increase in the water phosphorus level. According to Stumm and Stumm-Zollinger [50], 1.0 mg P-PO4 is more dangerous to the ponds than 50–100 mg of organic matter. The study water bodies differed in the water phosphate contents and certain ponds had increased values (e.g., P_3), but these were not significant values as compared to those in artificial fishponds [59].
The results of canonical correspondence analysis demonstrated that the distribution of crucian carp exhibited a positive response to water temperature, a positive response to K, oxygen concentration, and amount of macrophytes and a negative correlation with PO4, Mg, and Cl. Similar results, but in studies conducted on fish in rivers, were obtained by Zhao et al. [60], where the results of principal component analysis and canonical correspondence analysis demonstrated that the distribution of Herzensteinia microcephalus (Herzenstein, 1891) exhibited a positive response to water temperature, a positive response to K, and negative correlation to total phosphorus, as in this study for crucian carp.
Pond waters are also usually rich in nitrogen compounds [61], but also in macro- and micro-elements [10]. Excessive nutrient content in water leads to intense eutrophication, which in consequence causes health deterioration of fish and other organisms living in waters on agricultural lands [51]. This pattern was observed in the study water bodies. For example, increased nitrate or phosphate contents were recorded for P_1, but this was not correlated with a reduced number in fish or their absence. P_8 had the highest contents of nitrates (2.11 mg/dm−3) among the studied ponds, although it also had the highest number of fish species and the most favorable biodiversity indices.
As stated by Fisher and Acreman [62], mid-field ponds may restrict the dispersion of nitrogen loading from agricultural lands to other surface waters. Unfortunately, this causes increased concentration of biogenic substances in these water bodies, which together with partial drying may lead to a reduction of fish resources and ichthyofauna biodiversity. In the era of climate change, it commonly occurs [63] that more and more small water bodies, which just a few years ago were constantly filled with water, become periodically partially dried or are even completely transformed into wetland or disappear from the agricultural landscape [5]. Changes in water levels and periodic drying are important factors for ichthyofauna [17]. In the temperate climate zone, fish do not typically occur in temporary habitats [64], and studies on overflow areas and periodically drying ponds usually focus on invertebrates, amphibians, or birds [15,65]. Current forecasts for climate changes in central Europe predict [66] that these important, natural water bodies may disappear even faster, which will have an impact on the condition and populations of numerous organisms living in the ponds. It must also be emphasized that two small water bodies are characterized by a higher biodiversity than one large pond with the same total area [46,67]. In spite of this, no constant monitoring is conducted in these small ponds and, with a few exceptions, no regulations regarding environmental protection have been introduced [68].
In recent years, a lot of work has been done to restore the water bodies and/or build new, artificial reservoirs [44,69]. Sometimes, to keep them in the environment, renovation of ponds is conducted [70]. As for artificial reservoirs, the conditions developed therein are not always suitable for all the organisms, and some animals are not able to adapt to the new environment. It seems, however, that a better solution is to introduce tools that would protect natural ponds, e.g., to form buffer zones [71] or to recreate ponds by dredging and removing excessive mud from the bottom sediment [44]. Despite negative opinions on the effect of dredging on biodiversity in the aquatic environment, in their studies, Mitsuoa et al. [45] observed positive aspects of remediation works in the form of increased number of fish and oxygenation. Removal of macrophytes and sediment biomass could create habitats with higher oxygen content and could increase water movement [55]. Remediation works in small water bodies should increase fish species diversity and fish resources and also enable using these water bodies for recreational fishing. These works, however, should be done with adequate caution and a broad perspective on the whole biodiversity of animals living in these small ponds. Reed-bed plants and submerged plants are important habitats for various aquatic and land species (e.g., birds, reptiles, and amphibians), whose protection should also be taken into account. Therefore, prior to initiating remediation works, detailed bio-monitoring should be performed in order to improve habitats conditions for all the animals living there.

5. Conclusions

Small, closed water bodies on agricultural lands are an extremely valuable ecological refuge of ichthyofauna biodiversity. Due to their high eutrophication, they include mainly cyprinid fish, tolerant of chemical water conditions. The most frequently occurring species in the study water bodies was crucian carp, for which the most important were high oxygen content, electrical conductivity (EC), large amount of macrophytes in the water bodies, and increased Mg and Cl levels. High affinity for such conditions is also shown by tench. The CCA statistical analysis revealed that the most favorable conditions for the life of crucian carp (the most frequently recorded species in the study water bodies) and tench included increased oxygen concentrations in water, large amounts of macrophytes, and increased potassium level, together with a decrease in phosphate level, specific conductance, and increased contents of magnesium and chlorides. Aside from the hydrochemical parameters, the species occurrences and ichthyofauna abundances were also associated with the morphometric parameters of the ponds (waterbody area, maximum depth) and their basin area as well as, the area of the buffer zone, which served as a filter, catching nutrients flowing from the arable land, and also the amount of macrophytes growing in the water bodies. Due to increasing global warming, these small, mid-field ponds partially dry up, which, paired with lack of human interference, leads to their disappearance, and as a result, habitats for numerous fish species are lost. These reservoirs are characterized by high biodiversity, protected species often occur in them, and the low fishing and angling pressure makes them a refuge for many valuable natural animals.

Author Contributions

Conceptualization, A.B. and P.C.; methodology, A.B. and P.C.; software, A.B., P.C., and M.B.; validation, A.B. and M.B.; formal analysis, A.B., P.C., and M.B.; investigation, A.B., P.C., M.B. resources, A.B., P.C., M.B.; data curation, A.B. and P.C.; writing—original draft preparation, A.B. and P.C.; writing—review and editing, M.B.; visualization, A.B., P.C., and M.B.; supervision, A.B. and M.B.; project administration, A.B., P.C., and M.B.; funding acquisition, A.B., P.C., and M.B. All authors have read and agreed to the published version of the manuscript.

Funding

This research was funded by the Institute of Technology and Life Sciences, Project No. 18/84/2018 and the West Pomeranian University of Technology in Szczecin, Project No. 518-08-056-3186-01/18.

Acknowledgments

We are grateful to the staff of the Municipality of Stare Czarnowo for their constant support that made this study possible. We also thank Ł. Potkański, K. Szydłowski, and K. Rawicki for field assistance.

Conflicts of Interest

The authors declare no conflict of interest.

References

  1. Choiński, A. Katalog Jezior Polski; Wydawnictwo Naukowe UAM: Poznań, Poland, 2013; p. 600. ISBN 83-232-1732-7. (In Polish) [Google Scholar]
  2. Hayashi, M.; van der Kamp, G.; Rudolph, D.L. Water and solute transfer between a prairie wetland and adjacent uplands, 1. Water balance. J. Hydrol. 1998, 207, 42–55. [Google Scholar] [CrossRef]
  3. Fiedler, M.; Antkowiak, M.; Oliskiewicz-Krzywicka, A.; Zbierska, A. Model for the volume-area-depth relations of midfield ponds using LiDAR. J. Ecol. Eng. 2017, 18, 36–42. [Google Scholar] [CrossRef]
  4. Pond Conservation Group. A Future for Britainś Ponds; An Agenda for Action. 1993. Available online: https://www.wildoxfordshire.org.uk/wp-content/uploads/2014/03/Ponds.pdf (accessed on 1 September 2020).
  5. Pieńkowski, P. Disappearance of ponds in the younger Pleistocene landscapes of Pomerania. J. Water Land Dev. 2000, 4, 55–68. [Google Scholar]
  6. van der Kamp, G.; Hayashi, M. Groundwater-wetland ecosystem interaction in the semiarid glaciated plains of North America. Hydrogeol. J. 2009, 17, 203–214. [Google Scholar] [CrossRef]
  7. Céréghino, R.; Boix, D.; Cauchie, H.M.; Martens, K.; Oertli, B. The ecological role of ponds in a changing world. Hydrobiologia 2014, 723, 1–6. [Google Scholar] [CrossRef] [Green Version]
  8. Lewis-Phillips, J.; Brooks, S.; Sayer, C.D.; McCrea, R.; Siriwardena, R.; Axmacher, J.C. Pond management enhances the local abundance and species richness of farmland bird communities. Agric. Ecosyst. Environ. 2019, 273, 130–140. [Google Scholar] [CrossRef]
  9. Juszczak, R.; Kędziora, A.; Olejnik, J. Assessment of water retention capacity of small ponds in Wyskoć agricultural-forest catchment in western Poland. Pol. J. Environ. Stud. 2007, 16, 685–695. [Google Scholar]
  10. Brysiewicz, A.; Wesołowski, P.; Bonisławska, M. Content of selected macro- and microelements in surface water of in-field ponds and in groundwater from adjacent agricultural areas. J. Elem. 2019, 24, 207–219. [Google Scholar] [CrossRef]
  11. Matthews, J.H. Anthropogenic climate change impacts on ponds: A thermal mass perspective. In: Ott, J. (Ed) Monitoring Climatic Change with Dragonflies. BioRisk 2010, 5, 193–209. [Google Scholar] [CrossRef] [Green Version]
  12. Biggs, J.; von Fumetti, S.; Kelly-Quinn, M. The importance of small waterbodies for biodiversity and ecosystem services: Implications for policy makers. Hydrobiologia 2017, 793, 3–39. [Google Scholar] [CrossRef]
  13. Riley, W.D.; Potter, E.C.E.; Biggs, J.; Collins, A.L.; Jarvie, H.P.; Jones, J.I.; Kelly-Quinn, M.; Ormerod, S.J.; Sear, D.A.; Wilby, R.L.; et al. Small water bodies in Great Britain and Ireland: Ecosystem function, human-generated degradation, and options for restorative action. Sci. Total Environ. 2018, 645, 1598–1616. [Google Scholar] [CrossRef] [PubMed]
  14. Pechmann, J.H.K.; Estes, R.A.; Scott, D.E.; Whitfield Gibbons, J. Amphibian colonization and use of ponds created for trial mitigation of wetland loss. Wetlands 2001, 21, 93–112. [Google Scholar] [CrossRef]
  15. Kuczyńska-Kippen, N.; Joniak, T. Zooplankton diversity and macrophyte biometry in shallow water bodies of various trophic state. Hydrobiologia 2016, 774, 39–51. [Google Scholar] [CrossRef] [Green Version]
  16. Prasad, A.G.D.; Venkataramana, G.V.; Thomas, M. Fish diversity and its conservation in major wetlands of Mysore. J. Environ Biol. 2009, 30, 713–718. [Google Scholar]
  17. Escalera-Vázquez, L.; Zambrano, L. The effect of seasonal variation in abiotic factors on fish community structure in temporary and permanent pools in a tropical wetland. Freshwater Biol. 2010, 55, 2557–2569. [Google Scholar] [CrossRef]
  18. Cymes, I.; Cymes, I.; Dragańska, E.; Szymczyk, S. The influence of weather conditions on mid-field ponds situated in a reclaimed area in Sępopolska Plain. Oceanol. Hydrobiol. Stud. 2010, 39, 75–84. [Google Scholar] [CrossRef]
  19. Rechulicz, J.; Tarkowska-Kukuryk, M.; Pęczuła, W.; Mieczan, T. Fish community and productivity as an index of trophic state diversity in two shallow lakes. TEKA Comm. Prot. Form. Nat. Environ. 2012, 9, 181–191. [Google Scholar]
  20. Cuvin-Aralar, M.L.A. Impacts of aquaculture on fish biodiversity in the freshwater lake Laguna de Bay, Philippines. Lakes Reserv. Res. Manag. 2016, 21, 31–39. [Google Scholar] [CrossRef]
  21. Glińska-Lewczuk, K.; Burandt, P.; Kujawa, R.; Kobus, S.; Obolewski, K.; Dunalska, J.; Grabowska, M.; Lew, S.; Chormański, J. Environmental Factors Structuring Fish Communities in Floodplain Lakes of the Undisturbed System of the Biebrza River. Water 2016, 8, 146. [Google Scholar] [CrossRef] [Green Version]
  22. Downing, J.A. Emerging global role of small lakes and ponds: Little things mean a lot. Limnetica 2010, 29, 9–24. [Google Scholar] [CrossRef]
  23. Juszczak, R.; Kędziora, A. Threats to and deterioration of small water reservoirs located within Wyskoć catchment. Pol. J. of Environ. Stud. 2003, 12, 567–573. [Google Scholar]
  24. Wolnicki, J.; Kamiński, R.; Sikorska, J. Occurrence, threats and active protection of the lake minnow, Eupallasella percnurus (Pall.), in Mazowieckie Voivodeship in Poland. Arch. Pol. Fish. 2011, 19, 209–216. [Google Scholar] [CrossRef]
  25. Directive 92/43/EEC of 21 May 1992 on the Protection of Natural Habitats and Wild Fauna and Flora. Available online: https://natura2000.gdos.gov.pl/files/artykuly/42646/DyrektywaSiedliskowa.pdf (accessed on 1 September 2020).
  26. de la Hoz Franco, E.A.; Budy, P. Effects of biotic and abiotic factors on the distribution of trout and salmon along a longitudinal stream gradient. Environ. Biol. Fish. 2005, 72, 379–391. [Google Scholar] [CrossRef]
  27. Mahavadiya, D.; Sapra, D.; Rathod, V.; Sarman, V. Effect of biotic and abiotic factors in feeding activity in teleost fish: A review. J. Entomol. Zool. Stud. 2018, 6, 387–390. [Google Scholar]
  28. Woods, T.; McGarvey, D.J. Assessing the relative influences of abiotic and biotic factors on American eel Anguilla rostrata distribution using hydrologic, physical habitat, and functional trait data. Ecography 2018, 41, 2067–2079. [Google Scholar] [CrossRef] [Green Version]
  29. Mioduszewski, W. Protection of water quality in the lake situated on the agricultural area. J. Water Land Dev. 2015, 26, 65–71. [Google Scholar] [CrossRef]
  30. ISO 5667-24: 2016. Water Quality—Sampling—Part 24: Guidance on the Auditing of Water Quality Sampling; ISO: Geneva, Switzerland, 2016.
  31. European Committee for Standardisation EN 14757: 2005 (E) Water Quality—Sampling of Fish with Multi-Mesh Gillnets; European Committee for Standardisation: Brussels, Belgium, 2005.
  32. CEN—EN 14011, Water Quality—Sampling of Fish with Electricity; European Committee for Standardization: Brussel, Belgien, 2003.
  33. PN-EN 14011 Jakość Wody—Pobieranie Próbek ryb z Zastosowaniem Elektryczności; Polski Komitet Normalizacyjny (PKN): Warszawa, Ploand, 2006. (In Polish)
  34. Nyeste, K.; Kati, S.; Nagy, S.A.; Antal, L. Growth features of the Amur sleeper, Perccottus glenii (Actinopterygii: Perciformes: Odontobutidae), in the invaded Carpathian Basin, Hungary. Acta Ichthyol. Piscat. 2017, 47, 33–40. [Google Scholar] [CrossRef] [Green Version]
  35. Rahman, B.; Sazedul, H.Z.; Rahman, M.; Nahar, A. Exploration of fishing gear and fisheries diversity of Agunmukha River at Galachipa Upazila in Patuakhali District of Bangladesh. Iran. J. Fish. Sci. 2017, 16, 108–126. [Google Scholar]
  36. Nagendra, H. Opposite trends in response for the Shannon and Simpson indices of landscape diversity. Appl. Geogr. 2002, 22, 175–186. [Google Scholar] [CrossRef]
  37. Oksanen, J.; Blanchet, F.G.; Friendly, M.; Kindt, R.; Legendre, P.; McGlinn, D.; Minchin, P.R.; O’Hara, R.B.; Simpson, G.L.; Solymos, P.; et al. Vegan: Community Ecology Package. R Package Version 2.5–3. 2018. Available online: https://cran.r-project.org/web/packages/vegan/vegan.pdf (accessed on 1 September 2020).
  38. Hammer, Ø.; Harper, D.A.T.; Ryan, P.D. PAST: Paleontological Statistics software package for education and data analysis. Paleontol. Electr. 2001, 4, 1–9. [Google Scholar]
  39. Murtagh, F.; Legendre, P. Ward’s Hierarchical Agglomerative Clustering Method: Which Algorithms Implement Ward’s Criterion? J. Classif. 2014, 31, 274–295. [Google Scholar] [CrossRef] [Green Version]
  40. Schiemer, F.; Waidbacher, H. Strategies of conservation of a Danubian fish fauna. In River Conservation and Management; Boon, P.J., Calow, P., Petts, G.E., Eds.; Wiley: London, UK, 1992; pp. 365–382. [Google Scholar]
  41. Balon, E.K. Epigenesis of an epigeneticist: The development of some alternative concepts on the early ontogeny and evolution of fishes. Guelph. Ichthyol. Rev. 1990, 1, 1–48. [Google Scholar]
  42. Mioduszewski, W. Small (natural) water retention in rural areas. J. Water Land Dev. 2014, 20, 19–29. [Google Scholar] [CrossRef] [Green Version]
  43. Davis, A.M.; Moore, A.R. Conservation potential of artificial water bodies for fish communities on a heavily modified agricultural floodplain. Aquat. Conserv. 2016, 26, 1184–1196. [Google Scholar] [CrossRef]
  44. Gałczyńska, M.; Mańkowska, N.; Milke, J.; Buśko, M. Possibilities and limitations of using Lemna minor, Hydro-charis morsus-ranae and Ceratophyllum demersum in removing metals with contaminated water. J. Water Land Dev. 2019, 40, 161–173. [Google Scholar] [CrossRef]
  45. Mitsuoa, Y.; Tsunodab, H.; Kozawac, G.; Yuma, M. Response of the fish assemblage structure in a small farm pond to management dredging operations. Agric. Ecosyst. Environ. 2014, 188, 93–96. [Google Scholar] [CrossRef]
  46. Ye, S.; Li, Z.; Lek-Ang, S.; Feng, G.; Lek, S.; Cao, W. Community structure of small fishes in a shallow macrophytic lake (Niushan Lake) along the middle reach of the Yangtze River, China. Aquat. Living Resour. 2006, 19, 349–359. [Google Scholar] [CrossRef]
  47. Gee, J.H.R.; Smith, B.D.; Lee, K.M.; Griffiths, S.W. The ecological basis of freshwater pond management for biodiversity. Aquat. Conserv. 1997, 7, 91–104. [Google Scholar] [CrossRef]
  48. Bhagowati, B.; Ahamad, K.A. A review on lake eutrophication dynamics and recent developments in lake modeling. Ecohydrol. Hydrobiol. 2019, 19, 155–166. [Google Scholar] [CrossRef]
  49. Puglis, H.J.; Boone, M.D. Effects of terrestrial buffer zones on amphibians on golf courses. PLoS ONE 2012, 7, e39590. [Google Scholar] [CrossRef] [PubMed]
  50. Stumm, W.; Stumm-Zollinger, E. The role of phosphorus in eutrofication. In Water Pollution Microbiology; Mitchel, R., Ed.; Wiley-Interscience: New York, NY, USA; London, UK; Toronto, ON, Canada, 1972. [Google Scholar]
  51. Chen, R.; Deng, M.; He, X.; Hou, J. Enhancing Nitrate Removal from Freshwater Pond by Regulating Carbon/Nitrogen Ratio. Front Microbiol. 2017, 8, 1712. [Google Scholar] [CrossRef] [Green Version]
  52. Boers, A.M.; Zedler, J.B. Stabilized water levels and Typha invasiveness. Wetlands 2008, 28, 676–685. [Google Scholar] [CrossRef]
  53. Brooks, B.W.; Chambliss, C.K.; Stanley, J.K.; Ramirez, A.; Banks, K.E.; Johnson, R.D.; Lewis, R.J. Determination of select antidepressants in fish from an effluent-dominated stream. Environ. Toxicol. Chem. 2005, 24, 464–469. [Google Scholar] [CrossRef]
  54. Stensløkken, K.-O.; Ellefsen, S.; Vasieva, O.; Fang, Y.; Farrell, A.P.; Olohan, L.; Vaage, J.; Nilsson, G.E.; Cossins, A.R. Life without Oxygen: Gene Regulatory Responses of the Crucian Carp (Carassius carassius) Heart Subjected to Chronic Anoxia. PLoS ONE 2014, 9, e109978. [Google Scholar] [CrossRef] [Green Version]
  55. Killgore, K.J.; Hoover, J.J. Effects of hypoxia on fish assemblages in a vegetated waterbody. J. Aquat. Plant Manag. 2001, 39, 40–44. [Google Scholar]
  56. Van Landeghem, M.; Wahl, D.H.; Suski, C.D. Physiological responses of largemouth bass to acute temperature and oxygen stressors. Fish. Manag. Ecol. 2010, 17, 414–425. [Google Scholar] [CrossRef]
  57. Bunch, A.J.; Allen, M.S.; Gwinn, D.C. Influence of macrophyte-induced hypoxia on fish communities in lakes with altered hydrology. Lake Reserv. Manag. 2015, 31, 11–19. [Google Scholar] [CrossRef]
  58. Tammi, J.; Lappalainen, A.; Mannio, J.; Rask, M.; Vuorenmaa, J. Effects of eutrophication on fish and fisheries in Finnish lakes: A survey based on random sampling. Fish Manag. Ecol. 1999, 6, 173–186. [Google Scholar] [CrossRef]
  59. Kolasa-Jamińska, B. The intensification of pond fish production and the magnitude of the waste load discharged during autumn harvesting. Arch. Pol. Fish. 2002, 10, 187–205. [Google Scholar]
  60. Zhao, L.; Li, W.; Lin, L.; Guo, W.; Zhao, W.; Tang, X.; Gong, D.; Li, Q.; Xu, P. Field investigation on river hydrochemical characteristics and larval and juvenile fish in the source region of the Yangtze River. Water 2019, 11, 1342. [Google Scholar] [CrossRef] [Green Version]
  61. Steidl, J.; Kalettka, T.; Bauwe, A. Nitrogen retention efficiency of a surface-flow constructed wetland receiving tile drainage water: A case study from north-eastern Germany. Agric. Ecosyst. Environ. 2019, 283, 106577. [Google Scholar] [CrossRef]
  62. Fisher, J.; Acreman, M.C. Wetland nutrient removal: A review of the evidence. Hydrol. Earth Syst. Sci. 2004, 8, 673–685. [Google Scholar] [CrossRef] [Green Version]
  63. Jones, J.; Brett, M.T. Lake Nutrients, Eutrophication, and Climate Change. Global Environmental Change; Springer: Berlin/Heidelberg, Germany, 2014; pp. 273–279. [Google Scholar] [CrossRef]
  64. Drenner, S.M.; Dodson, S.I.; Drenner, R.W.; Pinder, J.E., III. Crustacean zooplankton community structure in temporary and permanent grassland ponds. Hydrobiologia 2009, 632, 225–233. [Google Scholar] [CrossRef]
  65. Chase, J.M.; Knight, T.M. Drought-induced mosquito outbreaks in wetlands. Ecol. Lett. 2003, 6, 1017–1024. [Google Scholar] [CrossRef] [Green Version]
  66. Bastin, J.; Clark, E.; Elliott, T.; Hart, S.; Hoogen, J.V.D.; Hordijk, I.; Ma, H.; Majumder, S.; Manoli, G.; Maschler, J.; et al. Understanding climate change from a global analysis of city analogues. PLoS ONE 2019, 14, e0217592. [Google Scholar] [CrossRef] [Green Version]
  67. Oertli, B.; Joye, D.A.; Castella, E.; Juge, R.; Cambin, D.; Lachavanne, L.-B. Does size matter? The relationship between pond area and biodiversity. Biol. Conserv. 2002, 104, 59–70. [Google Scholar] [CrossRef] [Green Version]
  68. Williams, P.; Whitfield, M.; Biggs, J.; Bray, S.; Fox, G.; Nicolet, P.; Sear, D. Comparative biodiversity of rivers, streams, ditches and ponds in an agricultural landscape in Southern England. Biol. Conserv. 2003, 115, 329–341. [Google Scholar] [CrossRef]
  69. Fuentes-Rodri’Guez, F.; Juan, M.; Gallego, I.; Lusi, M.; Fenoy, E.; Leon, D.; Penalver, P.; Toja, J.; Casas, J. Diversity in Mediterranean farm ponds: Trade-offs and synergies between irrigation modernization and biodiversity conservation. Freshw. Biol. 2013, 58, 63–78. [Google Scholar] [CrossRef]
  70. Widelska, E.; Walczak, W. Restoration of ponds in the municipal park in Zduńska Wola, Poland. J. Water Land Dev. 2020, 44, 151–157. [Google Scholar] [CrossRef]
  71. Sawatzky, M.E.; Martin, A.E.; Fahrig, L. Landscape context is more important than wetland buffers for farmland amphibians. Agric. Ecosyst. Environ. 2019, 269, 97–106. [Google Scholar] [CrossRef]
Figure 1. Location of small ponds on the area of Pobrzeże Szczecińskie (N-W Poland).
Water 12 02674 g001
Figure 2. Correlations between the number of fish and the number of fish species versus: (a) basin area, (b) pond area, (c) mean depth, (d) buffer zone area, and (e) amount of macrophytes.
Water 12 02674 g002aWater 12 02674 g002bWater 12 02674 g002c
Figure 3. Ward’s agglomerative hierarchical clustering method phenogram for comparing ecological indices (Margalef, Shannon, Simpson indices) among nine ponds. P1–P9: designation of nine tested small, mid-field water bodies.
Water 12 02674 g003
Figure 4. Canonical correspondence analysis showing relationships between fish species abundances and environmental factors coded as five PCA components.
Water 12 02674 g004
Figure 5. Example of water bodies; P_2 intensively overgrowing with rush vegetation and periodically drying up in summer.
Water 12 02674 g005
Table 1. Morphometric and physicochemical characteristics of ponds.
PondP_1 P_2 P_3 P_4 P_5 P_6 P_7 P_8 P_9
ParameterMeanSDMeanSDMeanSDMeanSDMeanSDMeanSDMeanSDMeanSDMeanSD
Surface of the pond (ha)0.93 a0.171.03 a0.120.92 a0.060.72 b0.080.63 b0.120.63 b0.091.97c0.050.87 ab0.171.53 c0.12
Water depth (cm)112.14 bc18.9068.33 a12.8766.29 a18.09100.00 b11.55130.71 cd8.86150.00 de13.54239.29 f7.87156.43 e11.07255.71 f21.88
Macrophyte coverage (%)31.33 b4.7962.70 d11.3747.84 c1.5163.86 d13.7337.54 bc1.8424.11 ab1.7813.76 a2.3636.13 b2.3118.20 a5.07
Temperature (°C)16.11a5.4515.84 a6.4116.32 a6.5919.16 a2.6019.54 a3.3516.19 a4.0917.13 a4.0517.00 a4.0217.22 a4.06
Conductivity (μS/cm)406.00 c28.44446.00 c49.70128.57 a54.30134.29 a15.38246.43 b24.28467.86 c33.34575.14 d93.71527.71 cd76.29288.57 b23.97
Saturation oxygen (%)86.87 b24.0915.62 a6.9128.47 a14.3697.17 b14.3182.19 b15.9681.13 b14.4673.19 b14.9174.81 b12.7882.11 b15.58
pH7.91 d0.107.50 bcd0.316.93 a0.157.14 ab0.157.21 ac0.217.51 bc0.247.38 bc0.287.35 bcd0.207.62 d0.34
Nitrates (mg ·dm−3)0.91 b0.030.06 a0.010.10 a0.020.33 ab0.140.31 ab0.130.63 ab0.340.69 ab0.512.11 c0.780.45 ab0.36
Ammonium (mg ·dm−3)0.56 bc0.250.10 a0.070.11 a0.060.88 c0.360.54 bc0.100.33 ab0.100.31 ab0.170.36 ab0.250.25 ab0.13
Phosphates (mg ·dm−3)0.48 bc0.360.49 c0.390.56 c0.320.06 ab0.020.05 a0.030.06 ab0.040.31 ac0.380.10 ac0.040.02 a0.02
Cl (mg ·dm−3)50.61 e8.6242.77 d4.309.59 a5.864.46 a0.6427.50 c4.6543.54 de3.1631.90 c1.0129.06 c1.0019.75 b2.13
Na (mg ·dm−3)10.58 bd2.6911.44 cd7.943.76 a2.674.69 ab0.747.81 ad1.2415.71 d3.2113.21 d3.2010.96 d2.298.04 abc1.69
K (mg·dm−3)18.18 d1.607.48 b2.857.47 b1.661.27 a0.437.44 b1.2812.54 c1.332.94 a0.472.46 a0.762.79 a0.73
Mg (mg ·dm−3)9.26 bc2.3511.52 cd2.642.18 a1.962.00 a0.506.98 b0.6711.83 cd0.8713.41 d0.6413.45 d1.7111.18 cd0.60
Ca (mg ·dm−3)44.56 bd15.8466.24 d7.3510.73 a4.3016.90 ab2.4328.66 ab9.3628.62 ab7.4844.70 bcd21.1749.40 cd30.1046.89 cd25.35
Fe (mg ·dm−3)0.23 bc0.020.06 ac0.060.46 d0.330.15 a0.060.31 d0.130.03 ab0.010.01 a0.010.09 a0.060.01 a0.01
Mg (mg ·dm−3)0.06 a0.020.01 a0.010.02 a0.030.05 a0.020.31 b0.250.07 a0.080.03 a0.020.03 a0.020.03 a0.03
Zn (mg ·dm−3)0.01 a0.000.01 a0.010.01 a0.000.02 a0.010.02 a0.010.02 a0.010.01 a0.000.02 a0.010.01 a0.01
P1–P9: designation of nine (9) tested small, mid-field water bodies. The mean values designated with the same letter in the table line do not show a statistically significant difference (ANOVA, Tukey’s test).
Table 2. Composition of ichthyofauna with regard to species in the study waters of small ponds.
SpeciesPreferences Habitat [40]Breeding Groups [41]Numbers of Ponds in Which Fish Were FoundConservation Status *
Percidae
European perch (Perca fluviatilis L., 1758)EurytopicPhyto-litophilicP_1, P_3, P_5, P_6, P_7, P_8-
Esocidae
Northern pike (Esox lucius L., 1758)EurytopicPhytophilicP_1, P_3, P_6, P_7, P_8, P_9-
Cyprinidae
Crucian carp (Carassius carassius L., 1758)LimnophilicPhytophilicP_1, P_3, P_4, P_5, P_7, P_8, P_9-
Prussian carp (Carassius gibelio Bloch, 1782)EurytopicPhytophilicP_2, P_3-
Tench (Tinca tinca L., 1758)LimnophilicPhytophilicP_1, P_3, P_5, P_8, P_9-
European bitterling (Rhodeus amarus Bloch, 1782)EurytopicOstracophilicP_7PP; H2; B3
Freshwater bream (Abramis brama L., 1758)EurytopicPhyto-litophilicP_6, P_8-
White bream (Blicca bjoerkna L., 1758)EurytopicPhyto-litophilicP_6, P_7-
Roach (Rutilus rutilus L., 1758)EurytopicPhyto-litophilicP_3, P_6, P_7, P_8-
Rudd (Scardinius erythrophthalmus L., 1758)EurytopicPhytophilicP_6, P_7, P_8-
Belica (Leucaspius delineatus Heckel, 1843)LimnophilicPhytophilicP_9B3
P1–P9: designation of nine tested small, mid-field water bodies. * Conservation status: PP—partial protection—in accordance with a Polish Regulation of the Minister of the Environment of 16th December 2016 on the protection of animal species; H2—species covered by Annex II to the Habitats Directive (92/43/EEC); B3—species covered by Annex III to the Bern Convention.
Table 3. Species composition, fish abundance, and assessment of the ponds with the use of biodiversity indices.
Index P_1P_2P_3P_4P_5P_6P_7P_8P_9
Number of Fish4620411426556124100
Number of species416136774
Margalef1.800.771.860.871.411.721.682.111.00
Shannon0.510.000.510.000.190.740.710.670.38
Simpson0.311.000.451.000.780.180.200.230.55
P1–P9: designation of nine tested small, mid-field water bodies.
Table 4. PCA variable loadings indicating correlations of variables with particular principal components obtained in PCA. Variables with absolute loadings >0.3 are indicated with asterisks (*).
PC1PC2PC3PC4PC5
Eigenvalues7.764.492.711.471.23
Percentage38.8022.413.57.306.20
Surface of the pond0.21−0.01−0.40 *−0.23−0.16
Buffer zone0.290.22−0.07−0.120.23
Dist. to fields 0.250.20−0.170.17−0.15
Water depth0.250.25−0.210.24−0.19
pH0.26−0.060.250.140.35 *
Conductivity0.31 *−0.060.11−0.150.30 *
Saturation oxygen0.050.39 *0.19−0.23−0.11
Temperature –0.170.37 *0.01−0.12−0.37 *
Nitrates 0.180.170.11−0.240.11
Ammonium−0.120.3090.220.21−0.11
Phosphates−0.04−0.42 *−0.07−0.250.14
Cl0.23−0.190.39 *0.36 *0.03
Na0.28−0.060.24−0.01−0.27
K0.03−0.230.44 *−0.39 *0.49 *
Mg0.34 *−0.010.060.38 *−0.05
Ca0.27−0.130.02−0.100.07
Fe−0.27−0.100.06−0.110.18
Mg−0.120.200.31 *−0.04−0.10
Zn−0.160.270.280.08−0.24
Macrophyte−0.25−0.140.02−0.34 *0.20
Table 5. Multiple regression analysis between environmental variables and abundances, lengths, and Fulton index for the most abundant ichthyofauna species in the examined small ponds.
dfMSFP
AbundanceCrucian carp Model3106.962.520.17
Error542.40
TenchModel38.770.210.88
Error541.54
European PerchModel344.100.410.76
Error5108.92
Northern PikeModel311.400.650.62
Error517.61
Total lengthCrucian carpModel398.901.820.32
Error354.32
TenchModel384.130.230.87
Error1370.33
European PerchModel382.584.180.20
Error219.74
Northern PikeModel365.770.180.90
Error2366.51
Fulton indexCrucian carpModel30.010.030.99
Error30.23
TenchModel30.101.110.59
Error10.09
European PerchModel30.077.650.12
Error20.01
Northern Pike
Model30.010.740.62
Error20.01
Species richnessModelModel32.130.570.66
Error53.71

