Seasonal and Inter-Annual Variability of Groundwater and Their Responses to Climate Change and Human Activities in Arid and Desert Areas: A Case Study in Yaoba Oasis, Northwest China


Abstract
:1. Introduction
2. Materials and Methods
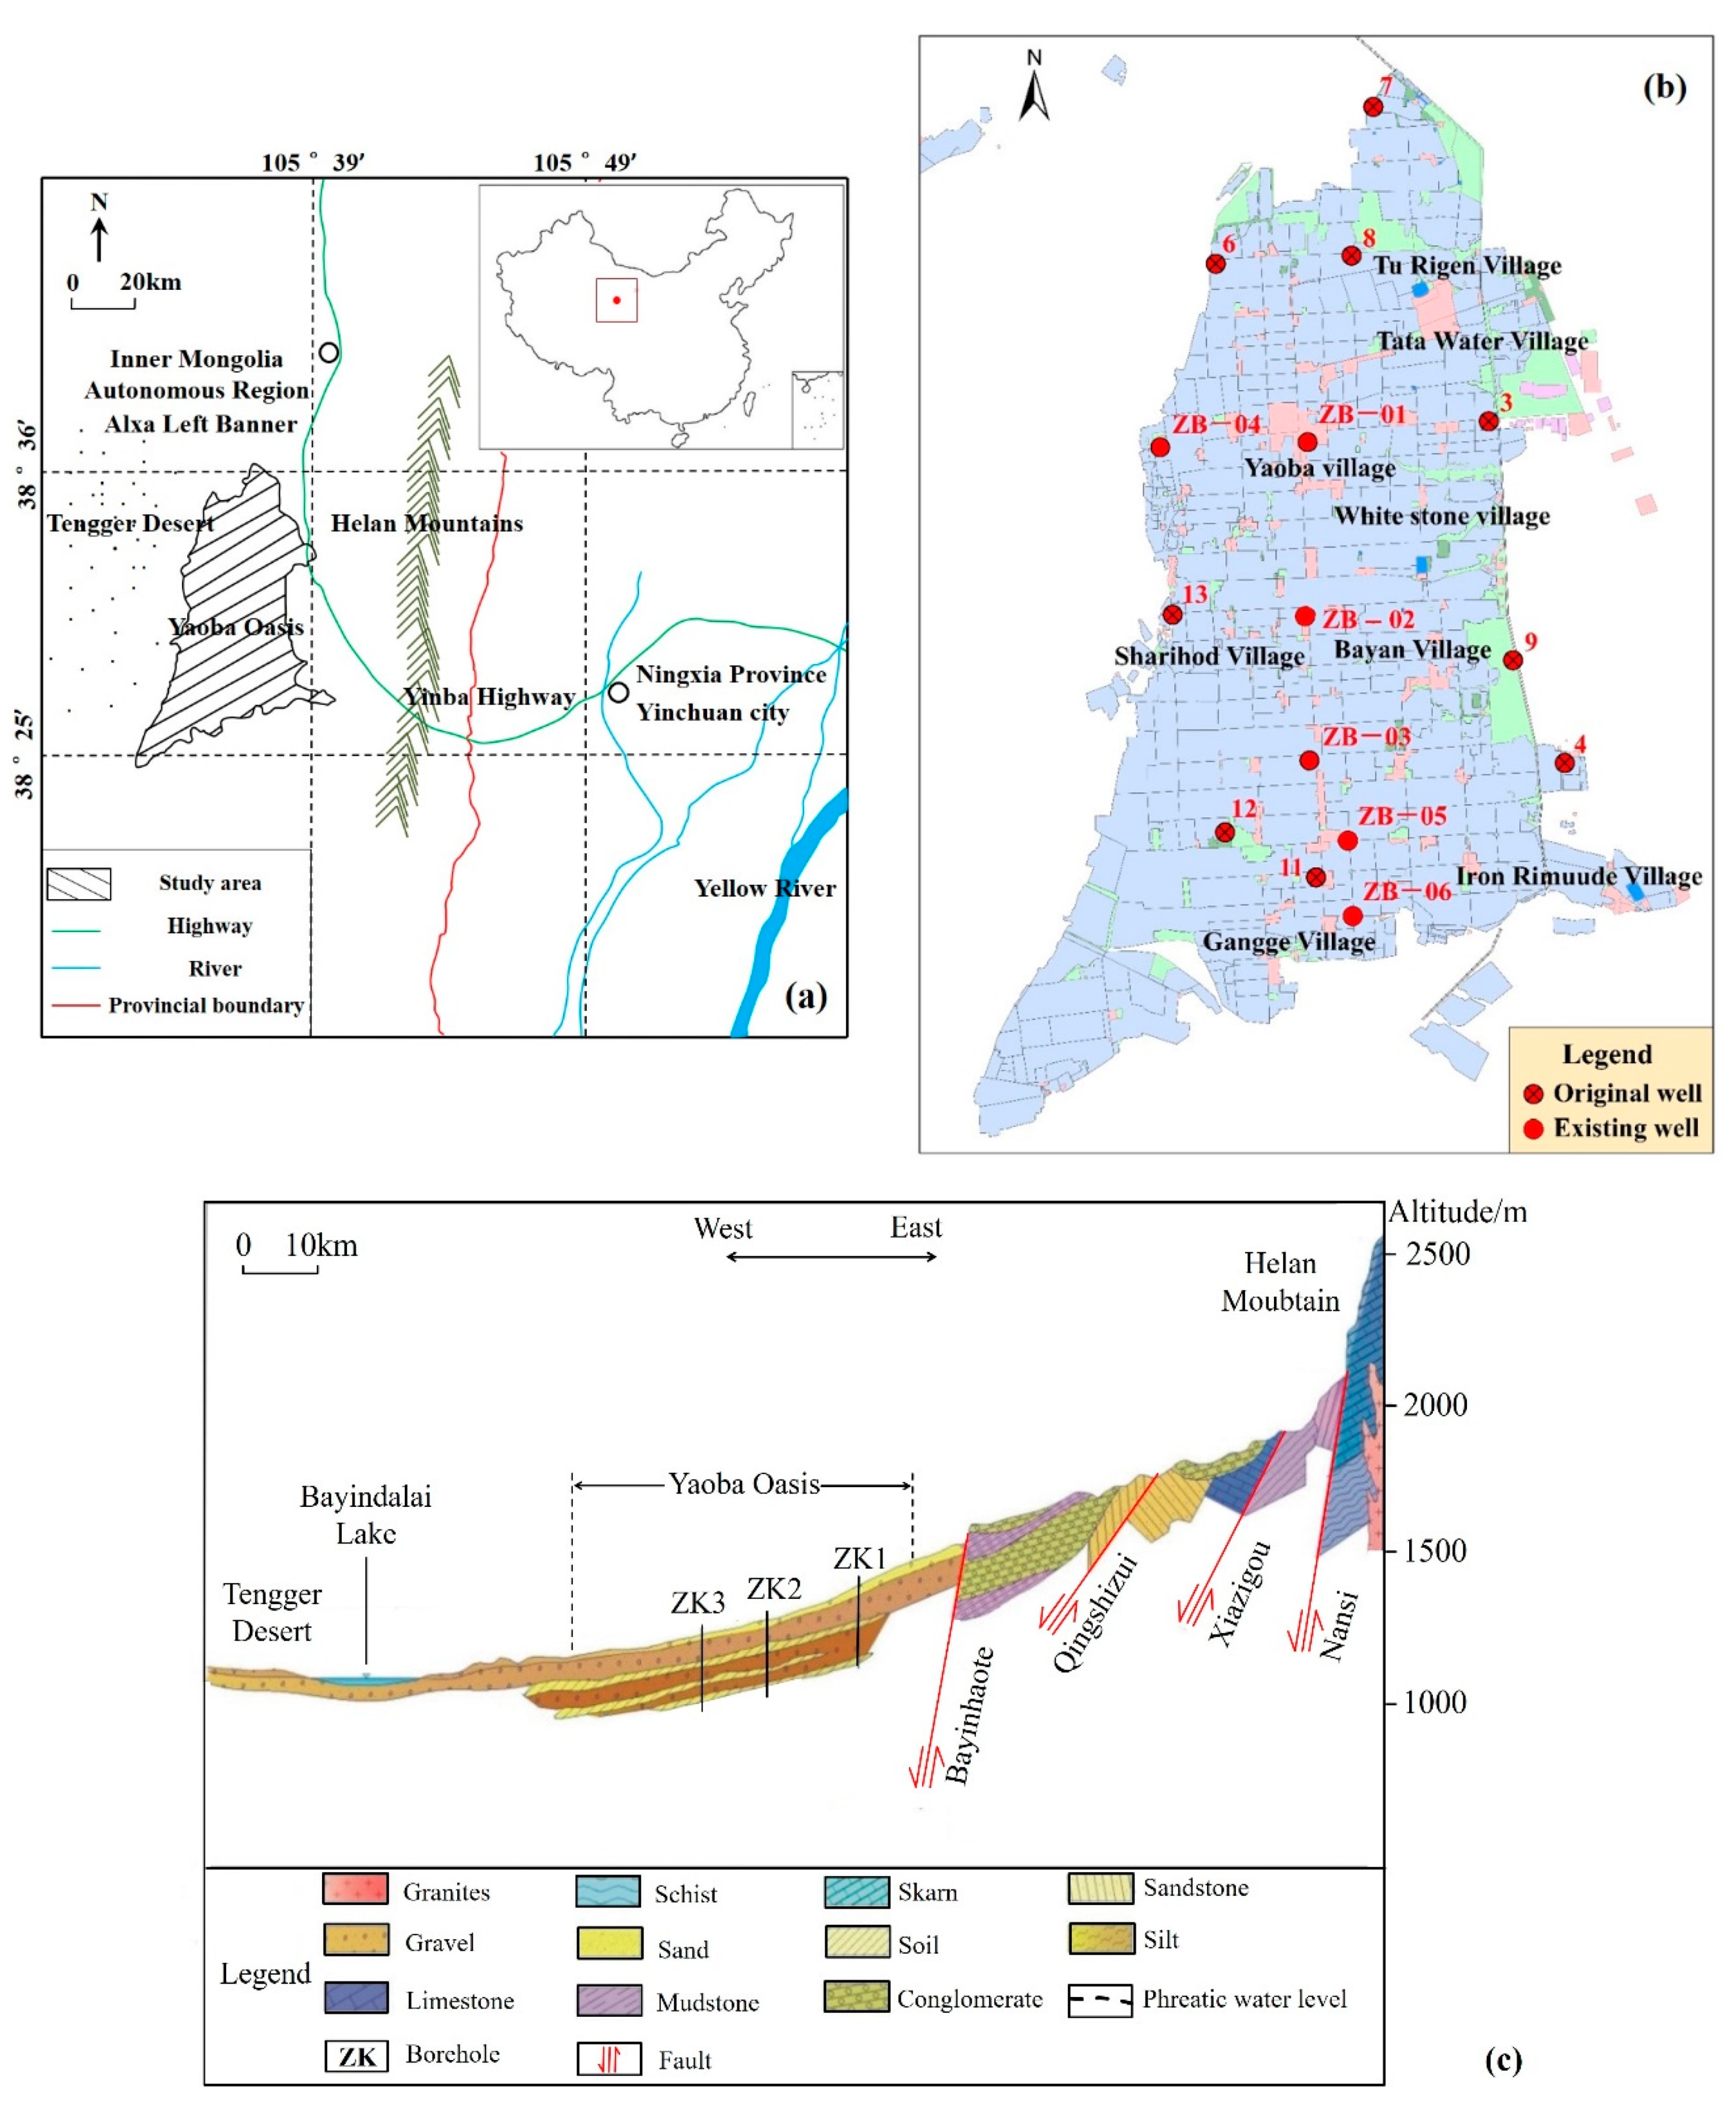
2.1. Study Area and Data Source
2.2. Research Methodology
3. Results and Discussion
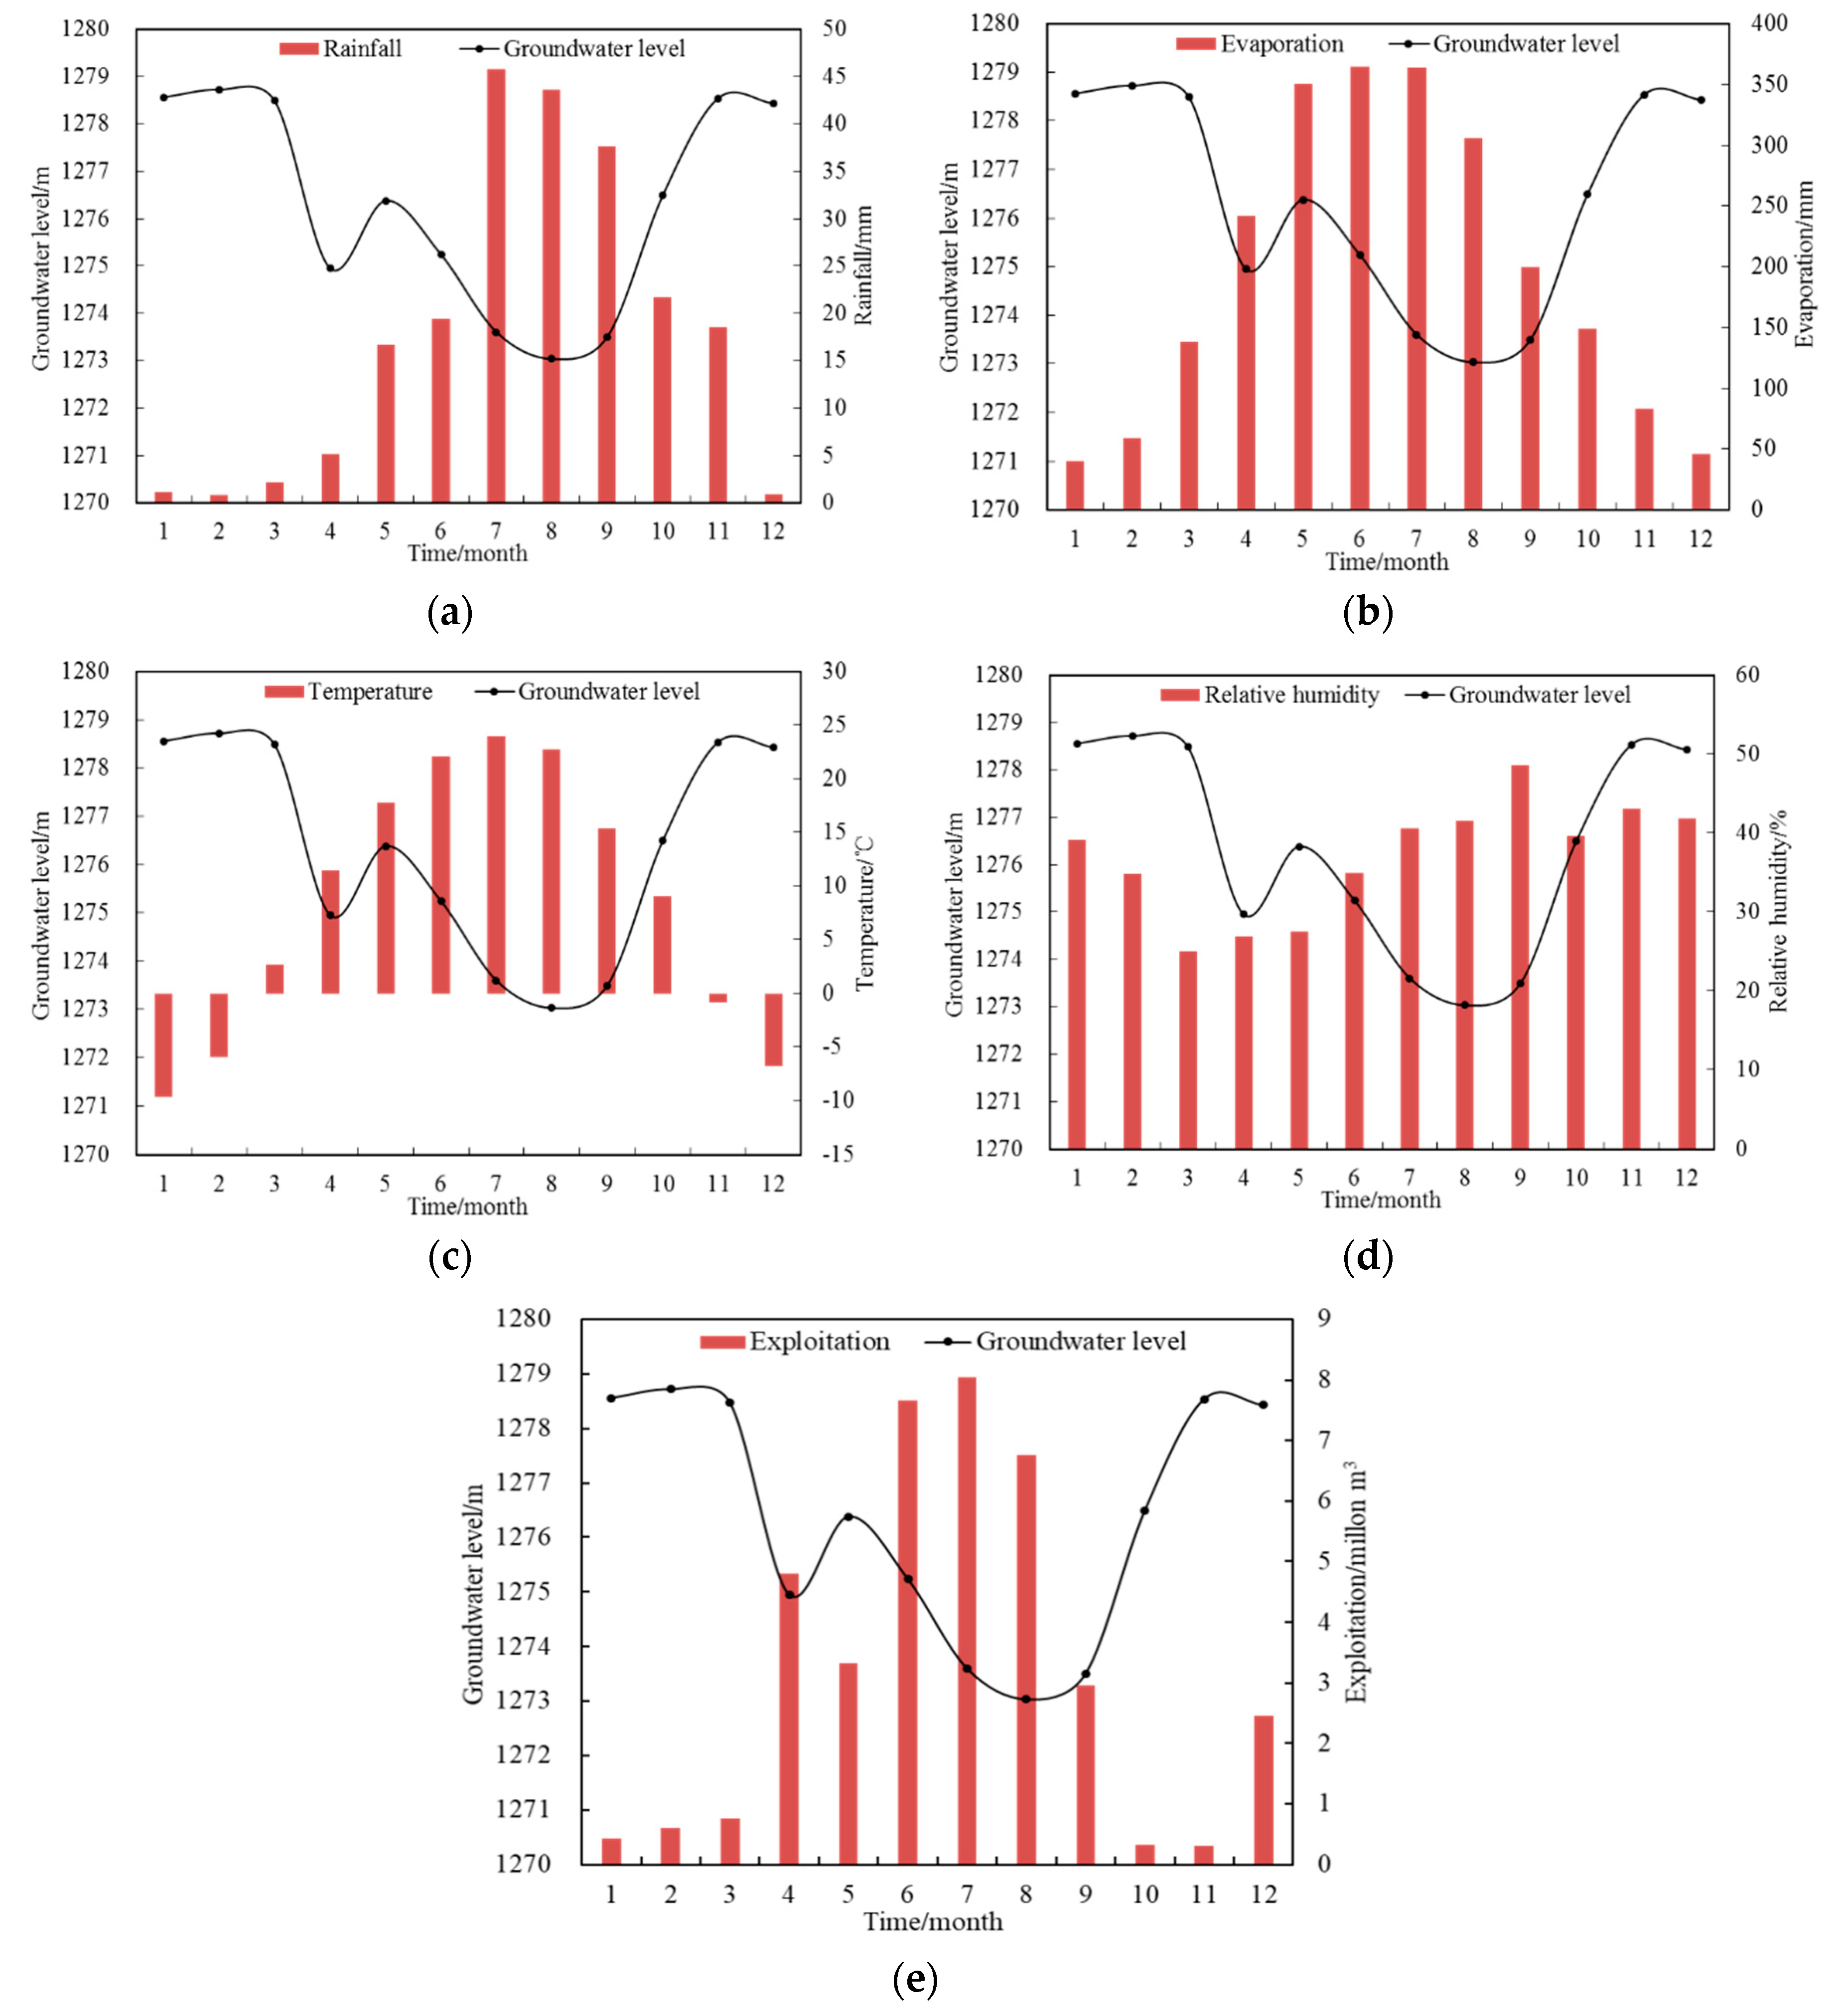
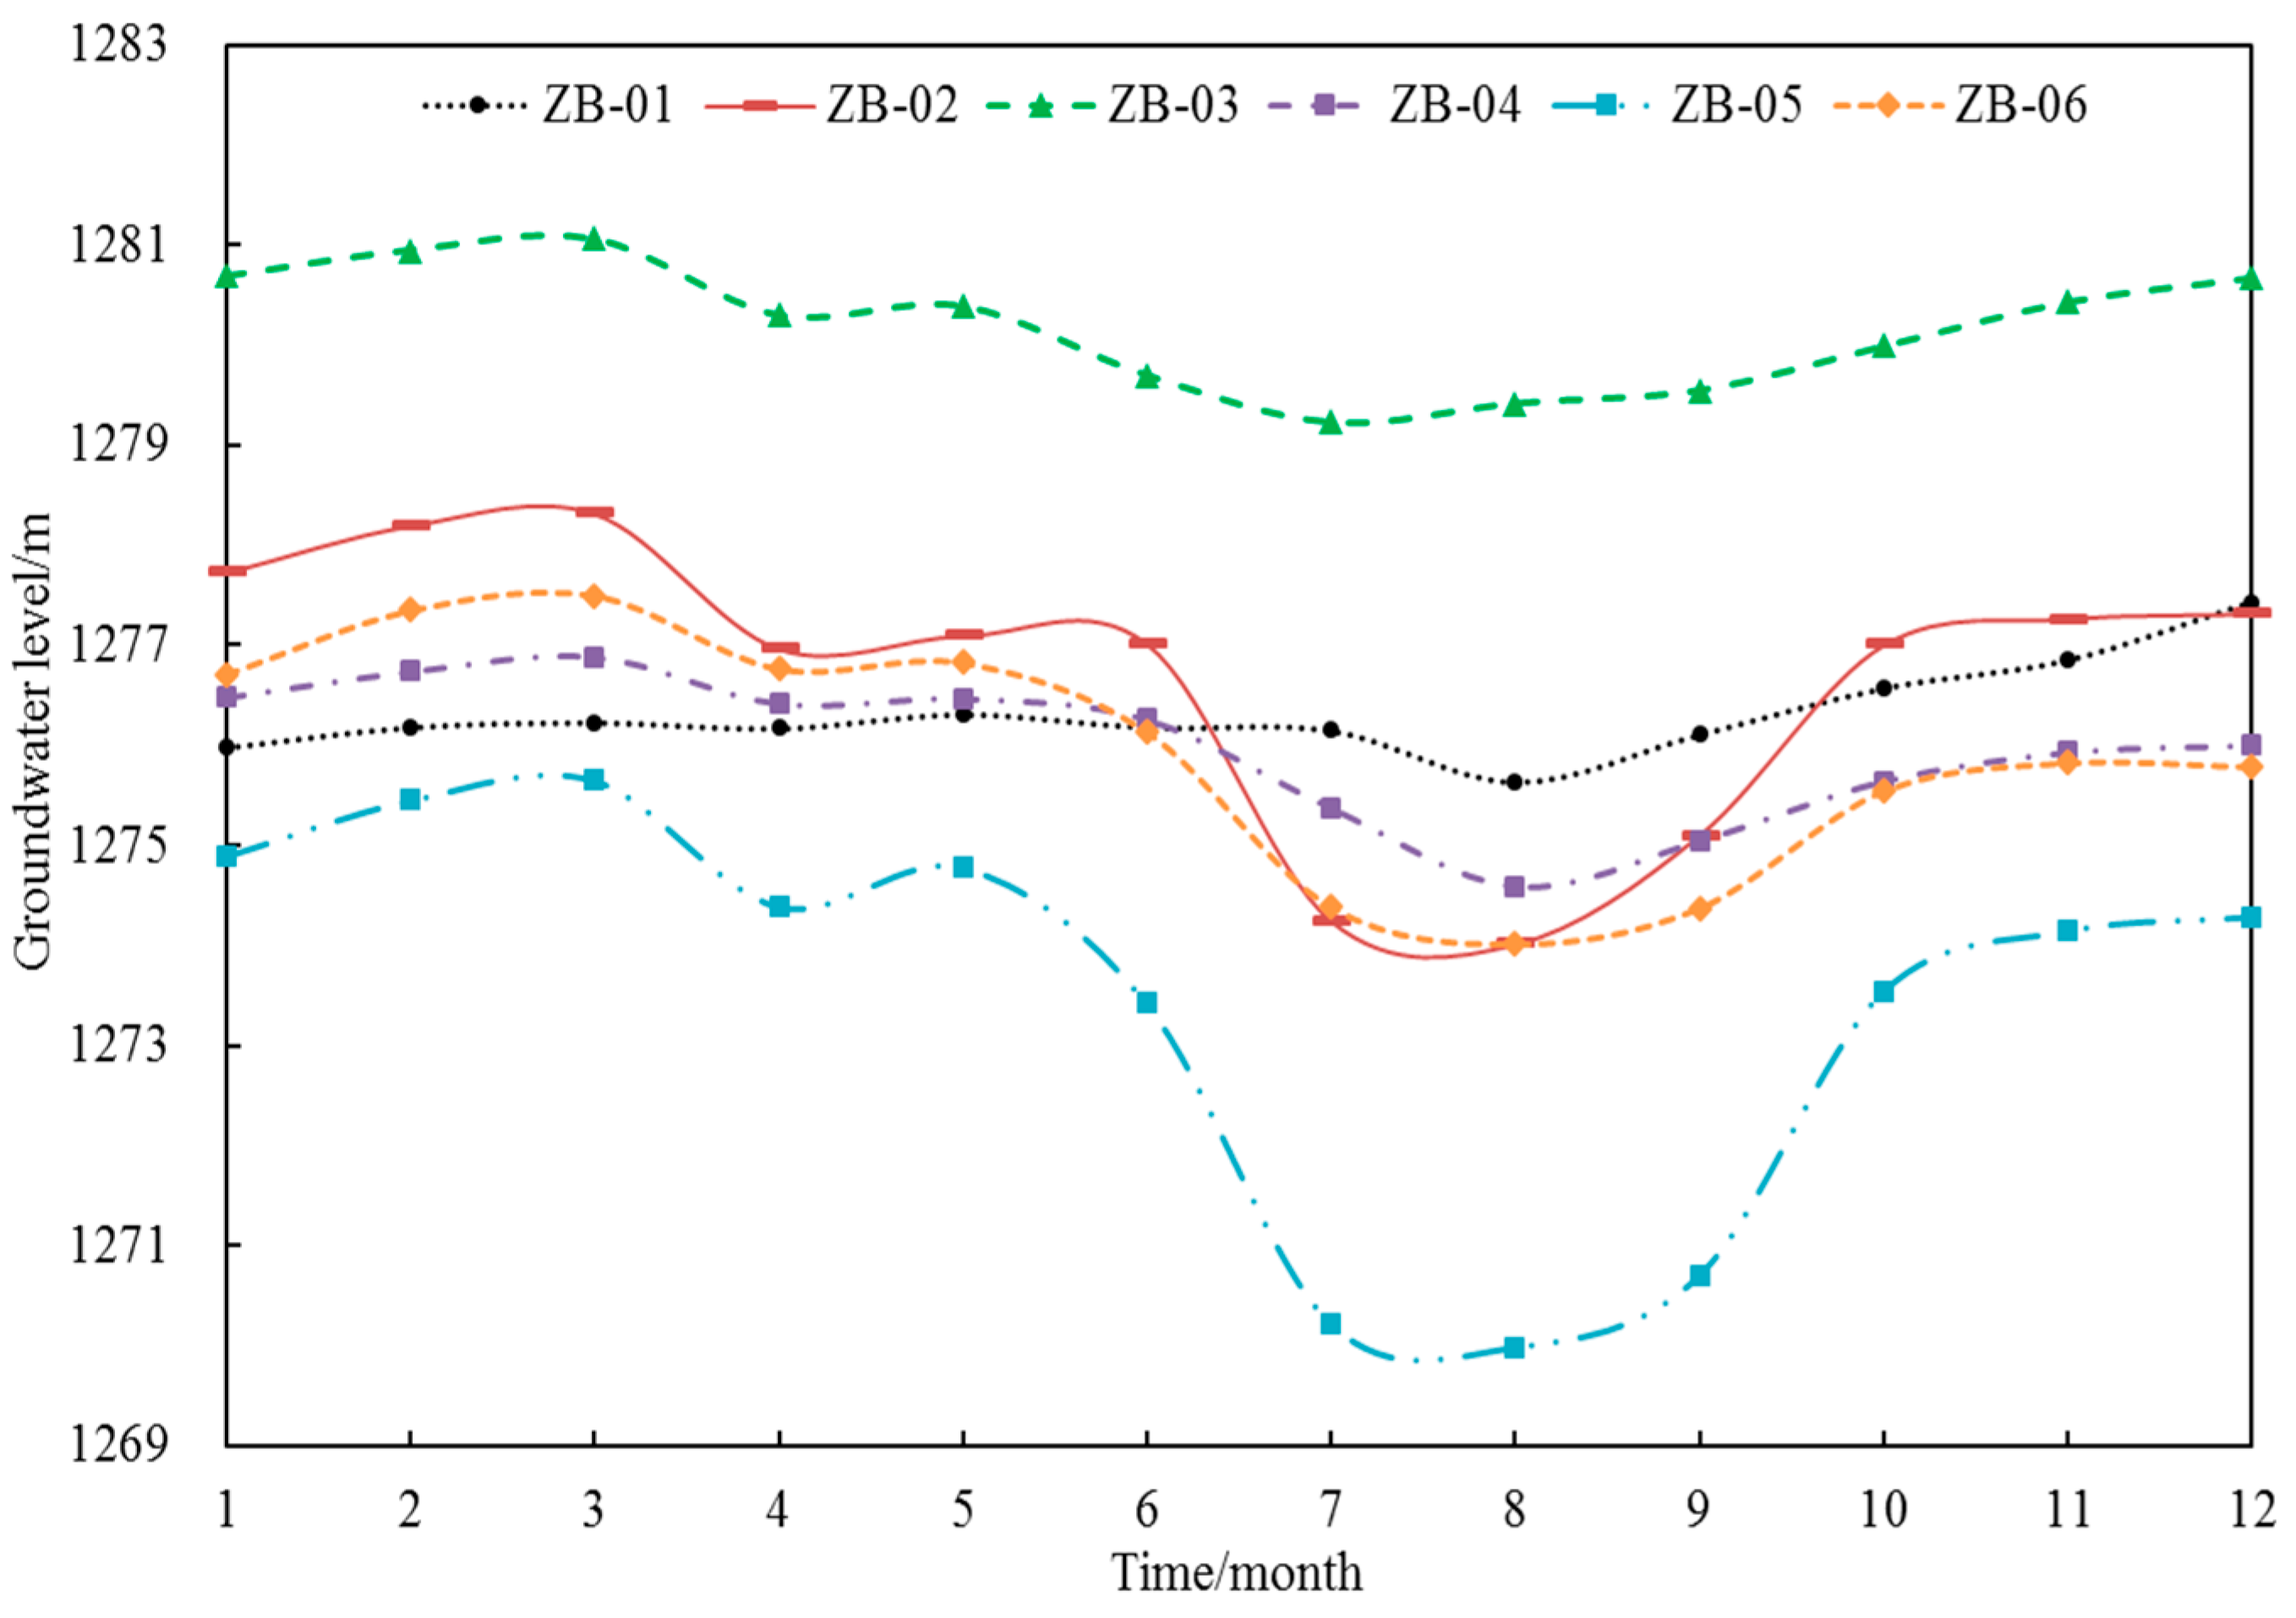
3.1. Dynamic Characteristics of Annual Groundwater Level
- (1)
- Intermittent irrigation period from January to February: The intensity of groundwater exploitation remains low, and the groundwater is only supplied for residents’ domestic water. The groundwater level begins to rise slowly after the end of winter irrigation in the previous year, reaching the highest level of the year in March and tending to be basically stable. The increased amplitude of groundwater level of the six wells is 0.25–0.79 m from January to February.
- (2)
- Spring irrigation stage from March to May: The intensity of groundwater exploitation increases. Farmers begin large-scale cultivation and extract the groundwater for irrigating corn, sunflower, and millet. Groundwater level continues to drop to the lowest level in April, and the decline range is 0.06–1.35 m. The extraction intensity of groundwater is low due to the end of spring irrigation. The groundwater level gradually rises to 0.05–0.14 m during this stage.
- (3)
- Summer irrigation stage from June to August: This period lasts for the longest time and includes crop growth, which requires a large amount of groundwater to meet growth needs. The groundwater reaches the maximum intensity, and the exploitation quantity accounts for more than 65% of the whole year. The groundwater level drops rapidly to the lowest value of the year in August, forming a regional cone of depression, and the decline amplitude is 0.67–4.79 m at this period.
- (4)
- Intermittent irrigation stage from September to December: As the summer irrigation nears its end, exploitation intensity weakens. The groundwater exploitation remains at a low level during this period, and the groundwater level rises rapidly to 0.74–3.44 m. The increase in the rate of groundwater level fluctuates because of limited-scale winter irrigation. However, the overall trend continues to rise with the amplitude of 0.26–0.88 m from November to December.
3.2. Dynamic Characteristics of Inter-Annual Groundwater Level
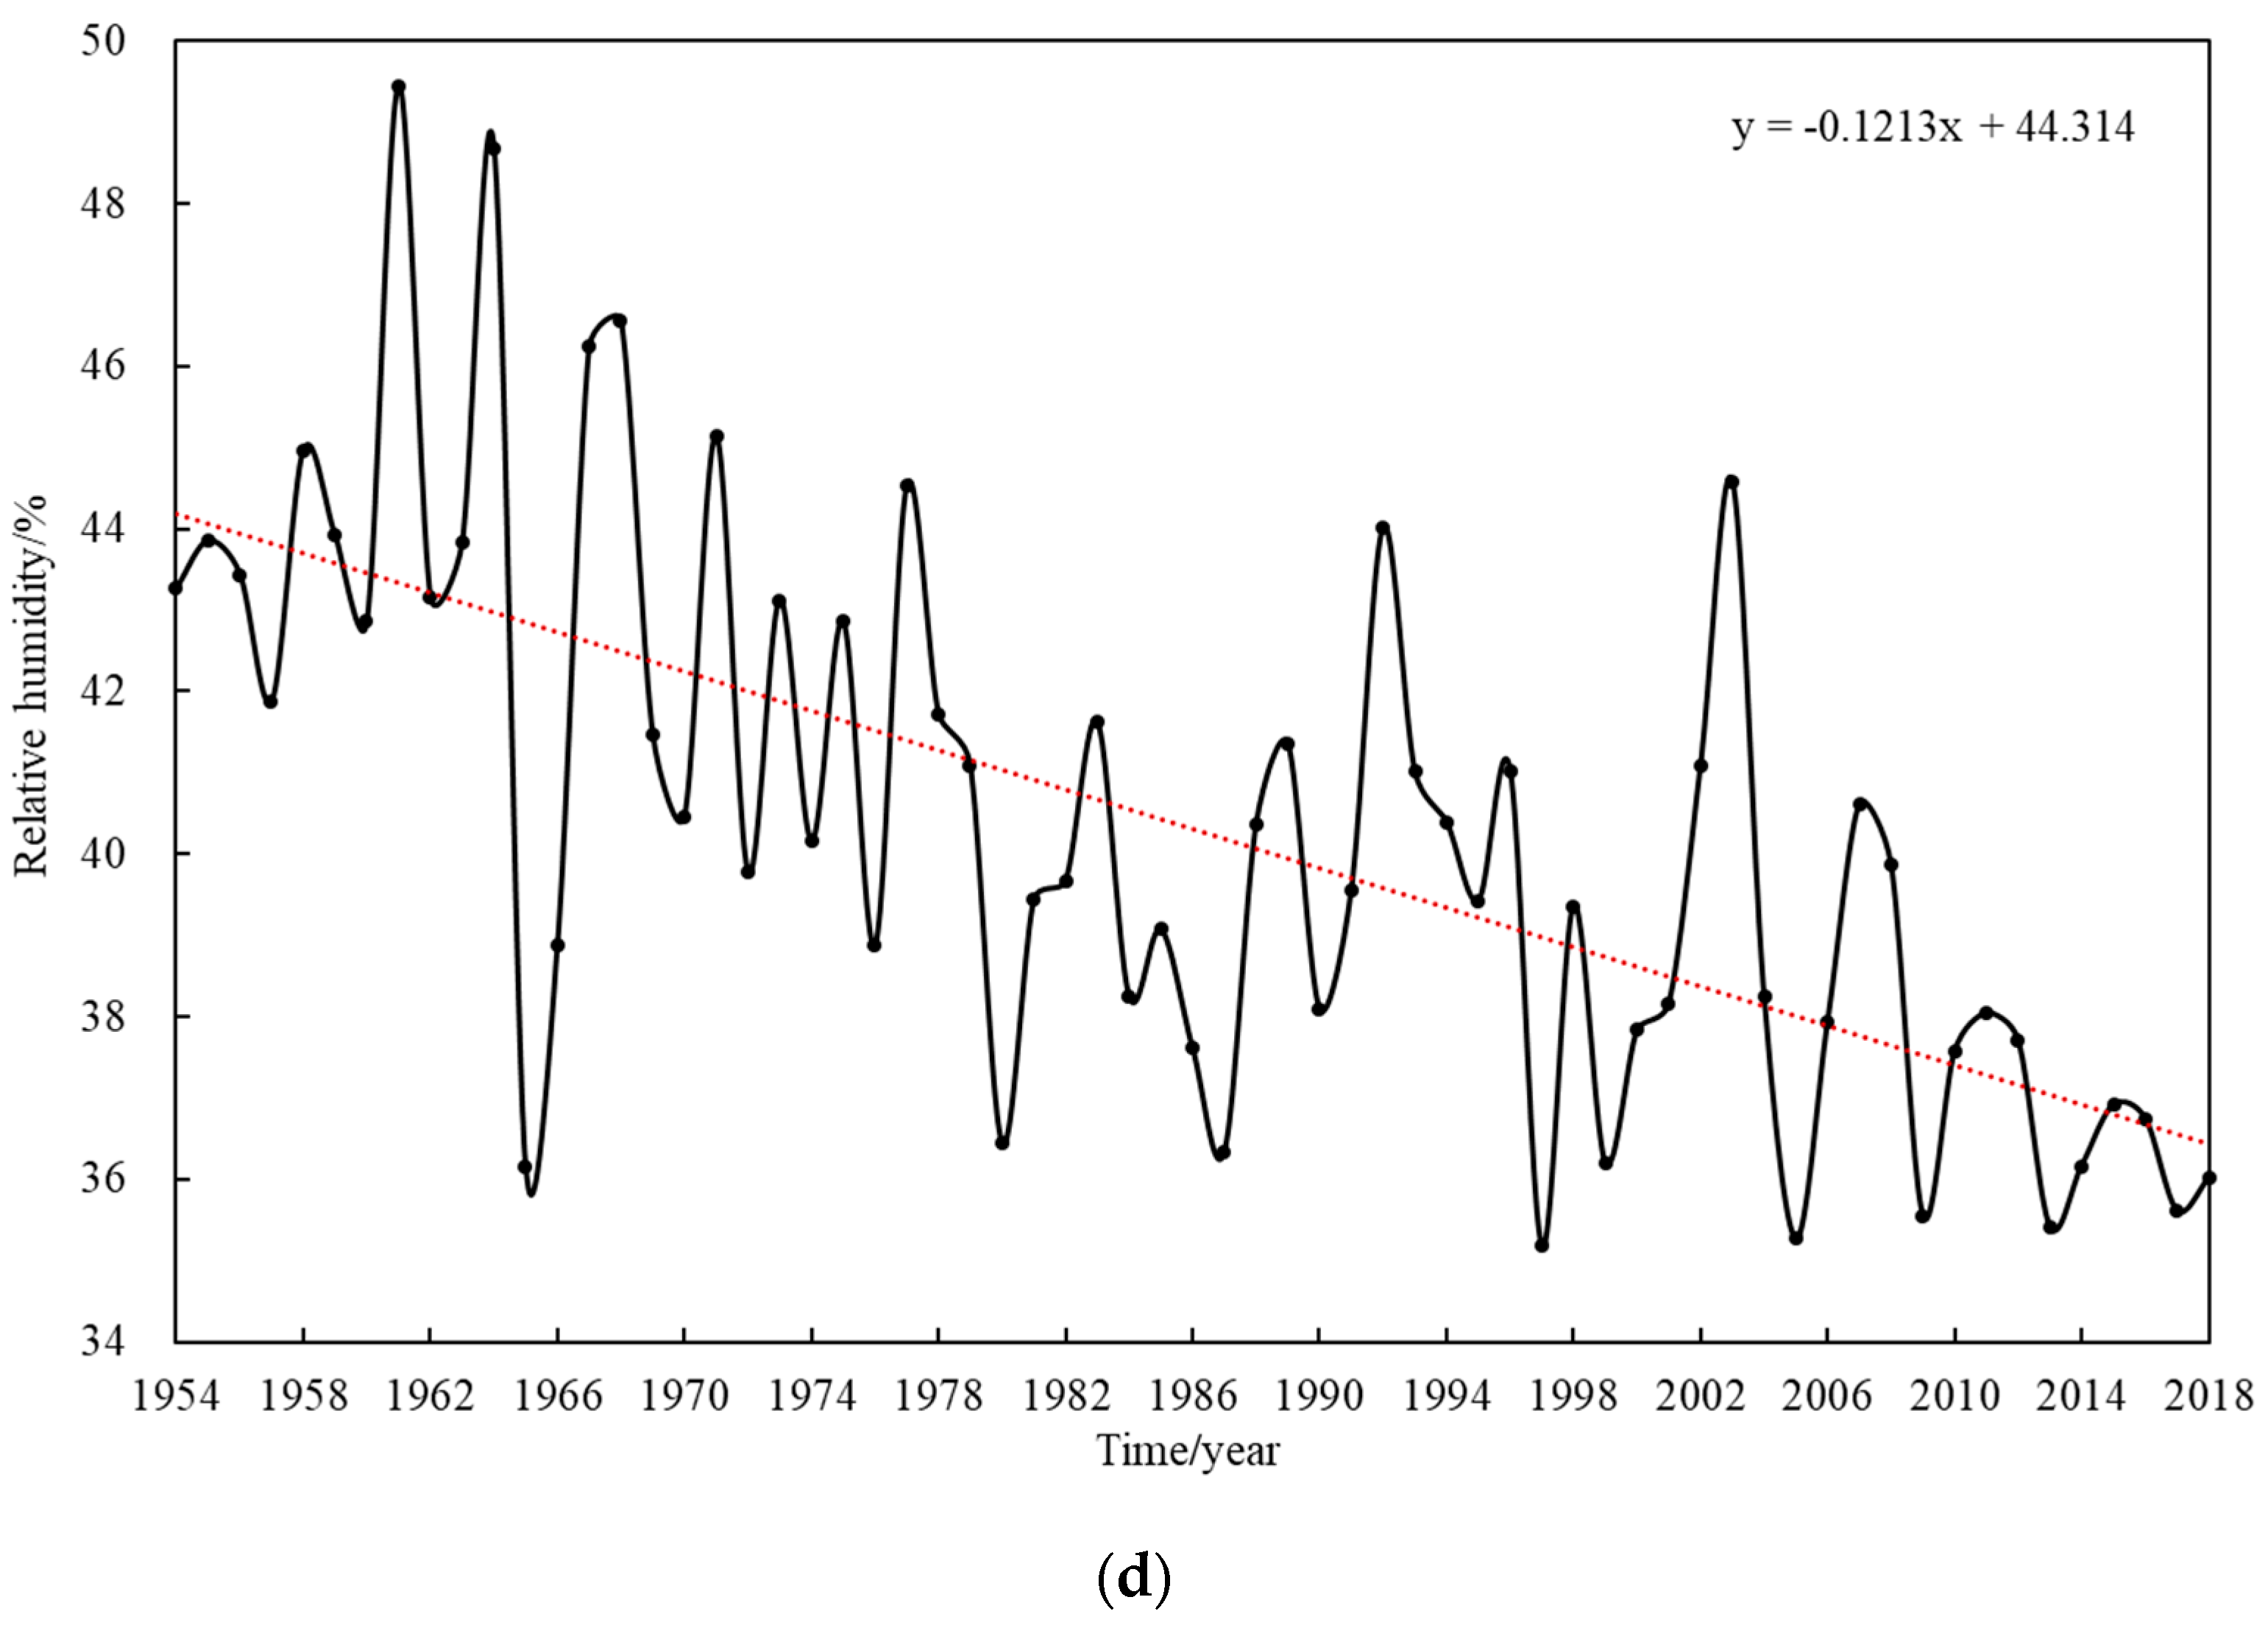
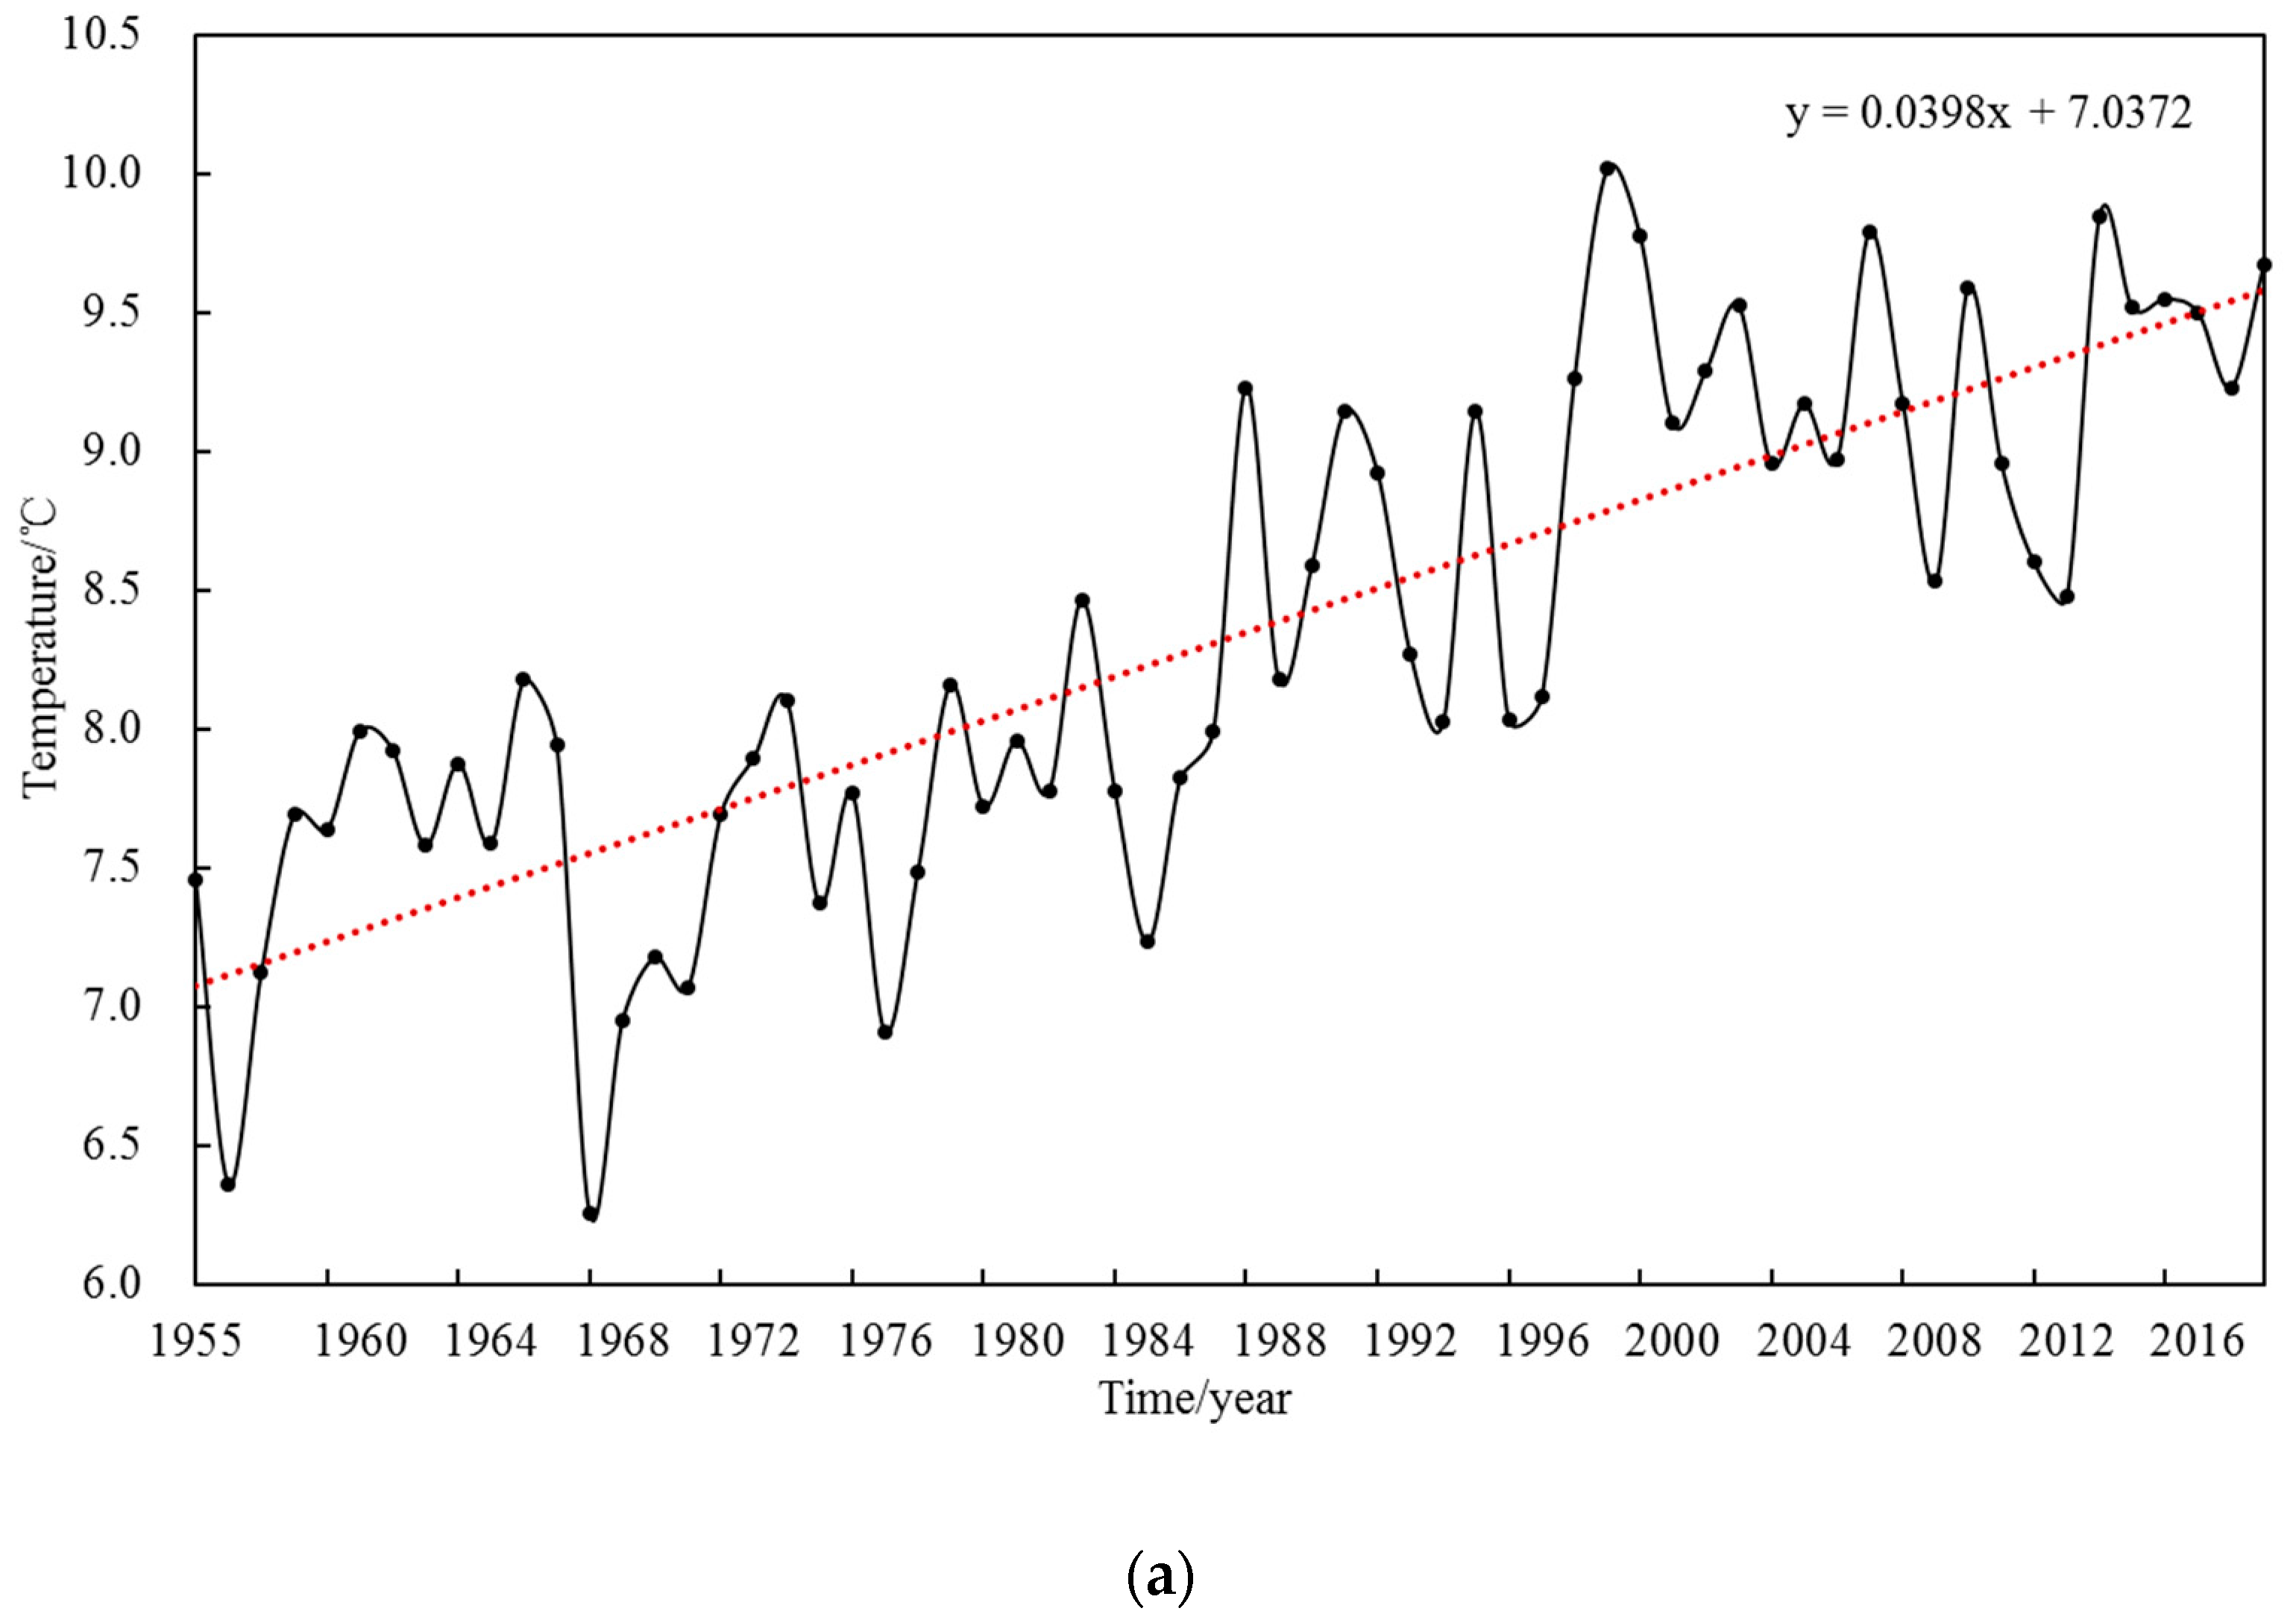
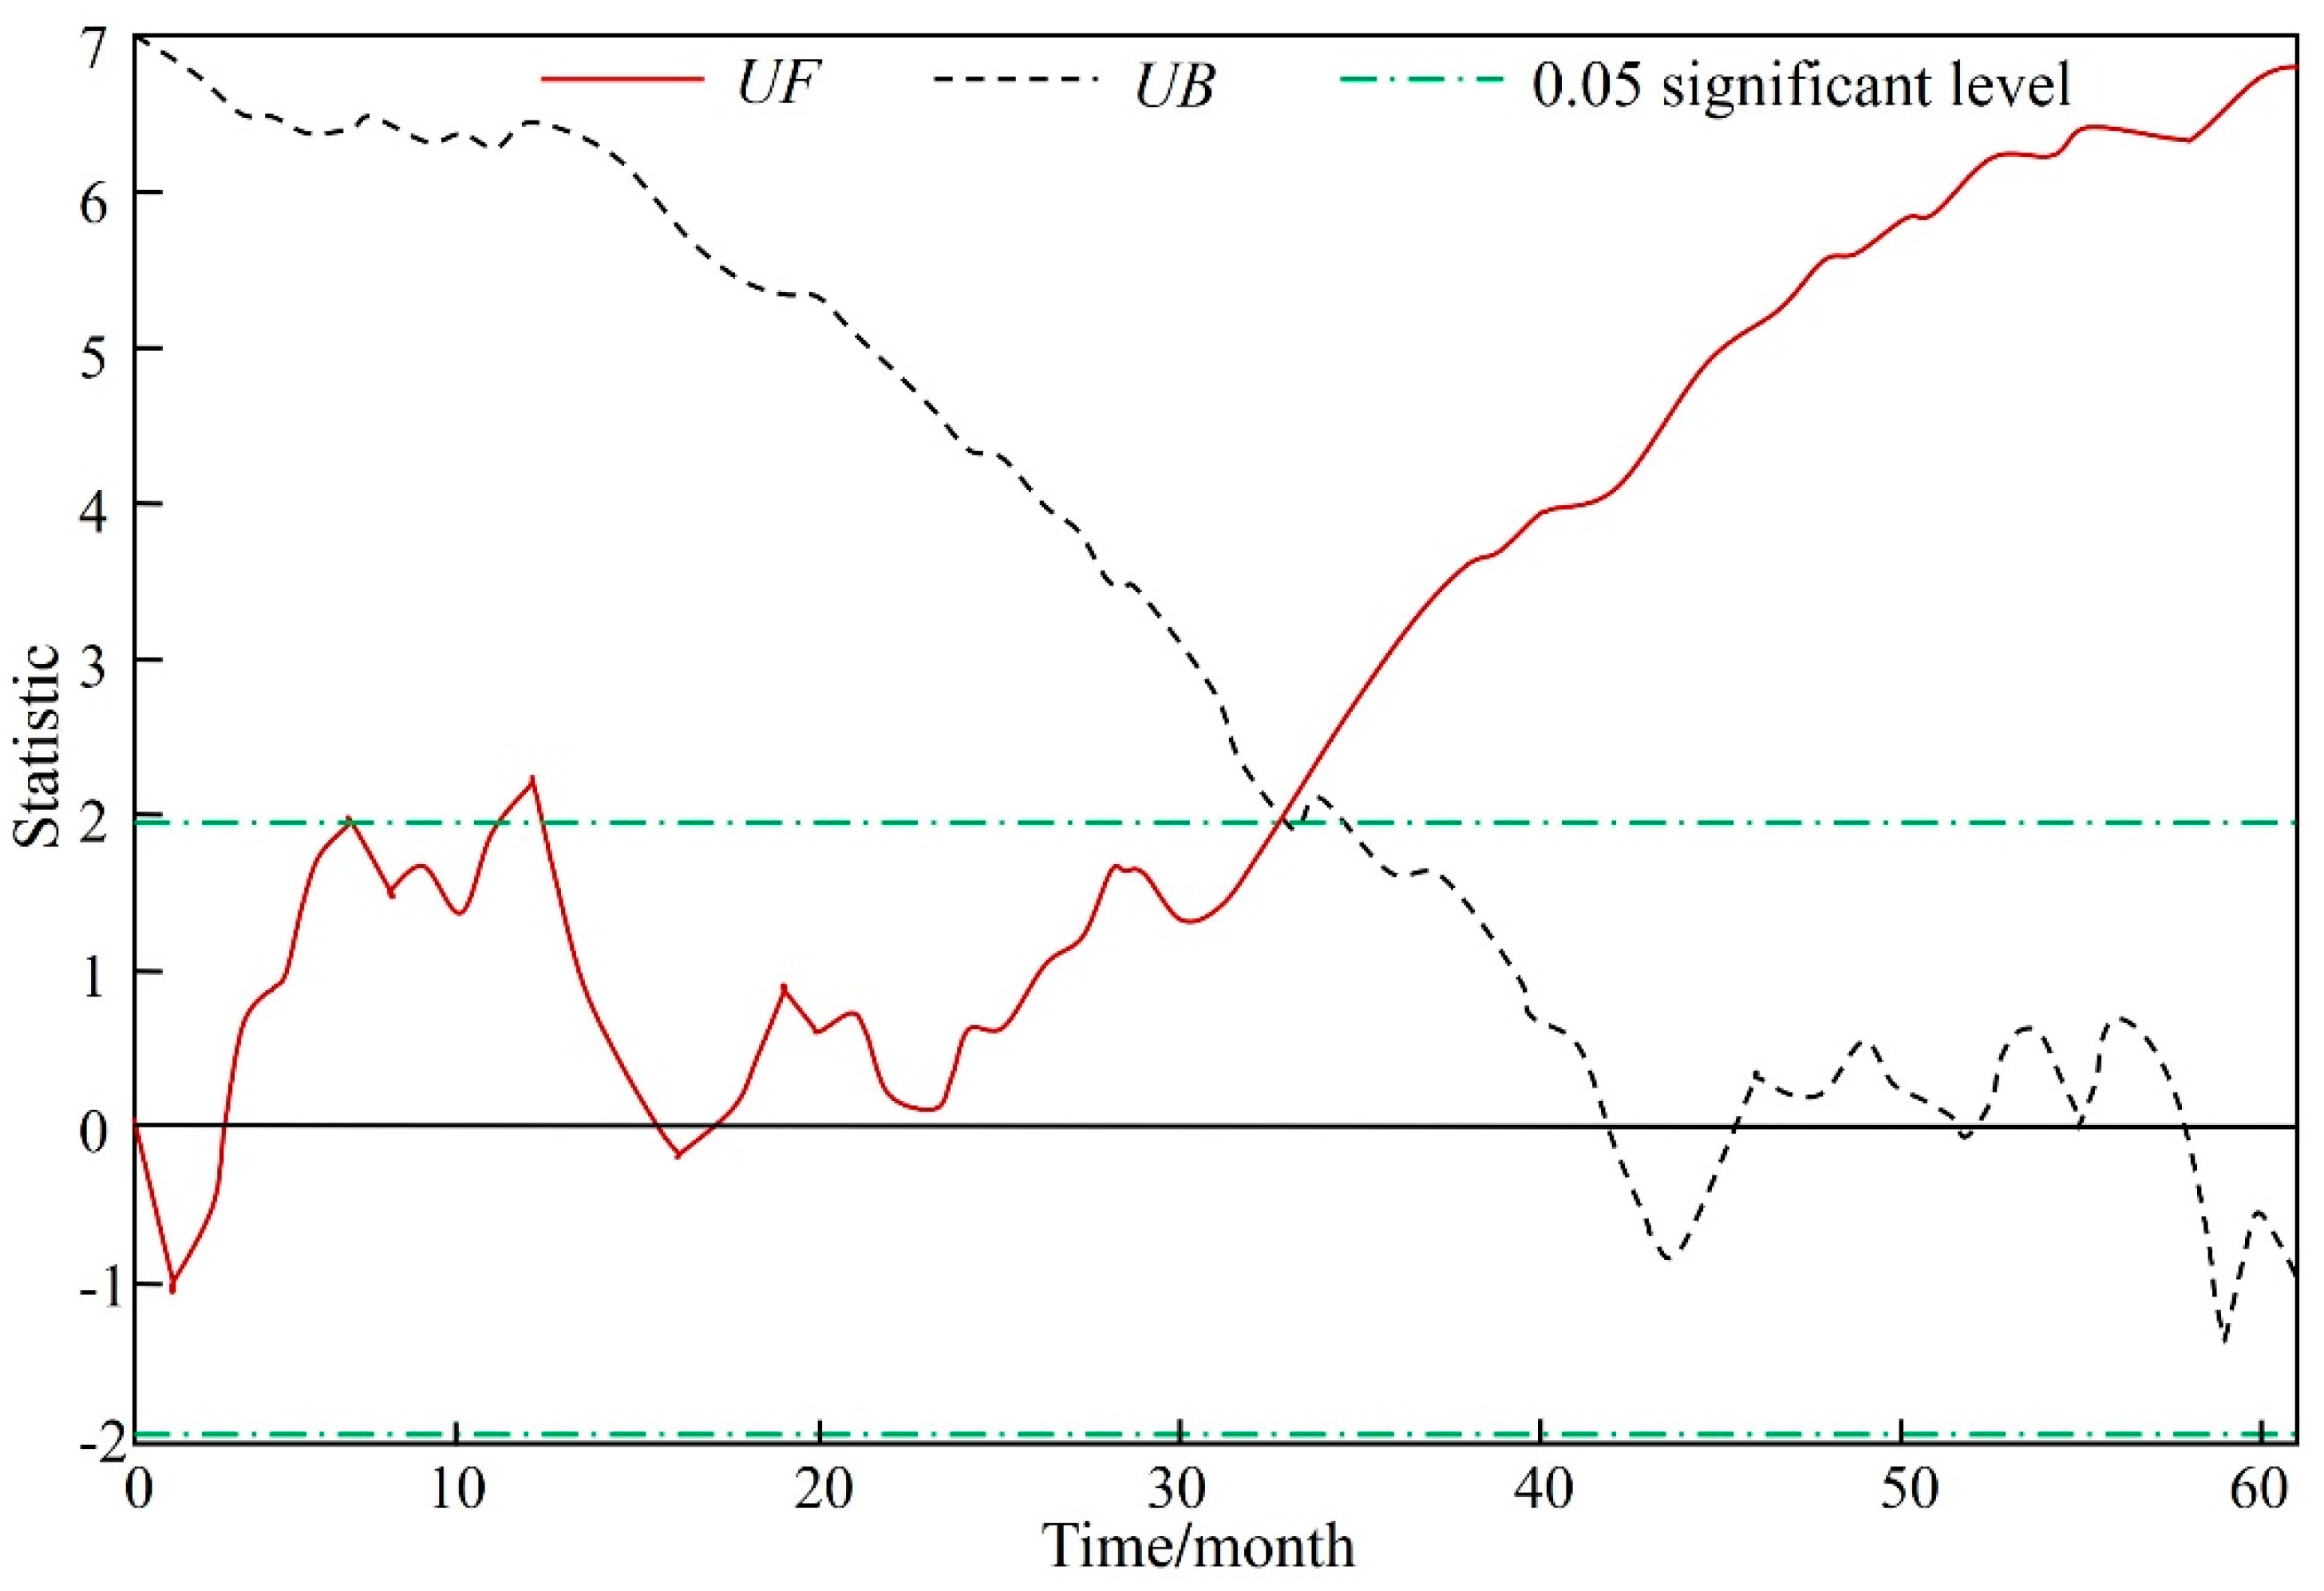
3.2.1. Impact of Climatic Factors on Groundwater Level
3.2.2. Impact of Human Activities on Groundwater Level
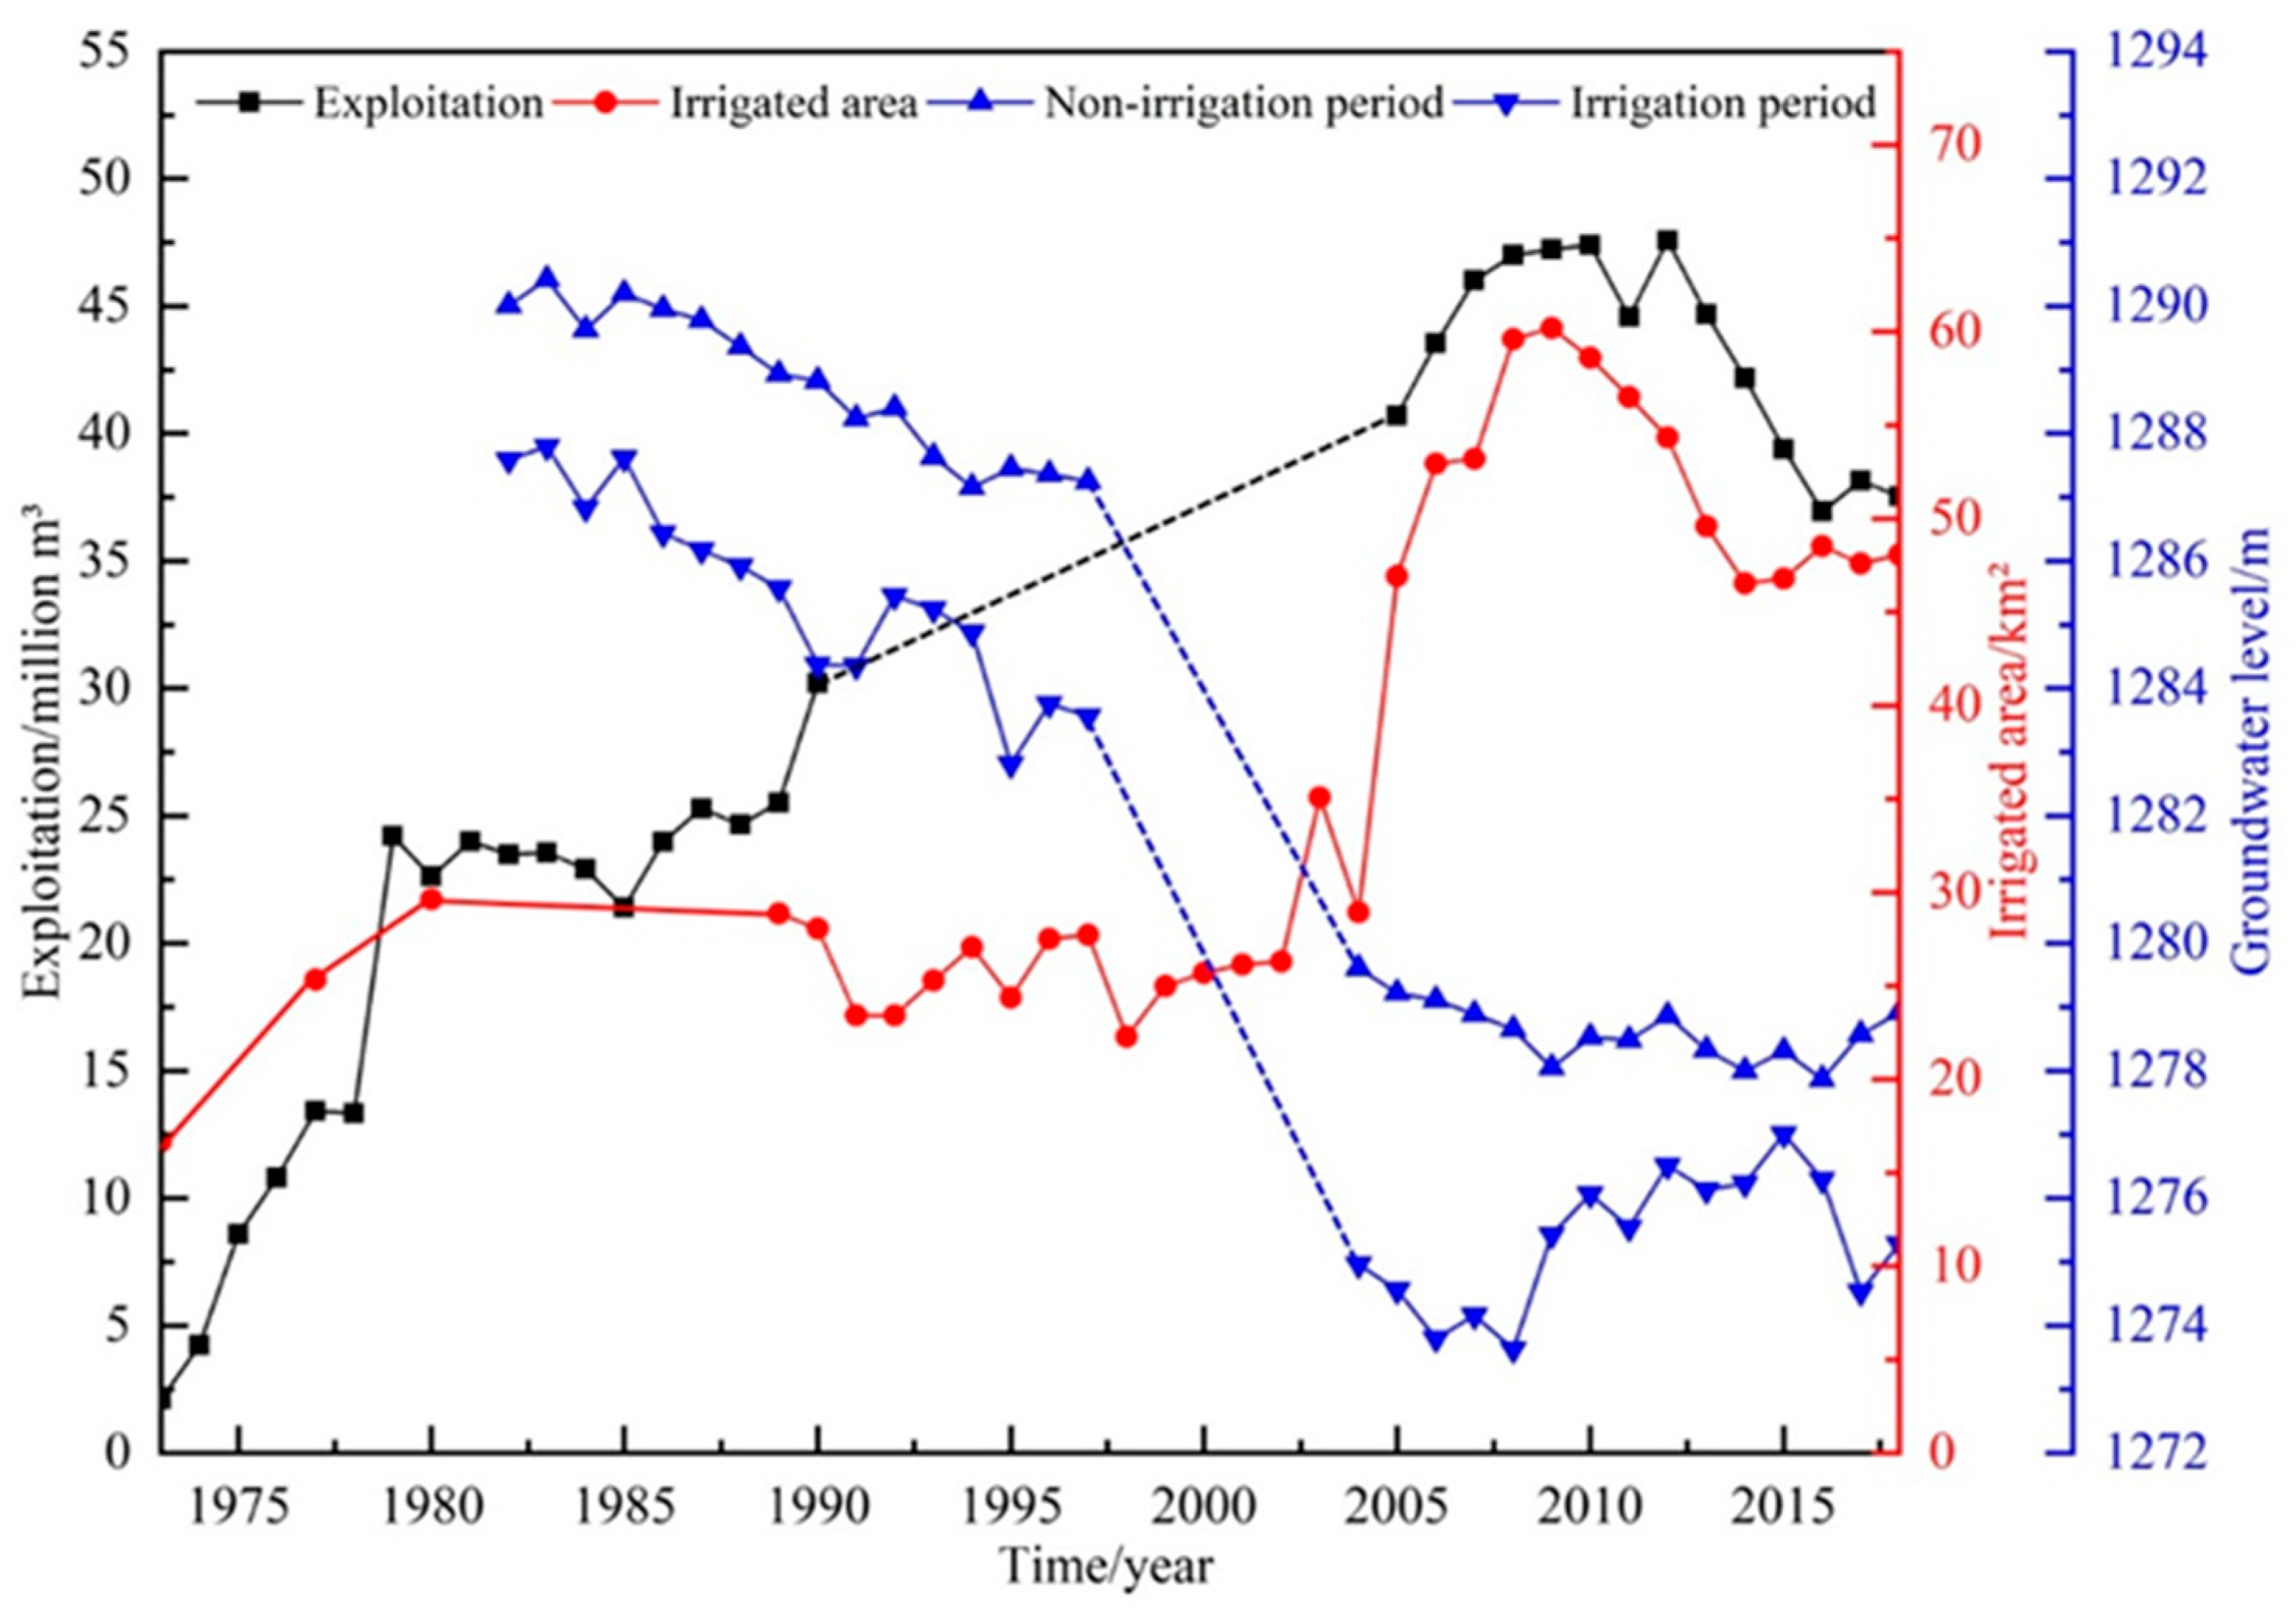
- (1)
- Slowly dropping period from 1981 to 1997: In the 1960s, the irrigated area was only 2.40 km2, the amount of groundwater exploitation was only 1 million m3/year, and the depth of groundwater level was shallow. In 1973, agriculture began to rise rapidly with an irrigated area of 16.67 km2 (Figure 6). This rise caused the exploitation quantity to increase sharply to 2.10 million m3/year. The irrigated area increased to 25.33 km2 in 1977 with an exploitation amount of 13.43 million m3/year due to the continuous influx of migrants and the expansion of land. However, the groundwater level was generally stable because the recharge of 22 million m3/year was greater than the exploitation quantity. The irrigated area then rose to 29.33 km2 in 1979, and the exploitation increased to 24.21 million m3/year. The exploitation amount was slightly larger than the recharge. Therefore, the groundwater level slowly declined. In that year, the local government established the dynamic monitoring network because of the decline in groundwater (Figure 1c). Afterwards, the irrigated area was maintained at approximately 29.33 km2, and the exploitation ranged from 23 million m3/year to 30 million m3/year, resulting in the continuous decline in groundwater level. The cumulative decline varied from 2.92 m to 4.64 m, and the rate was 0.17–0.27 m/year.
- (2)
- Rapidly declining period from 1997 to 2004: The irrigated area was stable at about 26.67 km2. The crops were mostly water-consuming crops, such as corn and wheat, due to the unreasonable planting structure [25]. The amount of exploitation rapidly increased to around 40 million m3/year, causing a sharp drop of groundwater level. The cumulative decline was 1.95–9.33 m, and the rate of decline was 0.24–1.17 m/year.
- (3)
- Slowly declining period from 2004 to 2008: The irrigated area sharply increased from 28.93 km2 in 2004 to 59.60 km2 in 2008. The exploitation was maintained at 47 million m3/year, which far exceeded the recharge of 22 million m3/year. The cumulative depth of decline in five years was 0.2–1.5 m with a rate of 0.04–0.30 m/year.
- (4)
- Stable period from 2008 to 2018: The continuous drop of groundwater level attracted the attention of the local government in 2009. In recent years, water-saving measures had been taken in the study area. The irrigated area gradually reduced to 46.67 km2, where the area of water-saving crops increased, and the planting proportion of water-consuming crops was relatively reduced. The exploitation amount was controlled at about 40 million m3/year, and the groundwater level was basically stable with a cumulative decline from −0.83 to 1.15 m and a descending rate of −0.08–0.12 m/year. In particular, the groundwater level of three monitoring wells rebounded slightly compared with the level in 2008. The irrigated area increased after 2014, but the exploitation was still declining. Thus, the quota water distribution system and planting structure improved by the government achieved remarkable results.
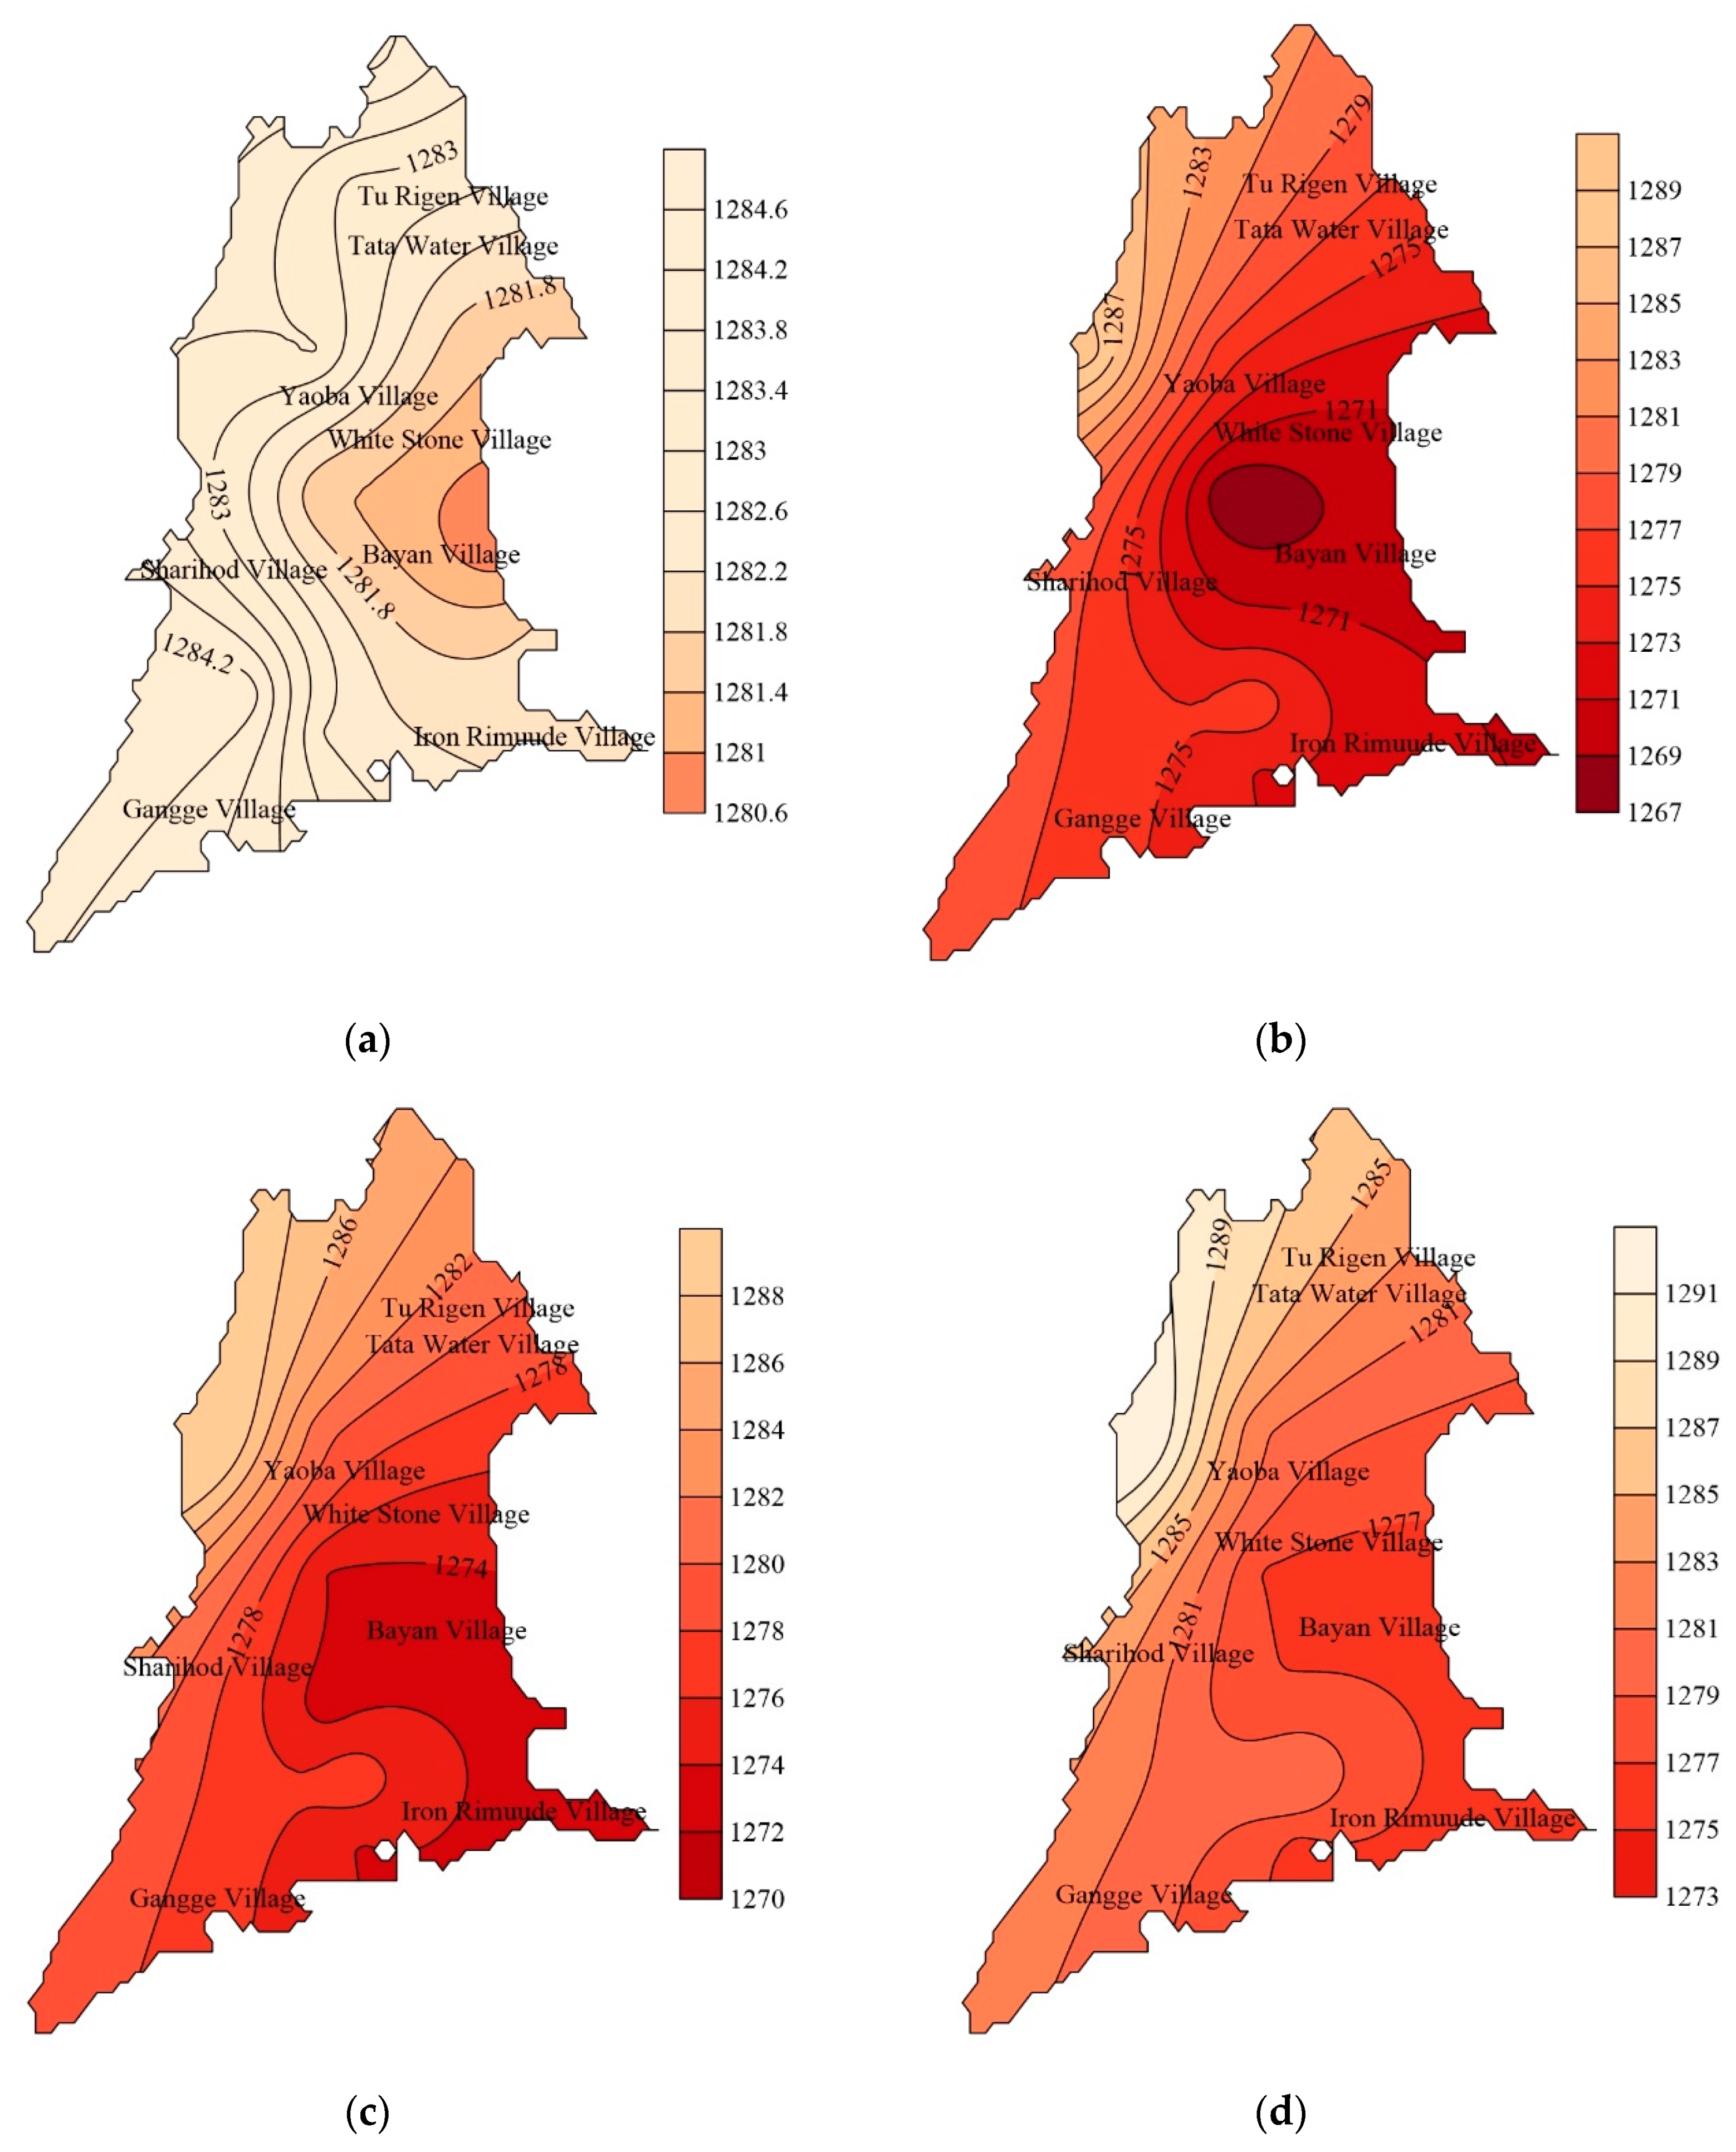
3.2.3. Variation of Cone of Depression
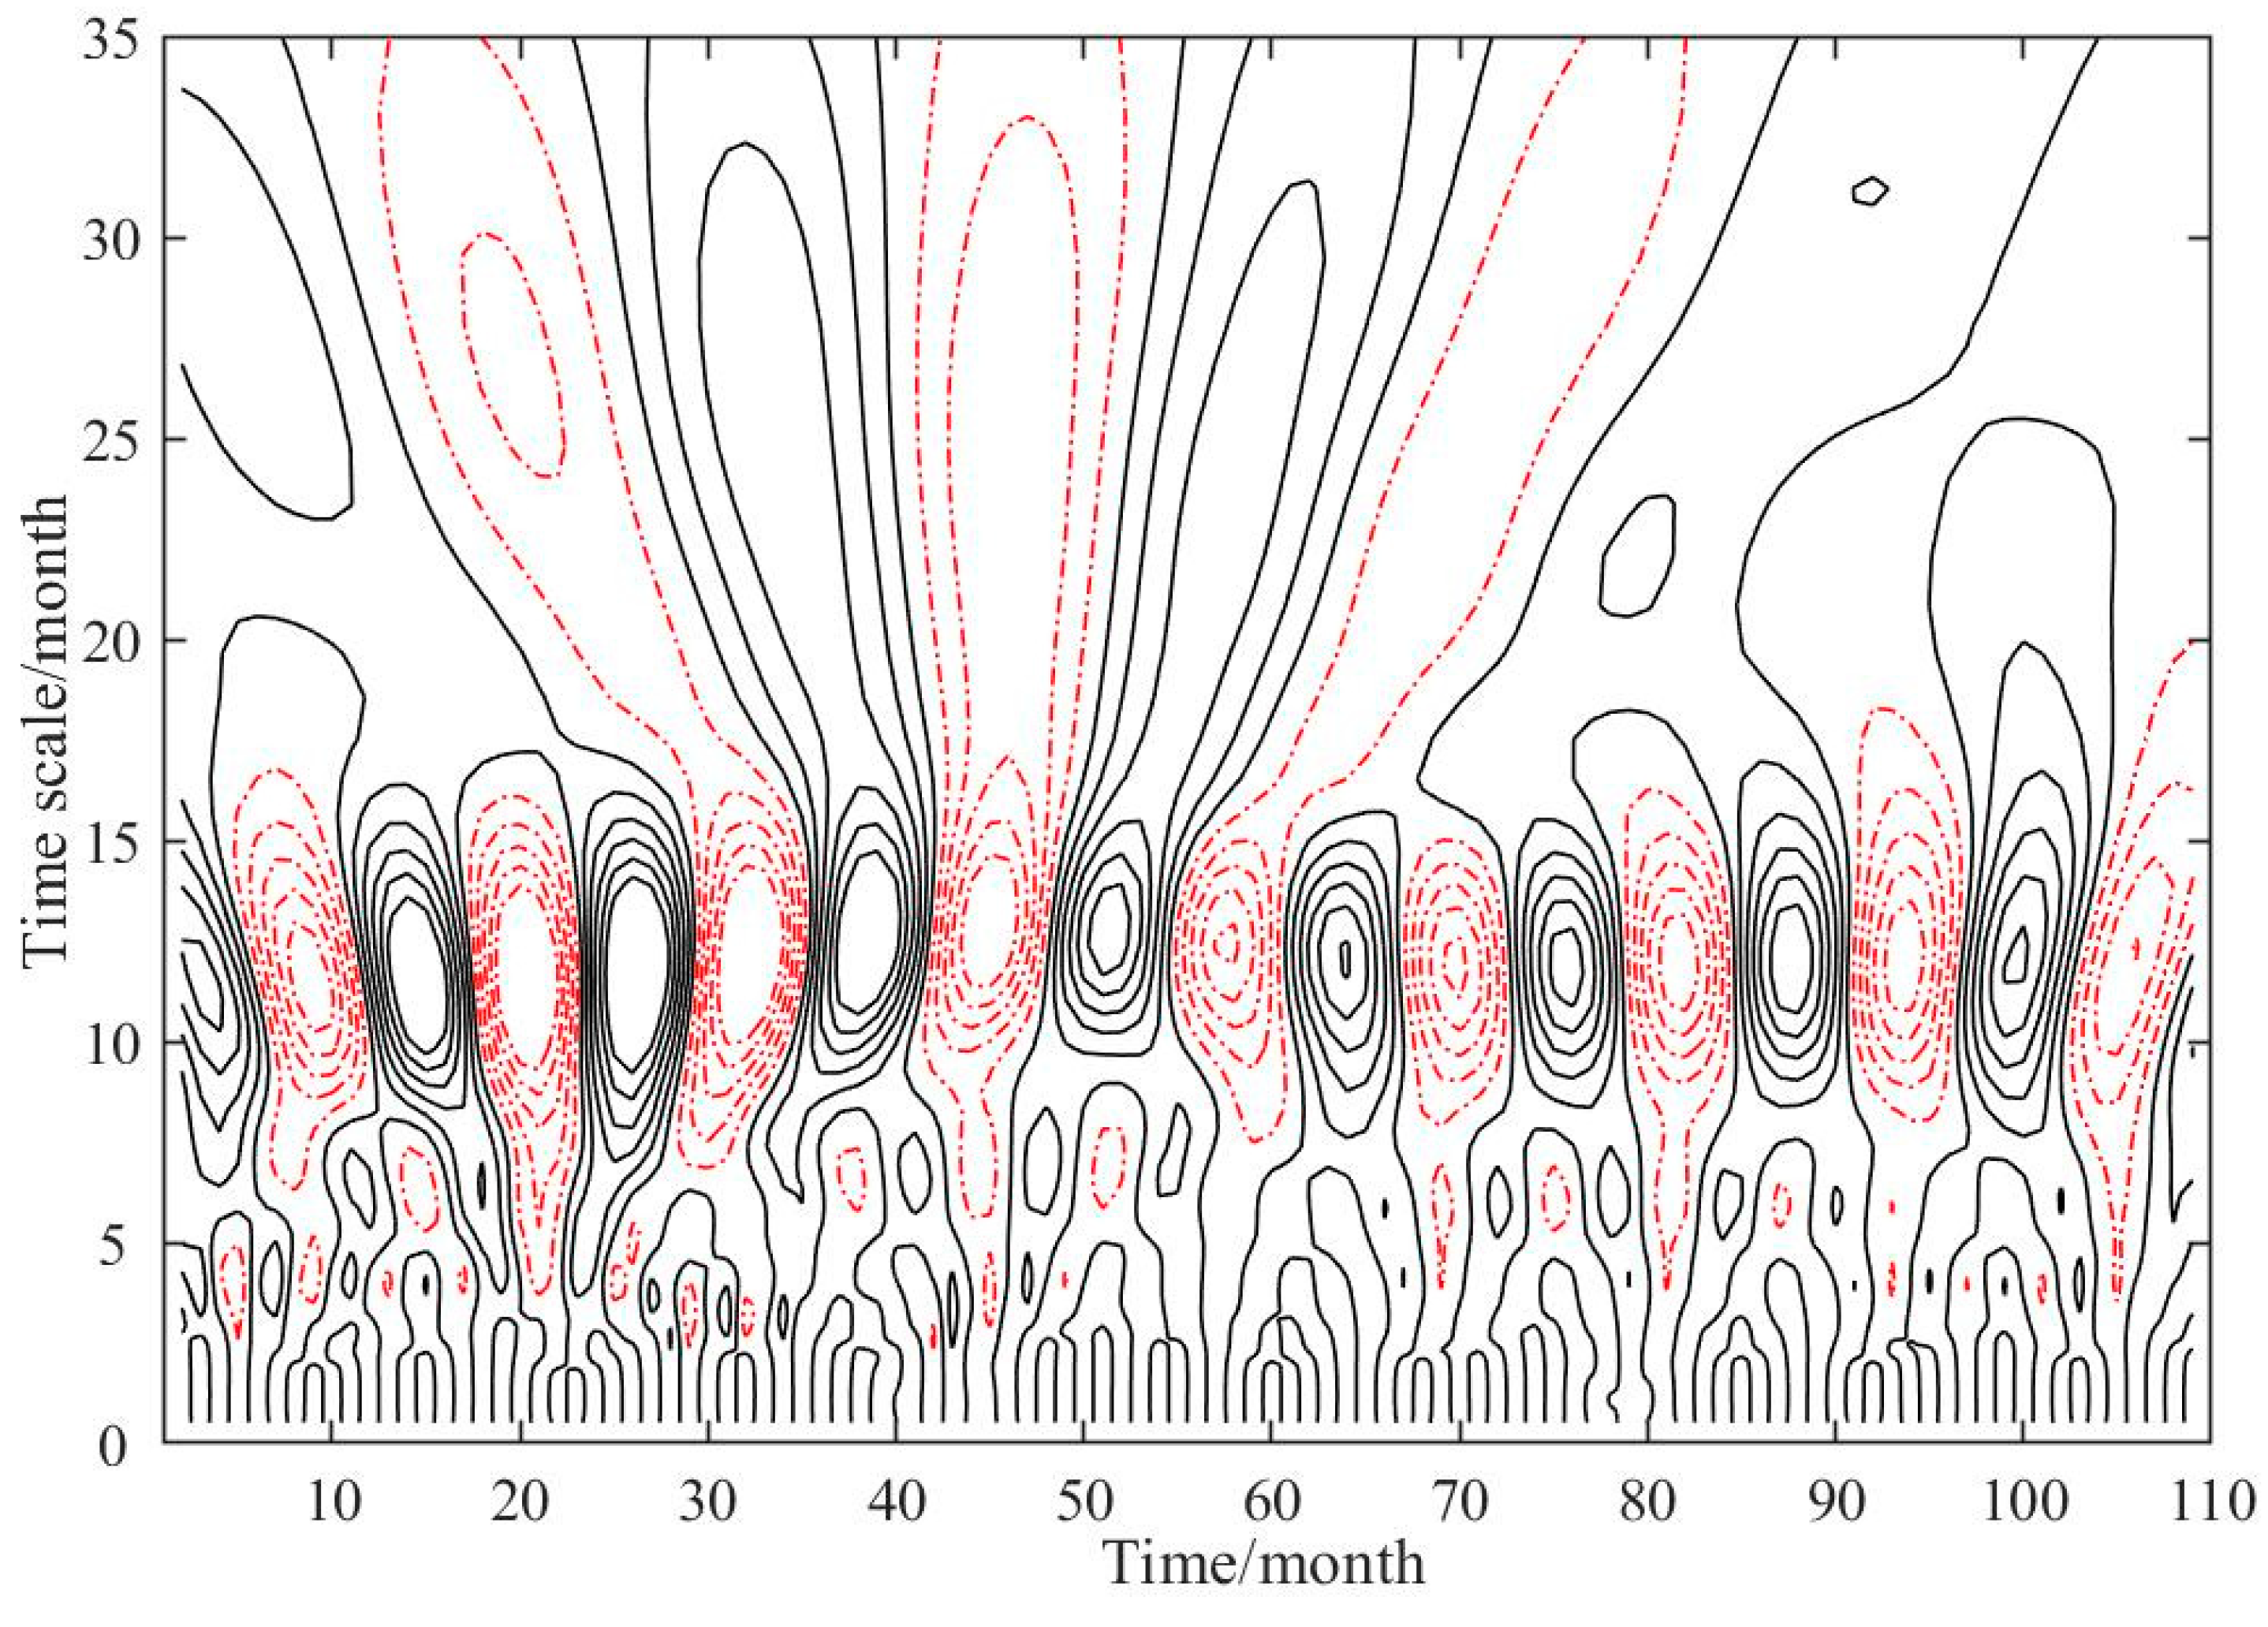
3.3. Periodic Evolution Characteristics of Groundwater Level
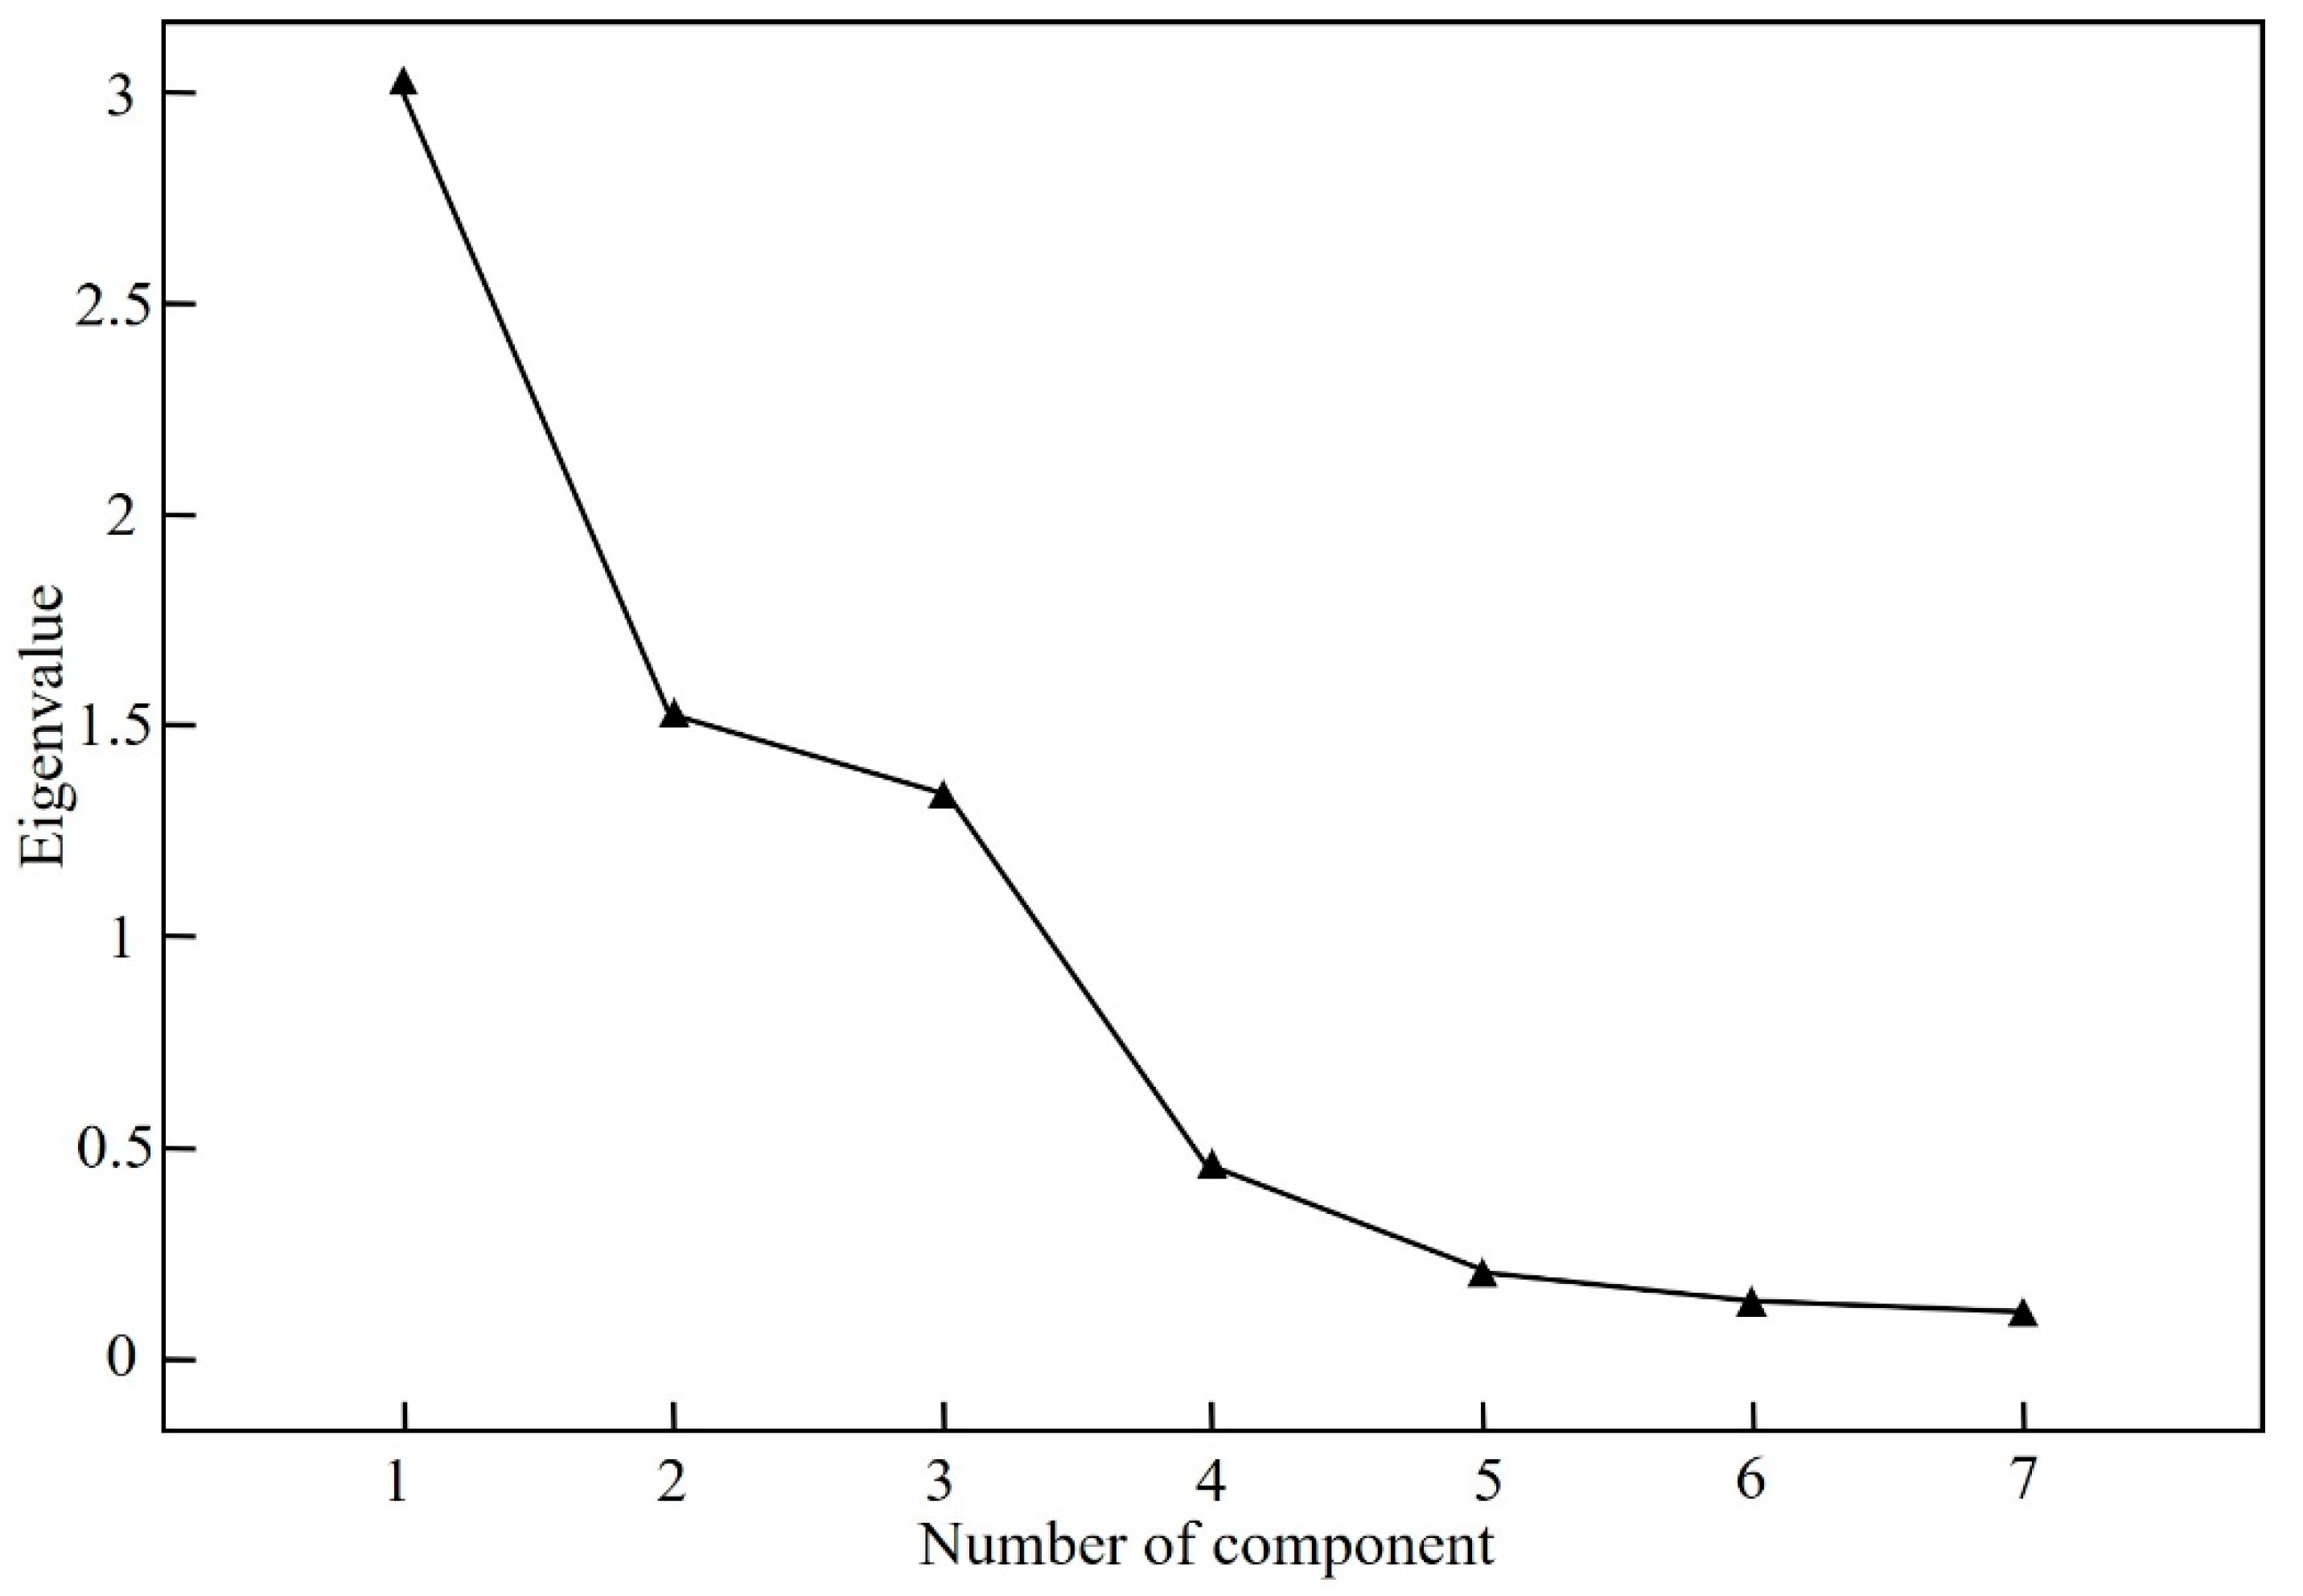
3.4. Quantitative Analysis of Major Influencing Factors of Groundwater Level
4. Conclusions
Author Contributions
Funding
Acknowledgments
Conflicts of Interest
References
- Wada, Y.; van Beek, L.P.H.; van Kempen, C.M.; Reckman, J.W.T.M.; Vasak, S.; Bierkens, M.F.P. Global depletion of groundwater resources. Geophys. Res. Lett. 2010, 37, L20402. [Google Scholar] [CrossRef] [Green Version]
- Viviana, R.E. Groundwater Management in Arid and Semi-Arid Regions: Challenges and Opportunities. In Proceedings of the 3rd National Meeting on Hydrogeology, Cagliari, Italy, 14–16 June 2017. [Google Scholar]
- Rohde, M.M.; Froend, R.; Howard, J. A Global Synthesis of Managing Groundwater Dependent Ecosystems under Sustainable Groundwater Policy. Groundwater 2017, 55, 293–301. [Google Scholar] [CrossRef] [PubMed]
- Xu, X.; Huang, G.; Sun, C.; Pereira, L.S.; Ramos, T.B.; Huang, Q.; Hao, Y. Assessing the effects of water table depth on water use, soil salinity and wheat yield: Searching for a target depth for irrigated areas in the upper yellow river basin. Agric. Water Manag. 2013, 125, 46–60. [Google Scholar] [CrossRef]
- Xu, W.; Su, X.S. Challenges and impacts of climate change and human activities on groundwater-dependent ecosystems in arid areas–A case study of the Nalenggele alluvial fan in NW China. J. Hydrol. 2019, 573, 376–385. [Google Scholar] [CrossRef]
- Skrzypek, G.; Dogramaci, S.; Rouillard, A.; Grierson, P.F. Groundwater seepage controls salinity in a hydrologically terminal basin of semi-arid northwest Australia. J. Hydrol. 2016, 542, 627–636. [Google Scholar] [CrossRef]
- Alfarrah, N.; Walraevens, K. Groundwater Overexploitation and Seawater Intrusion in Coastal Areas of Arid and Semi-Arid Regions. Water 2018, 10, 143. [Google Scholar] [CrossRef] [Green Version]
- Keilholz, P.; Disse, M.; Halik, Ü. Effects of land use and climate change on groundwater and ecosystems at the middle reaches of the Tarim River using the MIKE SHE integrated hydrological model. Water 2015, 7, 3040–3056. [Google Scholar] [CrossRef] [Green Version]
- Abliz, A.; Tiyip, T.; Ghulam, A.; Halik, Ü.; Ding, J.L.; Sawut, M.; Zhang, F.; Nurmemet, I.; Abliz, A. Effects of shallow groundwater table and salinity on soil salt dynamics in the Keriya oasis, northwestern China. Environ. Earth Sci. 2016, 75, 260. [Google Scholar] [CrossRef]
- Hao, Y.Y.; Xie, Y.W.; Ma, J.H.; Zhang, W.P. The critical role of local policy effects in arid watershed groundwater resources sustainability: A case study in the Minqin oasis, China. Sci. Total Environ. 2017, 601, 1084–1096. [Google Scholar] [CrossRef]
- Rodell, M.; Velicogna, I.; Famiglietti, J.S. Satellite-based estimates of groundwater depletion in India. Nature 2009, 460, 999–1002. [Google Scholar] [CrossRef] [Green Version]
- Tweed, S.; Leblanc, M.; Cartwright, I.; Favreau, G.; Leduc, C. Arid zone groundwater recharge and salinization processes; an example from the Lake Eyre Basin, Australia. J. Hydrol. 2011, 408, 257–275. [Google Scholar] [CrossRef]
- Konikow, L.F. Long-term groundwater depletion in the United States. Groundwater 2014, 53, 2–9. [Google Scholar] [CrossRef] [PubMed]
- Powell, O.; Fensham, R. The history and fate of the Nubian Sandstone Aquifer springs in the oasis depressions of the Western Desert, Egypt. Hydrol. J. 2015, 24, 395–406. [Google Scholar] [CrossRef]
- Alcalá, F.J.; Martínez-Valderrama, J.; Robles-Marín, P.; Guerrera, F.; Martín-Martín, M.; Raaelli, G.; DeLeón, J.T.; Asebriy, L. A hydrological-economic model for sustainable groundwater use in sparse-data drylands: Application to the amtoudi oasis in southern Morocco, northern Sahara. Sci. Total Environ. 2015, 537, 309–322. [Google Scholar] [CrossRef]
- Zhang, M.; Luo, G.; Hamdi, R.; Qiu, Y.; Wang, X.; Maeyer, P.D.; Kurban, A. Numerical simulations of the impacts of mountain on oasis effects in arid Central Asia. Atmosphere 2017, 8, 212. [Google Scholar] [CrossRef] [Green Version]
- Ali, R.; McFarlane, D.; Varma, S.; Dawes, W.; Emelyanova, I.; Hodgson, G.; Charles, S. Potential climate change impacts on groundwater resources of south-western Australia. J. Hydrol. 2012, 475, 456–472. [Google Scholar] [CrossRef]
- Taylor, R.G.; Scanlon, B.; Döll, P.; Rodell, M.; Beek, R.V.; Wada, Y.; Longuevergne, L.; Leblanc, M.; Famiglietti, J.; Edmunds, M.; et al. Ground water and climate change. Nat. Clim. Chang. 2012, 3, 322–329. [Google Scholar] [CrossRef] [Green Version]
- Ma, J.Z.; Wang, X.S.; Edmunds, W.M. The characteristics of ground-water resources and their changes under the impacts of human activity in the arid Northwest China—a case study of the Shiyang River Basin. J. Arid Environ. 2005, 61, 277–295. [Google Scholar] [CrossRef]
- Khan, H.H.; Khan, A.; Ahmed, S.; Perrin, J. GIS-based impact assessment of land-use changes on groundwater quality: Study from a rapidly urbanizing region of South India. Environ. Earth Sci. 2010, 63, 1289–1302. [Google Scholar] [CrossRef]
- Russo, T.A.; Lall, U. Depletion and response of deep groundwater to climate-induced pumping variability. Nat. Geosci. 2017, 10, 105–108. [Google Scholar] [CrossRef]
- Malekinezhad, H.; Banadkooki, F.B. Modeling impacts of climate change and human activities on groundwater resources using MODFLOW. J. Water Clim. Chang. 2017, 9, 156–177. [Google Scholar] [CrossRef]
- Wang, W.K.; Zhang, Z.Y.; Duan, L.; Wang, Z.F.; Zhao, Y.Q.; Dei, M.L.; Liu, H.Z.; Zheng, X.Y.; Sun, Y.B. Response of the groundwater system in the Guanzhong Basin (central China) to climate change and human activities. Hydrogeol. J. 2018, 26, 1429–1441. [Google Scholar] [CrossRef]
- Feng, D.P.; Zheng, Y.; Mao, Y.X.; Zhang, A.J.; Wu, B.; Li, J.G.; Tian, Y.; Wu, X. An integrated hydrological modeling approach for detection and attribution of climatic and human impacts on coastal water resources. J. Hydrol. 2018, 557, 305–320. [Google Scholar] [CrossRef]
- Zheng, C.; Lu, Y.D.; Guo, X.H.; Li, H.H.; Sai, J.M.; Liu, X.H. Application of HYDRUS-1D model for research on irrigation infiltration characteristics in arid oasis of northwest China. Environ. Earth Sci. 2017, 76, 785. [Google Scholar] [CrossRef]
- Li, X.G.; Xia, W.; Lu, Y.D. Optimising the allocation of groundwater carrying capacity in a data-scarce region. Water SA 2010, 36, 451–460. [Google Scholar] [CrossRef] [Green Version]
- Cui, G.Q.; Lu, Y.D.; Zheng, C.; Liu, Z.H.; Sai, J.M. Relationship between soil salinization and groundwater hydration in Yaoba Oasis, Northwest China. Water 2019, 11, 175. [Google Scholar] [CrossRef] [Green Version]
- Mann, H.B. Non parametric tests against trend. Econ. Trica 1945, 13, 245–259. [Google Scholar]
- Kendall, M.G. Rank Correlation Methods; Charles Griffin: London, UK, 1975. [Google Scholar]
- Lacombe, G.; McCartney, M.; Forkuor, G. Drying climate in Ghana over the period 1960–2005: Evidence from the resampling-based Mann–Kendall test at local and regional levels. Hydrol. Sci. J. 2012, 57, 1594–1609. [Google Scholar] [CrossRef] [Green Version]
- Polemio, M.; Lonigro, T. Trends in climate, short-duration rainfall, and damaging hydrogeological events (Apulia, Southern Italy). Nat. Hazards 2015, 75, 515–540. [Google Scholar] [CrossRef]
- Chowdhury, R.K.; Beecham, S.; Boland, J.; Piantadosi, J. Understanding South Australian rainfall trends and step changes. Int. J. Climatol. 2015, 35, 348–360. [Google Scholar] [CrossRef]
- Wu, H.; Qian, H. Innovative trend analysis of annual and seasonal rainfall and extreme values in Shaanxi, China, since the 1950s. Int. J. Climatol. 2016, 37, 2582–2592. [Google Scholar] [CrossRef]
- Hamed, K.H. Trend detection in hydrologic data: The Mann–Kendall trend test under the scaling hypothesis. J. Hydrol. 2008, 349, 350–363. [Google Scholar] [CrossRef]
- Jia, Z.X.; Zang, H.F.; Zheng, X.Q.; Xu, Y.X. Climate change and its influence on the karst groundwater recharge in the Jinci Spring Region, Northern China. Water 2017, 9, 267. [Google Scholar] [CrossRef] [Green Version]
- Coulibaly, P.; Burn, D.H. Wavelet analysis of variability in annual Canadian streamflows. Water Resour. Res. 2004, 40, W03105.1–W03105.14. [Google Scholar] [CrossRef]
- Partal, T. Wavelet analysis and multi-scale characteristics of the runoff and precipitation series of the Aegean region (Turkey). Int. J. Climatol. 2010, 32, 108–120. [Google Scholar] [CrossRef]
- Adamowski, J.; Chan, H.F. A wavelet neural network conjunction model for groundwater level forecasting. J. Hydrol. 2011, 407, 28–40. [Google Scholar] [CrossRef]
- Khalil, B.; Broda, S.; Adamowski, J.; Ozga-Zielinski, B.; Donohoe, A. Short-term forecasting of groundwater levels under conditions of mine-tailings recharge using wavelet ensemble neural network models. Hydrogeol. J. 2014, 23, 121–141. [Google Scholar] [CrossRef]
- Nourani, V.; Mehr, A.D.; Azad, N. Trend analysis of hydroclimatological variables in Urmia lake basin using hybrid wavelet Mann–Kendall and Şen tests. Environ. Earth Sci. 2018, 77, 207. [Google Scholar] [CrossRef]
- Mencio, A.; Mas-Pla, J. Assessment by multivariate analysis of groundwater-surface water interactions in urbanized Mediterranean streams. J. Hydrol. 2008, 352, 355–366. [Google Scholar] [CrossRef]
- Cloutier, V.; Lefebvre, R.; Therrien, R.; Savard, M.M. Multivariate statistical analysis of geochemical data as indicative of the hydrogeochemical evolution of groundwater in a sedimentary rock aquifer system. J. Hydrol. 2008, 353, 294–313. [Google Scholar] [CrossRef]
- Gangopadhyay, S.; Das Gupta, A.; Nachabe, M.H. Evaluation of ground water monitoring network by principal component analysis. Ground Water 2001, 39, 181–191. [Google Scholar] [CrossRef] [PubMed]
- Halim, M.A.; Majumder, R.K.; Nessa, S.A.; Oda, K.; Hiroshiro, Y.; Jinno, K. Arsenic in shallow aquifer in the eastern region of Bangladesh: Insights from principal component analysis of groundwater compositions. Environ. Monit. Assess. 2010, 161, 453–472. [Google Scholar] [CrossRef] [PubMed]
- Hu, S.; Luo, T.; Jing, C.Y. Principal component analysis of fluoride geochemistry of groundwater in Shanxi and Inner Mongolia, China. J. Geochem. Explor. 2013, 135, 124–129. [Google Scholar] [CrossRef]
- Li, H.H.; Lu, Y.D.; Zheng, C.; Yang, M.; Li, S.L. Groundwater level prediction for the arid oasis of northwest China based on the artificial bee colony algorithm and a back-propagation neural network with double hidden layers. Water 2019, 11, 860. [Google Scholar] [CrossRef] [Green Version]
- Li, X.; Lu, Y.D.; Zhang, X.Z.; Zhang, R.; Fan, W.; Pan, W.S. Influencing Factors of the Spatial-Temporal Variation of Layered Soils and Sediments Moistures and Infiltration Characteristics under Irrigation in a Desert Oasis by Deterministic Spatial Interpolation Methods. Water 2019, 11, 1483. [Google Scholar] [CrossRef] [Green Version]
- Abdalla, O.A.E. Groundwater discharge mechanism in semi-arid regions and the role of evapotranspiration. Hydrol. Process. 2008, 22, 2993–3009. [Google Scholar] [CrossRef]
- Haj-Amor, Z.; Tóth, T.; Ibrahimi, M.K.; Bouri, S. Effects of excessive irrigation of date palm on soil salinization, shallow groundwater properties, and water use in a Saharan oasis. Environ. Earth Sci. 2017, 76, 590. [Google Scholar] [CrossRef]
- Zhang, Z.D.; Wan, L.W.; Dong, C.W.; Xie, Y.C.; Yang, C.X. Impacts of climate change and human activities on the surface runoff in the Wuhua River Basin. Sustainability 2018, 10, 3405. [Google Scholar] [CrossRef] [Green Version]
- Uddameri, V.; Honnungar, V.; Hernandez, E.A. Assessment of groundwater water quality in central and southern Gulf Coast aquifer, TX using principal component analysis. Environ. Earth Sci. 2014, 71, 2653–2671. [Google Scholar] [CrossRef]


| Climatic Factor | Temperature | Rainfall | Evaporation | Relative Humidity |
|---|---|---|---|---|
| Tendency rate | +0.0398 C/year | +0.8186 mm/year | −4.8801 mm/year | −0.1213%/year |
| R value | 0.812 ** | 0.276 * | −0.599 ** | −0.670 ** |
| Mutation year | 1986 | 1989, 2005, and 2009 | 2007 | 1980 |
| Monitoring Year | Monitoring Well | Range of Groundwater Level (m) | Decline Amplitude (m) | Decline Rate (m) | Location |
|---|---|---|---|---|---|
| 1981~1997 | ZB-01 | 1285.77–1282.04 | 3.73 | 0.22 | North-central |
| ZB-02 | 1289.29–1286.03 | 3.25 | 0.20 | Central | |
| ZB-03 | 1291.62–1288.70 | 2.92 | 0.17 | South-central | |
| ZB-04 | 1284.47–1279.82 | 4.64 | 0.27 | West-central | |
| 1997~2004 | ZB-01 | 1282.04–1279.04 | 3.01 | 0.38 | North-central |
| ZB-02 | 1286.03–1278.43 | 7.60 | 0.95 | Central | |
| ZB-03 | 1288.70–1279.37 | 9.33 | 1.17 | South-central | |
| ZB-04 | 1279.82–1277.87 | 1.95 | 0.24 | West-central | |
| 2004~2008 | ZB-01 | 1279.04–1278.10 | 0.94 | 0.19 | North-central |
| ZB-02 | 1278.43–1276.93 | 1.50 | 0.30 | Central | |
| ZB-03 | 1279.37–1278.25 | 1.12 | 0.22 | South-central | |
| ZB-04 | 1277.87–1277.23 | 0.64 | 0.13 | West-central | |
| ZB-05 | 1274.55–1273.50 | 1.05 | 0.21 | South | |
| ZB-06 | 1276.02–1275.82 | 0.20 | 0.04 | South | |
| 2008~2018 | ZB-01 | 1278.10–1276.94 | 1.15 | 0.12 | North-central |
| ZB-02 | 1276.93–1277.27 | −0.34 | −0.03 | Central | |
| ZB-03 | 1278.25–1279.08 | −0.83 | −0.08 | South-central | |
| ZB-04 | 1277.23–1276.30 | 0.93 | 0.09 | West-central | |
| ZB-05 | 1273.50–1274.05 | −0.55 | −0.06 | South | |
| ZB-06 | 1275.82–1274.92 | 0.90 | 0.09 | South |
| Location | Aquifer Group | Monitoring Month | Area of Cone of Depression (km2) | Form | Central Groundwater Level (m) |
|---|---|---|---|---|---|
| East | Q2+3 | 1985/7 | 1.13 | Mussel shape | 1280.42 |
| Central | Q2+3 | 2008/7 | 27.16 | Oval shape | 1267.63 |
| Central | Q2+3 | 2018/7 | 11.26 | Mussel shape | 1274.26 |
| Q2+3 | 2018/3 | 9.84 | Mussel shape | 1276.59 |
| Monitoring Well | ZB-01 | ZB-02 | ZB-03 |
|---|---|---|---|
| Main Periodicity | 12, 20 months | 12, 22 months | 12 months |
| Periodic Evolution of Different Time Scales | 17–35 months, 4 times; 7–15 months, 9 times | 17–35 months, 4 times; 7–15 months, 9 times | 20–35 months, 4 times; 7–15 months, 9 times |
| Monitoring Well | ZB-04 | ZB-05 | ZB-06 |
| Main Periodicity | 12, 25 months | 12, 21 months | 12, 20 months |
| Periodic Evolution of Different Time Scales | 20–35 months, 4 times; 7–15 months, 9 times | 17–35 months, 4 times; 7–15 months, 9 times | 20–40 months, 4 times; 7–15 months, 9 times |
| Factor | X1 | X2 | X3 | X4 | X5 | X6 | X7 |
|---|---|---|---|---|---|---|---|
| X1 | 1 | −0.202 | −0.098 | 0.375 | −0.143 | 0.377 | −0.106 |
| X2 | −0.202 | 1 | 0.282 | −0.401 | −0.773 | −0.377 | −0.789 |
| X3 | −0.098 | 0.282 | 1 | −0.473 | −0.226 | 0.155 | −0.244 |
| X4 | 0.375 | −0.401 | −0.473 | 1 | 0.139 | −0.131 | 0.147 |
| X5 | −0.143 | −0.773 | −0.226 | 0.139 | 1 | 0.392 | 0.921 |
| X6 | 0.377 | −0.377 | 0.155 | −0.131 | 0.392 | 1 | 0.236 |
| X7 | −0.106 | −0.789 | −0.244 | 0.147 | 0.921 | 0.236 | 1 |
| Principal Component | Eigenvalue | Initial Eigenvalues | Extraction | Extraction Sums of Squared Loadings | |||
|---|---|---|---|---|---|---|---|
| Variance Contribution Rate | Cumulative Contribution Rate | Communalities | Principal Eigenvalue | Variance Contribution Rate | Cumulative Contribution Rate | ||
| 1 | 3.023 | 43.189 | 43.189 | 0.901 | 3.023 | 43.189 | 43.189 |
| 2 | 1.573 | 22.465 | 65.654 | 0.867 | 1.573 | 22.465 | 65.654 |
| 3 | 1.366 | 19.511 | 85.164 | 0.676 | 1.366 | 19.511 | 85.164 |
| 4 | 0.538 | 7.690 | 92.854 | 0.802 | |||
| 5 | 0.295 | 4.216 | 97.070 | 0.950 | |||
| 6 | 0.159 | 2.275 | 99.345 | 0.847 | |||
| 7 | 0.046 | 0.655 | 100 | 0.921 | |||
| Principal Component | Eigenvector | ||||||
|---|---|---|---|---|---|---|---|
| X1 | X2 | X3 | X4 | X5 | X6 | X7 | |
| 1 | 0.190 | −0.534 | −0.368 | 0.207 | 0.429 | 0.148 | 0.015 |
| 2 | −0.453 | 0.018 | 0.471 | −0.153 | 0.765 | 0.234 | 0.721 |
| 3 | 0.637 | −0.059 | 0.341 | −0.075 | −0.113 | 0.252 | −0.178 |
© 2020 by the authors. Licensee MDPI, Basel, Switzerland. This article is an open access article distributed under the terms and conditions of the Creative Commons Attribution (CC BY) license (http://creativecommons.org/licenses/by/4.0/).
Share and Cite
Li, H.; Lu, Y.; Zheng, C.; Zhang, X.; Zhou, B.; Wu, J. Seasonal and Inter-Annual Variability of Groundwater and Their Responses to Climate Change and Human Activities in Arid and Desert Areas: A Case Study in Yaoba Oasis, Northwest China. Water 2020, 12, 303. https://doi.org/10.3390/w12010303
Li H, Lu Y, Zheng C, Zhang X, Zhou B, Wu J. Seasonal and Inter-Annual Variability of Groundwater and Their Responses to Climate Change and Human Activities in Arid and Desert Areas: A Case Study in Yaoba Oasis, Northwest China. Water. 2020; 12(1):303. https://doi.org/10.3390/w12010303
Chicago/Turabian StyleLi, Huanhuan, Yudong Lu, Ce Zheng, Xiaonan Zhang, Bao Zhou, and Jing Wu. 2020. "Seasonal and Inter-Annual Variability of Groundwater and Their Responses to Climate Change and Human Activities in Arid and Desert Areas: A Case Study in Yaoba Oasis, Northwest China" Water 12, no. 1: 303. https://doi.org/10.3390/w12010303
APA StyleLi, H., Lu, Y., Zheng, C., Zhang, X., Zhou, B., & Wu, J. (2020). Seasonal and Inter-Annual Variability of Groundwater and Their Responses to Climate Change and Human Activities in Arid and Desert Areas: A Case Study in Yaoba Oasis, Northwest China. Water, 12(1), 303. https://doi.org/10.3390/w12010303