1. Introduction
A risk management methodology is presented for the adaptation of water supply to changing climate and land-use activities, considering the socio-economic aspects. The main purpose is to apply a practical tool for selecting and ranking risk reduction measures or management actions under the pressure of climate change for water suppliers and/or water authorities.
The impact of climate change on drinking water sources is a critical issue for society and the economy. The main water supply problems are related to the significant change of groundwater quantity and quality observed in the last decades as an effect of land-use practices and climate change. This may affect the ability of drinking water suppliers to provide enough water of sufficient quality to the consumers. Most of the practical problems that we face today with the on-site management of drinking water sources and the distribution of healthy drinking water originate from past actions, interventions, and political decisions.
Large parts of the population live in cities and the main threat to domestic water resources in urban areas is the constant input of pollutant loads from roads, roofs, sewers, industry, and agricultural areas. Groundwater pollution depends on land-use and hydrological status, which are both influenced by climate change. However, the assessment of the effects on groundwater levels and groundwater quality within the urban environment is not a trivial exercise [
1]. Groundwater quality has to meet high drinking water quality standards. A well-established and enforced drinking water protection policy is of utmost importance because preventing source water contamination is often easier and less costly than treating contaminated water. Water resource protection measures mostly include land-use management. The establishment of drinking water protection areas is encouraged also in European legislation [
2], but it is not enforced in all Member States. Moreover, WHO published many guidelines for the drinking-water source protection management, including groundwater protection zones and water safety plans [
3,
4]. A water safety plan is a complex management system with a comprehensive risk assessment and risk management approach, encompassing all steps in water supply from catchment to consumer. This concept was adopted also in the Drinking Water Directive [
5,
6].
Concerning drinking water sources the main risks are connected with assuring good water quality and sufficient water quantity. For this, several management options exists, such as measures for sustainable groundwater use with optimizing water demand [
7,
8,
9,
10], alternative water sources [
9,
11,
12] reserve drinking water source, establishment of drinking water protection zones involving land-use planning and different incentives [
13,
14,
15].
2. Materials and Methods
The “Fuzzy Decimaker” is used for ranking alternative measures for adaptation of water supply to changing climate and land-use activities considering socio-economic aspects. The methodology is based on a Multiple Criterion Decision Making (MCDM) technique called Composite Programming (CP) [
16,
17,
18,
19]. The structure of a CP model is formed by grouping the basic indicators into clusters based on either similar characteristic or by the desire to contrast different features through trade-off analysis. The initial sets of indicators that result from grouping basic indicators are called first-level indicators. Second-level indicators are formed by grouping first-level indicators, with subsequent levels formed by continued grouping until the highest-level indicators have been specified.
Composite Programming (CP) organizes a problem into the following steps: (1) formulation of management actions; (2) definition of the structure of ranking criteria (indicators); (3) estimation of ranking criteria values for each management action (weights, balancing factors, and ideal and worst-case values); and (4) ranking of the management actions according to the ranking criteria.
Moreover, conditions regarding climate change and socio-economic development are very uncertain, thus a risk-based approach is warranted. Probabilistic risk analysis assessment commonly uses frequency-based statistical information. This is unavailable in our case. To this end, a non-probabilistic risk analysis is used that is relatively simple, practical, and applicable with available data/information. The method is based on simplified fuzzy set mathematics. Thus, basic indicators representing climate change situations and future land-use activities are represented as uncertain (fuzzy) numbers with a minimum, a maximum, and between them two plausible values [
20].
For adaptation to climate change-induced impacts, a water supply company must define management options (alternatives/scenarios). A reduction of water quantity risk can be achieved by implementing various supply management options (water source, water supply system) and/or water demand management. With this, management options can be focused on tackling issues on either supply side or demand side, depending on the particular issue the water supply company is facing. These options may include e.g., engineering interventions to enhance water resources; reduction of water losses in water pipelines; storage reservoirs; alternative supplies (new water resources, alternative recharge of existing water resources), etc. Water demand management may introduce less water demanding crops, change industrial technology, water reuse economic actions (e.g., change of water pricing), prioritization and competitiveness (management of imbalances), and managing water allocation, etc. The reduction of water quality risk can be achieved by implementing various water quality management options, such as installing water treatment plants, implementation of best practices for agriculture, forestry, urbanization, and other land-uses, and legislative options (e.g., changing environmental standards (lowering limits for nitrate), implementation of drinking water protection areas with restrictions of interventions and land-uses). Often, various combinations of the above-mentioned management options can be applied. Such combinations may offer a very promising alternative by considering possible simultaneous changes in supply, demand, consequences, allocation, and water quality.
A management action is defined using chemical, physical, and biological indicators and social, economic, or political criteria as well. These basic indicators can be selected as preferred by the decision-maker, a water supply manager, or a state agency for example. The basic indicators are grouped into fewer, more general groups, called first-level indicators. The grouping continues until only two or three composite indicators (e.g., water supply risk and realization of the actions) remain; both water quantity and quality risk are considered.
After the indicators have been grouped into the structure, weights for the indicators are assessed. These weights represent the relative importance of each indicator as viewed by the decision-maker.
Balancing factors are assigned to each group of indicators. Balancing factors reflect the relative importance that is assigned to the maximal deviations of the indicators and limit the ability of one indicator to substitute for another. In other words, it reflects the strength of the preference for a particular objective, defining its relative importance. Generally, the balancing factors and weights are derived for public institutional inputs.
For each basic indicator reference values are assessed. Reference values are ideal and worst-case values. Indicators can be very different (quantity, quality, etc.); therefore, actual values of the individual indicators using reference data must be normalized for enabling intra-comparison.
Fuzzy Decimaker calculates a combined (weighted) distance for each criterion between the “ideal” point (where every criterion in the group has the reference value) and the actual point (where every criterion in the group has the actual value).
The set of weights are determined also among the groups (e.g., spatial versus temporal differences). Fuzzy Decimaker calculates a combined distance considering all groups to represent the ranking of the management scenario compared to a set reference value. At this point, the final composition between the two highest-level indicators is reached.
The idea of ranking is illustrated in
Figure 1. In the case of no uncertainty in the actual values of the indicators, each management action will appear as a single point (
Figure 1a). However, the present case is different because the indicators’ values are uncertain. As a result, each management action will appear as a trapezoid (
Figure 1b).
The curves separate specified groups of actions, for instance, actions that fall beyond the 0.3 or 30% boundary may be considered the “best” actions, those that fall between 30% and 60% are “average,” and those that fall below the 60% curve are the worst. The methodology of ranking management actions by composite programming and fuzzy logic to account for the uncertainty in the actual values of indicators is presented more in detail [
18,
19].
There are many positive aspects of using the MCDM methodology. Both quantitative and qualitative data can be applied, compared, and used for ranking management actions. These data can originate from various groups that may conflict with each other (e.g., ecology, economics, and political issues). The MCDM hierarchical structure can be developed to be as simple or complex as the user defines. The idea of developing a ranking based on distance from an ideal reference point can be easily understood and can be described to all types of individuals involved with the water supply measures classification process.
3. Results
3.1. The Case Study of Ljubljana Drinking Water Supply
Ljubljana is the capital and largest city of the Republic of Slovenia with a population of 270,000 inhabitants. It is situated in the heart of Slovenia, 298 m above sea level, in a broad alluvial basin between the Alps and the Adriatic Sea. The City Municipality covers 275 km2 and now has eight surrounding communities, collectively forming the Ljubljana agglomeration of over 903 km2 area. The Ljubljana Public Utility is responsible for water supply for the city residents together with management of the water supply system, its surveillance, and maintenance.
The Ljubljana Field aquifer (
Figure 2) is an unconfined alluvial porous aquifer and is one of the biggest porous aquifers in Slovenia. The phreatic groundwater is recharged from precipitation and from the Sava River, which has a rain-snow flow regime [
1,
21,
22]. The Ljubljana Field aquifer is more than 100 m deep; the average groundwater level is 13 m under the surface and oscillates about 3 m. The sandy gravel unsaturated zone with a thickness of 5 to 25 m has an important role in the fate of pollutants due to geochemical processes. The hydraulic conductivity of coarse sediments is very good, from 10 × 10
−2 m/s in the central part to 3.7 × 10
−3 m/s on the plain borders [
1,
21]. The groundwater flow velocity is from several meters to several tenths of a meter per day [
1,
21,
22].
The Ljubljana Field porous aquifer is the source of drinking water for nearly 300,000 inhabitants of the Ljubljana city and its surroundings. There are four waterworks (
Figure 2): Kleče, Hrastje, Šentvid, and Jarški prod. The highest portion of drinking water is pumped from the water well field Kleče. All wellfields are located in the Ljubljana Field aquifer, therefore Ljubljana water supply needs and alternative drinking water source in case of pollution.
The main land-use according to the CORINE land cover database is agricultural (43%;
Figure 2) and is the predominant land-use in the recharge area of the Ljubljana water supply. This is due to the early establishment of drinking water resource protection zones (1965) with restrictions in land-use and other actions. By that time agriculture was not identified as a threat to groundwater quality. Now, meadows, organic, and integrated farming are allowed within the narrowest drinking water protection zone, whereas new construction sites and industry are prohibited. Urban areas and industrial areas occupy 41% of the Ljubljana Field aquifer area (
Figure 2). Minor land-uses are forests and semi-natural areas (13%) and water bodies—the Sava River and its right tributary, the Ljubljanica River (3%). The main pollutants occurring in the groundwater of the Ljubljana Field aquifer are from agriculture, the sewage system (also septic tanks in some areas), traffic and industry [
23], but the concentrations are far below the drinking water limit. Nitrate concentrations are mostly low (around 10 mg·L
−1) [
23]. Pesticide pollution was a problem in the past, but now the concentrations are below the drinking water limit (1000 ng/L) [
23]. Occasionally some pesticides can be found in groundwater (e.g., metazachlore). Urban pollutants are chromium (historic pollution from the past), trichloroethene (industry), and
E. coli and coliform bacteria (septic tanks) [
23].
Ljubljana Field aquifer has a very good groundwater quality; therefore, there is no treatment of water prior to supplying and water from wells goes directly to the water supply system. This is mainly due to already established water protection areas in the recharge area of all four existing water well fields (
Figure 2).
As the aquifer is very deep, there is sufficient water for drinking water supply, but water balance and groundwater modeling of worst-case climate change scenarios have shown 7% decrease in future groundwater recharge [
24,
25] by 2071–2100, which has to be considered in risk assessments in the future. In the period 2021–2050, the recharge is supposed to increase by 12% due to more precipitation in this area [
24,
25]. For the present study, groundwater quantity was not considered as a risk also due to groundwater level trends, which are positive in all (except one) observation wells from the state monitoring [
26].
3.2. Management Options for the Ljubljana Drinking Water Supply
For adaptation to climate change-induced changes, water supply companies must define alternative management options (scenarios). We focused only on water sources for drinking water supply. Management of drinking water sources includes managing problems that might arise due to drought (water quantity) or pollution (water quality).
The Ljubljana Field porous aquifer is the main source of drinking water therefore many alternative scenarios were considered. Management options were compared to the base scenario (no change; scenario 1) and to the base scenario considering the impact of climate change (2021–2050) without the application of any management options (scenario 2). The purpose of most management options in Ljubljana is ensuring drinking water quality. The first management option was water treatment of the water from the existing water well fields. All other management options considered the establishment of new water well fields Koseze that would be built south-west from Ljubljana Field aquifer. The second is a new well field Hrastje, that would be built in the central part, near the Sava River. The third management option is the artificial recharge of groundwater Kleče-Roje (
Figure 2). It was decided after expert judgment that all three proposed management options would also need either water treatment or enforcing of compensations for farmers due to income reduction because of lower farming production in water protection area I (VVOI) and II (VVOII). With this, ten management options were studied (scenarios 3–12;
Table 1).
3.3. Definition of the Structure of Ranking Criteria (Indicators)
Management actions can be evaluated according to several criteria (indicators). One group of indicators may consider water supply risk (both water quantity and quality risk), while another group can be related to the realization of the actions (
Table 2).
The realization of management options was selected as one group of indicators, in which basic indicators such as lag time (in months/years) and flexibility (1–10), costs (in EUR/m3 of drinking water) were selected. Lag time measures the time between a decision and full operation of an action. Actions may be more or less flexible. Fuzzy Decimaker flexibility is a measure for the capability of changing the selected management option or modification. A management action would incur costs that may be prohibitive.
Water quantity and water quality risk can be classified together in one group of indicators as general water supply risk. For groundwater availability, all main water users in the Ljubljana Field were chosen. Public water supply is divided between households and industries. Industrial water use was also added from water permits data (from year 2010) because some companies pump their own water. The amount of water pumped for agriculture was also taken from water permits data. For water contamination risk, evaluation pollutants [
23] were considered, which are present in the Ljubljana Field aquifer more or less constantly (occasional pollutions were not considered). Flexibility, lag time, and cost were also added as parameters as they influence management options.
For each indicator, the relative weight, balancing factor, ideal and worst value were defined (
Table 2) by a group of experts based on statistical data and internal drinking water supply company reports.
Relative weight reflects the relative importance of basic indicators within one group of indicators. For the public water supply—households—the relative weight was set to 0.4 (
Table 2) because the highest portion of the drinking water is supplied to households, which are the largest drinking water users according to the drinking water company statistics. For all other users weights were set equal (0.2). Within indicator group “realization” (consisting of flexibility, lag time, and costs), the costs can be more important, therefore, it can have higher relative weight than lag time and flexibility, from which also one (e.g., lag time) would have a different relative weight. The largest weight was set to costs as this is the parameter, which has the largest weight in case of the selection of a particular option by the drinking water supply management.
Ideal and worst values for particular indicators were defined regarding the present state and define the potential range of values of each basic indicator. Ideal values for pollutants are of course zeros as this means there is no pollution. For instance, the ideal value for microbiological pollution is 0 (the limit of
Escherichia coli or bacteria in drinking water is 0) and the worst is 10 (
Table 2) because this indicator may also reach high values in worst-case scenarios and it has happened already in the past. For public water supply for households 10 million m
3/year was used, as this is the amount of the drinking water needed for the inhabitants that always need water supply present. The worst values for water availability represent what is the highest amount of water that can be pumped in the next hundred years for these purposes according to the socio-economic development (scenarios of water demand in the future [
27]). The worst values for pollutants are the maximum concentrations, which were detected in the past. Worst values for flexibility and lag time are determined with expert judgment, whereas for cost, the highest cost of selected management options was selected.
The balancing factor represents the strength or possibility of an indicator as a limiting factor in one group of indicators. It reduces bias and emphasis of outstanding indicators. In Fuzzy Decimaker, the balancing factor was set to 1 (one indicator can substitute another).
3.4. Estimation of Ranking Criteria Values for Each Management Action
In this step, the estimation of ranking criteria values for each management option (scenario) is set for all management actions. Ranking criteria are characterized by different units. Units of water supply (quantity) risk may involve a number of unsupplied people, monetary terms, agricultural areas, or habitat loss. Units of water contamination risk may involve fecal indicators, nitrate, or heavy metal concentrations. The base criteria values for elements of water supply risk were taken as uncertain/fuzzy numbers from the results of previous studies. The criteria values basic indicator group realization can either be directly (quantitatively) estimated (e.g., cost of realization for water treatment plant) as fuzzy numbers, or measured qualitatively on a scale of say 1–10 (1 is the best) from experts opinion (e.g., flexibility and lag time). For the Ljubljana water supply, we considered investment costs for water treatment and costs for compensations for farmers (compensation value multiplied by the water protection area).
For each management option (scenario), the most likely interval (low and high) and the largest likely interval (low and high) have been set. If there is no reason for uncertainty for a given criterion in the realization branch, one value (certain value) can be used. An example of ranking criteria values for the Ljubljana water supply management option water treatment for artificial infiltration Kleče is given in
Figure 3. Considering potential concentrations in the drinking water and water treatment efficiency, all values for pollutants were set to 0. The establishment of the water treatment is not flexible, because we cannot stop water treatment when in operation in case another option would prove to be better, therefore flexibility was set to 1 (no flexibility).
Base scenario includes temporary water use and temporary pollutant concentrations. Flexibility is 1 (since no measures were made), cost and lag time are zero because of the same reason. For scenario CC 2021–2050 water use was estimated in previous studies [
27], based on present data and socio-economic projections (population growth, water for industry and irrigation). Quality parameters (concentrations) were decided after expert judgment, mostly from the past statistical data. For all further scenarios, the values for water use in the future period 2021–2050 are the same as after CC 2021–2050 scenario. After Scenario “Artificial recharge Kleče-Roje with compensations for farmers in the drinking water protection zone I (VVO I)” the latter would be fully enforced, therefore, water quality would be better. Values for water quality parameters were reduced after expert judgment. The cost (€/m
3) represents the additional price of water, which would increase because compensation to landowners would have to be paid. Lag time is the time that would take to build the infrastructure for artificial infiltration and to get all the permissions. After the scenario “Artificial recharge Kleče-Roje with compensations for farmers in the drinking water protection zone I and II (VVO I and II),” the latter would be fully enforced, therefore, water quality would be better. Values for water quality parameters were reduced after expert judgment. The cost (€/m
3) represents the additional price of water, which would increase because compensation to landowners would have to be paid for VVO I and VVO II. Lag time is the time that would take to build the infrastructure for artificial infiltration and to get all the permissions. For the scenario “Artificial recharge Kleče-Roje with water treatment, we assume that due to water treatment, water would have perfect quality and the values for water quality parameters are all zero. The cost (€/m
3) represents the additional price of water, which would increase because of a new water treatment plant [
27]. Lag time is the time that would take to build the water treatment plant. Analog after latter scenarios, values for other scenarios were prepared.
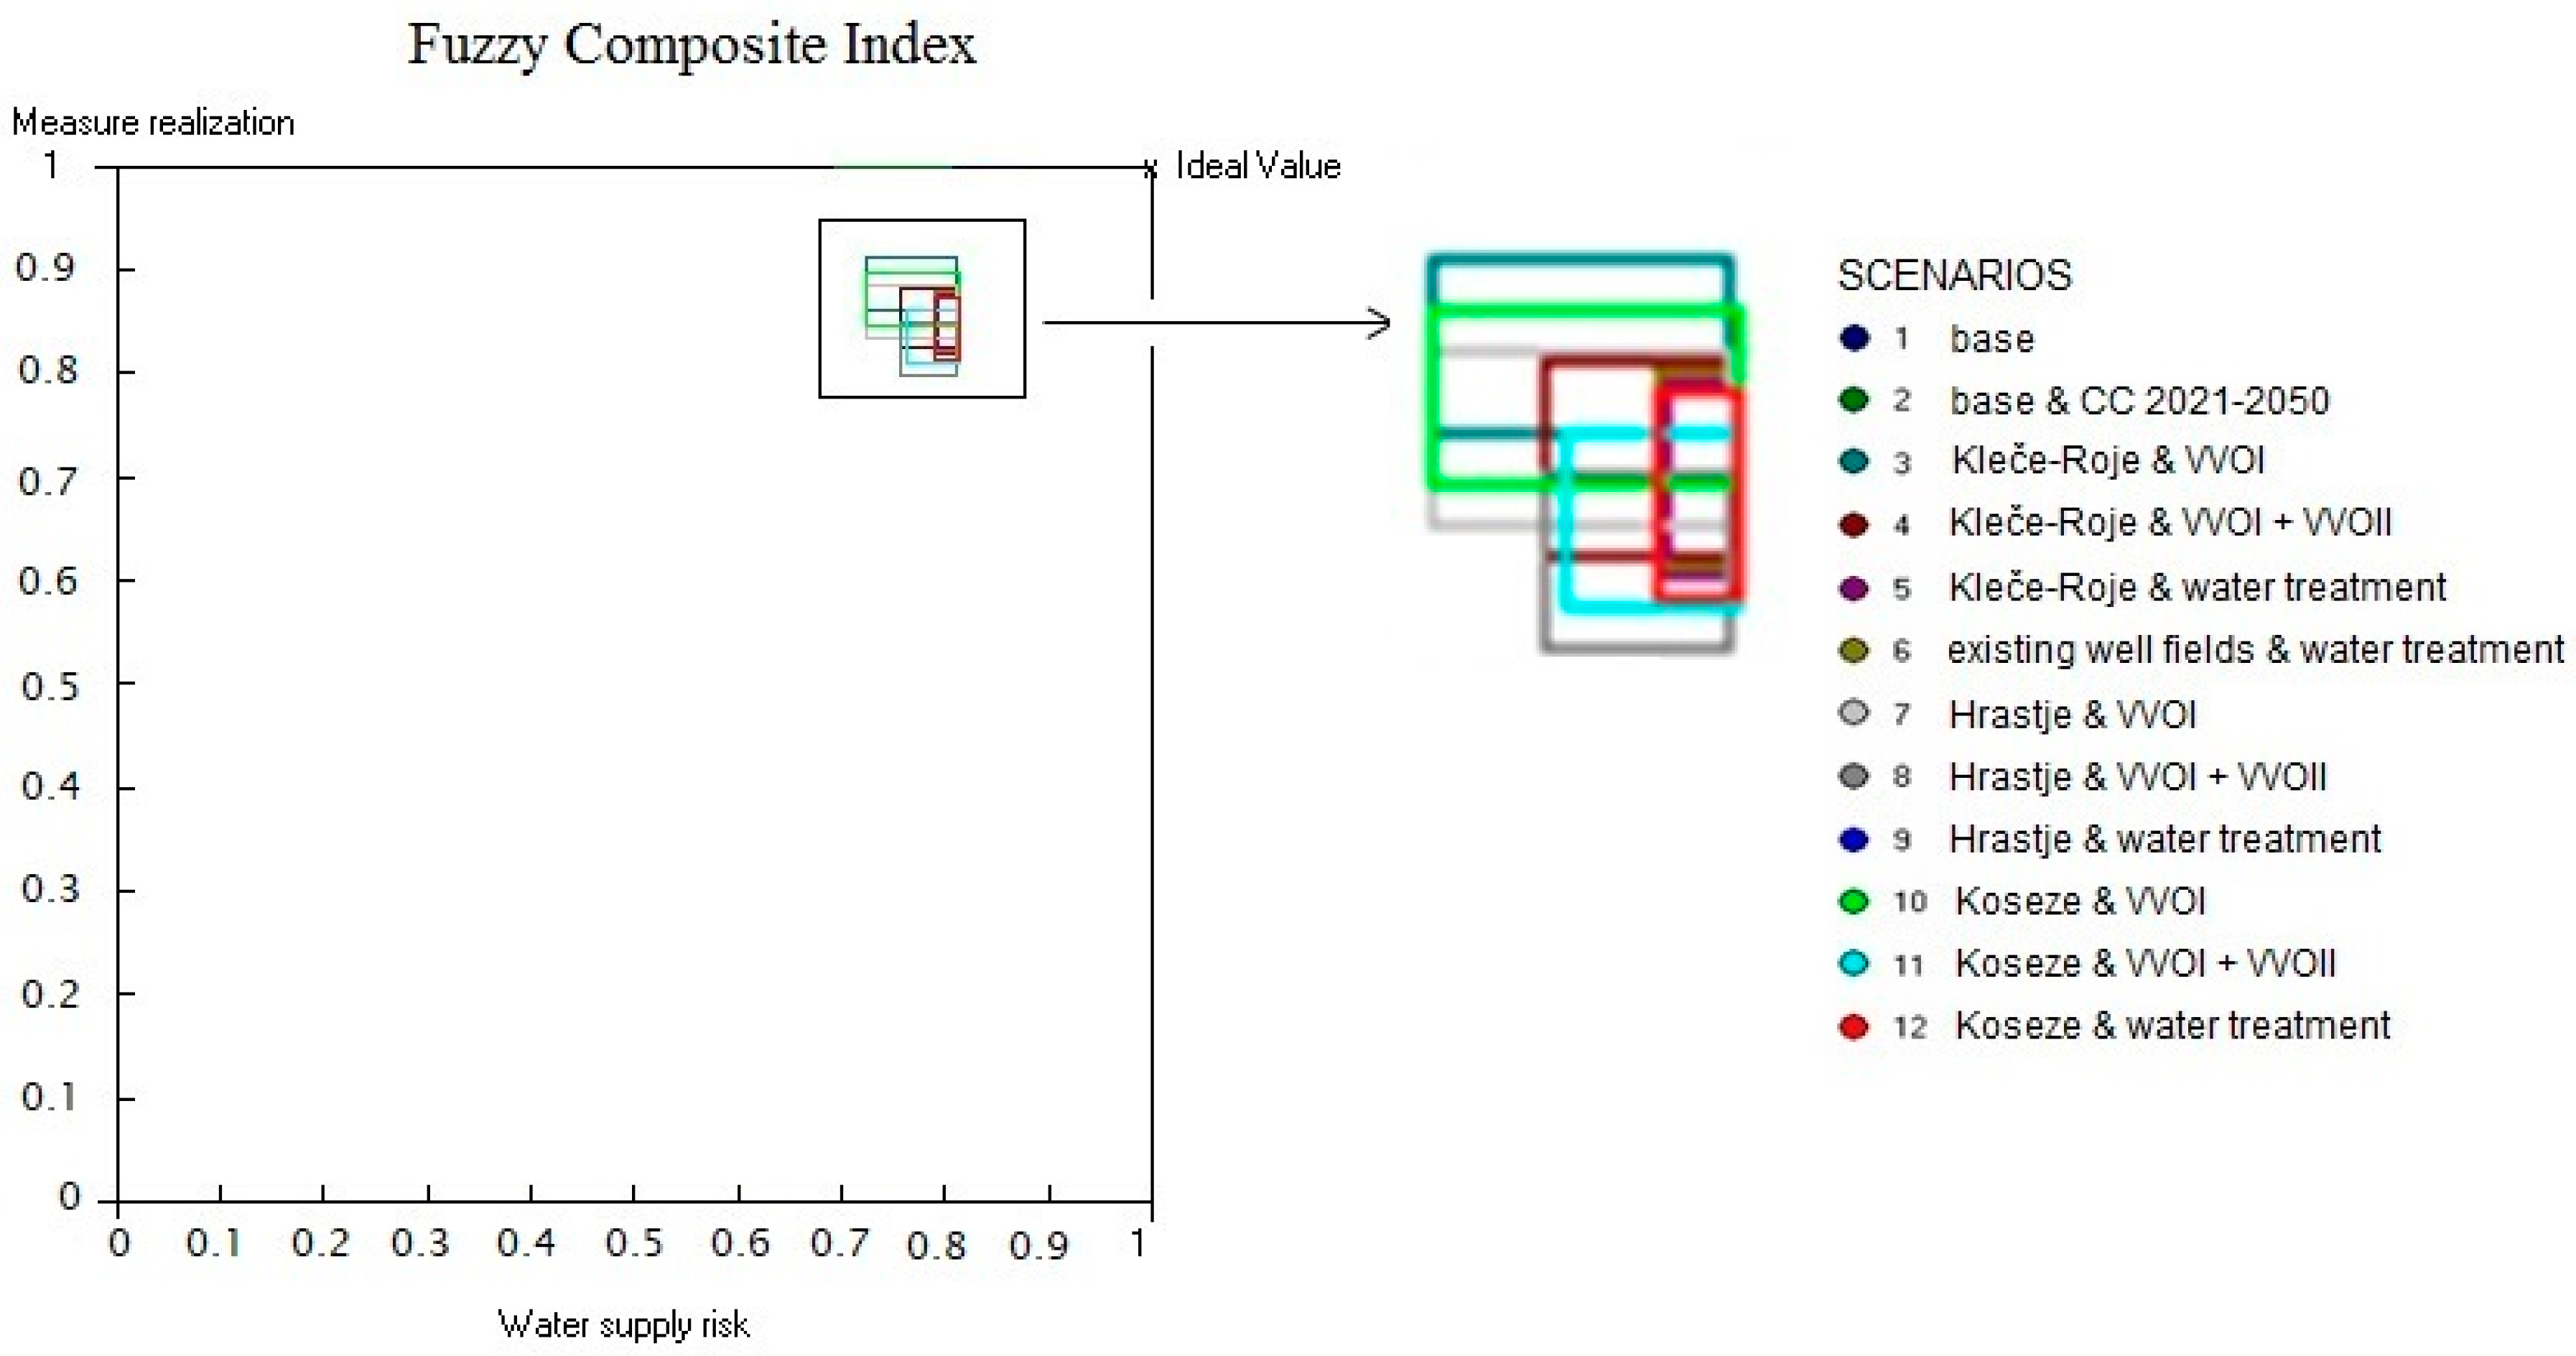
3.5. Ranking of the Management Actions According to the Ranking Criteria
By application of the Fuzzy Decimaker DSS model, for each management option, a calculation of risk elements was performed and management options (scenarios) were ranked according to the ranking criteria. The actual values of the criteria exhibit variability; therefore, results are presented as risk management under uncertainty (rectangles in
Figure 1b). In
Figure 4 and
Figure 5, fuzzy composite indexes (FCI) for selected management options and indicator groups are presented. The group of indicators “realization” is presented against the group of indicators “water supply risk” (groundwater availability and water contamination risk). The best option has value 1 (ideal value) and the worst value has any lower value of the fuzzy composite index (CI). The base scenario is presented as a line with realization equal to 1 (ideal value) as there are no actions in realization indicators (cost, lag time). Sensitivity analysis by assuming changes of relative weights has also been performed for the test area (
Figure 4 and
Figure 5).
For the Ljubljana water supply, many management actions (
Table 1) were considered mostly for assuring groundwater quality. The ranking of management actions according to ranking criteria values has shown that all management actions are good as they are clustering in the corner close to ideal value (
Figure 4 and
Figure 5) and have relatively high fuzzy composite indexes (above 0.74; low risk).
Figure 4 presents the ranking of the management actions according to the ranking criteria, where measure (management action) realization parameter flexibility is set to 1 for all management options; the weights for groundwater availability parameters and water contamination risk parameters are also 1. The best management options are management actions with compensations for farmers in the drinking water protection area 1 (VVO I) for all three well fields. In this case, management options with water treatment are comparable to compensations for farmers in the drinking water protection area 1 and 2 (VVO I and II). Management options with water treatment have the lowest water supply risk, which has also the smallest range, whereas the management options with drinking water protection zones VVO I and VVO II have a larger water supply risk range. On the other hand, measure realization has a wider range and is comparable to compensation for farmers in the VVO I and VVO II. Combining water supply risk and measure realization, the best option is Kleče well filed with VVO I, followed by the Koseze well field with VVO I.
Figure 5 presents the ranking of the management actions according to the ranking criteria, where measure realization parameter flexibility is set to 1 for compensation for farmers in VVO I, 3 for compensation for farmers in VVO I and VVO II, and 5 for management actions with water treatment (the lowest flexibility). Weights for groundwater availability parameters are set to 0.4 for public water supply for households and for all other uses to 0.2, whereas weights for water contamination risk parameters are set to 0.5 for costs, 0.3 for lag time, and 0.2 for flexibility (
Table 2). Again, the best option is management actions with compensation for farmers in the drinking water protection area 1 (VVO1) for all three well fields (the best is Kleče, followed by Koseze and Hrastje). Management options with water treatment are the worst in the case of selected flexibilities and equal weights, which is due to high costs, low flexibility, and longer lag time needed for establishing a water treatment facility. In the case of weighting (
Figure 5), Kleče and Hrastje with water treatment are better options than compensations for farmers in VVO I and VVO II.
Among all management options, compensations for farmers in the VVO1 are the best option. On the other hand, management options with water treatment have the lowest water supply risk.
4. Conclusions
A risk management methodology is presented for the adaptation of water supply to changing climate and land-use activities, considering socio-economic aspects. The proposed strategic framework of the water supply management system (WSMS) includes two main priority areas: to ensure water resources quantity and maintain water resources quality and protection. To achieve these goals, legislation can be revised (strict limitations in drinking water protection areas; enforcing compensation for farmers in the second drinking water protection area), water demand and pricing have to be validated, alternative supplies should be evaluated, water use priorities should be set, and best practices in land-use should be applied.
The actual situation (base scenario) and the probable future evolution of the water supply system have been evaluated according to various scenarios of climate change effects and management options for improving drinking water quality. The major management actions for improving drinking water safety are (1) land-use limitations within the drinking water protection areas, above all limitations of fertilizers and pesticide use and paying compensations to farmers for lower crop production and (2) drinking water treatment. Ranking of management actions according to ranking criteria values has shown that all management actions are good as they are clustering in the corner close to the ideal value. The base scenario shows mostly no or very low realization risk as there are no costs and no lag time. For a particular well field, management action with compensations for farmers in the first water protection zone (VVO I) is the best and the management action with water treatment is the worst, which is due to high costs, low flexibility, and longer lag time. The best results (the lowest risk for water supply) were achieved if both adaptive water quantity management and adaptive water quality measures would be applied. There is an exception in the case of water treatment, which demands high costs; therefore, that option is lower ranked.
Selections of the best management options for the Ljubljana case with the decision support system Fuzzy Decimaker are proposals or recommendations from experts. The final decision must be taken by each water supplier and/or local decision-maker. Fuzzy Decimaker can help water suppliers and local authorities in the course of the process of evaluation and selection of management options. The Decimaker application permits one to take not just the technical aspects of the problem into consideration, but also the socio-economic aspects, which are also very important in community life and development. This section is not mandatory but can be added to the manuscript if the discussion is unusually long or complex.
The purpose of the study was to rank management options with Fuzzy Decimaker. The information that management options with drinking water protection areas are better than water treatment was very important for the drinking water supply company and the Municipality of Ljubljana. Considering the presented results, three options can be selected: well fields Kleče, Koseze, and Hrastje with compensation for farmers in the first drinking water protection area. As Kleče and Hrastje well fields are in the same aquifer (Ljubljana Field), there is a need for an alternative water supply in case of accidental pollution of this aquifer. The best option is then the Koseze well field, which is located in the Ljubljana area, close or within the existing drinking water supply system. In fact, the well field Koseze was selected as an alternative drinking water supply and the well field area was introduced to the spatial plan of the municipality. Further investigation will be performed in the selected area. A stakeholder analysis was done for Koseze well field in another project and is not relevant for this study.


