1. Introduction
The effective and sustainable utilization of water resources is the basis for maintaining the needs of socio-economic development and environmental management [
1]. About 70% of the world’s renewable water resources are used by the agricultural sector [
2]. The agricultural sector has proved to be the dominant part of interregional virtual water trades [
3]. Irrigation is vital to enhance crop production in water-scarce countries [
4]. To ensure food supply, pesticides and fertilizers have been widely used in agricultural production activities, which exacerbates the further deterioration of water resources [
5]. Water shortages are increasingly limiting food production, adversely affecting the goals of food security and human wellbeing [
6]. Therefore, effective water resource management is essential to ease China’s pressure on water resources [
7].
Allan first coined the term “virtual water” in 1994, defining it as water used to produce internationally traded food crops, and then developed the concept to include the amount of water needed to produce goods or services [
8]. Virtual water refers to the volume of water that a country or region imports or exports through trade, which is implicit in traded products and services [
9]. Virtual water transfer occurs when products were made in one area which used its local water resources, but the products were being exported for consumption to another area. Water is actually reallocated across regions through trade in goods and services [
10]. The concept of virtual water is closely related to water footprint, which represents the amount of water a population (individual, region, country or world) needs to produce all the products and services it consumes in a certain period of time [
11]. The water footprint thus offers a better and wider perspective on how a consumer or producer relates to the use of freshwater systems [
12]. Therefore, research on water footprints has increased sharply over the past decade [
13].
Berger et al. [
14] divided methods for evaluating water footprint into two categories: volumetric and impact-oriented approaches. The former focuses on the transfer of water resources, while the latter focuses on the potential impact of water use on the environment. Many studies have been conducted using the volumetric water footprint assessment to analyze agricultural water use. Liao et al. [
15] calculated the agricultural production factors in 30 regions of China and quantified their regional correlation with economic trade. Feng et al. [
16] studied the water demand for agricultural products and the flow of virtual water in the Yellow River basin. Currently, the Yellow River basin in the north suffers moderate to severe water scarcity over seven months of the year, mostly driven by agricultural water use [
17].
The issue of water resources does not only involve water shortages, but also water quality [
15]. In recent years, there has been growing concerns about the potential impact of water consumption and pollution on human health, ecosystems and natural resources. Berger et al. [
14] argue that volumetric water footprint does not accurately reflect the potential impact of agricultural water use on the environment and may mislead producers or consumers to make wrong decisions. The research objective of an impact-oriented water footprint aims to evaluate the comprehensive environmental impact of products. The accounting method was proposed by Ridoutt and Pfister [
18], and the characteristic factor of water footprint-water equivalent (H
2Oeq) was adopted as the result. Zhang et al. [
19] and Huang et al. [
20] have done some studies on impact-oriented water footprint s, comparing the differences between volume and impact-oriented water footprint assessment methods.
In previous studies, there have been few quantitative indicators and assessments of China’s agricultural virtual water trade by putting together volumetric and impact-oriented water footprint assessment indicators. To be more specific, the volumetric agricultural water footprint can reflect the transfer and flow of water resources in regions, while the impact-oriented agriculture water footprint can reflect the transfer of environmental impact in regions. Therefore, the policy formulated by comparing these two indicators is the policy that truly combines the current interests of human beings with the long-term interests. To address this research gap, this study has focused on the interregional agricultural virtual water flows in China with the help of these two indicator methods. The objectives of this paper were: (a) comparison of regional agricultural virtual water flow using the volumetric and impact-oriented water footprint evaluation methods; (b) analysis of water stress in different regions with two water footprint indicators; and (c) to develop corresponding water resources management measures and policy guidance.
2. Methodology and Data
The input-output (IO) model was first proposed by Leontief in the 1930s, which is one of the most significant ways to study virtual water [
21]. The IO model can be divided into the single-region input-output (SRIO) model and the multi-regional input-output (MRIO) model. Compared with the SRIO model, the MRIO model utilizes multi-region input and output data to calculate the total water footprint intensity, which not only reflects the inter-regional trade of commodities and services, but also distinguishes the local and external water footprint [
22]. In this paper, we divide the water footprint into two categories: volumetric and impact-oriented water footprint. In volumetric agricultural water footprint calculations, we are only concerned with “blue water,” which means surface water and subsurface water. The blue water is also described as water withdrawal. We do not include green water (i.e., the precipitation on land does not run off or recharge the groundwater, but is stored in the soil or temporarily stays on the top of the soil or vegetation) in this study, because green water is usually not subject to competitive use [
3]. Grey water is the volume of fresh water that is required to assimilate the load of pollutants based on natural background concentrations and existing ambient water quality standards. Grey water was not considered because we considered it in the impact-oriented method. In impact-oriented agricultural water footprint calculations, we only consider degradative water use, which relates to emissions affecting water quality. Therefore, this study uses volumetric and impact-oriented MRIO analysis to measure the agriculture water footprint of different regions in China.
2.1. Multi-Regional Input–Output Analysis (MRIO)
The IO model reflects the sale and purchase links between different Industrial sectors and regions. Based on the regional IO model, the MRIO model is a method to calculate the regional trade volume of different products by using the corresponding regional information. The corresponding resource and environmental impacts of consumer activities in one region can be traced to specific production sectors in other regions through the inter-regional supply chain [
23]. It is assumed that the number of regions contained in the model is m, and the number of departments in each region is n. The mathematical structure of the IO model in the interval is composed of m * n linear equations. The structure of MRIO is shown in
Table 1. The traditional input–output table contains intermediate use, final use and total output for different industries, as well as intermediate input, imports, value added and total input data. The regional production activities have the following balance:
where
denotes the gross output of sector
i in region
r;
denotes the monetary input from sector
i in region
r to sector
j in region
k;
denotes the final demand of region
k derived from sector
i in region
r, which contain the sum of household consumption, government consumption, fixed capital formation, changes of inventory, and international export.
The intermediate input coefficient is denoted by
, which means that the intermediate input from sector
i in region r to sector
j in region
k:
Substituting the Equation (2) into the Equation (1), we can get the basic formula of the MRIO model [
24]:
The Equation (3) can be represented in the matrix (4):
Solving for X, we can get the equation of
, where I is the identity matrix and
is the Leontief inverse matrix, which represents the total production that each sector generates to satisfy the final demand of the economy [
21].
The matrix form of the MRIO model is as follows:
2.2. Method of Quantifying Volumetric Agricultural Water Footprint
This study modified the IO model by adding a 1 × n vector of the sectoral consumptive water use (CWU). It transforms the economic model into the environmental water IO model. The direct volumetric water footprint intensity matrix can be expressed as follows:
where
denotes the direct water footprint intensity from agriculture in region k,
represents the water withdrawal from agriculture in region k, and
represents the total economic output from agriculture in region k.
The total volumetric water footprint intensity matrix can be expressed as follows:
where TWI denotes a matrix containing the resulting total volumetric water footprints per monetary value of economic output of agriculture sector, I is a n-by-n identity matrix, and A is the n-by-n technology matrix. [I − A]
−1 is the standard Leontief inverse matrix. This term links the final demand of a product to direct and indirect water use.
The total volumetric water footprint from agriculture sector in region k is denoted by
:
where
denotes the final use of agriculture in region k.
The total volumetric water footprint consists of two parts:
where
denotes the direct volumetric water footprint from agriculture in region k. The
denotes the indirect volumetric water footprint from agriculture in region k.
The total volumetric water footprint of region r is the sum of column r in TWF, which can be disaggregated into internal water footprint (WF
int) and external water footprint (WF
ext) two parts [
25]:
2.3. Method of Quantifying Impact-Oriented Agricultural Water Footprint
Fertilizers, pesticides and other toxic and hazardous substances in agricultural production may lead to eutrophication of water bodies, acidification, and freshwater ecotoxicity. These problems have become the primary problems in water environment management [
18]. Water pollution caused by excessive nitrogen, phosphorus, and other nutrients in water will have potential impacts on aquatic ecosystem quality and human health. Before making decisions and policy recommendations based on the research results, it is necessary to understand, analyze and compare the similarities and differences between the two evaluation methods in order to better promote the application and development of water footprint theory in the field of agricultural research.
Calculating the impact-oriented water footprint, we introduce the reference unit of H
2Oeq (equivalent), which is regarded as intuitively meaningful as ordinary people generally envision water use in terms of a volume [
26]. The potential impact of water pollution on the environment and human health can be quantified into a single value, ReCiPe points, which evaluated, standardized, and weighted by the ReCiPe method.
The impact-oriented water footprint evaluation is calculating the water degradation footprint (WDF) in the reference unit H
2Oeq. The ReCiPe impact assessment method is used to calculate WDF (H
2Oeq) as follows [
18]:
where ReCiPe
N and ReCiPe
P denote the ReCiPe points associated with nitrogen and phosphate fertilizer applications during the crop production process; ReCiPe
global (1.86 × 10
−6 ReCiPe points) refers to the global average value for CWU.
After obtaining the WDF of agriculture, the direct impact-oriented water footprint intensity matrix can be expressed as follows:
where
denotes the direct water footprint intensity under environmental pressure from agriculture in region k,
denotes the water degradation footprint from agriculture in region k, and
denotes the total output from agriculture in region k. The total impact-oriented water footprint intensity matrix under environmental pressure can be expressed as follows:
where EWI denotes a matrix of total impact-oriented water footprints per monetary value of economic output in the agriculture sector.
The impact-oriented water footprint of agriculture sector are expressed as:
2.4. Data
The main economic data used in this study were China multiregional IO table of 2012 [
27], which contain 30 jurisdictions (including 22 provinces, 4 municipalities and 4 autonomous regions), except for Tibet, Taiwan, Hong Kong and Macao. Based on geographical location, development status, economic structure, 30 jurisdictions of China are divided into seven regions: north China (Beijing, Tianjin, Hebei), northeast China (Heilongjiang, Jilin, Liaoning), east China (Shanghai, Jiangsu, Zhejiang, Shandong, Anhui, Fujian, Jiangxi), south China (Guangdong, Guangxi, Hainan), central and south China (Shanxi, Henan, Hubei, Hunan), northwest China (Inner Mongolia, Shaanxi, Gansu, Qinghai, Ningxia, Xinjiang) and southwest China (Sichuan, Chongqing, Yunnan, Guizhou). The sector studied in this paper is the agricultural sector of the IO table (including agriculture, forestry, animal husbandry, and fishery).
We obtained the water use data of agricultural sector in China’s seven regions by merging data from all provinces; agricultural water withdrawal data were obtained from the China Statistical Yearbooks [
28,
29] and the China Environment Yearbooks [
29]. Agricultural data for the different province were collected from the China Statistical Yearbook in 2013 (National Bureau of Statistics of China, 2013), including crop planting area, crop yield and fertilizer application (N and P leaching), etc.
3. Results and Discussion
3.1. Volumetric and Impact-Oriented Water Footprint Intensity
The direct water footprint intensity may reflect water withdrawal per output. This difference in agricultural water footprint intensity is due to the huge technological gap and the different crop combinations between regions. Northwest China had the highest volumetric agriculture direct water footprint intensity, with a value of 1105.8 t/10
4 CNY (two or four times more than other regions) (
Table 2). That is to say, northwest China has the lowest direct water use efficiency. This represents a very detrimental reliance in the agricultural sector in northwest China, where the region is extremely short of water. The direct water footprint intensity values of other regions are kept between 280 and 550 t/10
4 CNY. The total water footprint intensity reflects the water consumption of the final product in the supply chain. The agricultural sector in all regions is dominated by direct water. The direct and indirect water footprint intensity values in the northwest are higher than in other regions. As He et al.’s research has shown, it takes three or four times more water to grow one kilogram of crops in the northwest than the national average [
30]. For a region with a large water footprint intensity, not only should the direct water use efficiency be improved, but also water savings should be found in the life cycle of the product.
The natural conditions in northwest China determine the dominant advantages of primary industry, such as cotton production, animal husbandry, and medicinal materials cultivation. Thus, it is inevitable that when the northwest region trades with other regions, exchanging agricultural products of the same value will transfer more virtual water from the northwest to other regions, as previously identified by Jiang et al. [
31]. Since the northwest is the largest net export area, a large amount of virtual water flows out of the northwest, which is detrimental to the northwestern region, where water is already scarce. At the same time, the water footprint intensity values in north China and east China are similar to those in other parts of the northwest, both of which are net import areas. Naturally, the northwest region provides a large amount of virtual water for north China and east China. even if the same amount of agricultural products are exchanged, a large amount of virtual water is transferred from northwest to north China and eastern China.
The pressures of the water environment faced by different regions are different. Unlike volumetric water use, impact-oriented water pays more attention to the assessment of the impact of water resources on human health, ecological environment, and natural resources [
32]. For impact-oriented water use, the impact-oriented direct water footprint intensity values for northwest, central south and southwest regions are 19,993.9, 17,797.5 and 16,237.6 t/10
4 H
2Oeq CNY, respectively. This also shows that the impact-oriented direct water consumption of agricultural products in western China is higher than that in the eastern region, and the value in the eastern region is between 10,539.2 and 14,331.5 t/10
4 H
2Oeq CNY. This clearly shows the difference in direct water footprint intensity due to economic and technological differences between the eastern and western regions. Similarly, the impact-oriented agricultural water footprint intensity in the western region is also higher than that in the eastern region. This explains that even if the same amount of agricultural products are exchanged, a large amount of virtual water is transferred from western regions to eastern regions. At the same time, the water environment pressure in the eastern region has been transferred to the western region through agricultural trade.
3.2. Local and External agricultural VIRTUAL Water Composition
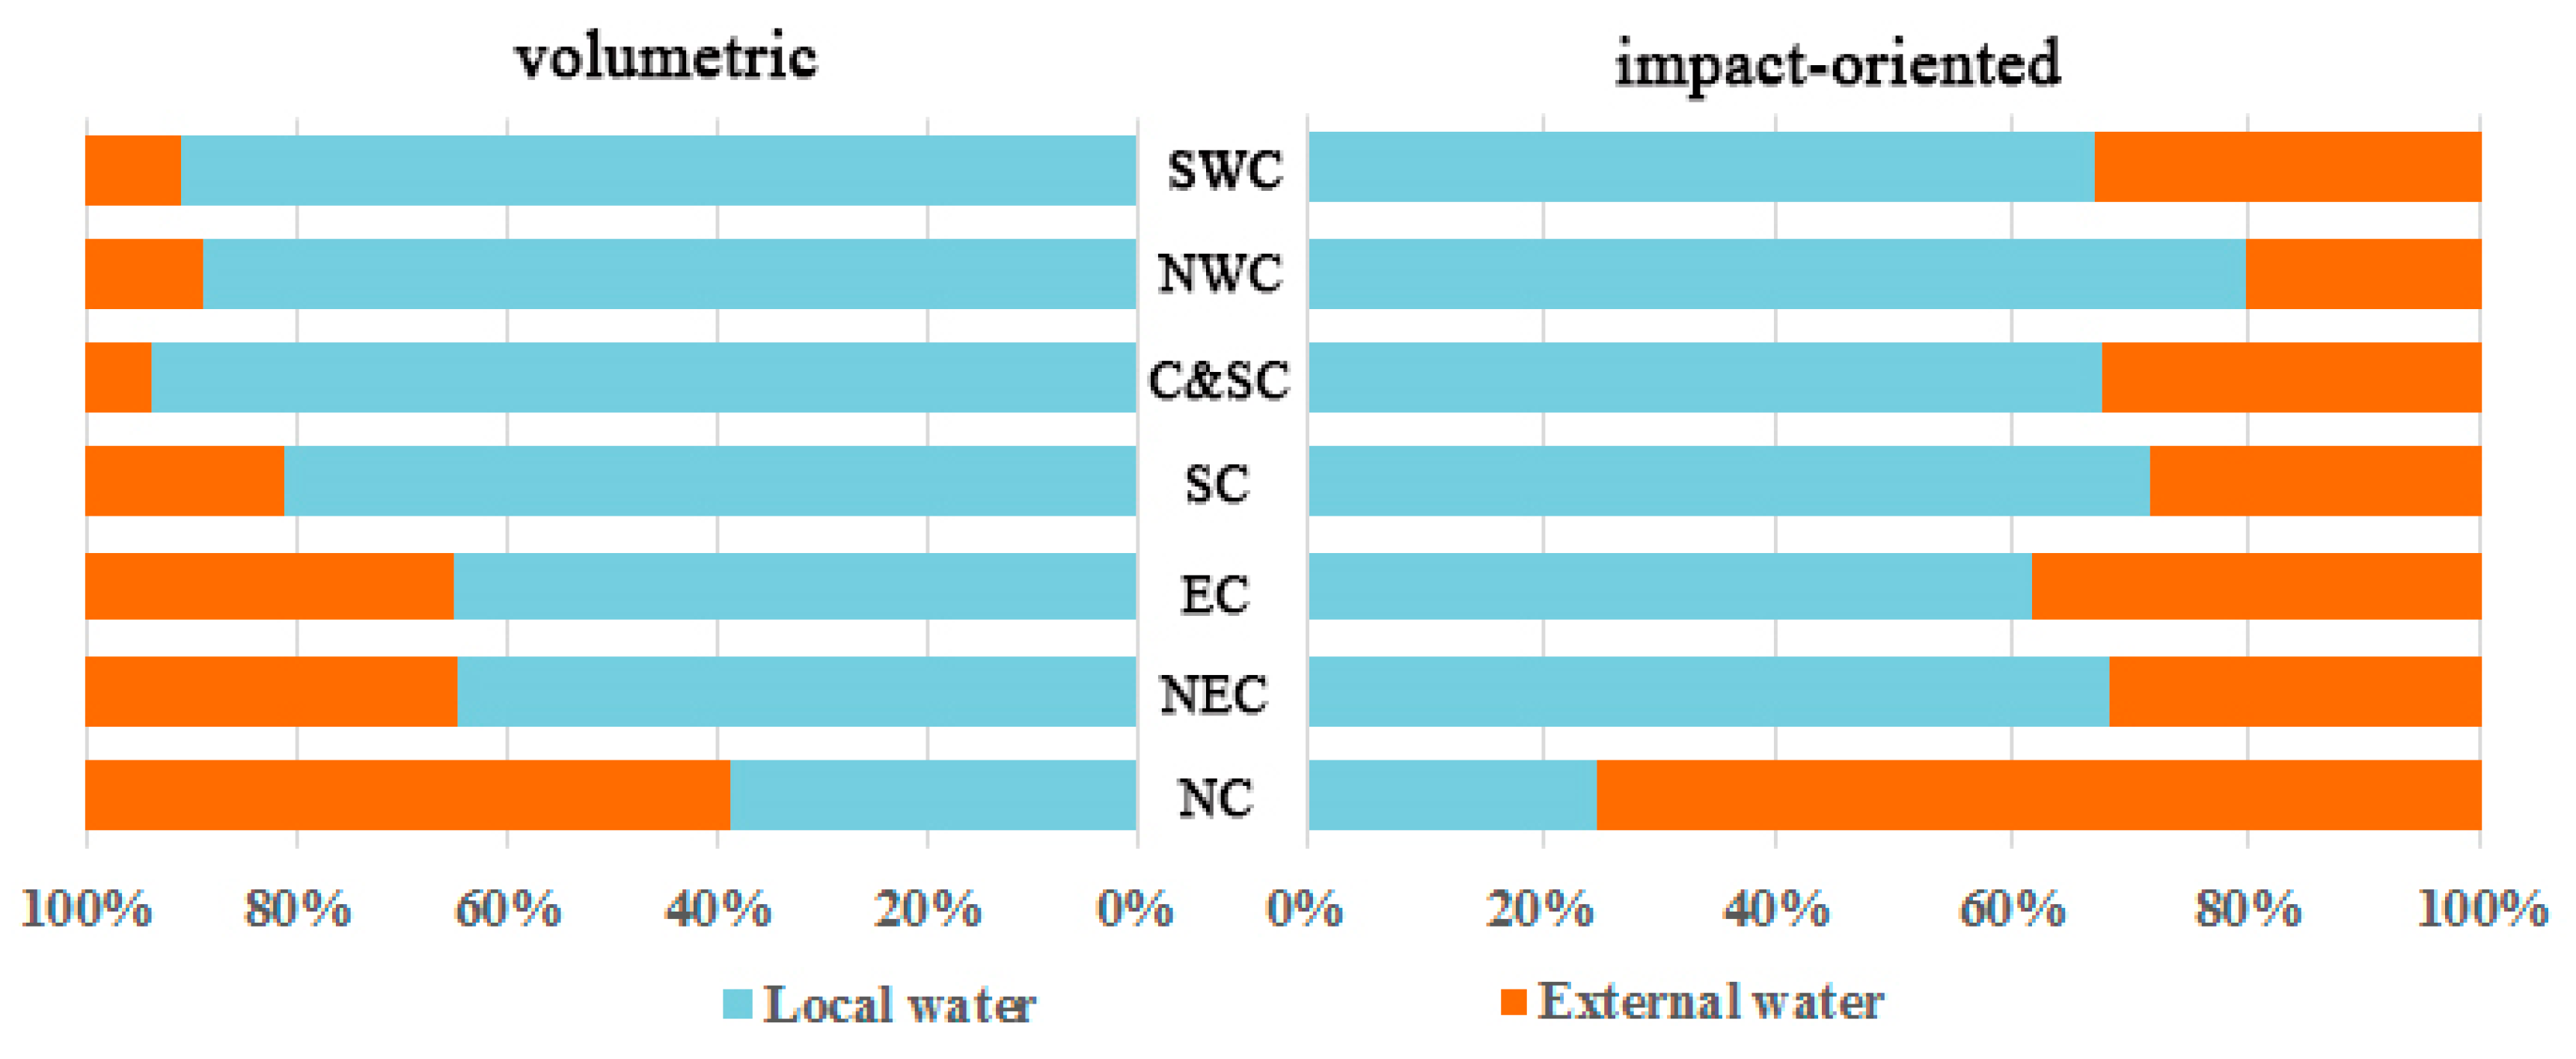
The total water consumption of a region consists of two parts: local and external. The local virtual water is the sum of all local water resources needed to meet the final consumption of the region, while the external virtual water is the sum of all external water resources needed to meet the final consumption of the region, that is, the virtual water input from other regions. Ratios of volumetric and impact-oriented agricultural water consumption from local and external sources are shown in
Figure 1. For volumetric agricultural virtual water use, except for north China, the water footprint of other regions is mainly composed of local virtual water, both exceeding 60%. Local virtual water use in north China accounts for only 23% of the total. This is mainly because the water resources in north China are relatively scarce and the demand for water is huge. Therefore, the north China region mainly meets its own water demand through virtual water trade. However, it should be noted that the north China region mainly meets its own needs through trade with agricultural products in the northwest region, which is also very unfavorable for the distribution of water resources in the northwest region. The impact-oriented local and external agricultural virtual water composition is similar. It is equivalent to transferring the main water environment pressure from the local area to other areas in north China, while the water environment pressure in other areas is mainly from local water.
3.3. Inter-Regional Agricultural Virtual Water Flow
We analyzed the transfer of agricultural virtual water in China on the regional level.
Table 3 lists specific distribution matrices whose rows and columns represent different meanings, which gives detailed data results of volumetric and impact-oriented agricultural virtual water flow. The rows of the matrix represent the volumetric and impact-oriented water footprint generated in a certain region in order to meet the final needs of seven regions. For example, the data in the first row shows that in order to meet the final demand of north China, northeast China, east China, south China, central and south China, northwest China and southwest China, volumetric virtual water transferred from north China was 8982 × 10
6 m
3, 1032 × 10
6 m
3, 3355 × 10
6 m
3, 467 × 10
6 m
3, 1174 × 10
6 m
3, 1262 × 10
6 m
3 and 469 × 10
6 m
3 respectively; the impact-oriented virtual water transferred from north China was 244520 × 10
6 m
3 H
2Oeq, 20,136 × 10
6 m
3 H
2Oeq, 82,327 × 10
6 m
3 H
2Oeq, 5942 × 10
6 m
3 H
2Oeq, 9360 × 10
6 m
3 H
2Oeq, 11952 × 10
6 m
3 H
2Oeq and 4639 × 10
6 m
3 H
2Oeq respectively. On the other hand, the column of the matrix indicates the water footprint generated in seven regions to meet the final needs of a certain region. Taking the first column as an example, to meet the final demand of north China, the water footprint generated in itself, northeast China, east China, south China, central and south China, northwest China and southwest China was: 8982 × 10
6 m
3, 4237 × 10
6 m
3, 4447 × 10
6 m
3, 1847 × 10
6 m
3, 3363 × 10
6 m
3, 12,299 × 10
6 m
3 and 1190 × 10
6 m
3 respectively.
3.3.1. Volumetric Agricultural Virtual Water Trade Balance
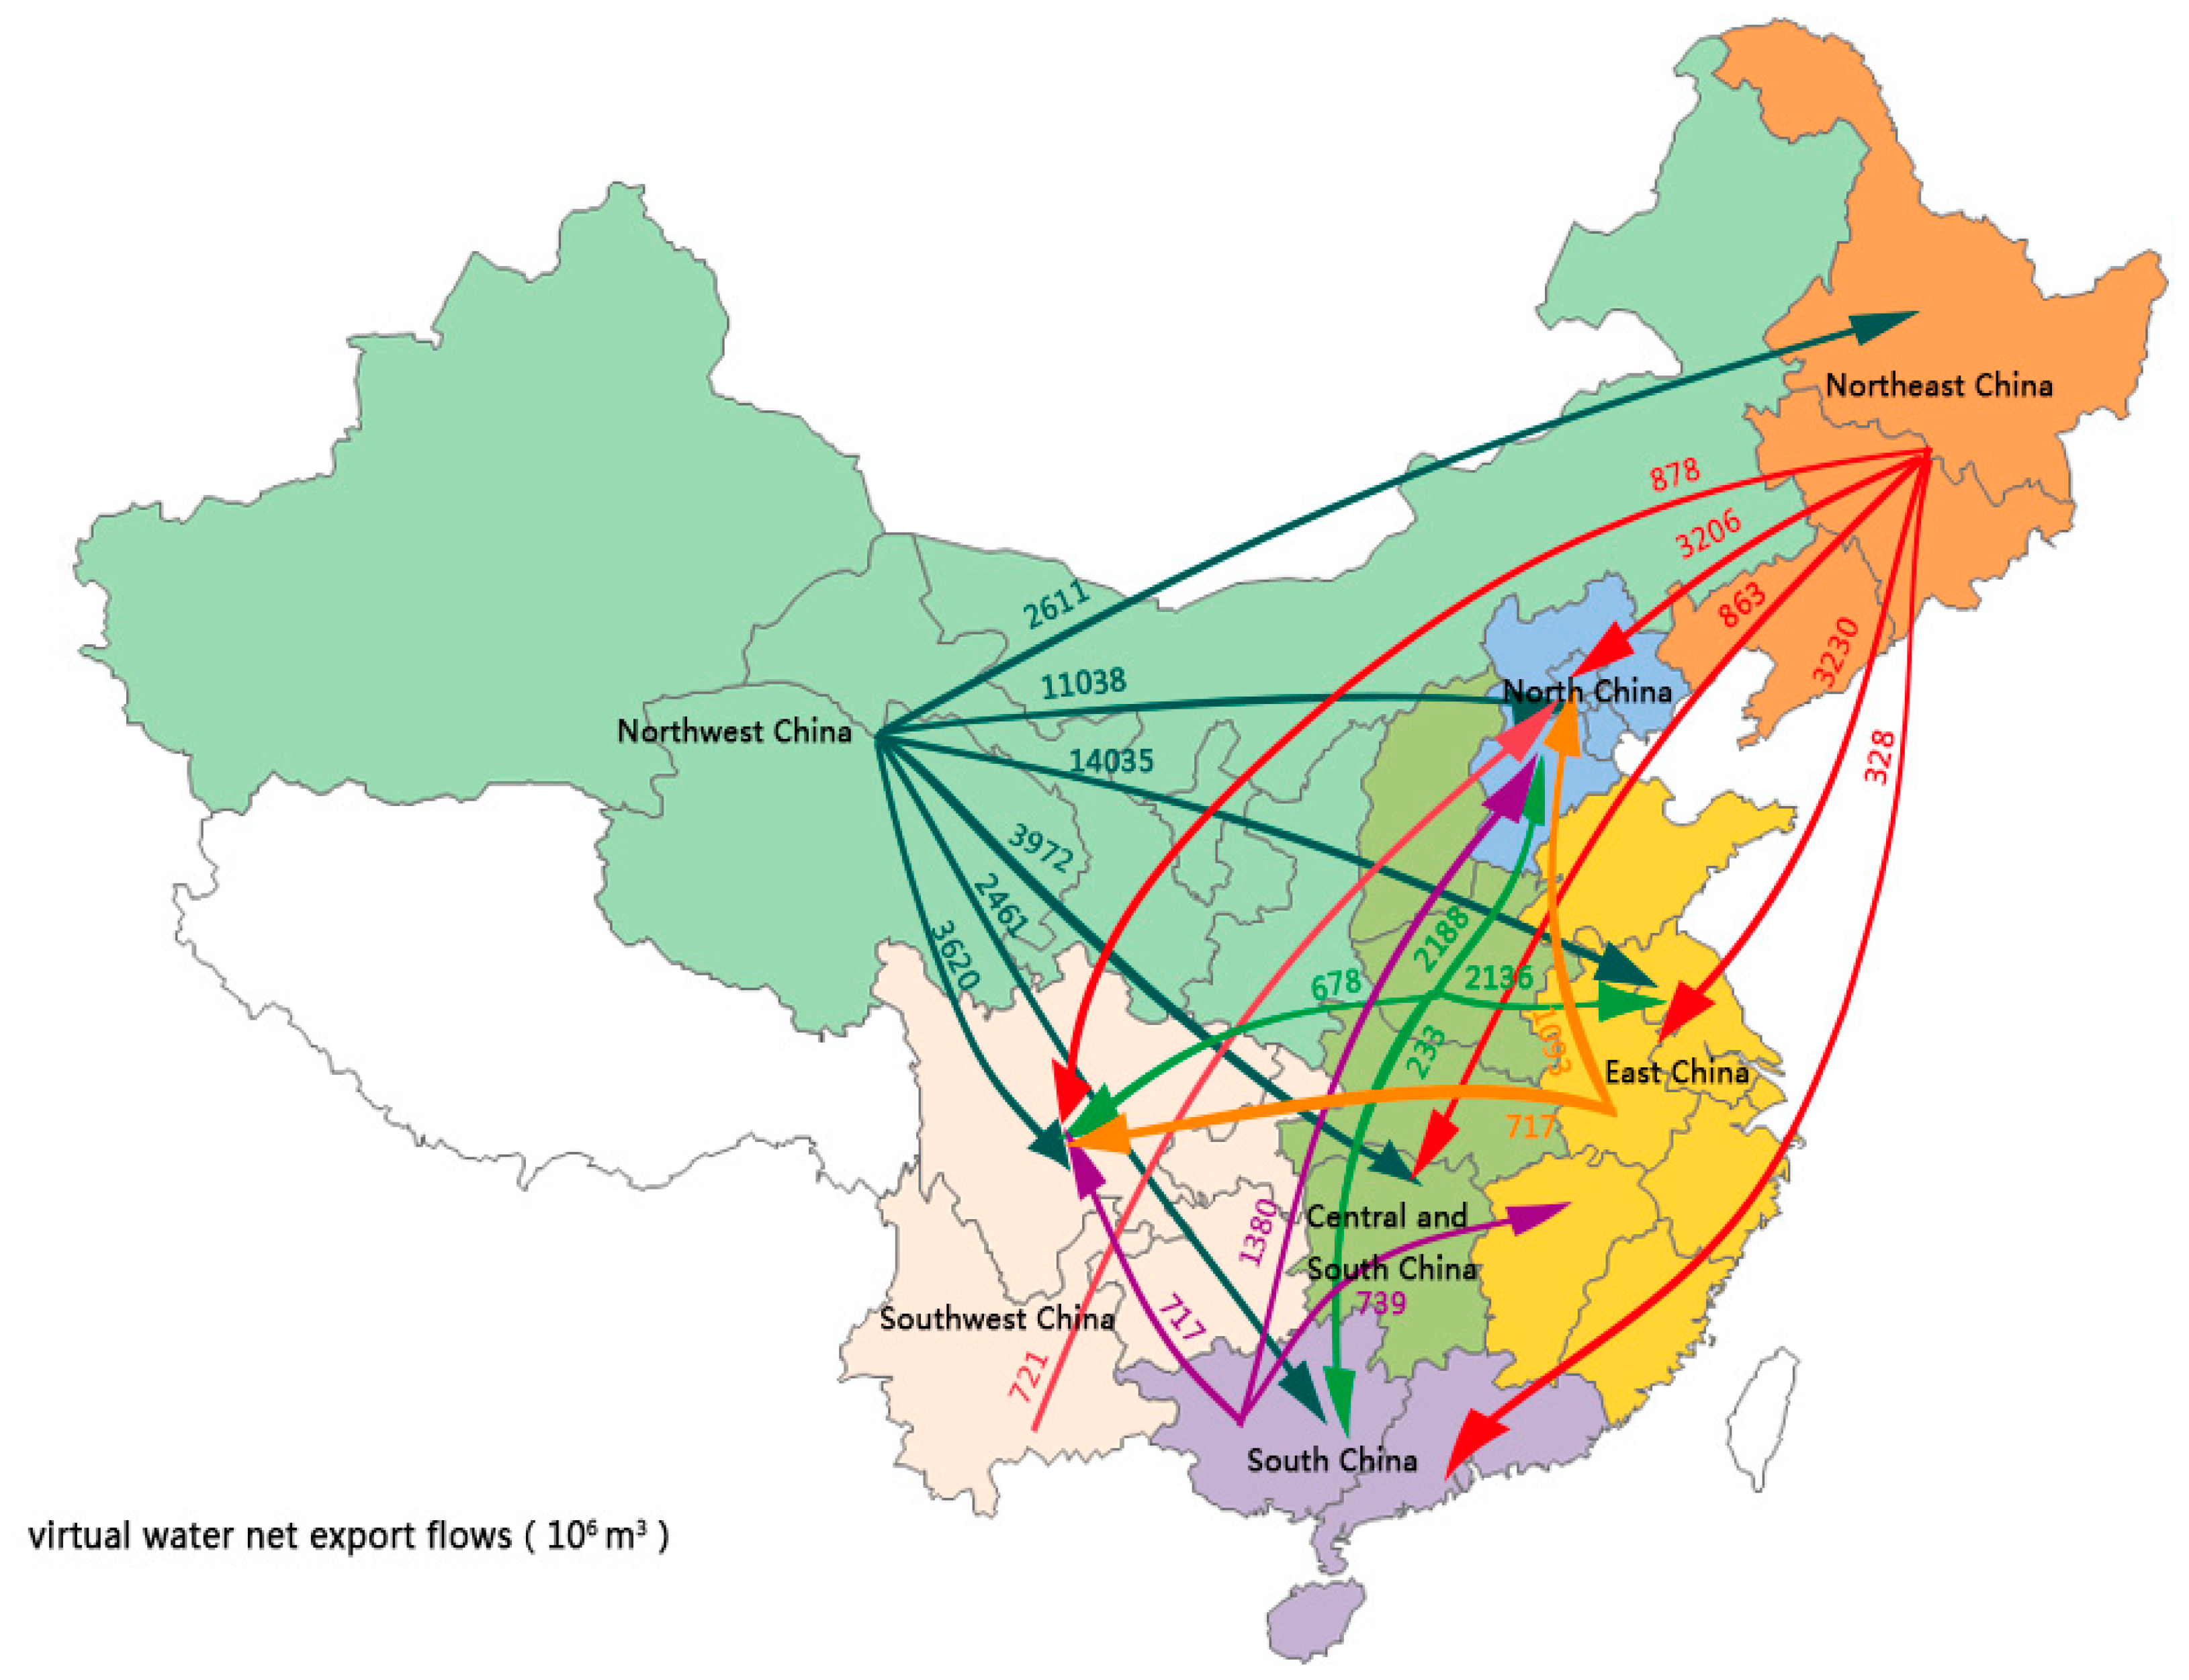
The import and export water trade reflects the flow of water from regional perspective. Import and export trade through import water-intensive products from water-rich regions to help water-scarce regions for sustainable management of water resources. As demonstrated in
Figure 2, northwest China (37,736 × 10
6 m
3) and northeast China (5893 × 10
6 m
3) are the largest net export regions for agricultural virtual water, while north China (19,625 × 10
6 m
3) and east China (18,843 × 10
6 m
3) are the largest net import regions for agricultural virtual water. Among them, the net export virtual water of agricultural in the northwest mainly flows to north China (11,038 × 10
6 m
3) and east China (14,035 × 10
6 m
3); the same virtual water in the northeast also flows to north China (3206 × 10
6 m
3) and east China (3230 × 10
6 m
3). That is to say, the overall trend of agricultural virtual water transfer is from west to east and from north to south. The agricultural virtual water trade in south China and central south is relatively balanced, with values maintained within ± 400 × 10
6 m
3.
There is a large population in eastern China, and there is a great demand for resource products. At the same time, the western region has a single industrial form and limited economic development. Therefore, the eastern region needs to import a large amount of agricultural products from the western region to meet local demand. The relatively backward development of science and technology in the western region will also lead to the consumption of more water resources in the process of agricultural production and production.
Due to regional differences in social and economic strength, technological development level and market development, the flow of water resources has regional differences. At the national level, many studies have found that the flow of virtual water in China is not from water-rich areas to water-scarce areas, but generally from inland to coast, from west to east, from north to south, from underdeveloped to developed regions [
3,
31,
33,
34]. It is interesting to note that agricultural sectors has proved to be the dominant part of inter-regional virtual water trades compared to the secondary and tertiary industries [
35]. Agricultural virtual water mainly flows from areas with relatively scarce water resources and arid climate to areas with high degree of water resources development. This agricultural virtual water trade model will further aggravate the uneven distribution of water resources in China. Especially for the northwest region where water resources are already scarce, it is particularly important to adjust the agricultural trade structure and increase the planting intensity of drought-tolerant crops.
3.3.2. Impact-Oriented Agricultural Virtual Water Trade Balance
For impact-oriented agricultural virtual water (
Figure 3), the northwest and central south regions are the largest net export regions with values of 362,237 × 10
6 m
3 H
2Oeq and 242,144 × 10
6 m
3 H
2Oeq. East and north China are the main net import regions with values of 347,810 × 10
6 m
3 H
2Oeq and 249,975 × 10
6 m
3 H
2Oeq. Among them, the virtual water for agricultural net export in the northwestern region mainly flows to east China (139,070 × 10
6 m
3 H
2Oeq) and north China (131,906 × 10
6 m
3 H
2Oeq); the same virtual water in central and south China mainly flows to east China (107,598 × 10
6 m
3 H
2Oeq) and north China (84,020 × 10
6 m
3 H
2Oeq). The agricultural virtual water trade in South China is relatively balanced. In other words, the water environment pressure mainly transferred from north and east China to northwest and central south China.
Due to the regional differences in the amount of fertilization of agricultural products and the difference in planting density of crops, the flow of impact-oriented agricultural virtual water between regions has been created. Unlike volumetric water use, the impact-oriented type pays more attention to the various types of pollution caused by the surrounding water environment during crop production. This means that the transfer of impact-oriented virtual water reflects the shift of water environment pressure in various regions, and also shows the sustainable use of water resources in various regions. The water environment pressure and pollution situation in the northwest and central south regions cannot be underestimated. This is one of the key factors we need to consider when formulating policy recommendations.
3.4. Comparison of Net Exported Virtual Water and Water Shortage Level
“Water Shortage” is a comprehensive indicator that shows the water scarcities to support the sustainable development of society, economy and environment. In virtual water transactions, although different water scarce regions are facing the same serious water problems to meet internal water demand, they have completely different characteristics. Liu et al. selected comprehensive evaluation indexes of society, economy, ecology, and water resources. Then, they constructed a comprehensive evaluation index system and a regional water resources model to calculate and evaluate the water shortage level in various regions in China [
36]. According to the research by Liu et al., The degree of water shortage is divided into the following levels: a value under 0.5 represents water abundance, a value between 0.5 and 0.8 indicates that amount of water is relatively plentiful, a value between 0.8 and 1.0 indicates a water tense situation, a value between 1.0 and 1.3 indicates water scarcity, and a value over 1.3 indicates serious shortage of water resources.
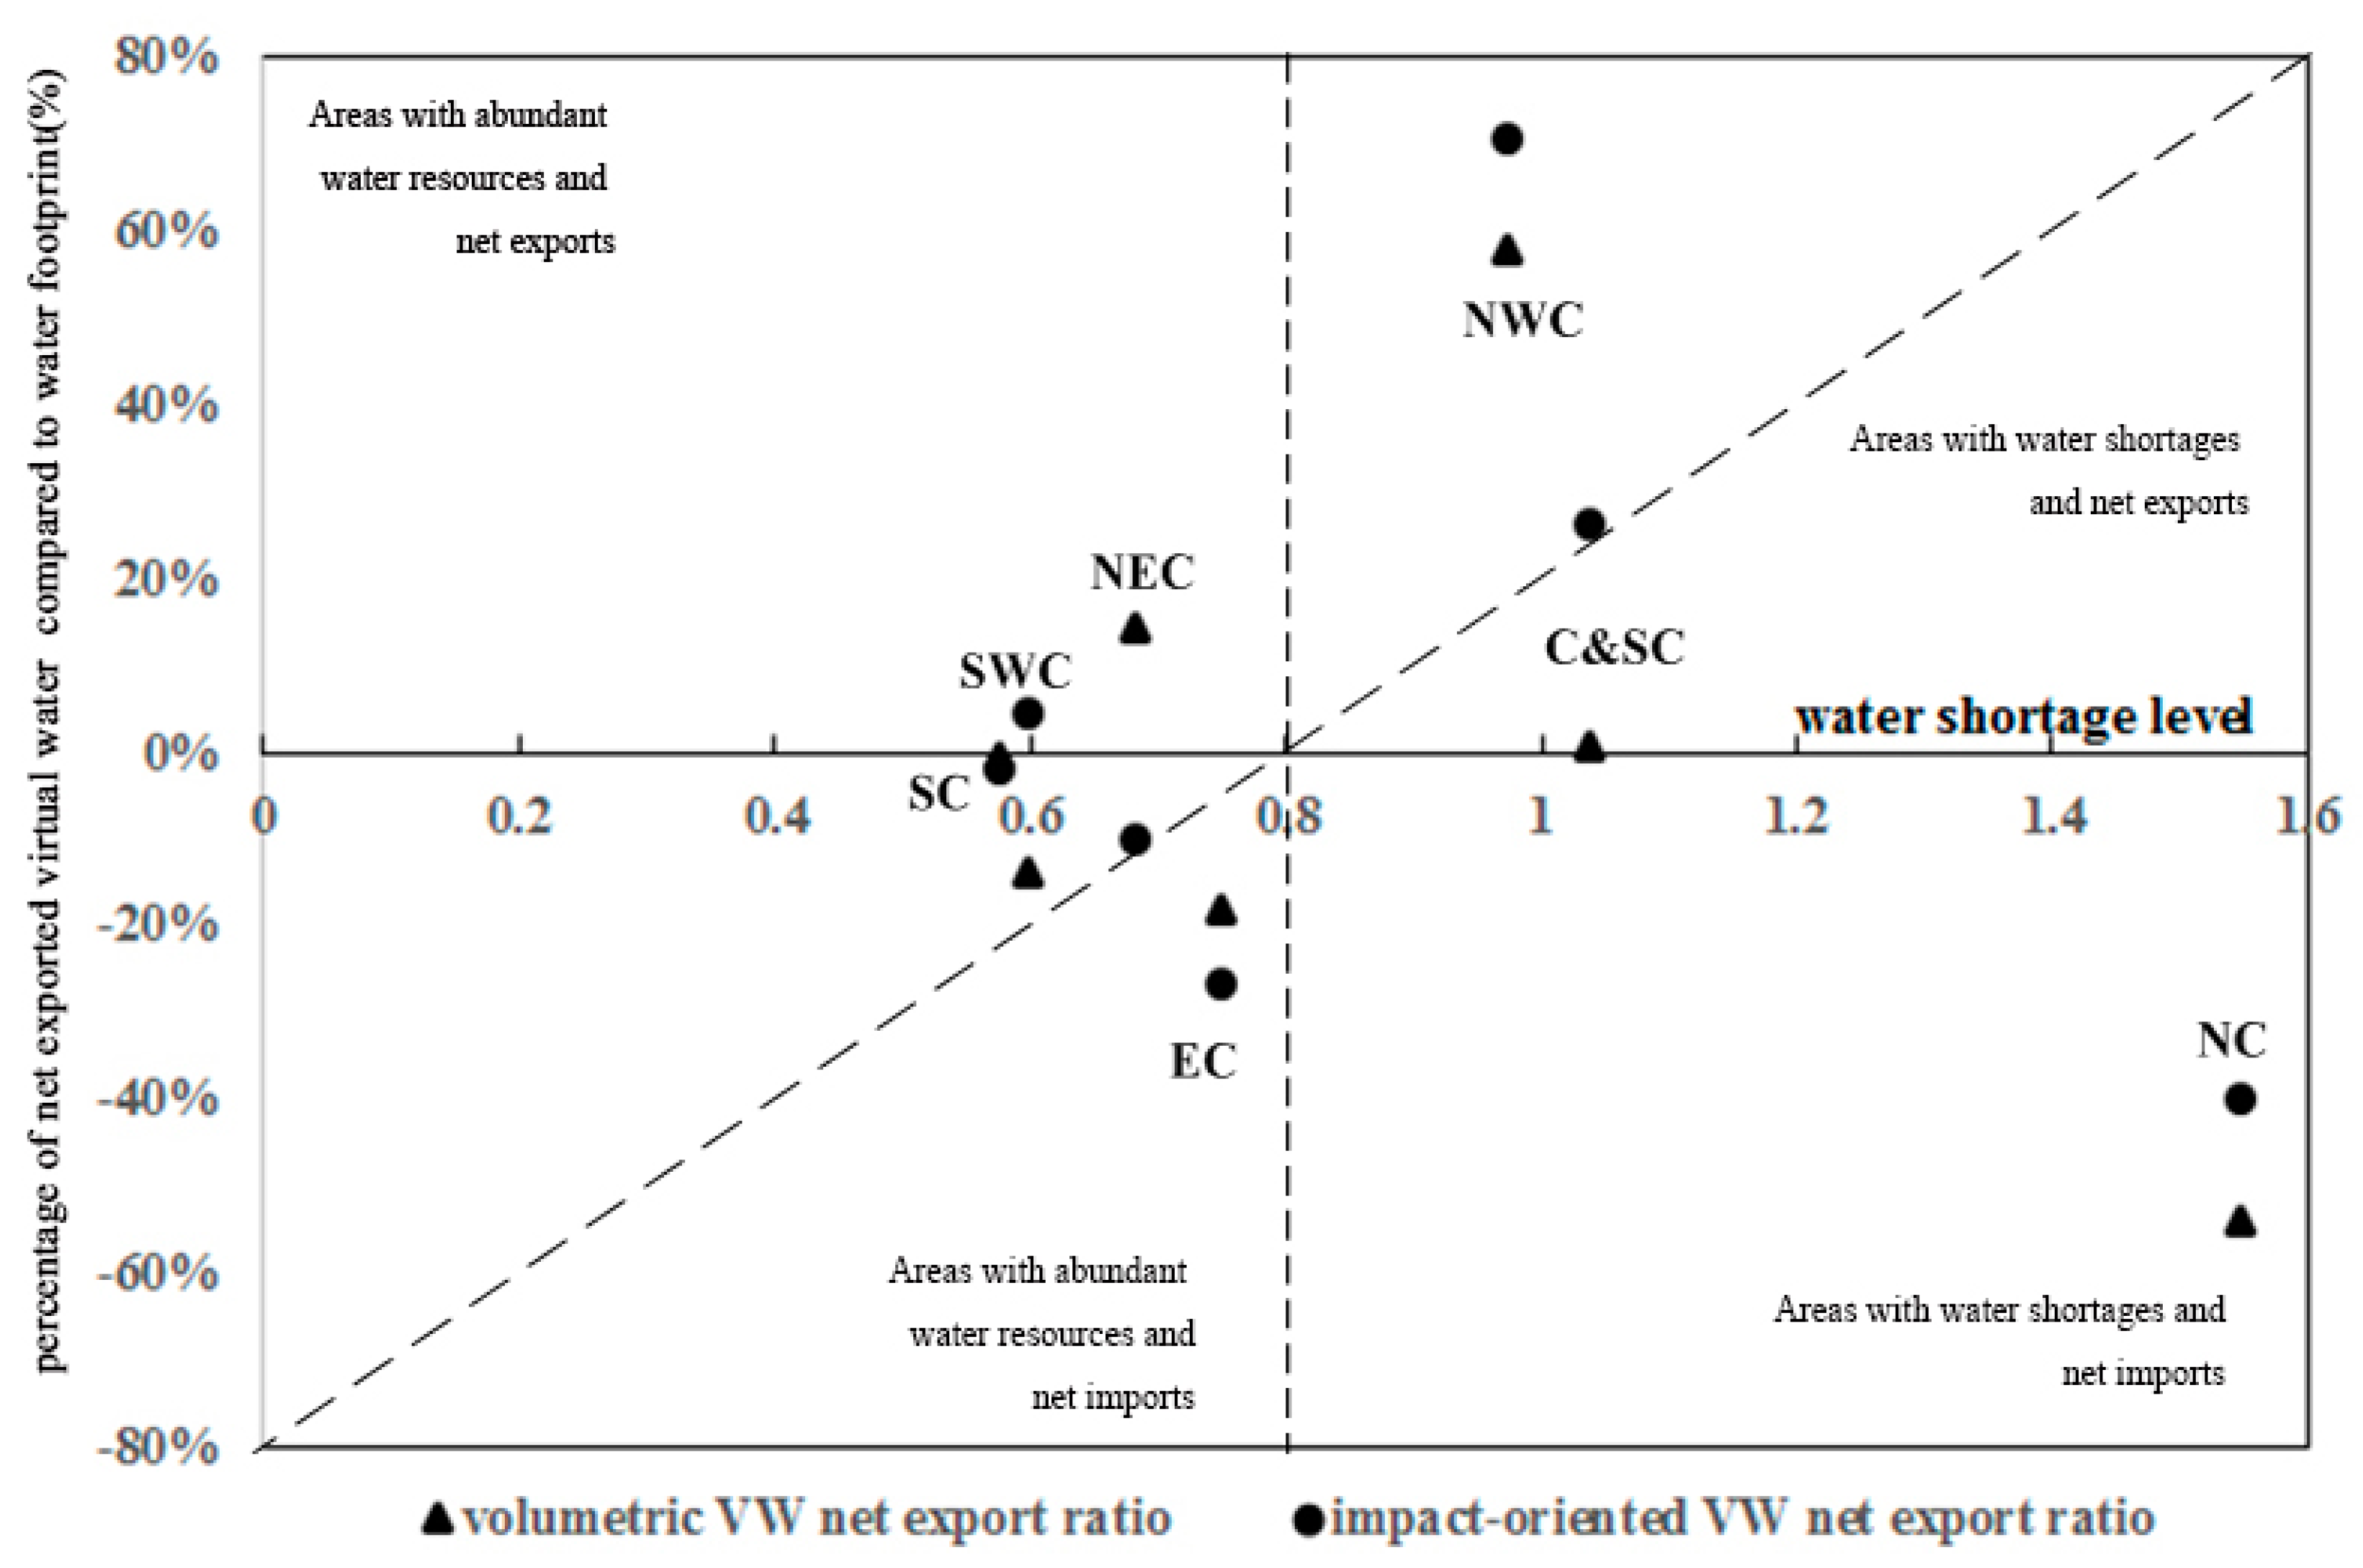
Figure 4 shows the relationship between volumetric and impact-oriented agriculture virtual water net export ratio and regional water shortage level in China. The four regions in the figure are represented in a clockwise direction: areas with water shortages and net exports, areas with water shortages and net imports, areas with abundant water resources and net imports, areas with abundant water resources and net exports. For the volumetric water footprint, northeast China is an area with abundant water resources and net exports, northwest and central south China are areas with water shortages and net exports, north China is an area with water shortages and net imports, and south, southwest and east China are areas with abundant water resources and net imports. For the impact-oriented water footprint, southwest China is the region with abundant water resources and net exports, northwest and central south China are the regions with water shortage and net exports, north China is the region with water shortage and net imports, and the south, northeast and east China are the regions with abundant water resources and net imports.
Though facing equally serious water problems to satisfy internal water consumption, different water scarce regions hold totally different characteristics in virtual water trade [
31]. North China imports a large amount of volumetric and impact-oriented agricultural virtual water to supplement domestic water usage, and volumetric and impact-oriented net imports account for 54% and 40% respectively of its water consumption. In contrast, the northwest region faces a series of problems such as arid climate and water shortages, but it still has a very high net export of agricultural virtual water (volumetric and impact-oriented net exports account for 58% and 71% of its water footprints). Meanwhile, unlike other developed and water tense regions, the volumetric agricultural virtual water trade in central and south China is almost balanced (net exports account for only 1% of total water footprints). However, impact-oriented net exports in central and south China account for 26% of water consumption. This shows that the northwest and central south regions are facing greater pressure on the water environment. If this virtual water trade model is continued, local water resources pressure will continue to grow, creating a vicious circle that will have a devastating impact on the local water and ecological environment.
The water shortage in north China is among the top in the country. It mainly relies on agricultural virtual water imports, and its main dependence is on the northwest region. However, the northwestern region has a relative lack of water resources and cannot meet the water resource transfer needs of other regions on the basis of maintaining sustainable development of water resources. At the same time, we should be aware that the water resources in the southwestern region are relatively abundant. In the future, we should increase the development of water resources in the southwestern region and give full play to the advantages of water resource carrying capacity in the region.
Therefore, we can see that for regions where water resources are scarce, relying on agricultural virtual water imports, we should adjust their trade direction and achieve a balance of demand through trade in agricultural trade with water-rich regions. For regions where water resources are scarce but agricultural virtual water is still exported to other regions, the industrial structure should be gradually adjusted, the construction of water-saving projects should be strengthened, advanced technologies should be used to promote the development of low-water consumption, and finally the awareness of water saving should be improved. For areas with abundant water resources, the development and deployment of water resources should be fully carried out, and the transfer of water resources pressure should be achieved through regional agricultural trade across the country to achieve a relatively balanced development between regions.
4. Policy Implications
Due to the loose environmental restrictions and low water prices, many water resources in China are inefficient and have little impact on improving the structure of inter-regional virtual water trade. In order to solve the shortage of water resources, especially in the arid regions, a sound water management system must be established. Considering volumetric water management, we should start from the following aspects. By gradually increasing the price of water, we could comprehensively improve the people’s awareness of water conservation, promote water conservation and industrial restructuring, and enhance water-saving power to further enhance the effective use of water resources. The implementation plan of the agricultural water price management method can give full play to the economic leverage adjustment effect of water price, promote the adjustment of planting structure and the optimal allocation of water resources. Water prices in areas with less water resources should be higher than those in areas with more water resources. Through the establishment of a sound mechanism for the formation of agricultural water prices, the reform of agricultural differential water prices will be promoted, and the transfer of water resources from low to high efficiency will be promoted to achieve the goal of secondary optimization of water resources. Through the establishment of a water rights trading platform, under the premise of fair use of water resources by farmers, enthusiasm for independent water conservation and self-discipline can be mobilized, and a solid foundation for the implementation of the most stringent water resources management system laid.
In addition, regional differences in water use can be adjusted by adjusting crop planting structures [
37]. The planting of crops with low water requirements has made a large contribution to the total water footprint decrease of agriculture [
38]. In areas with poor water resources, further loss of local water resources should be controlled by increasing drought-resistant crops and reducing the planting of water-consuming crops. It is especially important to implement policies tailored to the different water resources in each region. For example, the northwest should increase the acreage of drought-tolerant crops such as wheat, cotton and sugar beet. The planting industry in northwest China accounts for 72% of the total output value of agriculture, far higher than the national average of 57%. Moreover, the irrigation water for farmland is significant, and the direct consumption of agriculture is large. Therefore, it is necessary to improve the irrigation technology for the relatively backward western regions. The adoption of advanced water-saving irrigation technology can effectively reduce the waste of water resources. The overexploitation of groundwater for irrigation has become a major challenge to sustainable social-economic development in the north region, causing severe adverse impacts on the environment and ecosystems through rivers drying up, land subsidence, and sea water intrusion [
39]. In recent years, groundwater has provided more than 70% of the north China’s total water supply to support agricultural irrigation, rapid economic development, and population growth [
40]. Therefore, it is particularly critical for the northern region to improve water transfer efficiency and utilization of irrigation water by promoting water-saving measures such as sprinkler irrigation and drip irrigation. At the same time, we should follow the policy guidelines of “adapting measures to local conditions” and take advantage of local advantages to develop specialized agriculture, such as animal husbandry and the cultivation of featured fruits and vegetables that consume less water, in areas with relatively extreme climatic conditions (such as the northwest and northeast). There is no doubt that east China, south China and other areas with abundant water resources are suitable for planting rice and other crops with high water consumption. Only through agricultural trade based on the adjustment of planting structures can virtual water be reasonably transferred from the high-water areas to the water-deficient areas. Adjusting the planting density of crops can effectively increase crop yields, and increasing crop yields can help reduce the national average per capita crop consumption by 23% [
41].
The main cause of the high impact-oriented water footprint is the excessive use of chemical fertilizers, when the amount of fertilizer exceeds the carrying capacity of the soil it will migrate to the lake groundwater, resulting in eutrophication of rivers and lakes, pollution of water sources, and increased nitrate content in the groundwater. If people drink it for a long time, it will harm their health. In view of the harm caused by the abuse of chemical fertilizers, we should first control the abuse of chemical fertilizers at the source, by increasing the application of organic fertilizers to improve soil fertility. At the same time, straw mulching should be vigorously promoted to improve the soil buffer capacity and underground water quality. Last but not the least, the government should also strengthen fertilizer regulation, appropriately raise fertilizer prices, guide farmers to use fertilizer rationally, and improve fertilizer utilization.
5. Conclusions
Given the critical importance of water availability and quality, this study used volumetric and impact-oriented water footprints as indicators to assess the flow of agricultural virtual water trade among regions in China. Volumetric agricultural virtual water mainly flows from northwest and northeast China to north and east China, and the overall transfer trend is from west to east and from north to south. Impact-oriented agricultural virtual water mainly flows from northwest and central south China to east and north China, and the overall transfer trend is from west to east. Agricultural sectors in all regions are dominated by direct water supply, and the direct water consumption coefficient of agriculture in northwest China is the highest. Therefore, agricultural sectors in northwest China are under great pressure, both in terms of water consumption and environmental impact. In addition, the results of the analysis of net export virtual water based on the water shortage level of each region show that although the water shortage situation in north China is very serious, it mainly relies on external water supply, which reduces the pressure faced by local water use to some extent. However, northwest China still exports local water resources under great water resource shortage pressure. Therefore, it is urgent to control agricultural water resources in northwest China. In areas where there is a difference between impact-oriented and volumetric water use, local water scarcity should still be considered, and locally relevant solutions should be identified in decision-making processes.


