1. Introduction
In the framework of the Sustainable Development Goals [
1], with the global population expected to be 9 billion people by 2050, agriculture is considered to play a fundamental role in human well-being and economic growth [
2]. With a production that tripled between 1965 and 2015, the sector is a key contributor to global food security [
2], renewable energy production (14% of global energy production) [
3], and a variety of new emerging markets, such as bioplastics [
4]. Its relevant position in the global economy, however, is paired with growing concerns about the environmental impacts related to agricultural production systems. With reference to climate change, for example, the sector is responsible for 11% of global direct greenhouse gas emissions, mainly resulting from land use practices and the use of fertilizers and pesticides. Moreover, with specific reference to water, agricultural products are responsible for the consumption of 1180 km
3 yr
−1 [
5], representing about 70% of the total water consumption [
6], thus granting this sector a leading role in order to guarantee the sustainable use of this resource. In this context, the need for tools and methods to adequately quantify and address undesired environmental impacts has clearly emerged [
7].
Among different tools and methods, Life Cycle Assessment (LCA) has been extensively applied for the quantification of potential environmental impacts of products and processes and to support decision making processes for the correct management and reduction of related negative impacts [
8].
The strength of LCA resides in its capability to quantify a wide range of potential environmental impacts from a life cycle perspective, from raw material extraction to the end of life management of products, avoiding the issue of an environmental burden shift [
9]. To do so, in LCA studies, the environmental inputs and outputs of each unit process that take place in the life cycle of a product are translated into potential environmental impacts using suitable environmental characterization factors (CF) [
8]. With specific reference to water, also due to the introduction of ISO 14046 standard [
10], the metric of the water footprint in LCA has emerged to quantify potential environmental impacts related to water. The assessment considers the potential effects of the release of a pollutant that can affect the quality of water resources, as well as issues related to the scarcity of water resources (also referred as the water scarcity footprint). The assessment of this last aspect has received significant attention from the scientific community in order to define a consensus method [
11]. This is the case of the AWARE [
12] methodology that was published as the consensus-based water consumption impact indicator to assess the LCA-based water scarcity footprint (WSF), as the outcome of the UNEP-SETAC Life Cycle Initiative flagship project Global Guidance for Life Cycle Impact Assessment Indicators and Methods (GLAM). The authors provided characterization factors for over 11,000 watersheds in the world (with the 34 largest watersheds subdivided into sub-watersheds). The method is based on the causality impact pathway approach, focusing on a generic scarcity-based proxy midpoint indicator (labeled proxy as it does not directly lead to endpoint impacts on human health or ecosystem quality specifically) applicable to water consumption (surface and groundwater) [
12]. The development of the method confirmed the importance of adopting a resolved geographical and temporal scale when assessing the water scarcity issue. Whenever possible, performing the quantification starting from specific water use data at a watershed level and monthly scale is recommended. In addition, other studies have confirmed that the geographical scale significantly influences the accuracy of the results [
13,
14]. The need to adopt such a detailed geographical resolution, however, collides with the availability and completeness of water consumption data and information [
12,
15,
16]. In water footprint and LCA studies, it is in fact usually necessary to use secondary and background data to determine the potential environmental impacts that take place during the life cycle of products [
7].
To overcome this limit, the authors of AWARE also provided general factors for assessing the water scarcity footprint of water consumption at the country level, but did not recommend using them. Instead, for cases in which watershed-level factors cannot be used, they provided two sector-specific factors:
agri or
non-agri, based on whether the activity assessed is agricultural in nature (i.e., irrigation) or industrial/domestic. These factors, calculated using a consumption-weighted average of the watershed-scale characterization factor, better represent the temporal and geographical distribution of water consumption in the country for an
agri or
non-agri activity, and therefore provide a more representative weighted average than if weighted with all water consumption, as is done for the unknown factor [
12].
On the same line, Northey et al. [
17] presented specific characterization factors to address the water scarcity of 25 commodity-based products of mining industries, starting from AWARE factors. In this case, the characterization factors were developed by adopting a production-weighted-based approach. The study also confirmed that sector-specific characterization factors represent a better proxy of environmental impacts when compared to the more generic national ones; in some cases, results of the quantification can in fact be overestimated by up to 60%. The authors concluded that in the case where no watershed level data are available, commodity factors are therefore a better proxy than the national average factors.
Considering the interest of the agricultural sector in reducing their impacts related to water [
18], the development of crop-specific AWARE characterization factors could improve the accuracy of assessment in the agricultural sector and facilitate the application of the water footprint and LCAs.
The aim of this research is to improve the accuracy of crop water scarcity footprint quantification when no watershed level data are available by
Calculating and providing crop-specific AWARE characterization factors for 26 crops’ typology at a national level for 224 countries, and
Demonstrating their applicability in quantification of the water scarcity footprint of selected crops.
2. Materials and Methods
In this section, the AWARE method is summarized, as well as the mathematical approach for the calculation of the crop-weighted characterization factors (
Section 2.1). Details on the data used (
Section 2.2) and the ArcGIS calculations (
Section 2.3) are provided below. Lastly, the calculation of the water scarcity footprint of different crops is shown (
Section 2.4).
2.1. AWARE Method and Consumption-Weighted Average Approach
The AWARE method [
12] is based on quantification of the relative available water remaining per area once the demand of humans and aquatic ecosystems has been met. This method builds on the assumption that the potential to deprive another user of water is directly proportional to the amount of water consumed and inversely proportional to the available water remaining per unit of surface and time in a region (watershed).
The method is therefore defined by starting from the difference between freshwater availability and demand (Availability Minus Demand—AMD) in a specific
i-region (Equation (1)).
Availability was determined from WaterGAP2.2 [
19], which models runoff based on the precipitation and evapotranspiration of >11,000 watershed in the world, for the period 1960–2010. Demand includes both human and ecosystem demands. The former (Human Water Requirements—HWR) was also determined by starting from the WaterGAP model and refers to data on the consumption of freshwater for domestic, industrial, irrigation, livestock, and energy uses (based on the year 2010). The latter is determined by Environmental Water Requirements (EWR) developed as a fraction of the available flow to maintain freshwater ecosystems in “fair” conditions, with respect to pristine flow (i.e., flow with no human influence), and where “fair” refers to an ecological state of the river between poor and good conditions [
20].
The characterization factor relates the AMD
i to the AMD
worldavg, the consumption-weighted average of all AMD
i in the world, as per Equation (2). This is valid for regions where the value of AMD
i is not smaller than 1% of AMD
worldavg and not larger than 1000% (10 times) of AMD
worldavg. Outside of this range, the factor is set to the minimum (0.1) or maximum (100) value.
CFi values were calculated at a watershed level and by adopting a monthly temporal scale. They were than aggregated at a country and year level, as well as at a sector level (agri and non-agri per country), based on a consumption-weighted average approach.
In this paper, the same approach is adopted to develop crop-specific CF at a country level. To do so, Equation (3) is used:
where CF
j,z is the characterization factor of the
j-th crop of the
z-th country, CF
i is the annual (
agri) characterization factor of the
i-th watershed, WC
j,i (water consumption) is the water consumption required for the growth of the
j-th crop within the
i-th watershed, and WC
j,z is the total water consumption required to grow the
j-th crop in the
z-th country.
2.2. Data
Data on crop-specific water consumption at a local scale covering the entire globe was taken from the Global Crop Water Model (GCWM) [
21]. This model is a simulation of the yield and consumption (mm/yr) of green and blue water for 26 crops or different crop groups, for the years from 1998 to 2002, using climate data, the WaterGAP model. cultivated areas, cropping calendars, and evapotranspiration specific to each soil and crop (ETc). The crops include wheat, maize, rice, soybean, cotton, canola and rapeseed, barley, rye, managed meadows and pastures, sunflower, legumes, cassava, citrus, cocoa, coffee, date palm, grape and vine, peanuts, millet, coconut palm oil, potato, sorghum, sugar beet, sugar cane, and “other annuals”, as well as “other perennials”.
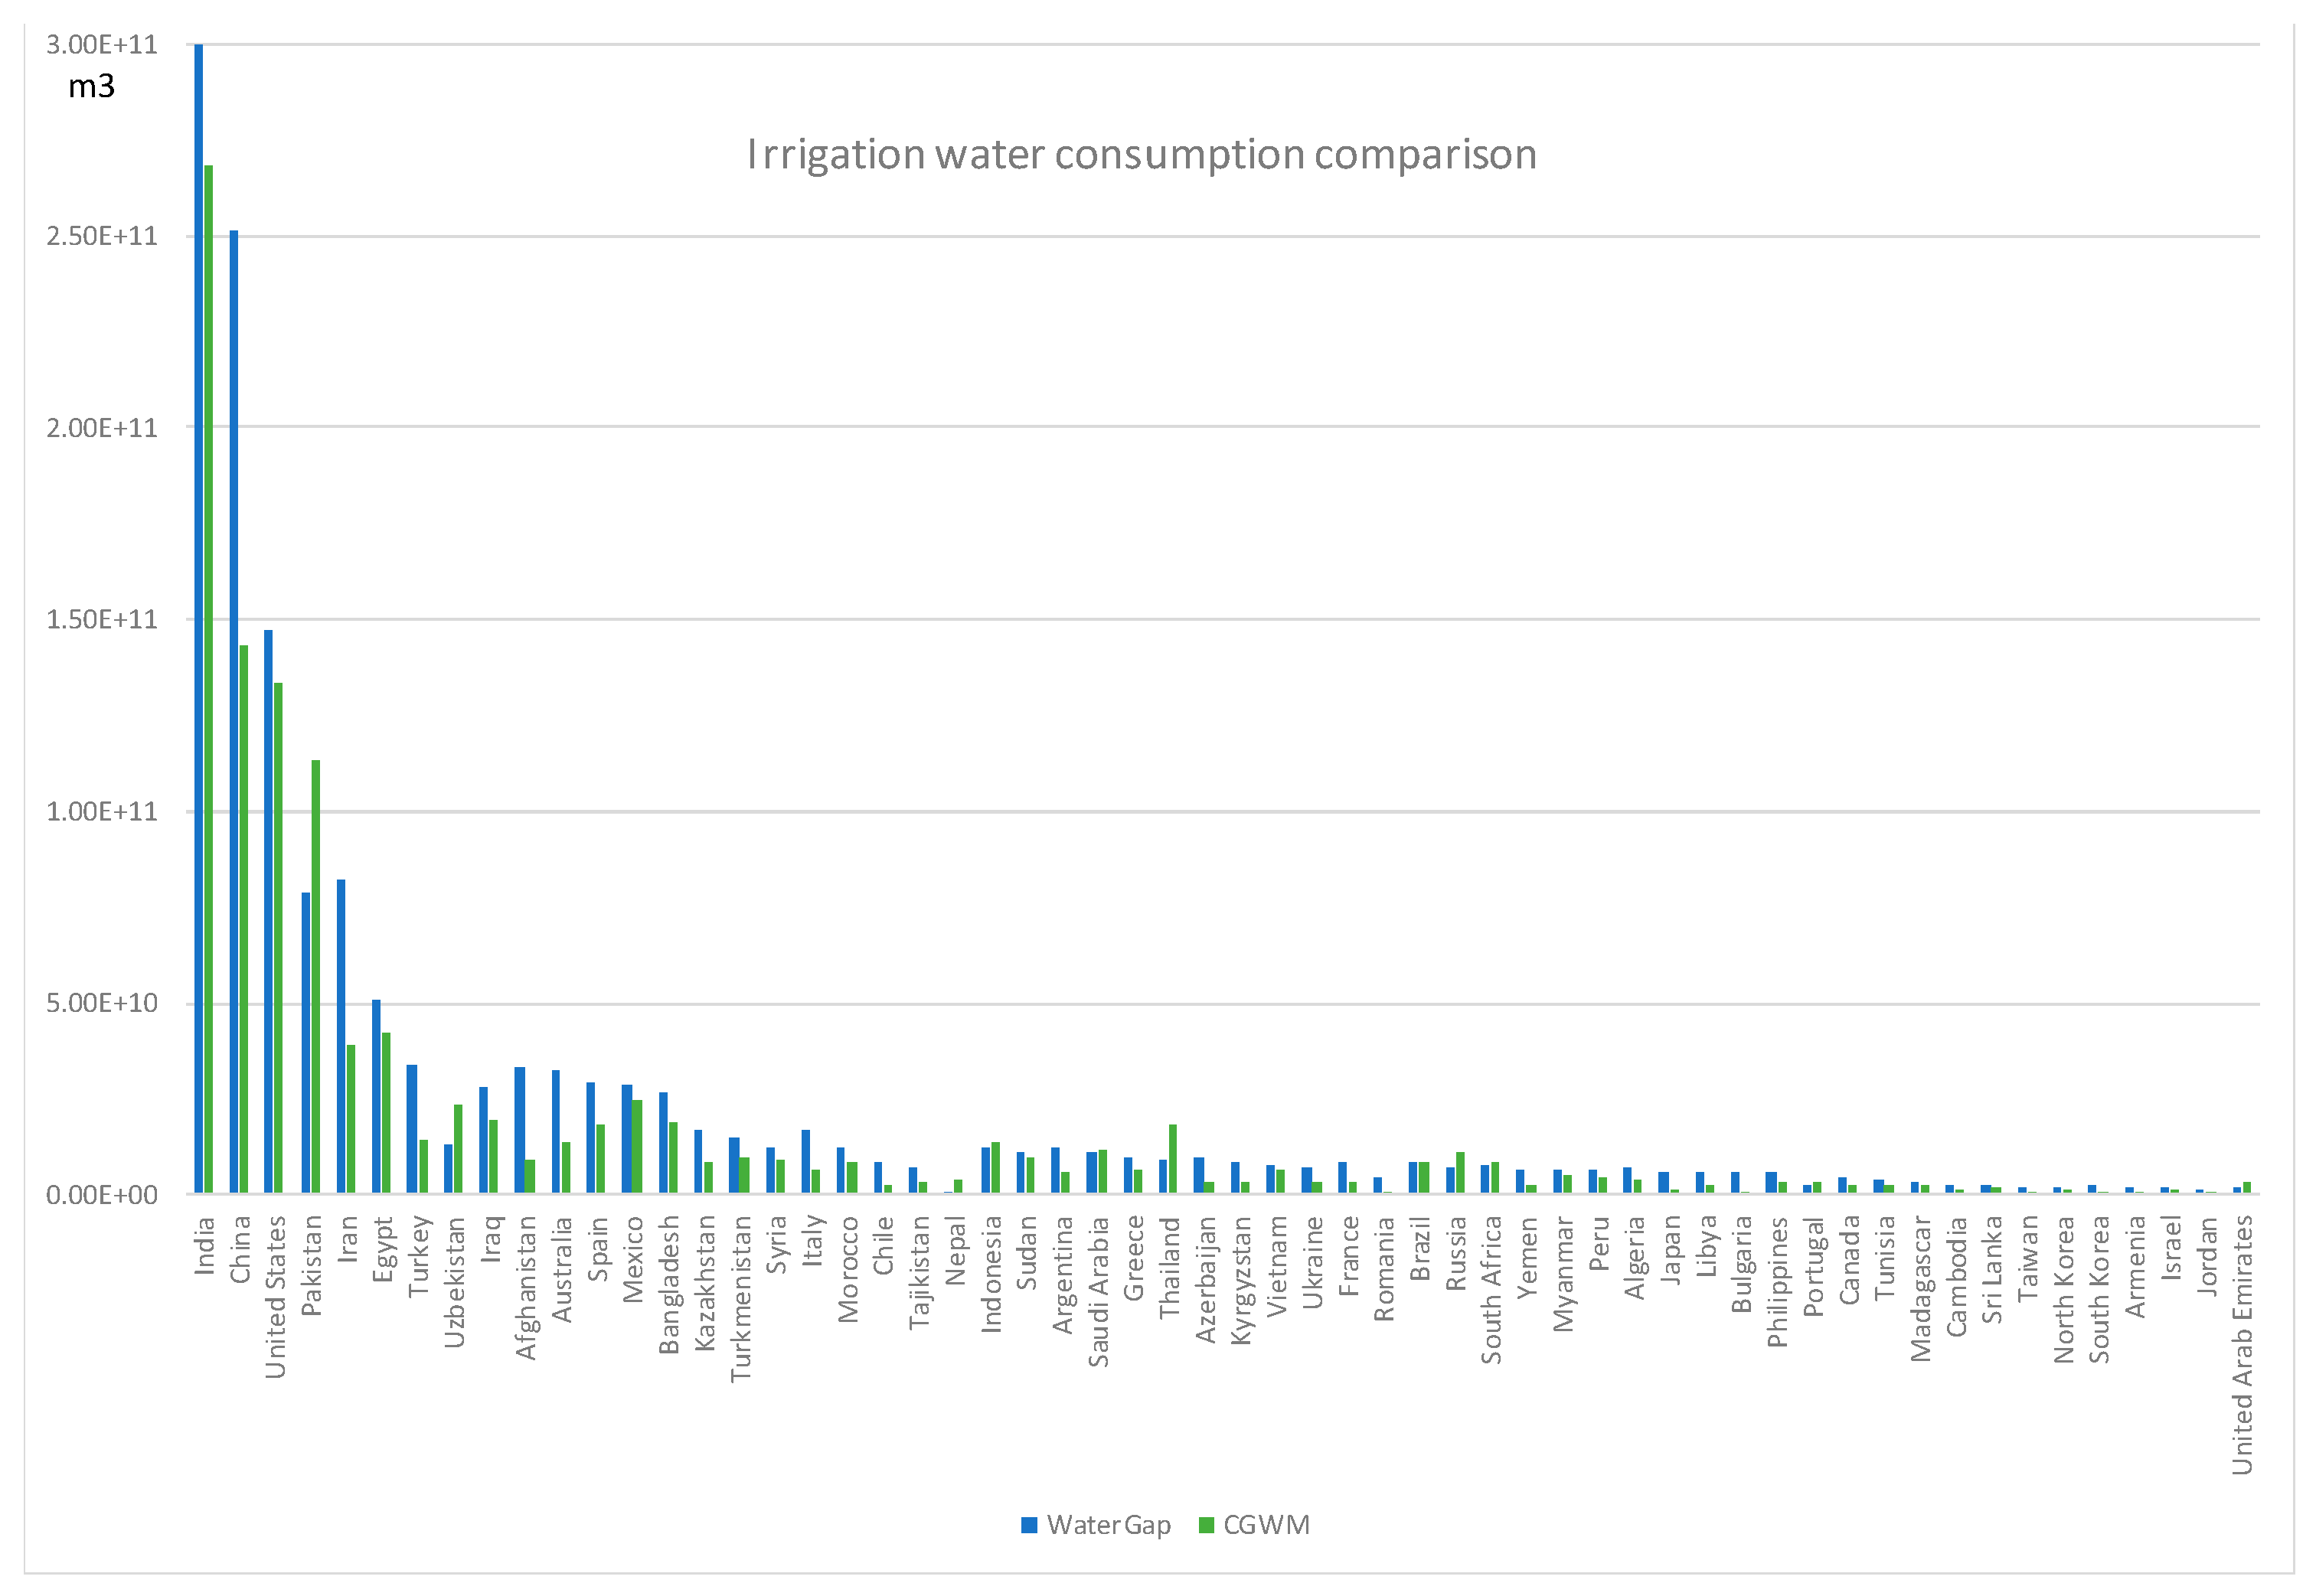
Blue water consumption data (i.e., water consumption for irrigation) refer to the irrigation water requirements for optimal crop growth and for the years from 1998 to 2002. Considering that climatic conditions vary over time, the blue water consumption data considered in this study are the averages of these years. Validation of the data was performed by comparing the total water consumption for agriculture obtained from WaterGap (and used in AWARE modeling), with the sum of the water consumption per country for the 26 crops above from GCWM. In this case, validation involves a comparison with a model output already published and validated [
19,
21]. In this paper, we are using these output data in AWARE [
12].
Since the water consumption data per crop were only available at the yearly time scale, the annual AWARE agri CF was used, at the watershed scale, in Equation (3) above.
2.3. GIS Calculations
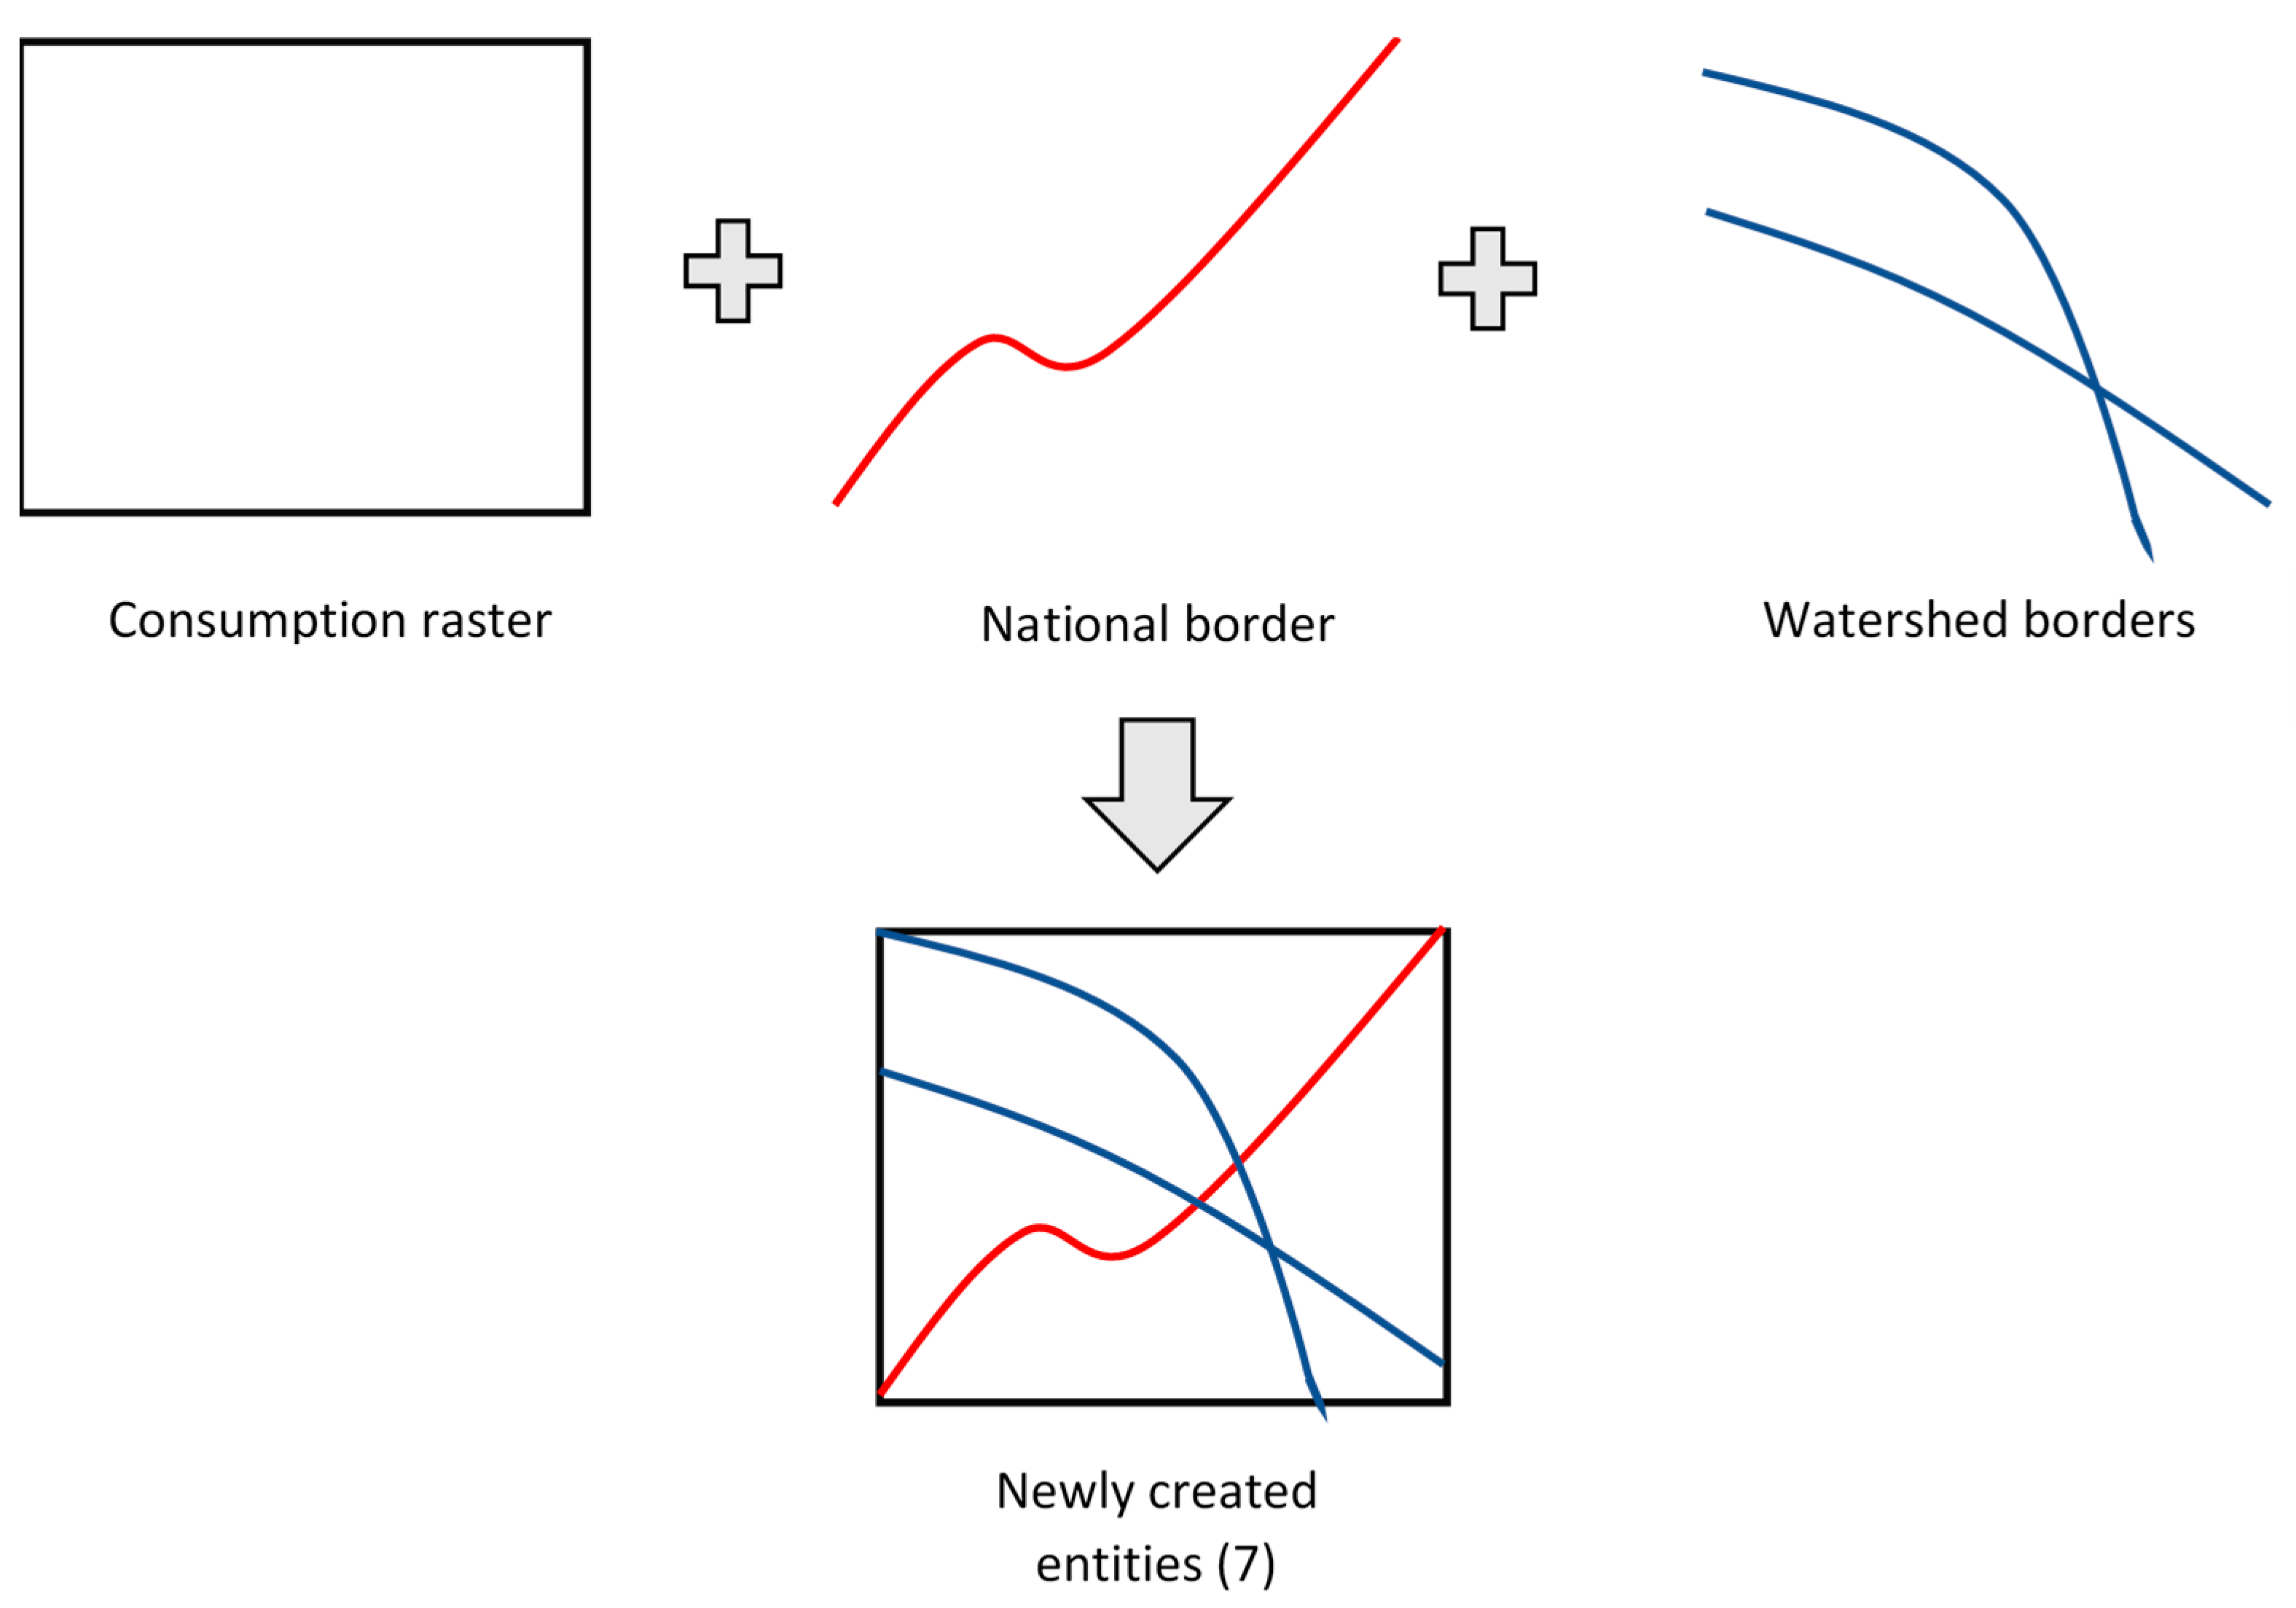
The calculation of crop-specific AWARE factors was done in ArcMap by cross-referencing blue water consumption data (five-degree raster scale, about 10 km at the equator) from GCWM and existing annual AWARE agri factors per watershed (see
Figure 1), to create country and crop-specific AWARE factors.
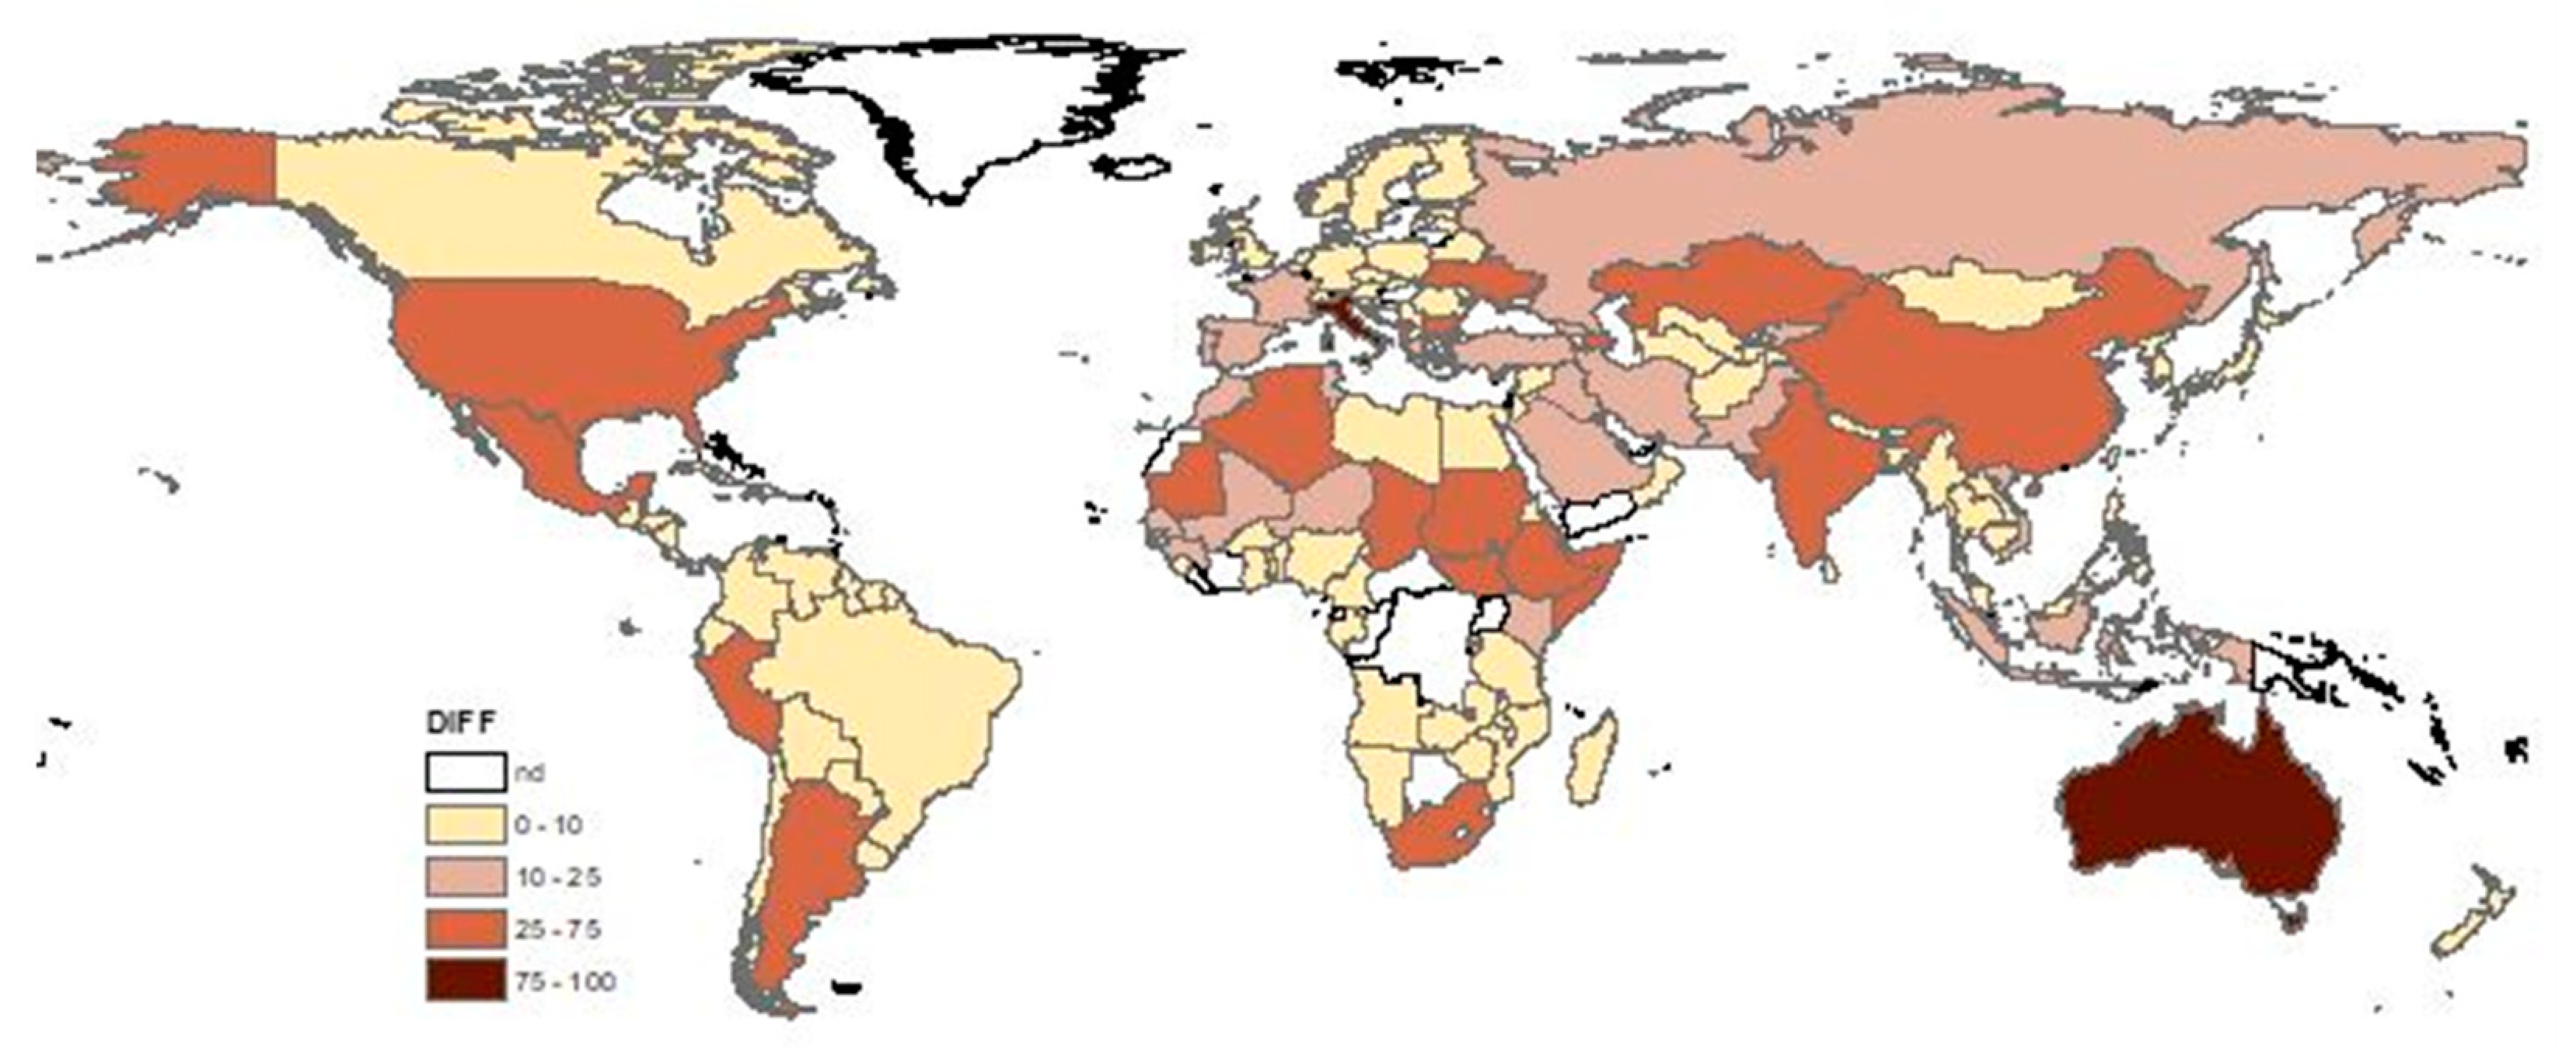
In order to allocate the water consumption of the raster to the different entities created within that raster, the simplest approach (option 1) would have been to assume an equal distribution of water consumption across the raster and allocate it proportionally to the area occupied by the entity. An entity refers to the region created from the overlay of different scales of data. However, upon analysis of the results with this approach, several “errors” were found. An error consists of the attribution of a fraction of a consumption raster to an entity (country or watershed) where no other water consumption for that crop is found. For this reason, another approach (option 2) was chosen: if the raster was divided in two, the consumption was allocated to the largest of the two entities. If it was divided into three or more parts and none of the parts were larger than 50% of the area, then the consumption of this raster was not considered in the calculation. Hence, because of the small surface areas neglected, this had little influence for the relevant crop-producing countries and allowed us to fix the errors created by option 1 and avoid wrongfully attributing crop irrigation to an entity where that crop is not produced or irrigated. For example, Andorra, which has no consumption raster entirely or even predominantly in its territory, was allocated an AWARE of 90 for wheat with option 1. This AWARE was corrected (and no wheat AWARE was attributed to Andorra) with option 2. On the other hand, for Albania, which does produce wheat with irrigation, the value varies insignificantly between the two options (49.39 with option 1 versus 49.02 with option 2). Subsequent manual correction was performed for country-overlapping rasters. The use of option 2 above did not avoid the creation of artefacts where the largest portion of a raster falls in a country which presents no other raster of irrigation of that crop, and that does not produce it (with irrigation) at all. Hence the correction was made based on the criteria that if country A shows no complete irrigation raster in its territory for a specific crop, and only fractions of rasters from a neighboring country B, which itself has at least one complete raster, then no water consumption for this specific crop is allocated to country A.
2.4. Water Scarcity Footprint of Selected Crop Calculations
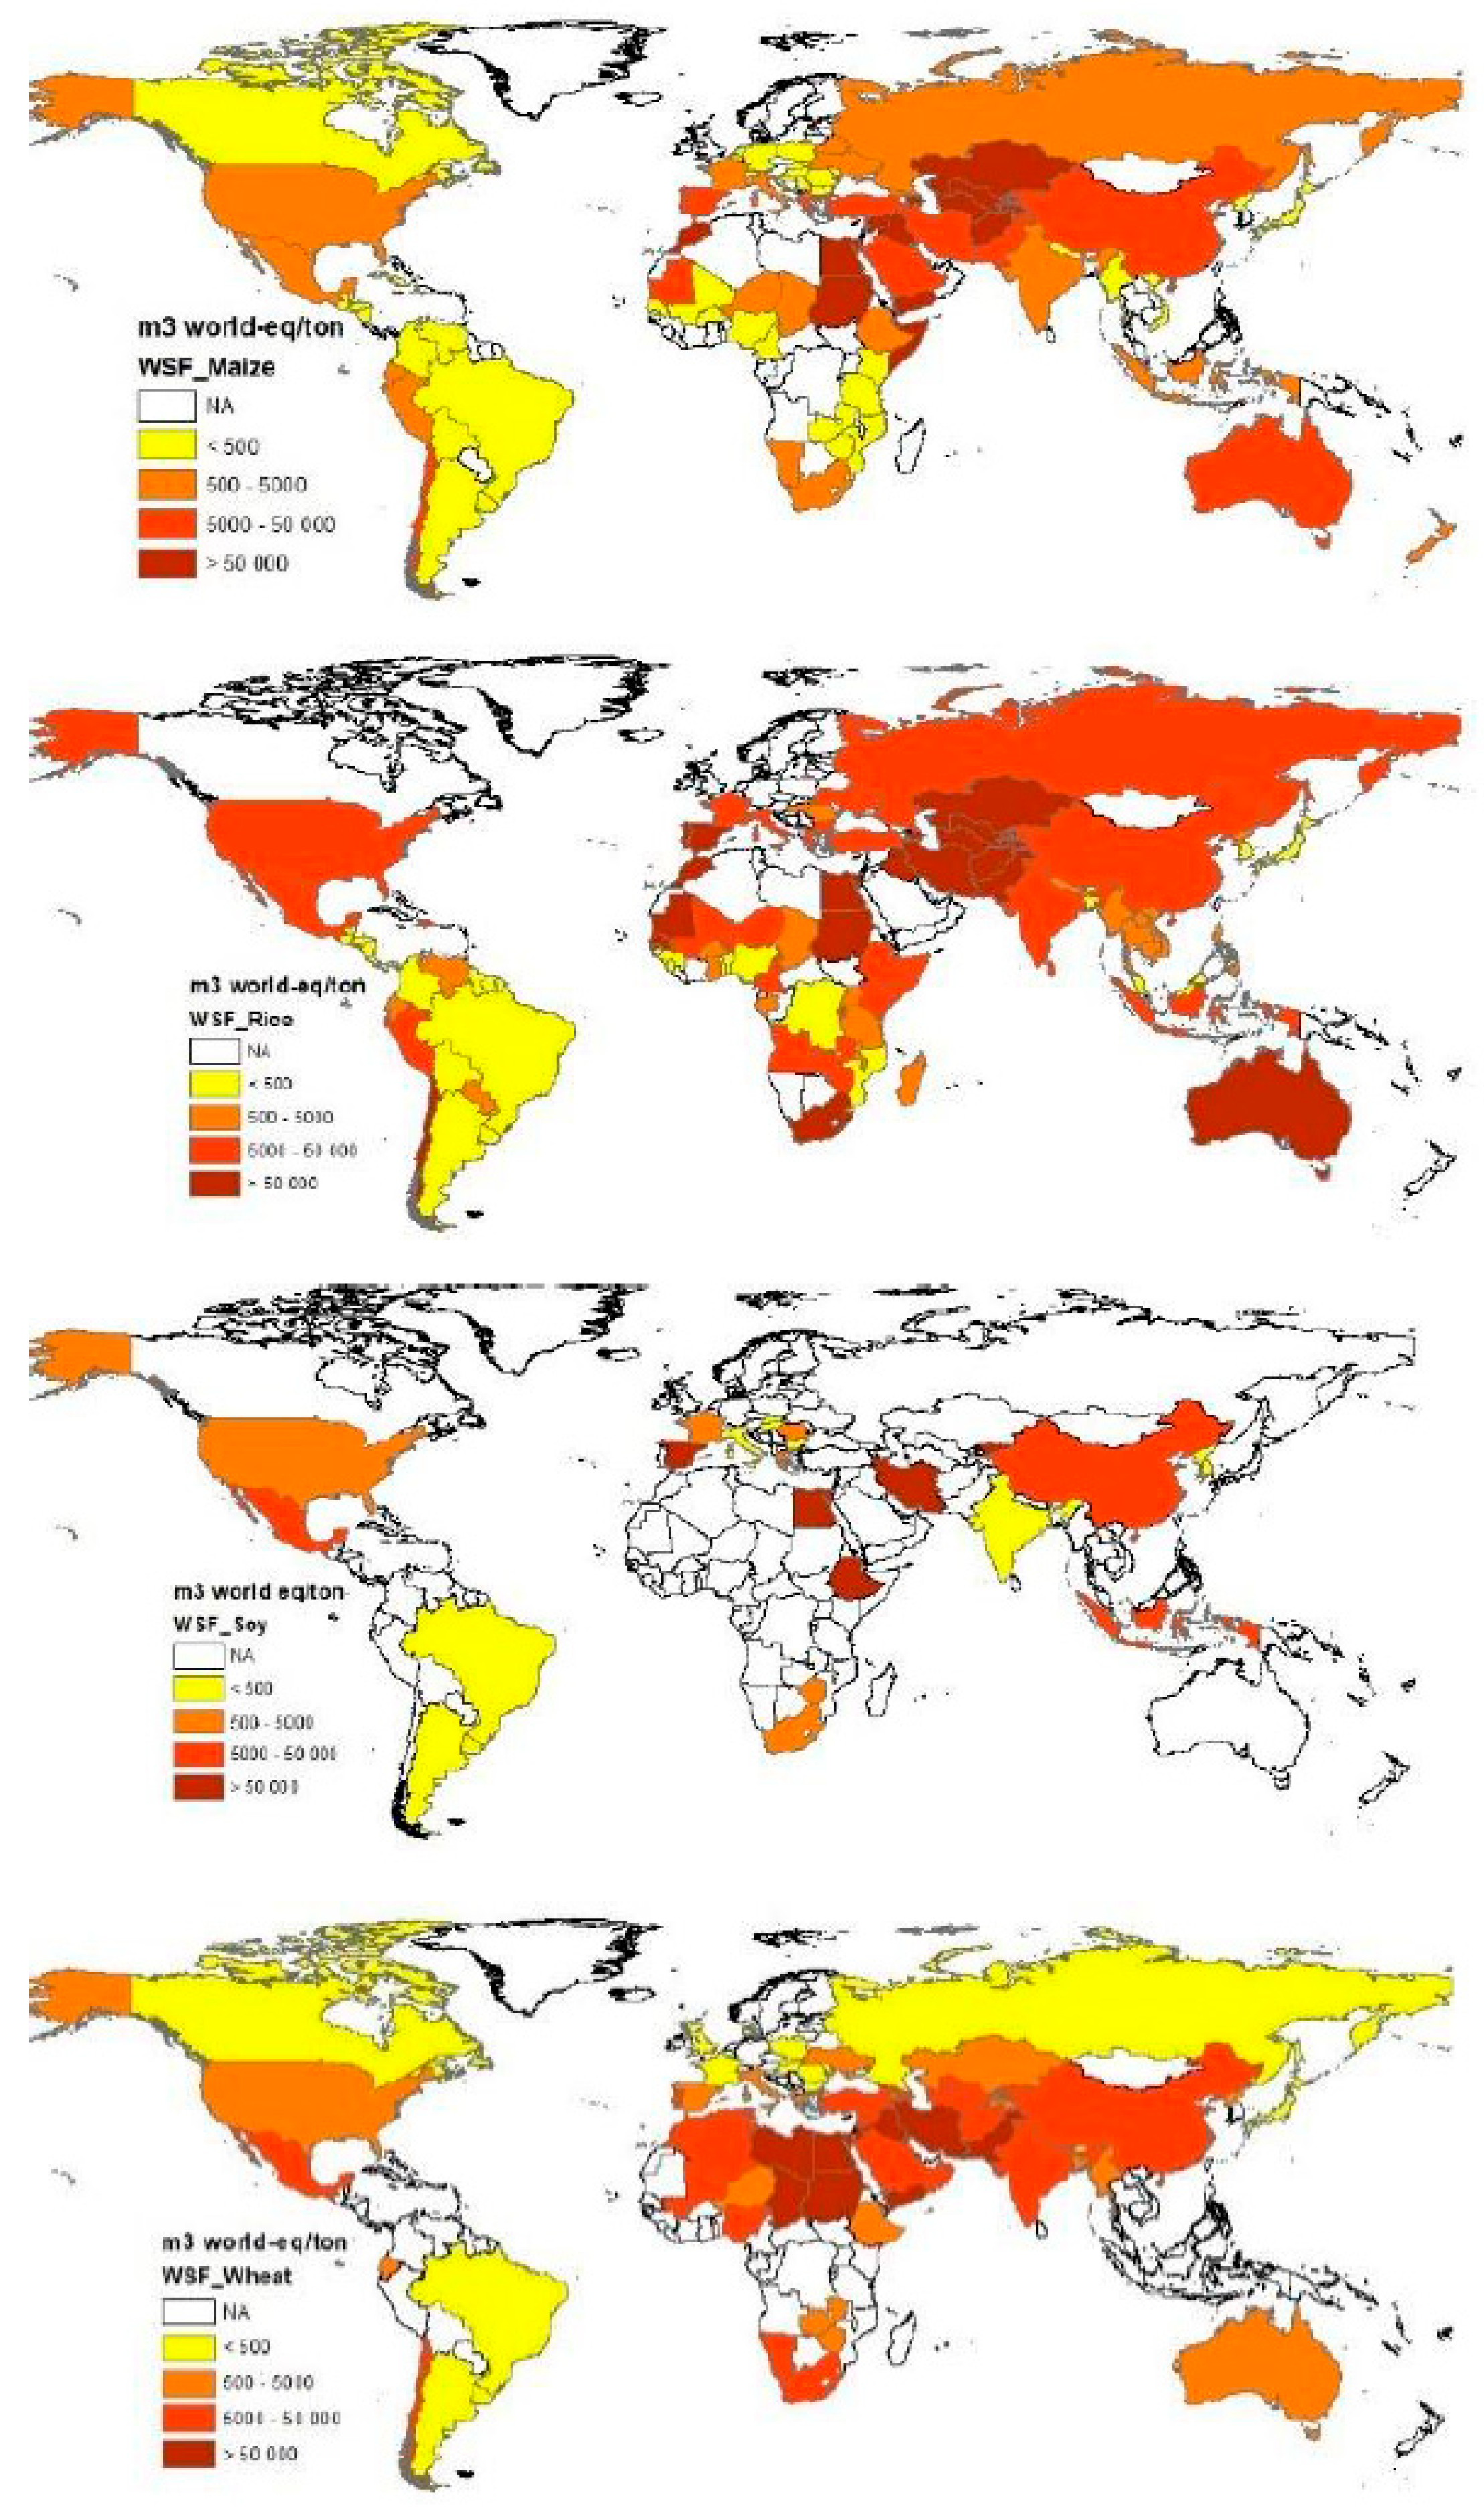
The resulting factors were then used to calculate the water scarcity footprint of four specific crops for illustration purposes (wheat, maize, rice, and soybean) in different countries. This was done by multiplying the crop-specific AWARE CF at the country scale calculated above by the total water consumed for that crop’s irrigation per ton, as obtained from the Water Footprint Network [
22].
4. Discussion and Conclusions
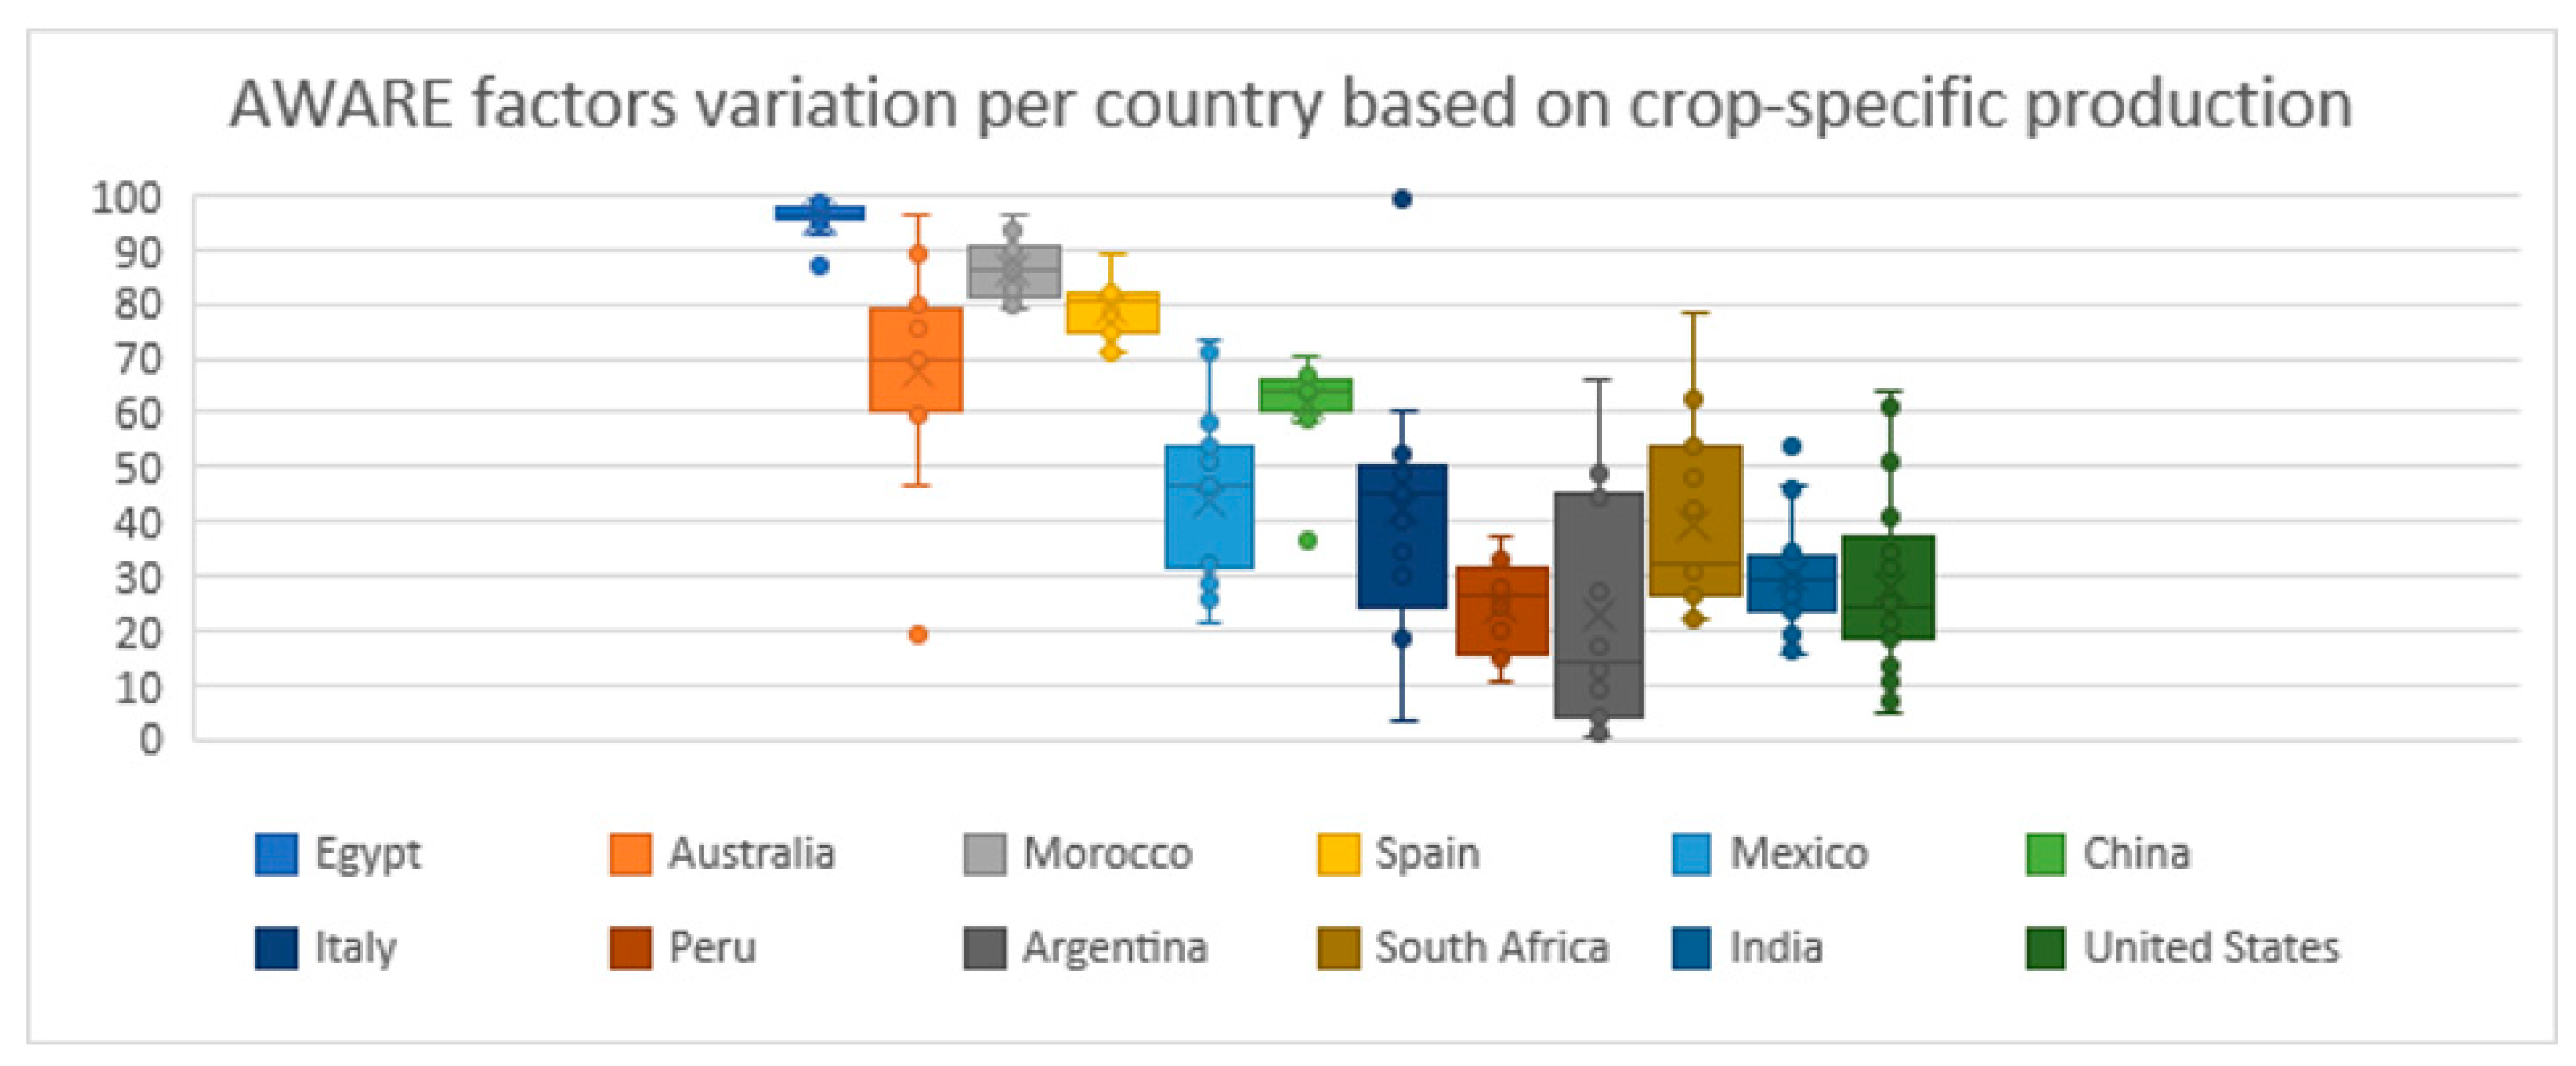
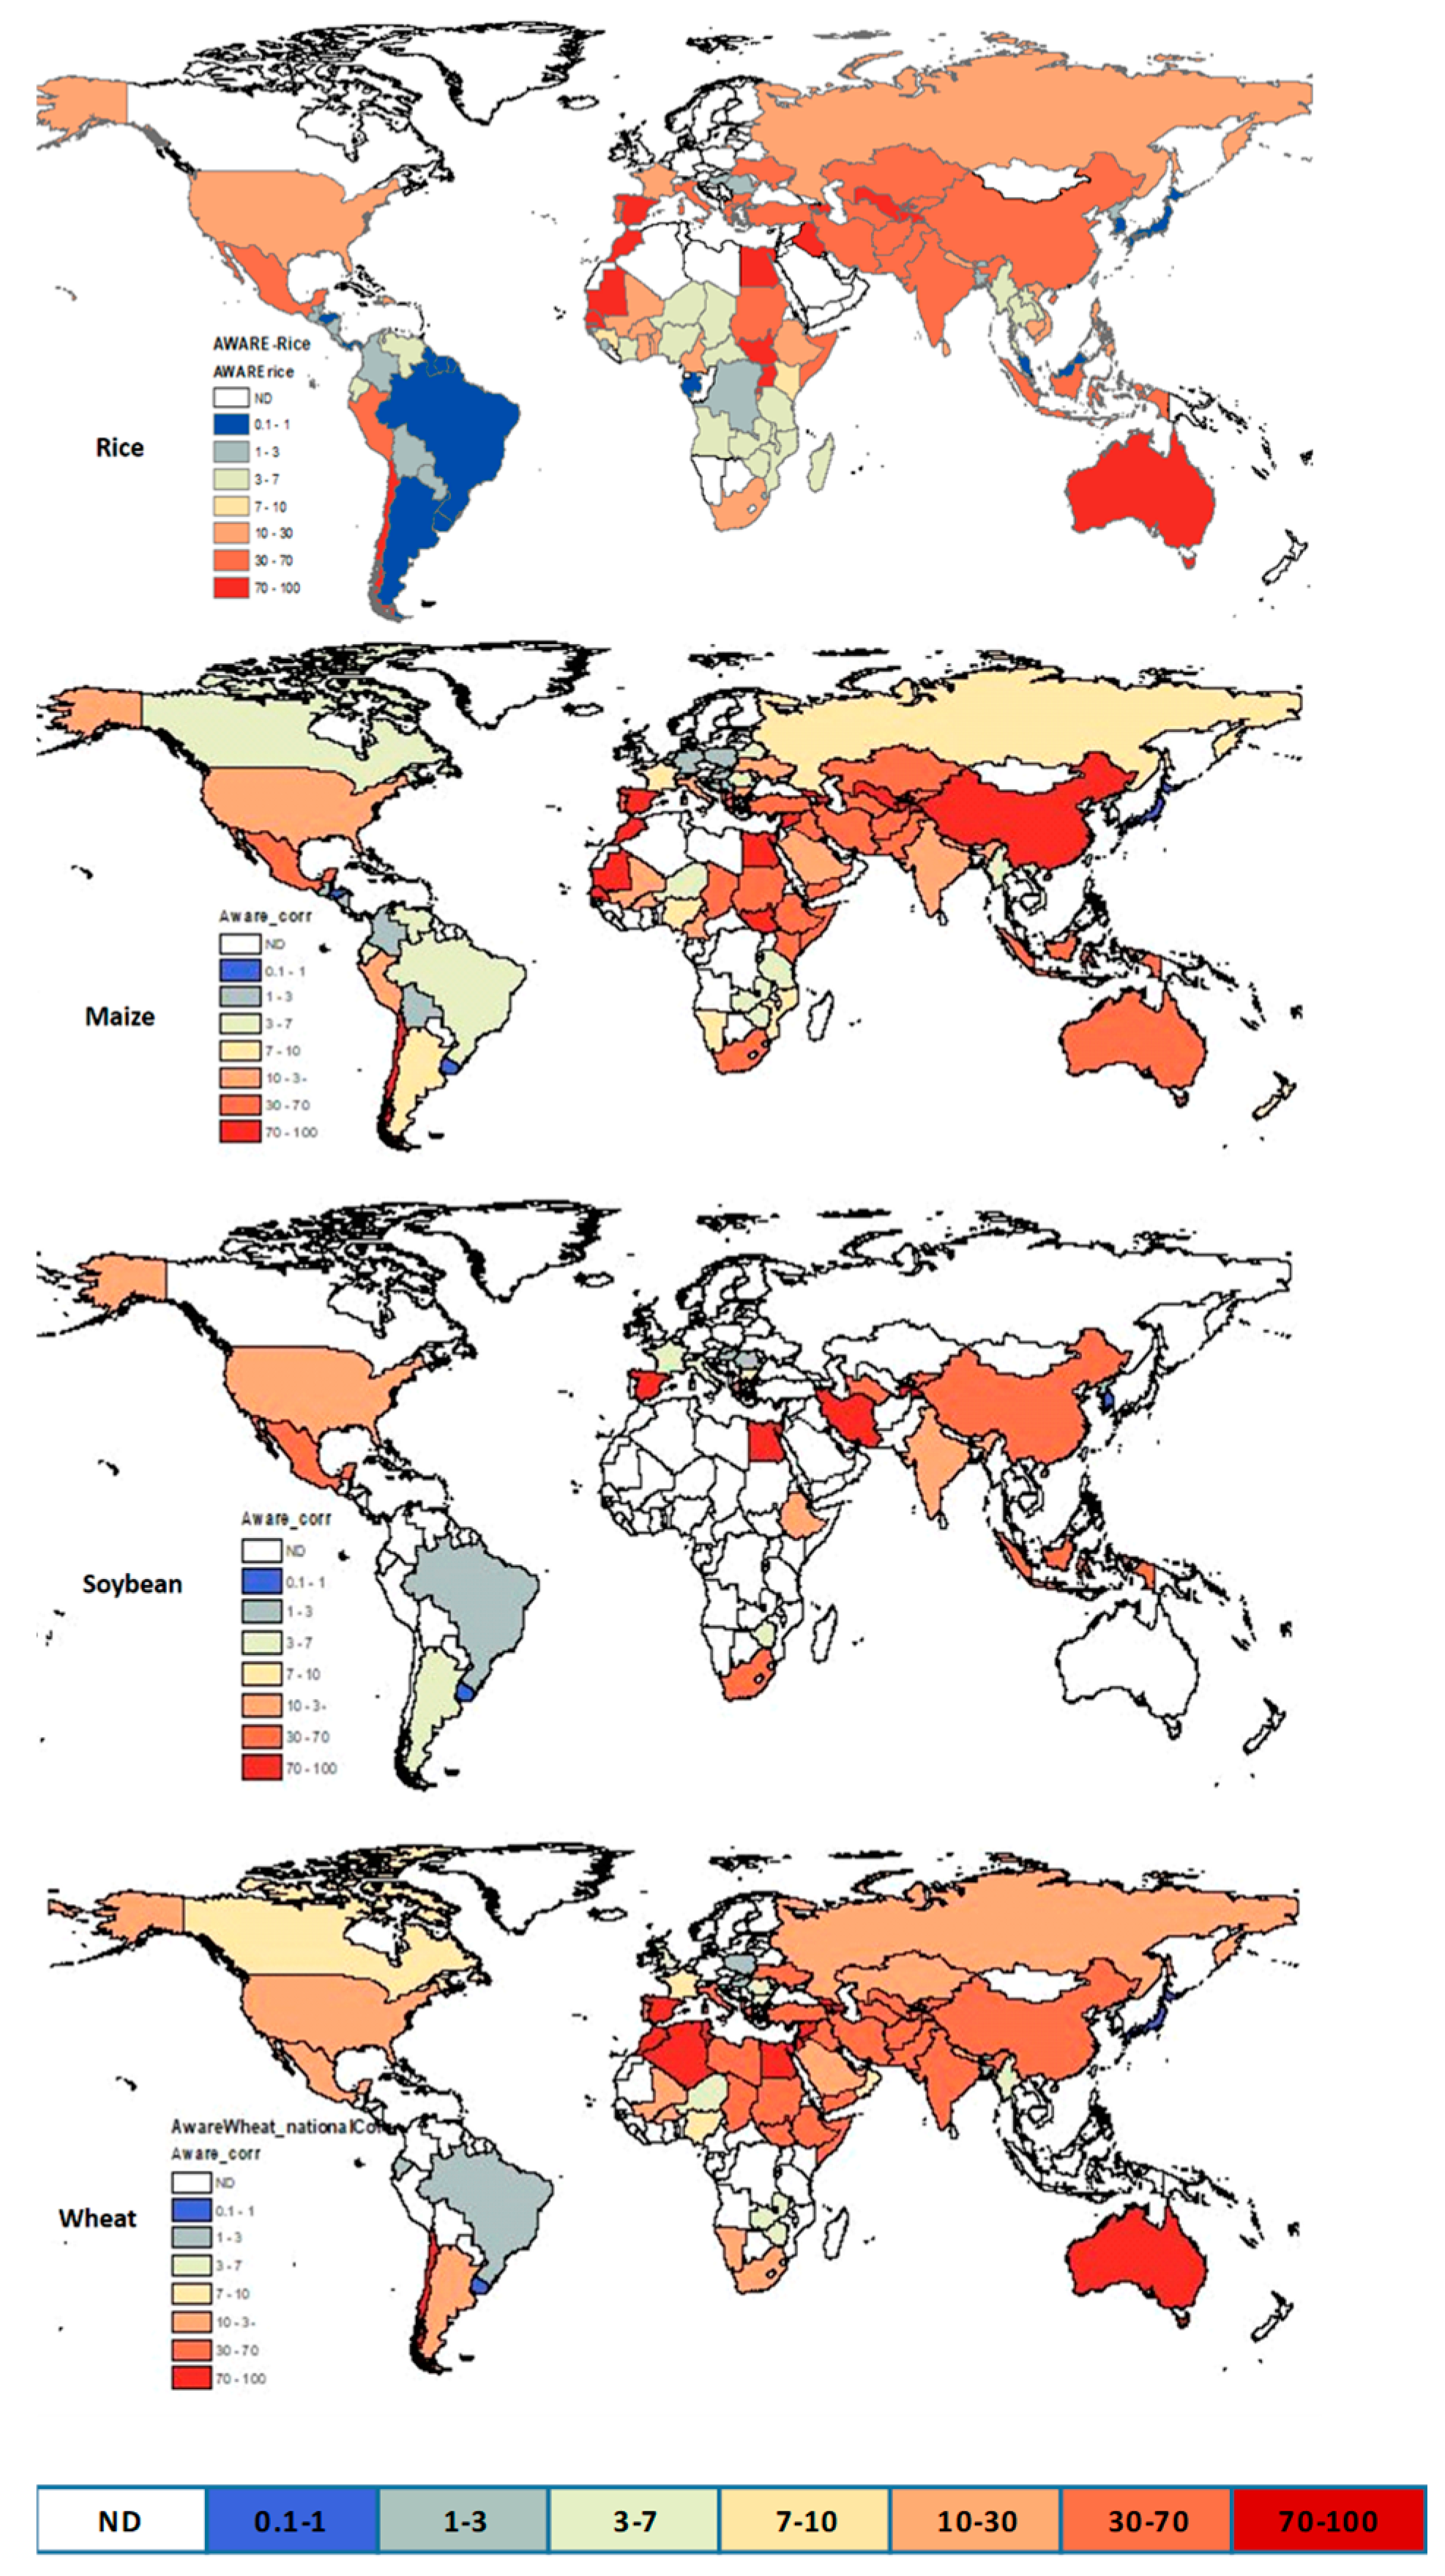
The results of the quantification of the crop-specific CF proved that there is a high variability among crops in selected countries, suggesting that the use of these CF is a better proxy of water scarcity in a region when compared to the national generic CF counterparts (
Figure 5). Generic unknown CF will either overestimate or underestimate the water scarcity impacts of a specific activity. As a consequence, it is recommended that one uses sector-, commodity-, or crop-specific CF in the case where no watershed inventory-specific data are available. This provides a basis for improving understanding of the relative exposure of different crops to water scarcity-related risks. The tendency of over- or under-estimating water scarcity impacts was also proved with reference to generic agri-factors: for example, in the case of Italy, soybean CF values were 3.38 vs. 48.5 of the agri-CF and 43.3 of the general unknown-CF.
The relevance of using more specific CF rather that the general country-wide unknown factor has also been confirmed by other studies. Northey et al. [
17] presented commodity-specific CF for the mining industries, proving that the use of sector-specific CF is more representative than the general country-wide unknown factors. It has to be noted that in this last work, a different weighting approach based on a production-weighting average was used to determine the specific CF. This is because the specific commodity water use data were not available and the authors assumed that water use was uniform across production.
The data used in this paper for specific crop water consumption are based on GCWM which model irrigation based on the years 1998–2002. Cropping patterns have certainly changed since then, as well as climatic data, and one could expect that updated data would influence the results. Already, when comparing GCWM with WaterGap data, which bases itself on production patterns of 2010, and climatic data over a 50-year period (1960–2010), discrepancies were observed. In addition to the models themselves, the climatic period, cropping patterns, and other input parameters, the data resolution and aggregation to country level can also introduce discrepancies, which could be responsible for these differences. The point to remember is that crop-specific water consumption is model-based, and that models are affected by their hypothesis, as well as input data validity and representativeness. Lastly, models quantify water consumption for optimal crop growth, whereas, in reality, more or less than optimal water may be used based on the water availability, technology used, regions, etc.
Crop-specific CF have a national geographical and annual temporal resolution. Considering that crop growth can be significantly influenced by local climatic conditions that change through space and time (this is particularly relevant, for example, for temperate climates), future research should focus on improving the temporal representativeness of the assessment. This could be achieved, for example, by weighting the monthly water use data of specific crops; however, no watershed crop-specific data with such a temporal resolution are available, according to the knowledge of the authors.
The crop-specific CF can also be interpreted as indicators of the contextual water risk of crop-specific productions and related industries. It can be stated that regions with higher crop-specific CF values can in fact encounter higher risks of water scarcity-related issues with that specific crop (e.g., more difficult access to freshwater supplies, increasing tension with competing users, and higher costs). This result is also in line with that of Northey et al. [
17], who presented similar maps for the mining industries’ commodities.
Focusing on the impact assessment presented in
Section 3.1, the results showed that the trend of CF follows the overall values of WSF, and high variability can be identified among different locations and among different crops within the same country. This is in line with the fact that local water scarcity conditions influence the production of specific crops and thus the related water consumption (e.g., in more arid regions), as well as the fact that different water crops have different water needs.
Considering the result of the study, further improvement of the method can be outlined. In fact, the CF presented in this paper represent the first attempt to provide crop-specific factors. Future research, for example, should adopt other data validation references, such as specific field datasets and more recent agriculture management approaches, to determine local water use and climatic conditions [
23,
24].
The developed crop-specific CF could help crop producers increase the transparency and reporting of their water scarcity footprint results [
18], as well as facilitate meaningful interpretations of data. To allow this, the developed crop-specific CF could be integrated into commercial LCA software. Practitioners should therefore be able to select crop-specific CF when performing impact assessment.
