Article

Wall Stresses in Cylinder of Stationary Piped Carriage Using COMSOL Multiphysics

1
College of Water Resources Science and Engineering, Taiyuan University of Technology, Taiyuan 030024, China
2
Polytechnic Institute Taiyuan University of Technology, Xiaoyi 032300, China
3
Jinzhong University, Jinzhong 030600, China
4
College of Mechanical and Vehicle Engineering, Taiyuan University of Technology, Taiyuan 030024, China
*
Author to whom correspondence should be addressed.
Water 2019, 11(9), 1910; https://doi.org/10.3390/w11091910
Submission received: 19 August 2019 / Revised: 6 September 2019 / Accepted: 9 September 2019 / Published: 13 September 2019
(This article belongs to the Special Issue Pipeline Fluid Mechanics)

Abstract

:
Hydraulic transportation of the piped carriage is a new energy-saving and environmentally-friendly transportation mode. There are two main states in the conveying process, stationary and moving. In the process of hydraulic transportation of the piped carriage, the study of the stress of the water flow act on the cylinder wall of the piped carriage can help to improve the design of the piped carriage structure and even the selection of piped carriage materials. The distribution of flow velocity around the stationary piped carriage and the stress distribution on the cylinder wall of the stationary piped carriage were investigated by combining numerical simulations with model experiment verification. The commercial finite element software, Comsol Multiphysics, was utilized to solve this problem using the arbitrary Lagrangian–Eulerian (ALE) method. The results showed that the simulation results were in good agreement with the experimental results. It also showed that the ALE method can well be applied for fluid-structure problems in the process of hydraulic transportation of the piped carriage. The simulation results showed that the low velocity region near the inner wall of the pipe was smaller than that near the outer wall of the piped carriage, and both regions decreased with the increase of the discharge. The maximum stress on the cylinder wall of the piped carriage appeared between the two support feet in the middle and rear sections of the cylinder. The influence of the unit discharge on wall stress increased with the increase of the discharge, that is, k1 < k2 < k3. Moreover, the increase of the discharge had the greatest influence on the circumferential component of the principal stress of the cylinder, followed by the axis component, and the smallest influence on the wall shear stress of the cylinder, i.e., k ¯ σ c > k ¯ σ a > k ¯ σ r > k ¯ τ c .

1. Introduction

The hydraulic capsule pipeline (HCP) is a new pipeline hydraulic transportation mode after the slurry pipeline transportation mode and the material-log pipeline transportation mode. Compared with traditional pipeline transportation and other modes of transportation, it has more advantages: ① The scope of application is broader, because HCP uses sealed containers as conveying carriers, and conveying media and materials do not contact directly. It can convey most types of materials including solid, liquid and gas states, especially for the transportation of agricultural products and municipal solid wastes which do not need higher transportation speed. ② It is more resource-saving. The transport of fluids can be recycled, not polluted. ③ Compared with other types of transportation, the energy consumption is lower [1], the forming and dehydration processes are saved, and the operation cost is lower. ④ The transporting fluid is clean water or reused water, and there is no risk of siltation during normal operation. ⑤ The whole operation process is driven by fluid pressure. The transportation process is low carbon and environmentally friendly [2,3], which is more in line with the requirements of the times.
The HCP was first put forward in the 1960s at the Alberta Research Council in Canada [4]. Later, it was supported by the National Science Foundation in the United States. The University of Missouri-Columbia established a Capsule Pipeline Research Center. The HCP was receiving intensive research and development (R and D) at the center. There are two main states of the capsule in the pipe flow, stationary and moving. In the middle and late 20th century, a great deal of research has been done on the stationary capsule in the pipe flow. The case of the stationary capsule is of interest because all HCP systems must start and stop on occasion. In 1981, Liu specifically introduced and defined the concept of the HCP [5], and determined the lift and drag coefficient of the HCP by measuring the pressure distribution around the stationary capsule in the pipe flow [6]. Then, the distribution of the HCP pressure along the pipe was deduced by theoretical research, and the theory was applied to the prediction of the bottom resistance, pressure coefficient and initial velocity of a single capsule [7]. Gao further revised the initial speed of a single capsule deduced by Liu and Richard and applied it to capsule trains [8]. Cheng discussed the minimum velocity of a single stationary capsule tilt through theoretical analysis and experimental study [9].
As early as the mid-20th century, scholars began to study the HCP in the state of motion. Kroonenberg [10] investigated the average velocity of the capsule and the pressure drop at both ends of the capsule by theoretical research, and verified it by experiments. Charles [11] estimated the velocity of the capsule and the annular slit flow between the capsule and the pipe with laminar flow and turbulent flow respectively, and compared the speed of the capsule and the average velocity of the pipe flow under these two flow conditions. It was concluded that the speed of the capsule always exceeded the average velocity of the pipe flow. Tomita et al. [12] established a dynamic coordinate system on the HCP. Through theoretical deduction, it was also concluded that the speed of the capsule was always greater than the average velocity of the pipe flow, and physical experiments were carried out to verify it. Latto and Chow pointed out the effects of different annular slit ratios on the velocity ratio Rv, pressure drop ratio Rp and unit energy loss [13]. Michiyoshp and Nakajima [14] calculated the annular slit flow velocity, friction coefficient, mixing length and eddy diffusion coefficient of the crevice flow based on the Reichardt momentum eddy diffusion coefficient expression and Nikurads mixing length expression. Nouri et al. [15] measured the fluid velocity and Reynolds stress of the annular slit flow through experiments.
In the 21st century, with the maturity of computer technology, the field of computational fluid dynamics (CFD) has been further developed. Quadrio [16] used N-S equation for the first time to simulate the flow characteristics of the annular slit flow field around the capsule by a numerical simulation method. Khalil et al. [17] used three models (Baldwin-Lomax model, k-ε and k-w) to simulate and compare the flow field around the capsule. Asim et al. [18] simulated the pressure drop change of the different annular slit width and length by CFD.
During the operation of the HCP, adverse working conditions, such as a pipe wall collision and friction often occur. Sun [19] put forward a new concept of the piped carriage transport theory at the 20th national conference on hydrodynamics, improved the structure of capsule, and named it “piped carriage”. The unique design of the conveying carrier ensures the concentric stability of the operation process and reduces the loss of the conveying pipe wall. The research on hydraulic transportation of the piped carriage is based on the tireless efforts of Professor Sun of Taiyuan University of Technology as the leader of scientific research team. In recent years, the following preliminary results have been obtained in this field: ① The configuration parameters of a single piped carriage were optimized. For example, the length and diameter of the cylinder [20,21], the ratio of diameter to length [22], the guide vane height [23], the guide vane length [24,25], and the guide vane placement angle [26,27,28]. The relationship between the structural parameters and the transportation speed and energy consumption of piped carriage hydraulic transportation was explored. The influence of different structure parameters of the piped carriage on the flow field in the pipe during the transportation process was studied. The relationship between the flow field and energy consumption in piped carriage hydraulic transportation was constructed. ② The relationship between conveying conditions and energy consumption of a single piped carriage hydraulic transportation. Another important factor affecting the transportation speed and energy consumption of the piped carriage is the conveying conditions. The research group had done in-depth research from different Reynolds numbers [29], and the load [30]. Considering the speed and energy consumption of the piped carriage, it was concluded that the transportation efficiency of the piped carriage increased first and then decreased with the increase of the Reynolds number, and reached the maximum when the Reynolds number was 200,000. The load was almost inversely proportional to the average speed of the piped carriage. ③ The relationship between the configuration of piped carriages, transportation conditions and energy consumption [31,32]. The optimum distance between the piped carriage should be between 35 cm and 50 cm. Under the same distance, the greater the discharge, the greater the hydraulic loss of the flow in the test section, that is, the greater the energy consumption.
However, no matter whether a model experiment or numerical simulation is used, the stress distribution on the cylinder wall of the piped carriage in the pipe flow has rarely been studied. Only a few scholars had a few explanations of simple theories. Therefore, through numerical simulation and model experiment verification, this research explored the stress distribution of the fluid on the cylinder wall of the piped carriage when it was stationary in the pipe flow. This investigation helps to improve the relevant theory and provide some reference.
The fluid–structure interaction is involved in the hydraulic transportation process of the piped carriage. In the process of water driving the piped carriage, the stress of water acting on the piped carriage causes the deformation of the piped carriage, and the deformation of the piped carriage also acts on the pipe flow, and the flow filed has changed. Therefore, the bidirectional fluid-solid coupling was adopted in the model establishment. There are many different ways to solve the problem of fluid-solid coupling, such as the immersed boundary method (IBM), Lattice Boltzmann methods (LBM) and arbitrary Lagrangian–Eulerian (ALE) method [33]. This model was solved by arbitrary Lagrangian-Eulerian technique (ALE). The arbitrary Lagrange-Euler (ALE) method is based on the arbitrary movement of reference points, accompanied by a good “mesh moving algorithm”, which is used as a mobile mesh type calculator. By reconstructing the mesh through the motion of the structure, the solution can deal with the problems of the moving boundary, free surface, large deformation and interface contact with high accuracy [34,35]. The commercial finite element software, Comsol Multiphysics 5.4, was utilized to solve this problem using the arbitrary Lagrangian–Eulerian (ALE) method.
This article is presented as follows. The Section 2 is the theoretical analysis, including the introduction of the piped carriage model and the wall shear stress analysis of the piped carriage. Section 3 and Section 4 are the specific governing equations, parameter setting of the fluid-solid coupling numerical simulation method and the model experiment arrangement respectively. Section 5 is the verification and analysis of the numerical simulation results compared to the experiment results. The analysis and discussion of the simulation results of the flow field around the piped carriage and the stress distribution on the cylinder wall when it is stationary in the straight pipe flow are shown in Section 6. The main conclusions are given in Section 7.

2. Theoretical Analysis

2.1. Piped Carriage Structure

As a new technology, the hydraulic transportation system using the piped carriage as a carrier has been developed in recent years. In the system, the delivered material is sealed in a cylindrical container which is transported in a closed pipeline to the destination. During the container transportation process, the water pressure difference between both ends of the cylinder serve as power. The schematic diagram of the piped carriage model used in this experiment is shown in Figure 1. It is mainly composed of four parts: The cylinder, plug, support body and support foot [19,20]. As the core component of the piped carriage, the cylinder is used to store the materials that need to be transported. The support feet were installed on the support body and distributed with 120° spacing, which ensured the concentricity between the piped carriage and the pipe. The end of the support body was equipped with universal balls, which were used to reduce the movement resistance between the piped carriage and the pipe during operation.

2.2. Force Analysis

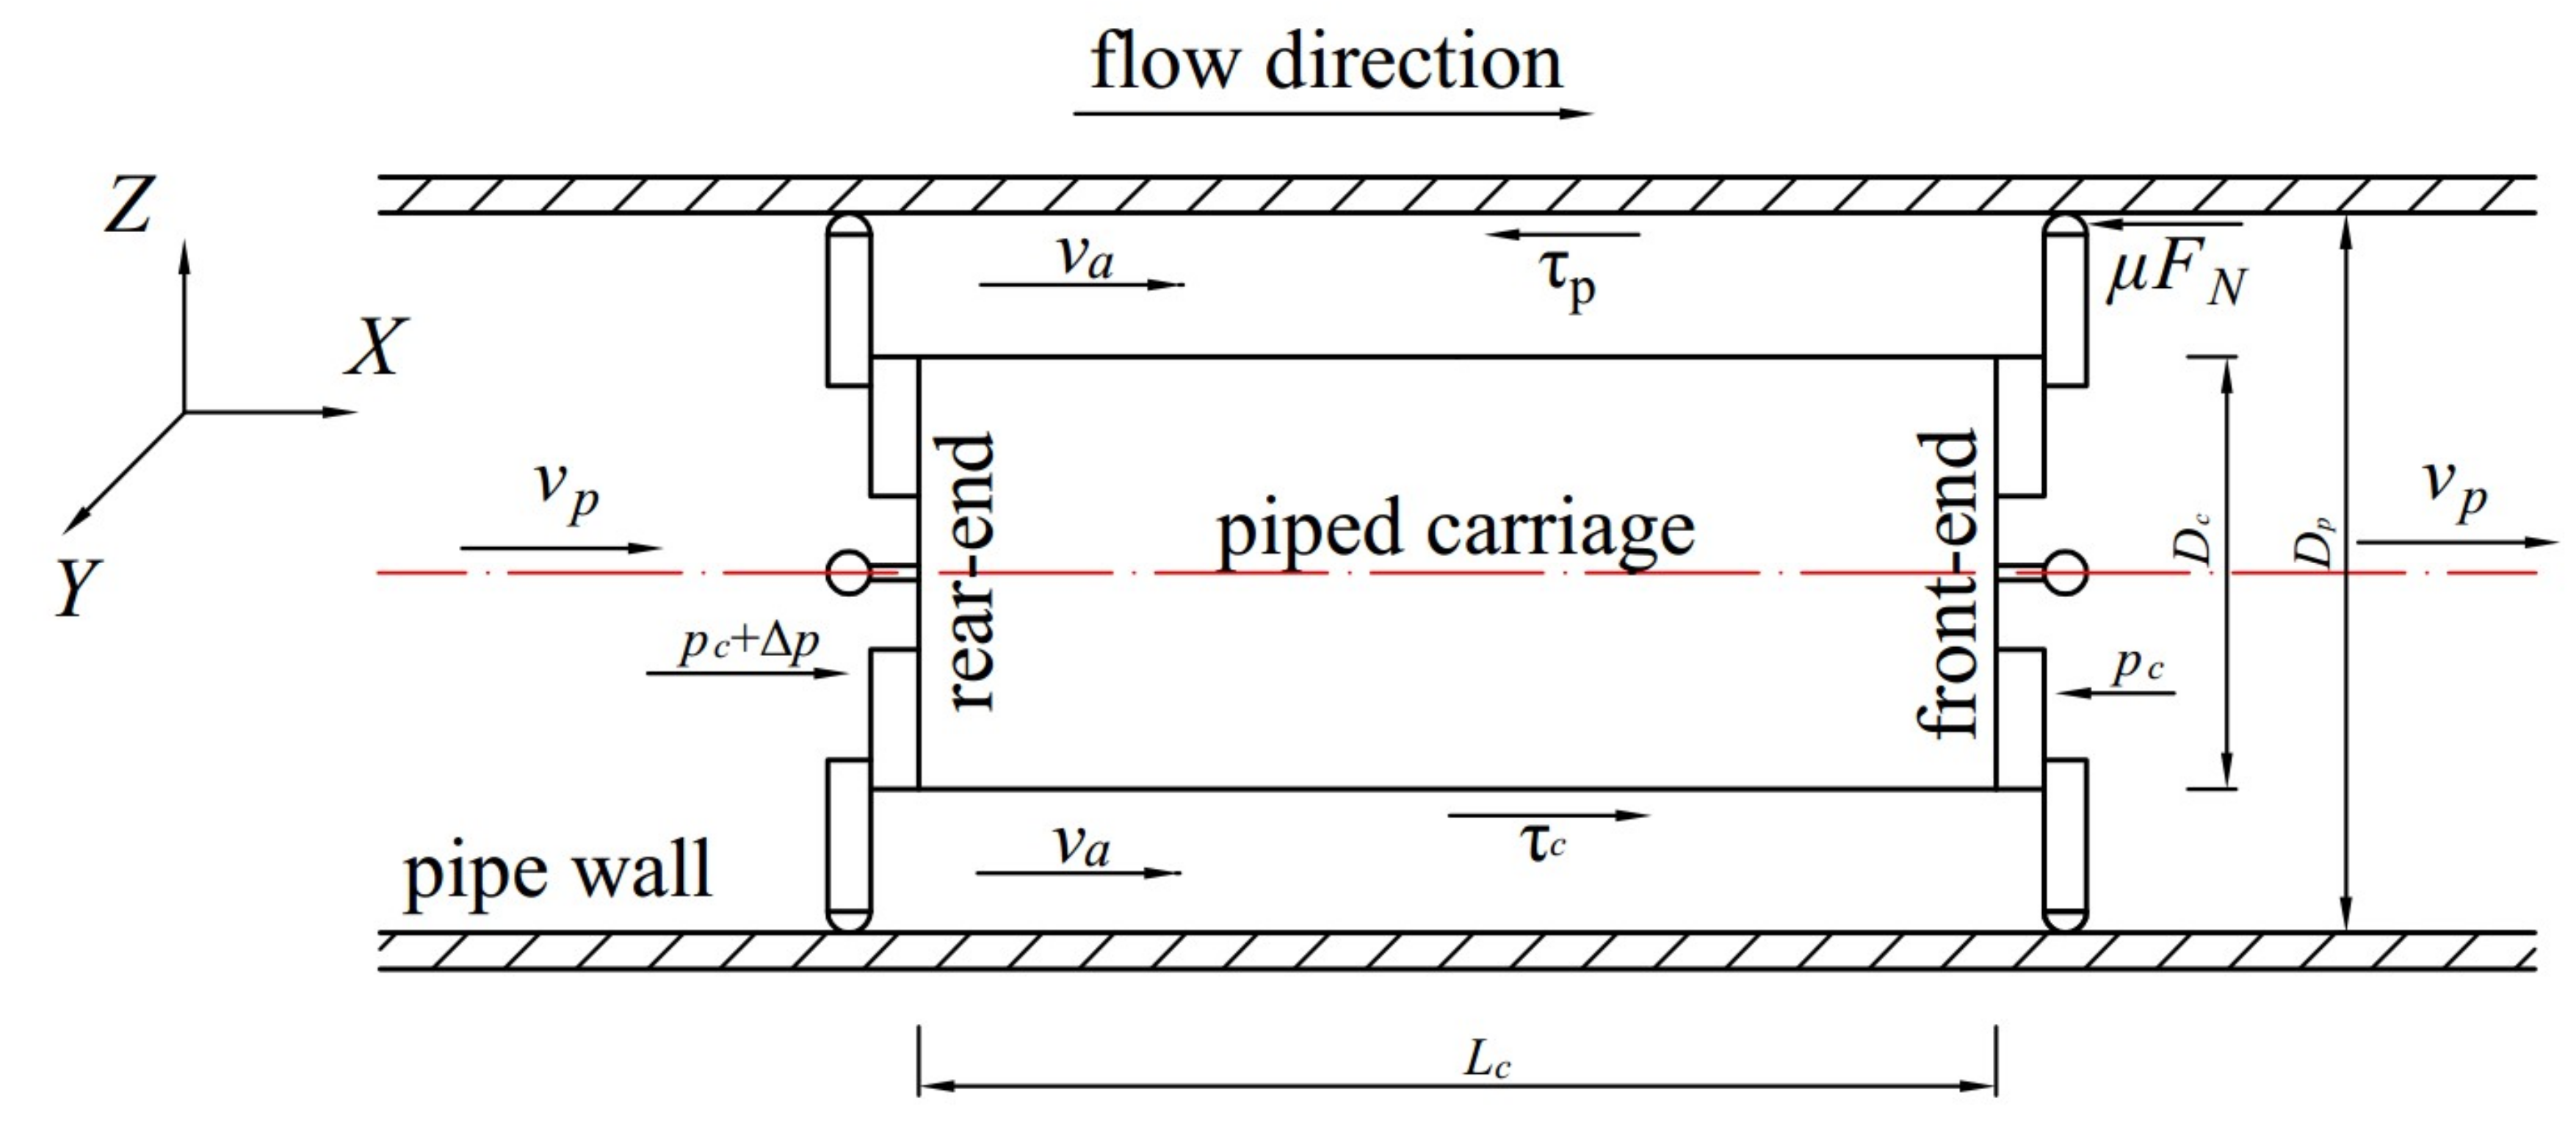
Consider a piped carriage resting on the pipe flow, as shown in Figure 2. The flow direction was from left to right. Along the direction of pipe flow, the left end of the piped carriage is defined as the rear-end and the right end is defined as the front-end. The forces acting on the piped carriage include hydrodynamic pressure at both ends of the piped carriage, shear stress on the cylinder wall of piped carriage and rolling friction caused by contact between the support feet of the piped carriage and the pipe wall.
The balance of these forces in the direction of pipe flow yields.
π 4 D c 2 Δ p c + π D c L c τ c = 6 μ F N
Let ε = Lc/Dc, which is the length-diameter ratio of the piped carriage. The motion models of the stationary piped carriage were deduced from Equation (1), which can be simplified as:
Δ p c + 4 ε τ c = 24 μ F N π D c 2
where ∆Pc is the pressure difference across the ends of the piped carriage, Dc and Lc are the diameter and length of the cylinder of the piped carriage, respectively. τc is the average shear stress on the cylinder of the piped carriage, μ is the dynamic friction coefficient, FN is the supporting force at the contact of the piped carriage support feet and the pipe inner wall.
Similarly, consider the balance of forces acting on the annular slit flow ignoring the influence of piped carriage feet on it, where in the region between the pipe and the piped carriage, yields:
π 4 D p 2 D c 2 Δ p c = π L c ( D c τ c + D p τ p )
Let k = Dc/Dp, which is the diameter ration between the piped carriage and the pipe. Thus, the Equation (3) can be written as:
Δ p c = 4 ε τ c 1 k 2 ( τ p + k τ c )
Combining Equations (2) and (3) yields:
4 ε τ c 1 k 2 ( τ p + k τ c ) = 24 μ F N π D c 4 ε τ c
The relationship between τp and τc can be written as follows [36]:
τ p τ c = k ( 2 ln k k 2 + 1 ) k 2 1 2 k 2 ln k = ψ 1 ( k )
Substituting Equation (6) into Equation (5) to obtain:
τ c = 6 μ F N π k 2 D c 2 1 k 2 ε ( k ψ 1 + 1 )
Equation (4) can be rewritten to as follows:
Δ p c L c = 4 ( τ p + k τ c ) ( 1 k 2 ) D p = λ a D p ( 1 k ) ρ v a 2 2
where ∆Pc/Lc represent the actual pressure gradient. The right-hand side of the Equation (8) is the Darcy-Weisbach formula [7]. The λa is the resistances factor for the annular slit flow. va is the average velocity of the annular slit flow.
Thus, substituting Equation (6) into Equation (8) yields:
τ c = 1 + k 4 ψ 1 + k ) λ a ρ v a 2 2
The resistances λa are related to the characteristic length, i.e., the hydraulic radius. In this article, the piped carriage is approximated as a cylinder, and the hydraulic radius is calculated by (1−k)Dp [10]. Then, the Reynolds number of the annular slit flow between the pipe and the piped carriage can be calculated as follows.
Re a = ( 1 k ) D p ν v a
where ν is the kinematic viscosity, ν   = 0.01775 1 + 0.0337 t + 0.000221 t 2 ; t is the water temperature.
After calculating Rea, the value of λa can be obtained by looking up the Moody diagram or by calculating the following formula [37]:
1 λ a = 1.14 2 lg ( Δ d + 21.25 Re a 0.9 )
The applicable conditions of the formula are 10−6 ≤ ∆/d ≤ 10−2, 5 × 10³ ≤ Rea ≤ 108, in which ∆ is the equivalent roughness of the pipe, the value of plexiglass is 0.005, Dc is the diameter of the pipe, 100 mm, so the relative roughness ∆/Dc is 5 × 10⁻⁵.

3. Methods

3.1. Model Setup in COMSOL Multiphysics

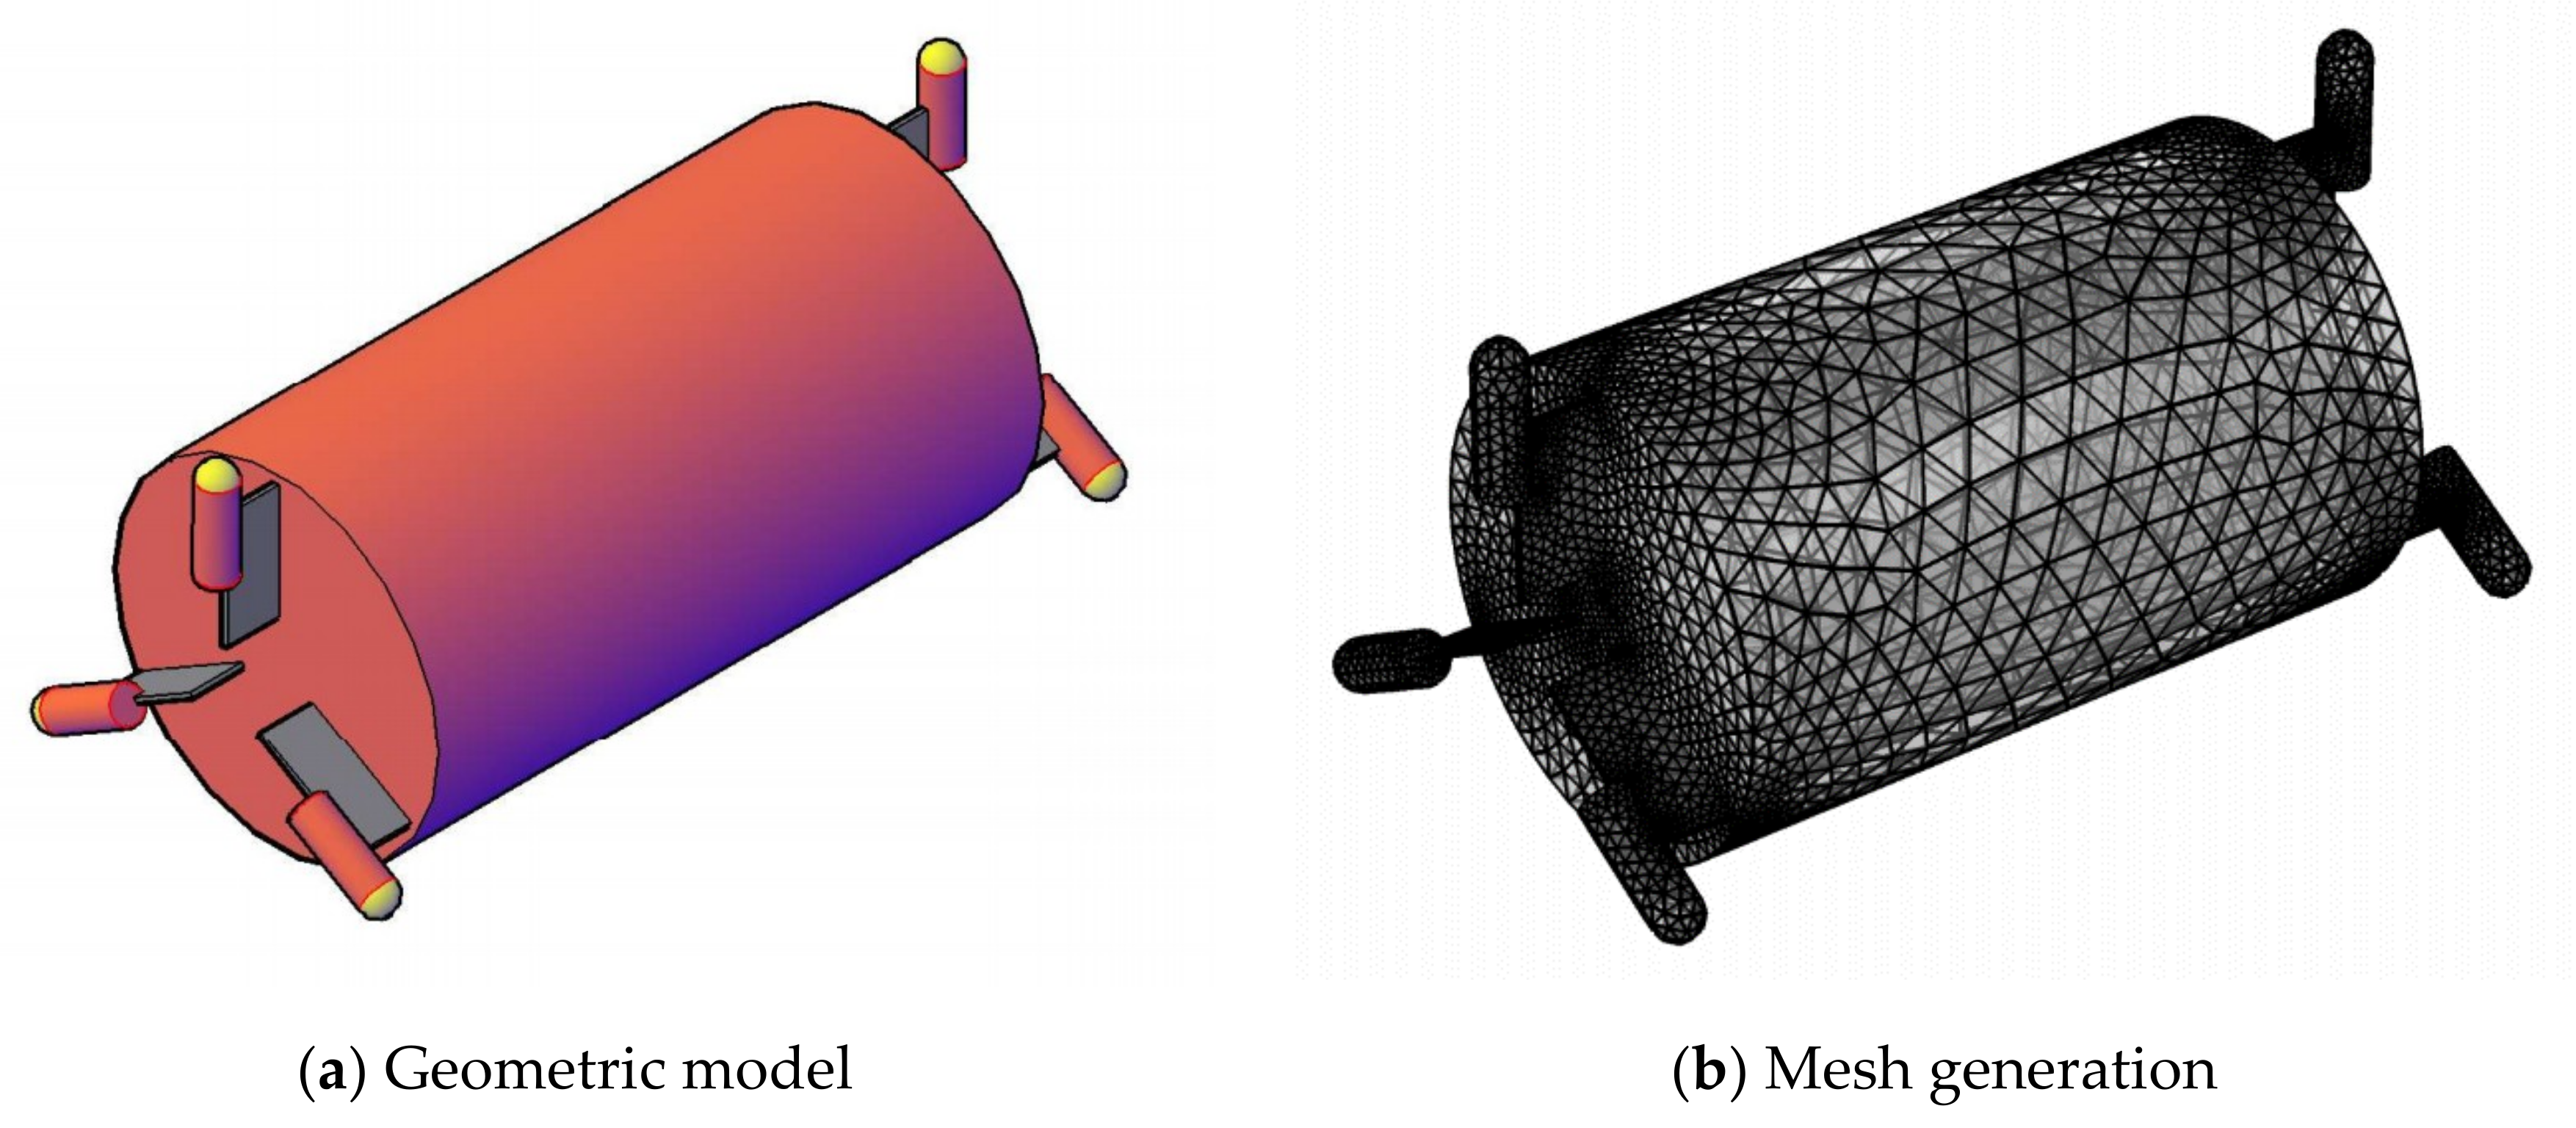
The geometric model of pipe and piped carriage was built by AutoCAD2007 software. The model size was consistent with the specific size of the model experiment. The inner diameter of the pipe was 100 mm. According to the results of model experiment, the pipe length was 150 mm from the rear-end of piped carriage and 1000 mm from the front-end of piped carriage. Four sizes had been selected for the model of the piped carriage. The specific parameters were shown in Table 1. The material of the cylinder is plexiglass with a thickness of 5 mm. There were cylinder plugs with a thickness of 10 mm at both ends of the cylinder. The material of the plugs was also made of plexiglass. The cylinder and plugs were sealed by internal and external threads. The outer part of the plug was a cylindrical support connected by a support and a metal connector. The model simplified the support and the metal connector, and retained only part of the metal connector, as shown in Figure 3a. The thickness of the connector was 2 mm and the length and width were 15 mm and 28 mm, respectively. Its material is stainless steel. The quasi-cylindrical support foot consisted of a cylinder and a hemisphere. The diameter of the cylinder and the hemisphere was 8 mm, and the length of the cylinder was 20 mm. The material of the quasi-cylindrical foot was also stainless steel. The geometric model built by AutoCAD2007 software was imported into COMSOL Multiphysics 5.4. The absolute import tolerance is 1 × 10⁻⁵. Finally, a consortium was formed.
The pipe flow through the piped carriage is a fully developed turbulence, and the Reynolds number is more than 1 × 10⁵. Therefore, the high Reynolds model, i.e., the standard k-ε model, was used for the fluid calculation. The parameters of the standard k-ε model have been checked by the pipe flow test, and the calculation of turbulence in the pipe flow has good stability and reasonable accuracy. For the near-wall region, the turbulent boundary layer is very thin and the gradient of the variables is very large. The standard k-ε model is no longer applicable. In this article, the standard wall function method was used to solve the variables near the outer wall of the piped carriage and the inner wall of the pipe.

3.2. Definitions

3.2.1. Fluid Properties

The pipe flow belongs to viscous incompressible Newtonian fluid, its state is described by the velocity and pressure fields uf, pf. The continuity equation and the Reynolds time-averaged Navier-Stokes momentum equation can be expressed respectively as [33,38]:
ρ f ( u f ) = 0
ρ f ( u f ) u f = [ p f I + K ] + F
where ρf is the fluid density, I is the unit diagonal matrix, F is the volume force. = i x + j y + k z is a Hamiltonian differential operator, K = ( μ + μ T ) ( u f + ( u f ) T ) .
According to the fluid characteristics of water flowing through the piped carriage, the standard k-ε model was chosen to simulate. Some hypotheses were considered: The steady and incompressible fluid, regardless of heat exchange, ignored the influence of gravity on the pipe flow. The equations of the turbulent kinetic energy (k) and the dissipation rate of turbulent energy (ε) are as follows [38,39]. The turbulent eddy viscosity, μt, is estimated using the Boussinesq approximation.
The equations of the turbulent kinetic energy:
ρ f ( u f ) k = [ ( μ + μ T σ k ) k ] + P k ρ ε
The dissipation rate of turbulent energy:
ρ f ( u f ) ε = [ ( μ + μ T σ ε ) ε ] + C ε 1 ε k P k C ε 2 ρ f ε 2 k ,   ε = e p
Turbulent viscosity:
μ T = ρ C μ k 2 ε
where Pk is a term of turbulent kinetic energy k caused by the mean velocity gradient, P k = μ T [ u f ( u f + ( u f ) T ) ] ; σk and σε are Prandtl numbers corresponding to turbulent kinetic energy k and the dissipation rate ε, respectively. Cε2 = 1.92, Cε1 = 1.44, Cμ = 0.09, σk = 1, σε = 1.3.
In the inner wall of the pipe and the outer wall of the piped carriage, the influence of flow conditions on the wall is obvious, and the standard k-ε model is no longer suitable in this region. For this region, the wall function method was used to solve the problem. The semi-empirical formula was used to link the physical quantities on the wall with the solving variables in the turbulent core region [40]. In order to establish the wall function, two dimensionless parameters u+ and y+ were used to represent the velocity and distance, respectively. u+ = uf/uτ, y+ = ∆fuτ/μ = ∆y/ν × (τw/ρf)1/2 where uf represents the average velocity of water flow, uτ represents the wall friction velocity, uτ = (τw/ρf)1/2, τw represents the wall shear stress, and ∆y represents the distance from the wall.
(1) Variable uf
When the control volume node adjacent to the wall satisfies y+ > 11.63 and the flow is in the logarithmic law layer, the velocity u+ can be calculated according to Equation (17), i.e.,
u + = 1 κ ln ( E y + )
The distance y+ is given by:
y + = Δ y ( C μ 1 / 4 k 1 / 2 ) / μ
Then, the wall shear stress should satisfy the following relationship:
τ w = ρ f C μ 1 / 4 k 1 / 2 u f / u +
where uf denotes the time-averaged velocity of the node, k denotes the turbulent kinetic energy of the node, ∆y denotes the distance from the node to the wall, and μ denotes the dynamic viscosity of the flow.
When y+ < 11.63, the flow is in the viscous layer, and the velocity is linearly distributed along the normal direction of the wall.
u + = y +
(2) k and ε
In the k-ε model, the k equation is solved on all computational domains including the control volume adjacent to the wall. The boundary condition of turbulent kinetic energy k on the wall is k n = 0 , where n represents the local coordinates perpendicular to the wall. In the control volume adjacent to the wall, according to the local equilibrium assumption, the turbulent kinetic energy generation terms Gk and ε are equal.
G k τ w k n = τ w τ w κ ρ f C μ 1 / 4 k 1 / 2 Δ y
ε = C μ 3 / 4 k 3 / 2 κ Δ y

3.2.2. Structure Properties

The structure is plexiglass and compressible. The conservation equation of the structural domain can be derived from Newton’s second law [40]:
σ s + f s = ρ s d ¨ s
where ρs is solid density and σs is the Cauchy stress tensor which is related to the second Piola–Kirchhoff stress as: σs = J−1FSFT, where F(F = I + ∇us) is the deformation gradient tensor and J = det(F). S is the second Piola–Kirchhoff stress tensor, S = λs(trE)I + 2μsE, E = (FTFI)/2. Lamé coefficients λs and µs can be calculated by Formulas (24) and (25). fs is the volume force vector and d ¨ s is the local acceleration vector in the structural domain. In this study, the piped carriage is in a static state, so d ¨ s = 0 .
μ s = E 2 ( 1 + ν s )
λ s = ν s E ( 1 + ν s ) ( 1 2 ν s )
where E and νs are Young’s modulus and Poisson’s ratio of organic glass respectively. The specific values are shown in Table 1.

3.2.3. Interaction Conditions

The fluid-solid coupling follows the basic conservation principle and meets the kinematic conditions (also called displacement coordination) df = ds and dynamic conditions (also known as force balance) n τ f = n τ s on the cylinder wall of the piped carriage. df and ds represent the displacement of the pipe flow and the piped carriage respectively. The piped carriage is in a static state, so df = ds = 0. τf and τs represent the stress of the pipe flow and the wall of the piped carriage respectively.
The model of the stationary piped carriage in the straight pipe flow belongs to the steady state, and the position of the fluid nodes on the coupling interface is determined by kinematic conditions. Therefore, the velocity of the pipe flow at the coupling interface is zero. The flow distribution force on the coupling interface is integrated into a concentrated force applied on the structural nodes according to Formula (26).
F ( t ) = h d τ f d S
where hd is the displacement of the structural point.

3.3. Boundary Conditions

The no-slip condition was applied at the wall boundary, where the velocity near the piped carriage wall is considered zero.
The boundary condition of the entrance was set as velocity, which is described by the velocity field u0(u(y,z), 0, 0). u(y,z) defines its exponential velocity distribution by the measured velocity at the inlet section. u ( y , z ) = u p ( ( 0.05 y 2 + z 2 ) / 0.05 ) 1 8 [26], where up is the average velocity of the section in the pipe flow. The turbulence length scale LT and the turbulence intensity IT were obtained using Equations (27) and (28) respectively.
k = 3 2 ( u I T ) 2
ε = C μ 3 4 k 3 2 L T
The outlet boundary was set as a pressure condition, and its value can be set arbitrarily in the incompressible case. In the compressible structure case, this can affect the stress, thus affecting the deformation of the solid [41]. In this proposal, the reference pressure was set at the outlet of the flow to zero [42,43], and the reflux was suppressed.

3.4. Finite Elements Mesh

In order to realize the irrelevance of the grid, the density of the grid was gradually increased. Under the condition of the discharge was 50 m3·h−1 in the pipe, the influence of different grid sizes on the principal stress of the middle cylinder wall of the stationary piped carriage in the straight pipe was compared until the difference was less than 3%. Therefore, a reasonable grid size was selected. The different subregion densities were used to reduce the computation and simulation time. The pipe flow was gridded with the maximum unit size of 5 mm. The piped carriage was gridded with the maximum unit size of 2 mm. The number of layers for boundary layer was set to 5, the thickness of the first layer grid was set to 0.005 mm, and the scale factor between layers was set to 1.2. The final model consisted of 1,245,910~1,752,472 elements.

4. Experimental Setup and Conditions

Figure 4 is the pipeline system diagram of the experiment. The pipeline system mainly consists of 5 mm thick plexiglass pipes, 15 mm thick plexiglass flanges, a water tank, a centrifugal pump, an electromagnetic flowmeter and a placement device [22,26].

4.1. Laser Doppler Velocimetry (LDV)

In order to measure the three-dimensional velocity of the annular slit flow, on the basis of the built-in coordinates of the coordinate frame, the direction along the flow direction is the X-axis, vertical to the X-axis and in the same horizontal plane is the Y-axis. According to the right-hand helix, the direction perpendicular to the horizontal plane is the Z-axis, as shown in Figure 2. During the testing program, the flow was seeded with polystyrene with an average particle size of 6 μm to increase the data collection rate for the LDV. The probe was mounted on a controllable coordinate frame, and the position of the measuring point was controlled intelligently by a computer to move it. The refraction and scattering of light were reduced by installing a square water jacket at the test position. The processor control target efficiency was 55% with a medium signal-to-noise ratio. The frequency and real-time speed of the measuring points were calculated by the software built-in program and displayed intuitively on the computer screen.

4.2. Piped Carriage Force Measuring System

The piped carriage force measuring system is a customized stress change testing system for testing the stress on the cylinder wall of the piped carriage. The test system consists of three parts: The main engine of the piped carriage force measurement system, the gateway of the piped carriage force measurement system, and the system software TSTDAS V5.0, as shown in Figure 5. The instrument has eight measurement channels. Each channel has an independent conditioning circuit and an independent 24 bits ADC, which ensures that each measurement channel has a high signal-to-noise ratio, isolation between channels and parallel synchronous acquisition of each channel. The instrument has a built-in large capacity memory, realizing the off-line collection of the pipe carriage in the pipe. The instrument adopts ZigBee wireless transmission, which facilitates the use of the system. The instrument has a built-in lithium battery, which solves the power supply problem of field work. The instrument has an intuitive working state indication. The instrument is built into a piped carriage with a measurement range of ±15,000 με, a resolution of 1 με, and a measurement accuracy of ±0.3% FS ± 1 με. The sampling frequency of each channel is 256 HZ.
The force measuring system was placed in the piped carriage and connected with the right angle strain flower fixed on the cylinder of the piped carriage. The type of right-angled strain flower used in the test is BX120-3CA, the resistance value is 119.8 ± 0.3 Ω, and the sensitivity is 2.08 ± 1%. The optimum position of the patch with right-angled strain flower was determined by the optimization method [44]. The location datum of the patch was the midpoint of the 45° patch, and the piece was parallel to the axis of the piped carriage, as shown in Figure 5. This patch positioning scheme can minimize the inherent measurement error of the right-angled strain flower.

4.3. Selection of Cross Section and Layout of Measurement Points

The piped carriage was located 5.5 m away from the braking device and 6.0 m away from the entrance of the bend pipe, which satisfied the steady flow condition [45,46].

4.3.1. The Layout of Measuring Points in LDV Measuring Flow Field Near the Cylinder Wall of Piped Carriage

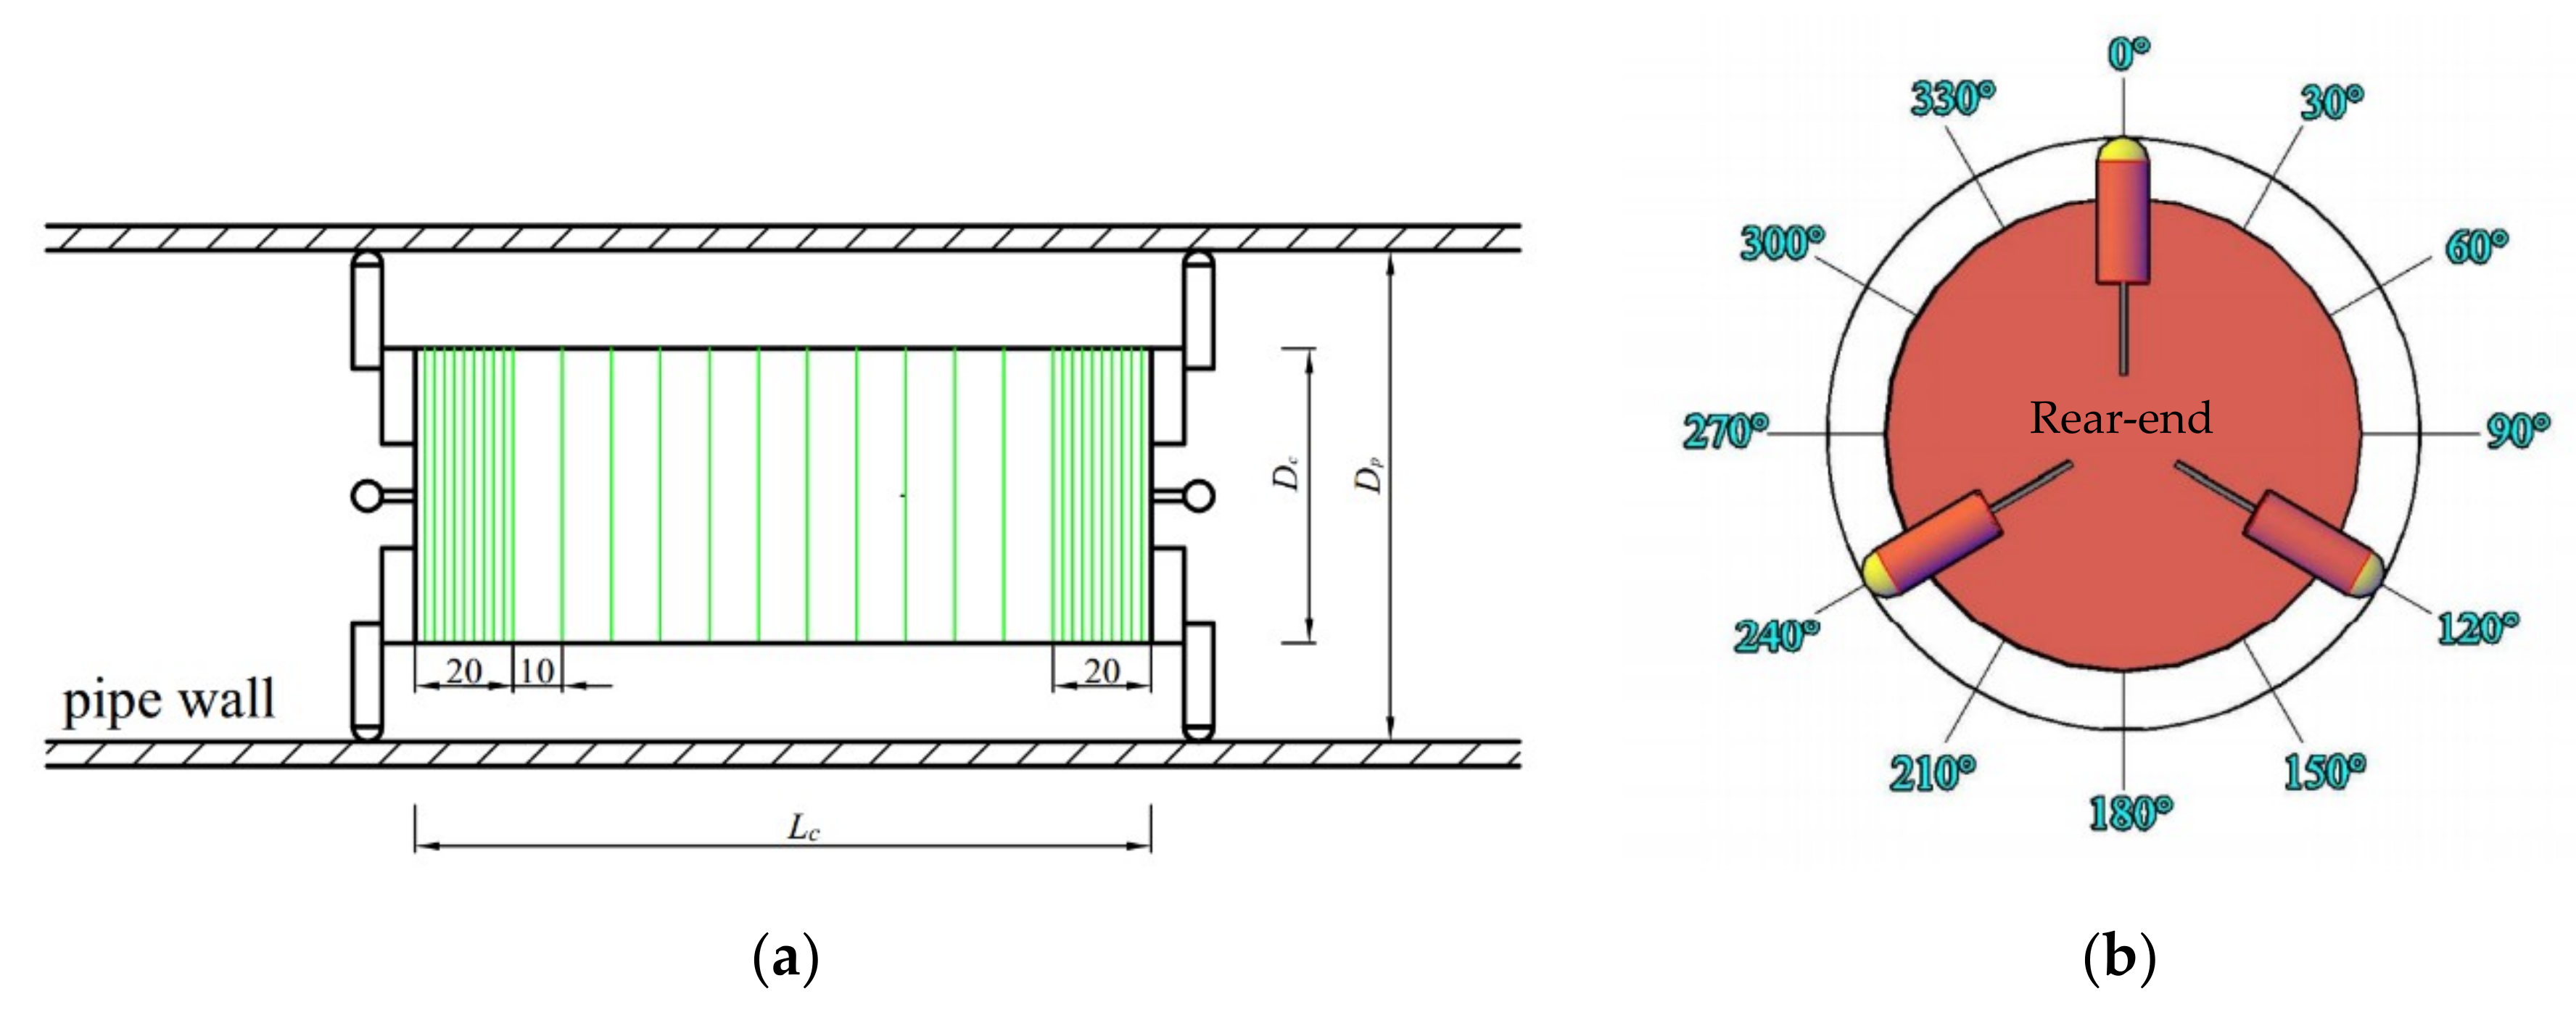
Thirty-two test sections were arranged along the direction of the water flow into the piped carriage. Within 20 cm of the front and rear ends of the cylinder, one test section was arranged every 2 mm, and one test section was arranged every 10 mm in the middle section, as shown in Figure 6a. Each test section was equipped with a measuring point every 30° along the body radius direction. The top of the cylinder of the piped carriage was defined as 0°. Twelve measuring points were arranged clockwise along the flow direction in each test section, as shown in Figure 6b. There were 384 measuring points around the cylinder of the piped carriage. Each measuring point was 0.1 mm away from the cylinder wall of the piped carriage.

4.3.2. The Layout of Measuring Points in Measuring the Principal Stress by Pipeline Force Measuring System

Influenced by the number of channels and the size of right-angled strain flower, six test sections were arranged on the cylinder wall of the piped carriage. The layout of the measuring points of each test section was the same as that of the flow field. Therefore, there were 72 measuring points in the cylinder wall of the piped carriage.

4.4. Design of Conditions

The wall stress distribution of the piped carriage in the pipe flow is of great significance to the hydraulic transportation of the piped carriage, especially in the selection of material for the cylinder of the piped carriage. Four flow conditions and four sizes of the piped carriage were selected. The material of the cylinder is plexiglass. The Young’s modulus E and Poisson’s ratio of plexiglass νs were measured by the nanoindentation testing system of Nano Indenter G-2000. The relevant flow parameters were summarized in Table 1.

5. Validation of Simulated Results

In order to verify the reliability of the numerical simulation, the simulation results were verified by experiment results on the axial velocity of the water flow 1 mm away from the cylinder wall of the piped carriage and the distribution of principal stress on the cylinder wall of the piped carriage. The validation experiment was carried out on the piped carriage of Dc × Lc = 80 mm × 150 mm with discharge of 30 m3·h−1 in pipe. Due to the existence of the support feet of the piped carriage, the distribution of the flow field around the cylinder of the piped carriage and the distribution of the principal stress on the cylinder wall of the piped carriage were symmetrical with respect to the Z axis, so only the cases of 0~150° were listed. In the horizontal coordinates of Figure 7 and Figure 8, 0 mm corresponded to the rear-end and 150 mm corresponded to the front-end of the cylinder.

5.1. Velocity Distribution

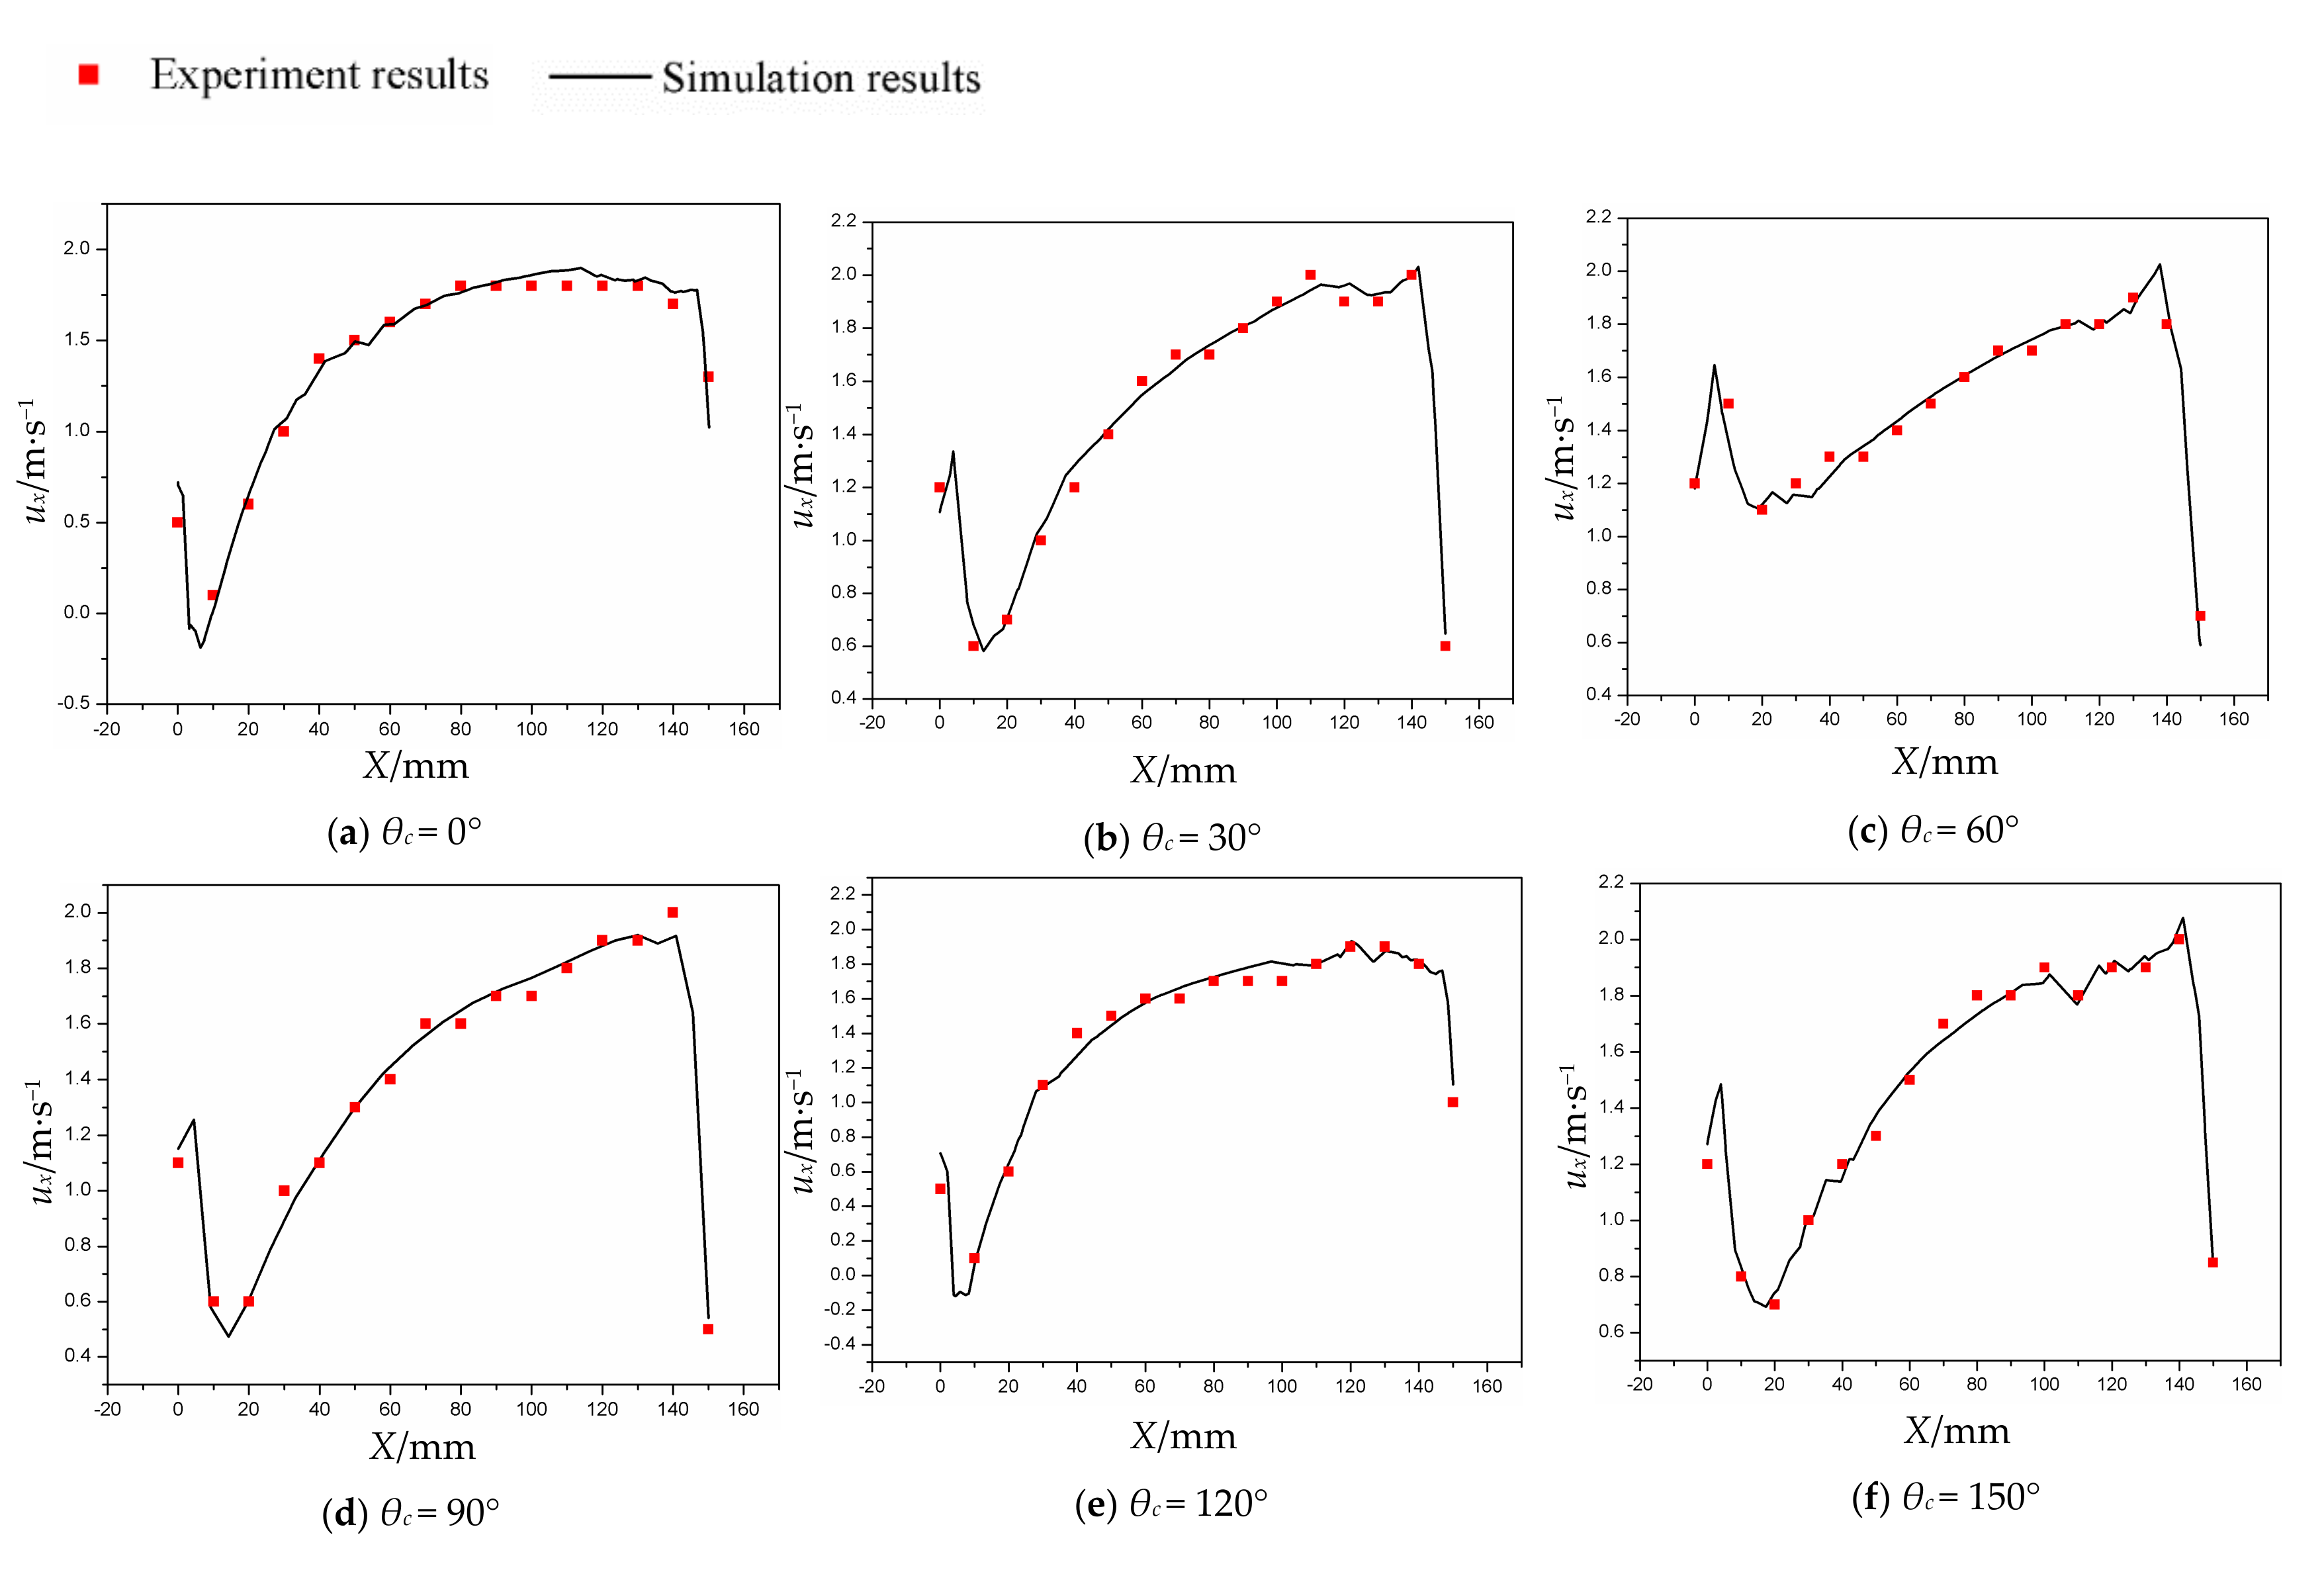
Figure 7 showed a comparison between the experimental and simulated values of the axial velocity of water flow at a distance of 1 mm from the cylinder wall of the stationary piped carriage in a horizontal pipe flow. As shown in Figure 7, the simulation results were in good agreement with the experiment results. The maximum relative error did not exceed 8.21%. The value and distribution of the axial velocity of the flow near the cylinder wall of the piped carriage had a great influence on the value and distribution of the shear stress on the cylinder wall of the piped carriage.
Figure 7a,e showed the distribution of the axial velocity at the positions of 0° and 120°. This position was just between the two support feet of the front and rear ends of the piped carriage. Due to the influence of the support feet of the piped carriage, the axial velocity showed a characteristic distribution whose profile is like the roman character “n”. The minimum value of axial velocity occurred at the position of 2–12 mm from the rear-end, and its value was almost zero. When θ was equal to 0°, that is the top position of the cylinder, the maximum value appeared near the 110 mm of the cylinder. When θ was equal to 150°, the maximum axial velocity on the cylinder wall was slightly delayed, which was approximately 120 mm.
Figure 7b,d,f showed the axial velocity at 30°, 90° and 150° respectively, all these curves showed a “M” changing trend. This is mainly because the three angles were located close to the support feet, so the distribution of axial velocity was similar. The two peaks occurred at the positions of 5 mm and 140 mm of the cylinder respectively, and the maximum axial velocity was at the position of 140 mm. The minimum axial velocity appeared near the 12 mm. The axial velocity decreased slightly before the maximum value appeared, and the location was approximately the same.
Figure 7c was the distribution of the axial velocity on the cylinder wall when the θ was 60°. This position was located in the middle of the two groups support feet, and it was also the position where the support feet of the piped carriage had the least influence on the axial velocity. It was similar to the distribution of the axial velocity at the positions of the θ = 30°, θ = 90° and θ = 150°, and also showed a M distribution. The location of the maximum and minimum values was also approximately the same. The ratio of the two peaks at θ = 60° was approximately 0.7, while the ratio of the two peaks at θ = 30°, θ = 90° and θ = 150° was approximately 0.5.

5.2. The Circumferential Component of the Principal Stress

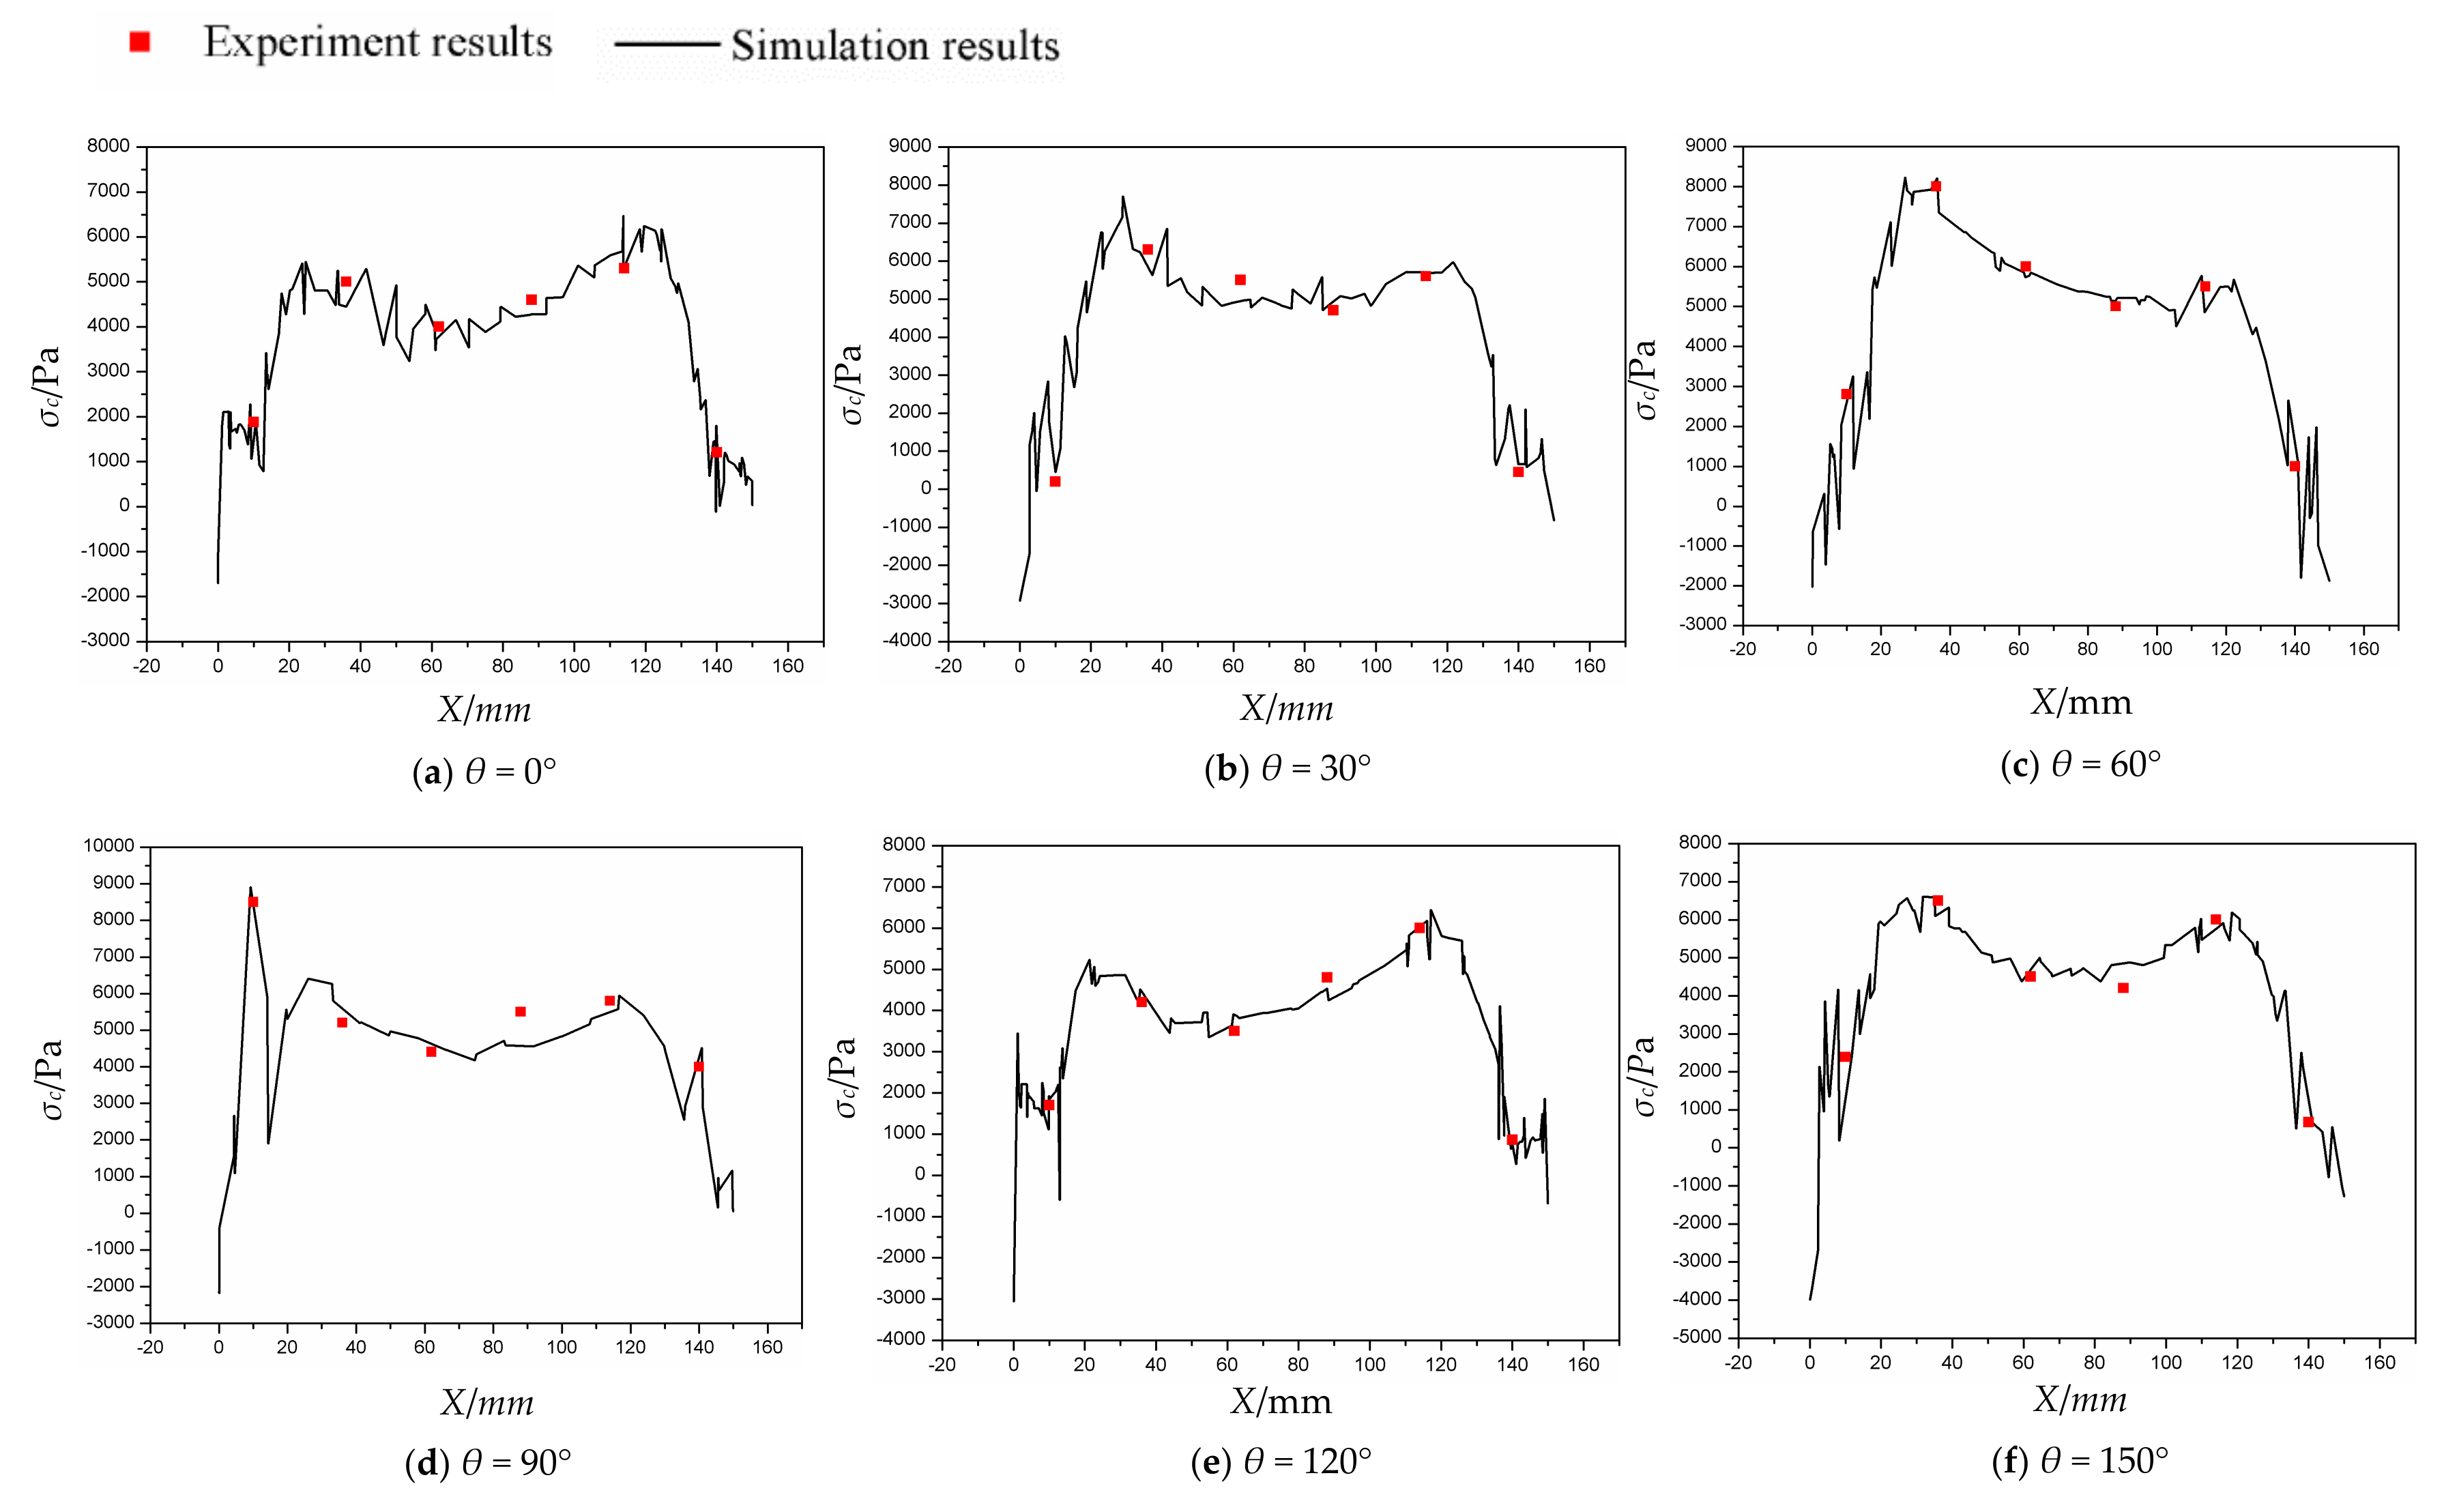
Figure 8 showed the comparison between the simulation and experimental values of the circumferential component of the principal stress on the cylinder wall of the piped carriage (0~150°). It can be seen from the figure that the simulated and experimental values of the circumferential component of the principal stress on the cylinder wall of the piped carriage were basically the same, and the maximum relative error was less than 9.80%. Figure 8a,e were the distributions of the circumferential components of the principal stress on the cylinder wall between the two support feet of the piped carriage, i.e., θ = 0° and θ = 120°. The distributions were similar. The maximum value appeared near the location of 125 mm of the cylinder. Its value was approximately 6000 Pa. The circumferential component of the principal stress at the front and rear ends of the cylinder was smaller, and its value was approximately 1000 Pa. The circumferential component of the principal stress in the middle of the cylinder decreased slightly. On the whole, the circumferential component of the principal stress on the cylinder wall presented M distribution. Except for the location of the θ = 90°, the maximum circumferential component of the principal stress on the cylinder wall appeared near the 30mm position. The maximum value was approximately 8000 Pa, and the minimum value also appeared at both ends of the cylinder. Figure 8d was the distribution of the circumferential component of the wall principal stress when the θ = 90°. The maximum value of the circumferential component appeared near the location of 10 mm, and the maximum value was approximately 9000 Pa. It was also the maximum value of the whole cylinder wall under this condition.

6. Results and Discussion

6.1. Velocity Distributions

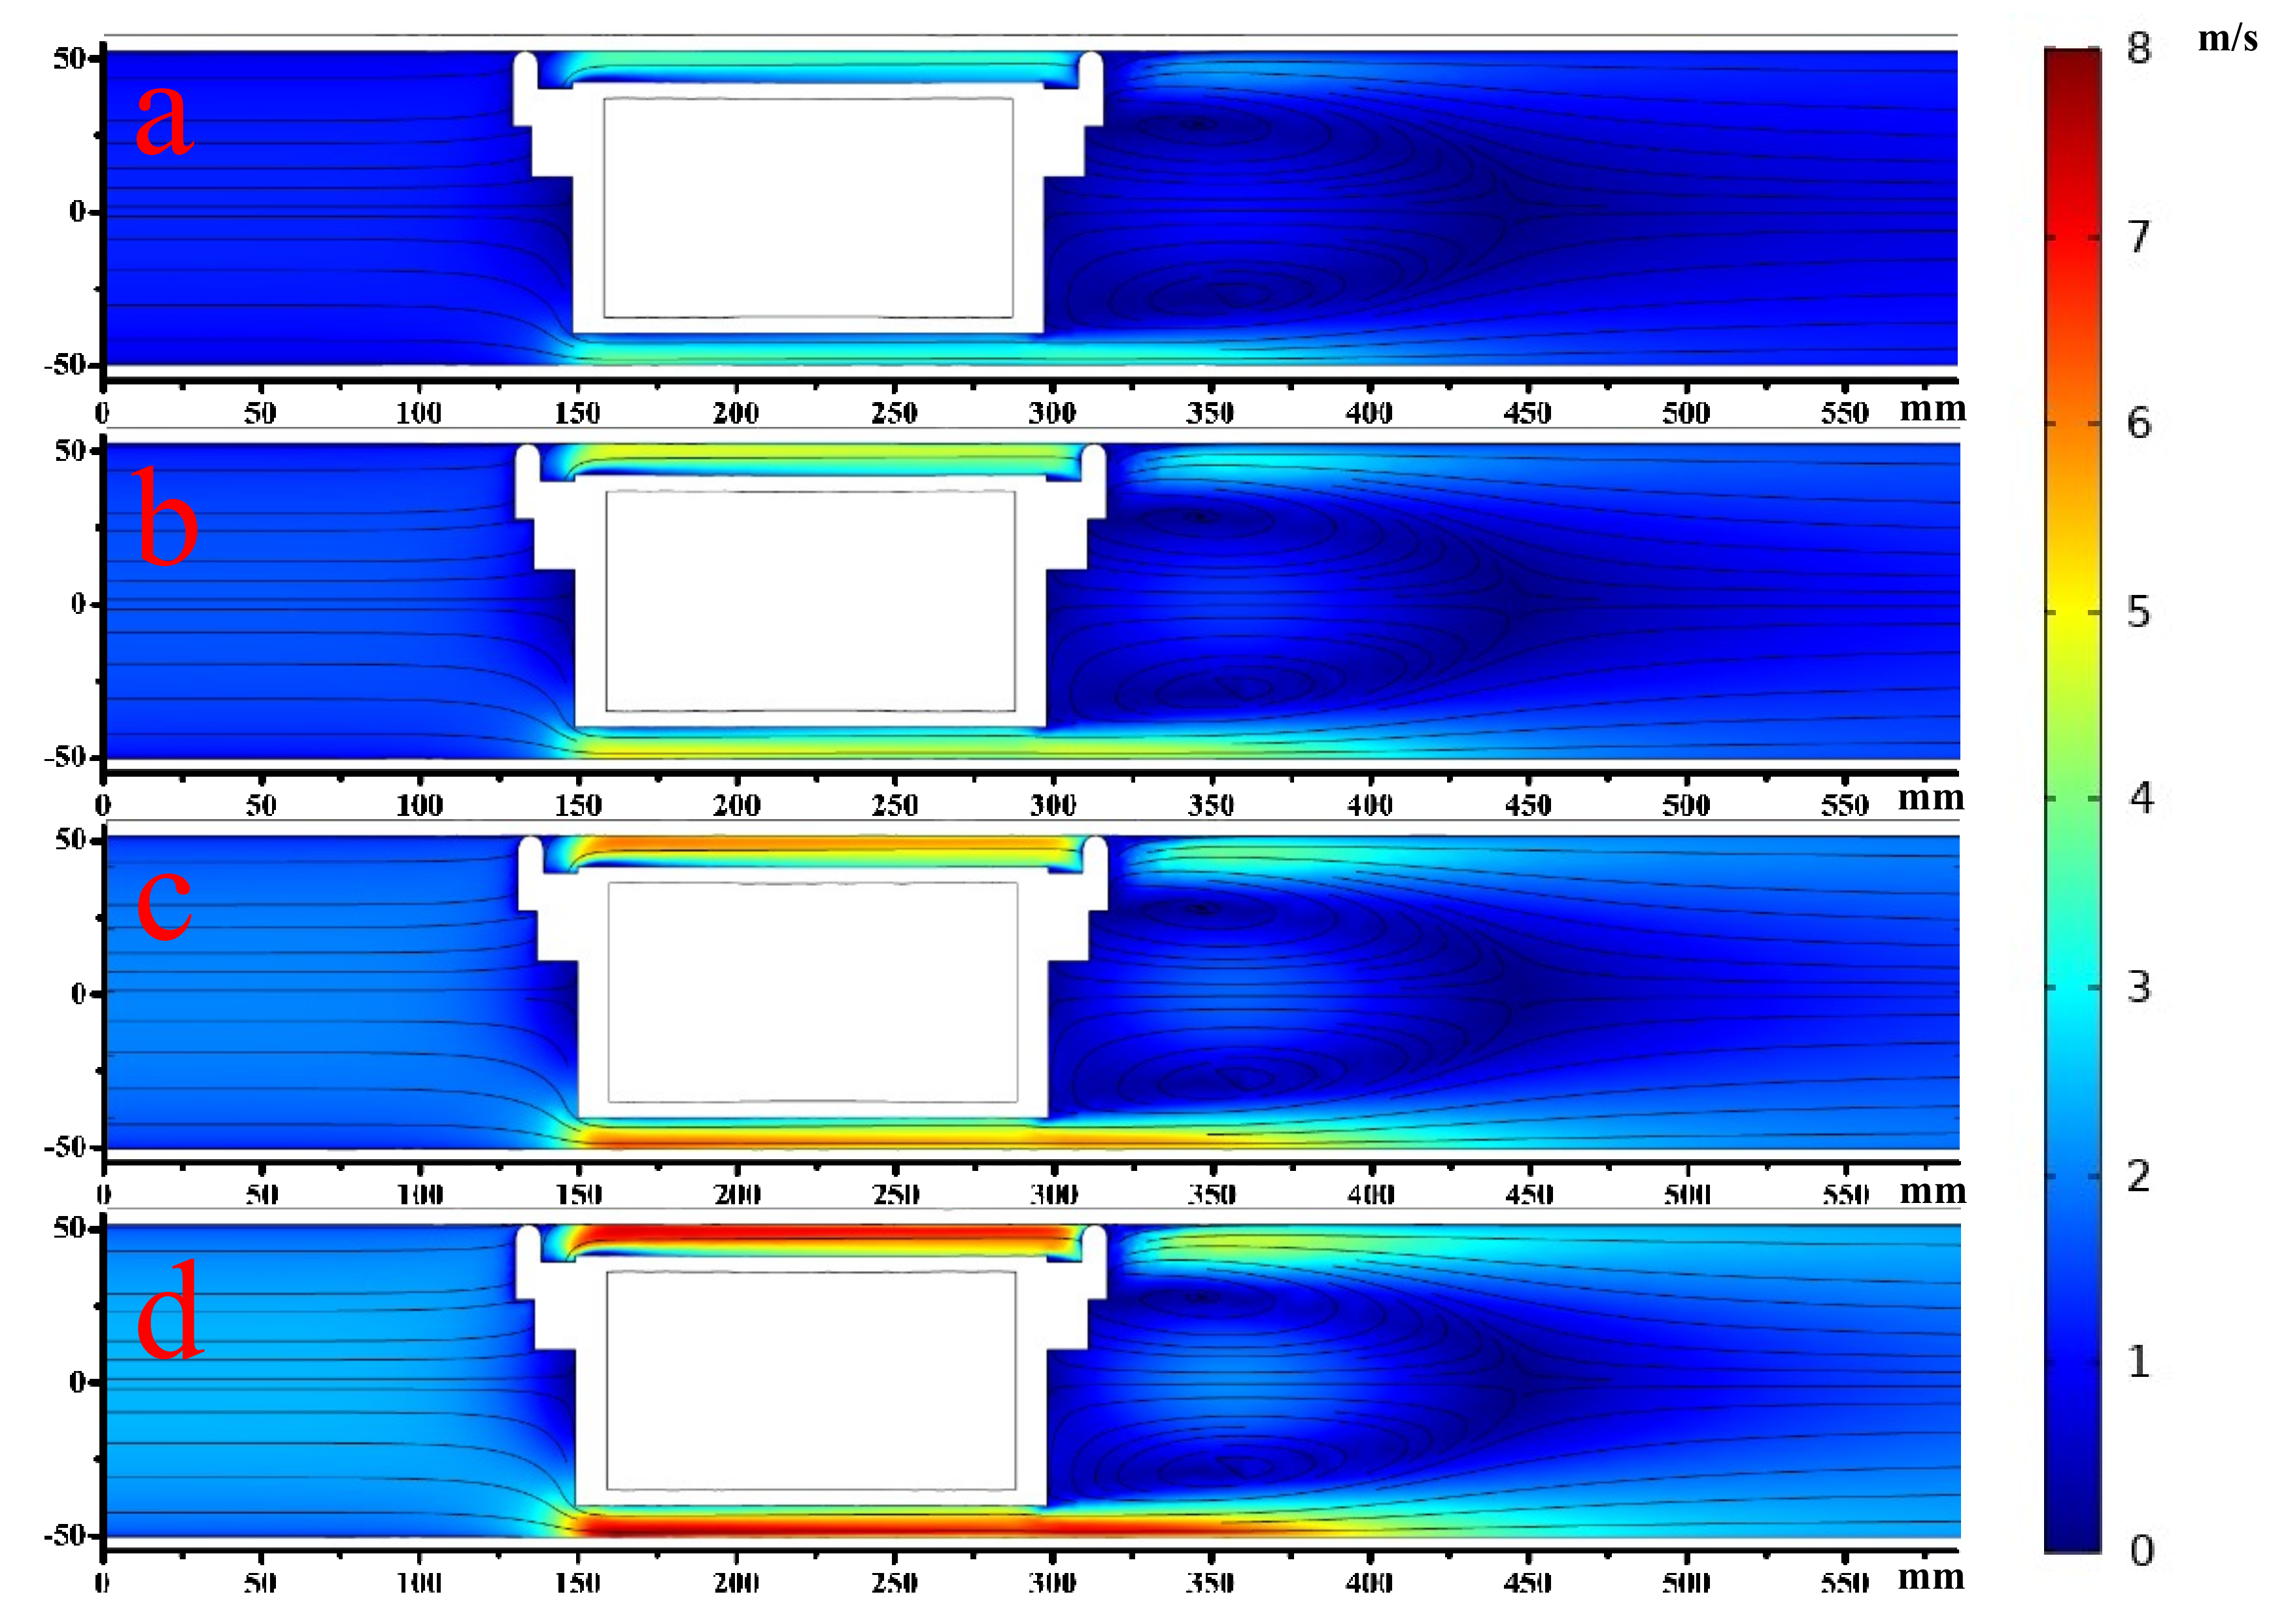
Figure 9 showed the velocity distribution cloud of the XZ plane of the piped carriage Dc × Lc = 80 mm × 150 mm at a different discharge in the pipe. The inlet of the test section was on the left, hence, the flow direction was from left to right. From the figure, it can be seen that the existence of the piped carriage made the velocity distribution of the pipe flow change greatly. As compared to a single phase flow where it is known, the velocity distribution of the pipe flow is logarithmic, and the streamline is parallel to the pipe axis [47]. There was a vortex region (often called wake vortex region) extending backward along the downstream direction of the piped carriage. There were symmetrical vortices in this region, and the rotation direction was different. This is because the pipe flow from the upper and lower surfaces of the piped carriage met downstream of the piped carriage, and they retained the momentum of the spreading direction. Therefore, the fluid on both sides of the interface had opposite transverse velocity components. It was also a discontinuous section of tangential velocity. In essence, it was also a vorticity surface. The axis direction of the vortices on the vortices should be perpendicular to the velocity difference, so the wake region had different rotational directions along the flow direction [48]. By comparing the flow field around the piped carriage at a different discharge in the pipe, it can be seen that with the increase of the discharge around the piped carriage, the flow velocity around the piped carriage increased gradually, especially the region between the piped carriage and the pipe. This is mainly due to the gap region of water passing between the piped carriage and the pipe, and the change of flow velocity caused by the change of the unit discharge was larger than that in other regions. In the gap region between the piped carriage and the pipe, the velocity gradient varied greatly. The velocity of the flow near the outside wall of the piped carriage and the inside wall of the pipe was very small, and the velocity of the flow in the middle position was very large. This phenomenon conformed to the theory of viscous substratum [37]. Moreover, the low velocity region near the inner wall of the pipe was smaller than that near the outer wall of the piped carriage. This is because the pipe flow in the inner wall of the pipe was mainly affected by the frictional resistance caused by the fluid viscosity, while in the outer wall of the piped carriage, the flow was not only affected by the frictional resistance, but also by the pressure difference resistance caused by the flow separation [49]. The low velocity region near the outer wall of the piped carriage and the inner wall of the pipe decreased with the increase of the discharge in the pipe.
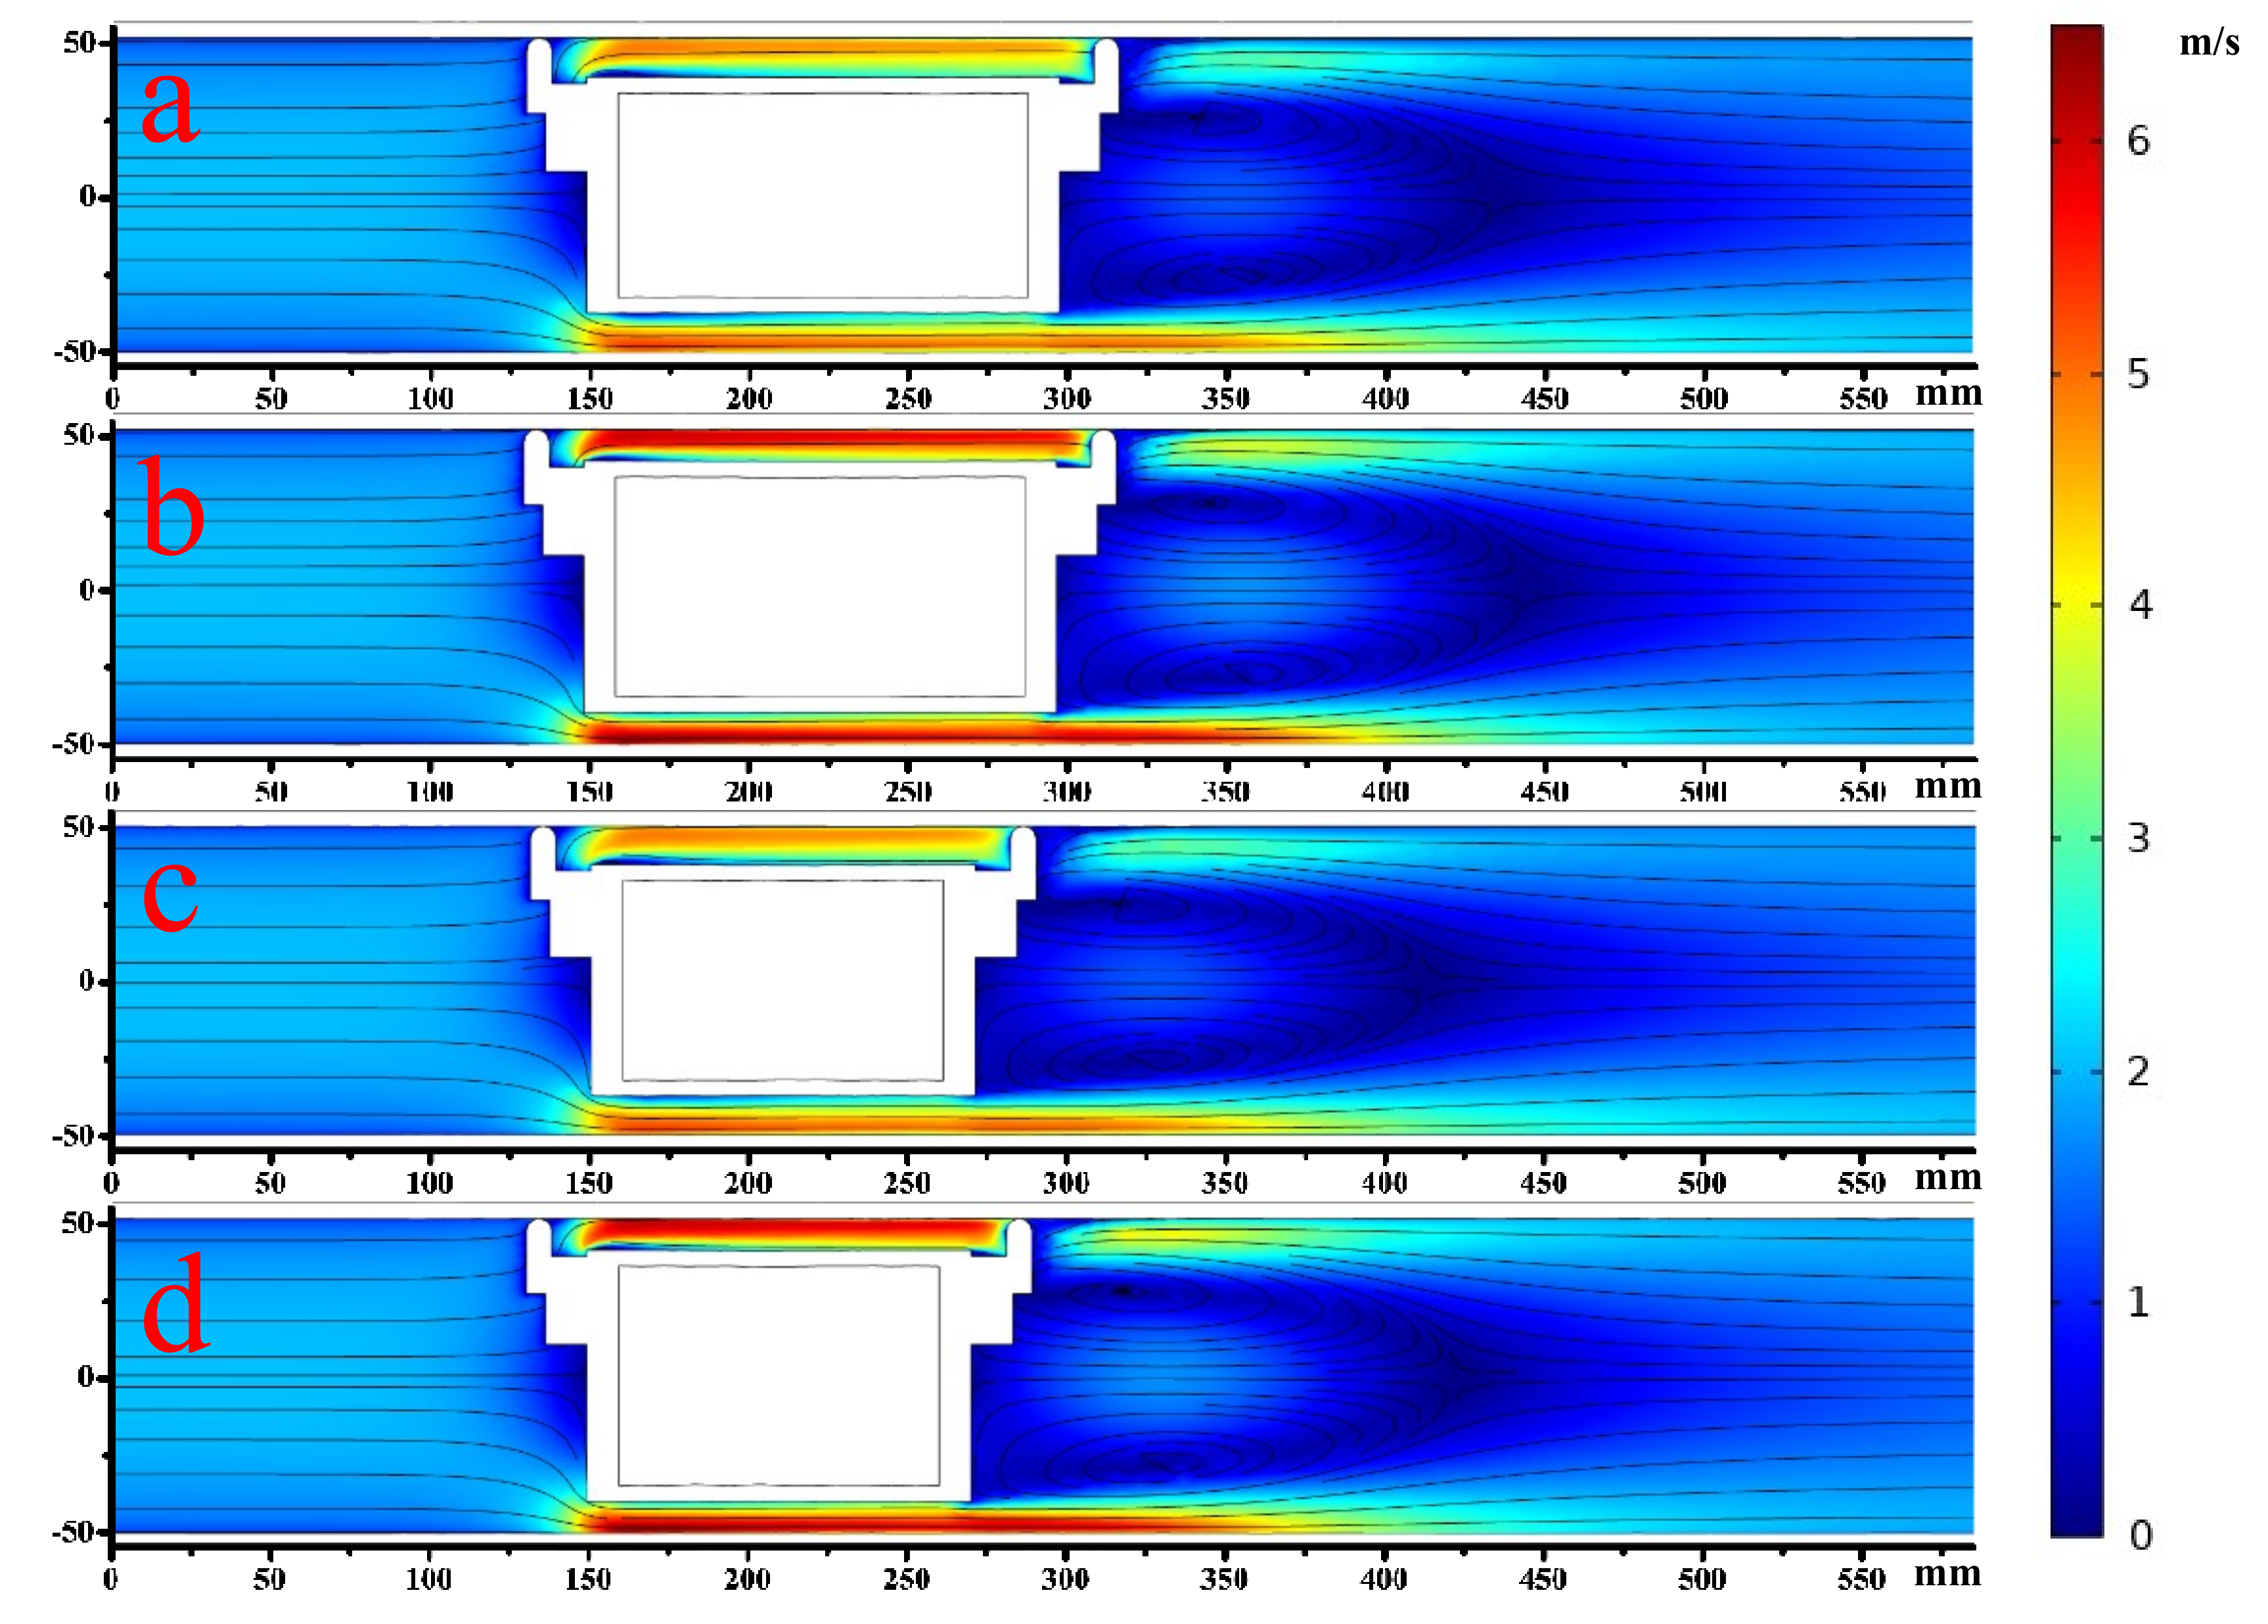
Figure 10 showed the XZ plane velocity distribution of the piped carriage with different sizes when the discharge of the pipe flow was 50 m3·h−1. By comparing the velocity distribution of different sizes of the piped carriage, it can be seen that when the length of the barrel was fixed, the bigger the diameter of the cylinder was, the greater the velocity of the flow around the piped carriage, and the longer length of the downstream wake vortex region of the piped carriage. When the diameter of the cylinder was a constant, the wake vortex region of the piped carriage was longer, but the velocity around the piped carriage did not change remarkably. Therefore, the diameter of the cylinder had greater influence on the flow field around the piped carriage than the length of the cylinder.

6.2. Wall Shear Stress Distributions

Figure 11 showed the wall shear stress distribution of the piped carriage Dc × Lc = 80 mm × 150 mm at a different discharge in the pipe. Compared the shear stress on the cylinder of the piped carriage with a different discharge in the pipe, it can be seen that the wall shear stress of the cylinder increased with the increase of the discharge in the pipe. This is because the shear stress on the cylinder wall of a piped carriage was proportional to the square of the gap velocity between the inner wall of the pipe and the outer wall of the piped carriage, as shown in Formula (9). The increase of the discharge in the pipe inevitably lead to the increase of flow velocity in this gap region, so the wall shear stress increased. The wall shear stress of the cylinder of the piped carriage was greater than zero, which showed that the wall shear stress along the direction of the pipe flow was consistent with the theoretical analysis of Section 2.2. It can also be seen from the figure that the shear stress on the cylinder wall of the piped carriage was symmetrical with respect to Z axis, and the maximum shear stress appeared in the middle and rear sections of the cylinder, and lied between the two groups of support feet, such as, between 0° and 120°. However, the wall shear stress between the front and back support feet was smaller. This is mainly affected by the support feet of the piped carriage, as shown in Figure 9, the flow velocity between the front and back support feet groups was smaller than that in other positions of the annular gap.
Figure 12 showed the distribution of shear stress on the cylinder wall of different sizes of the piped carriage when the discharge of pipe was 50 m3·h−1. The distribution of shear stress on the cylinder wall of different sizes of the piped carriage was basically the same. Compared with Figure 12a–d, it can be seen that the greater the diameter, the greater the wall shear stress. This is due to the increase of the diameter of the piped carriage, resulting in the reduction of the gap region around the piped carriage, thus increasing the flow velocity of the annular gap, and increasing the wall shear stress. However, the length of the cylinder had little effect on the wall shear stress.

6.3. Principal Stress Distributions

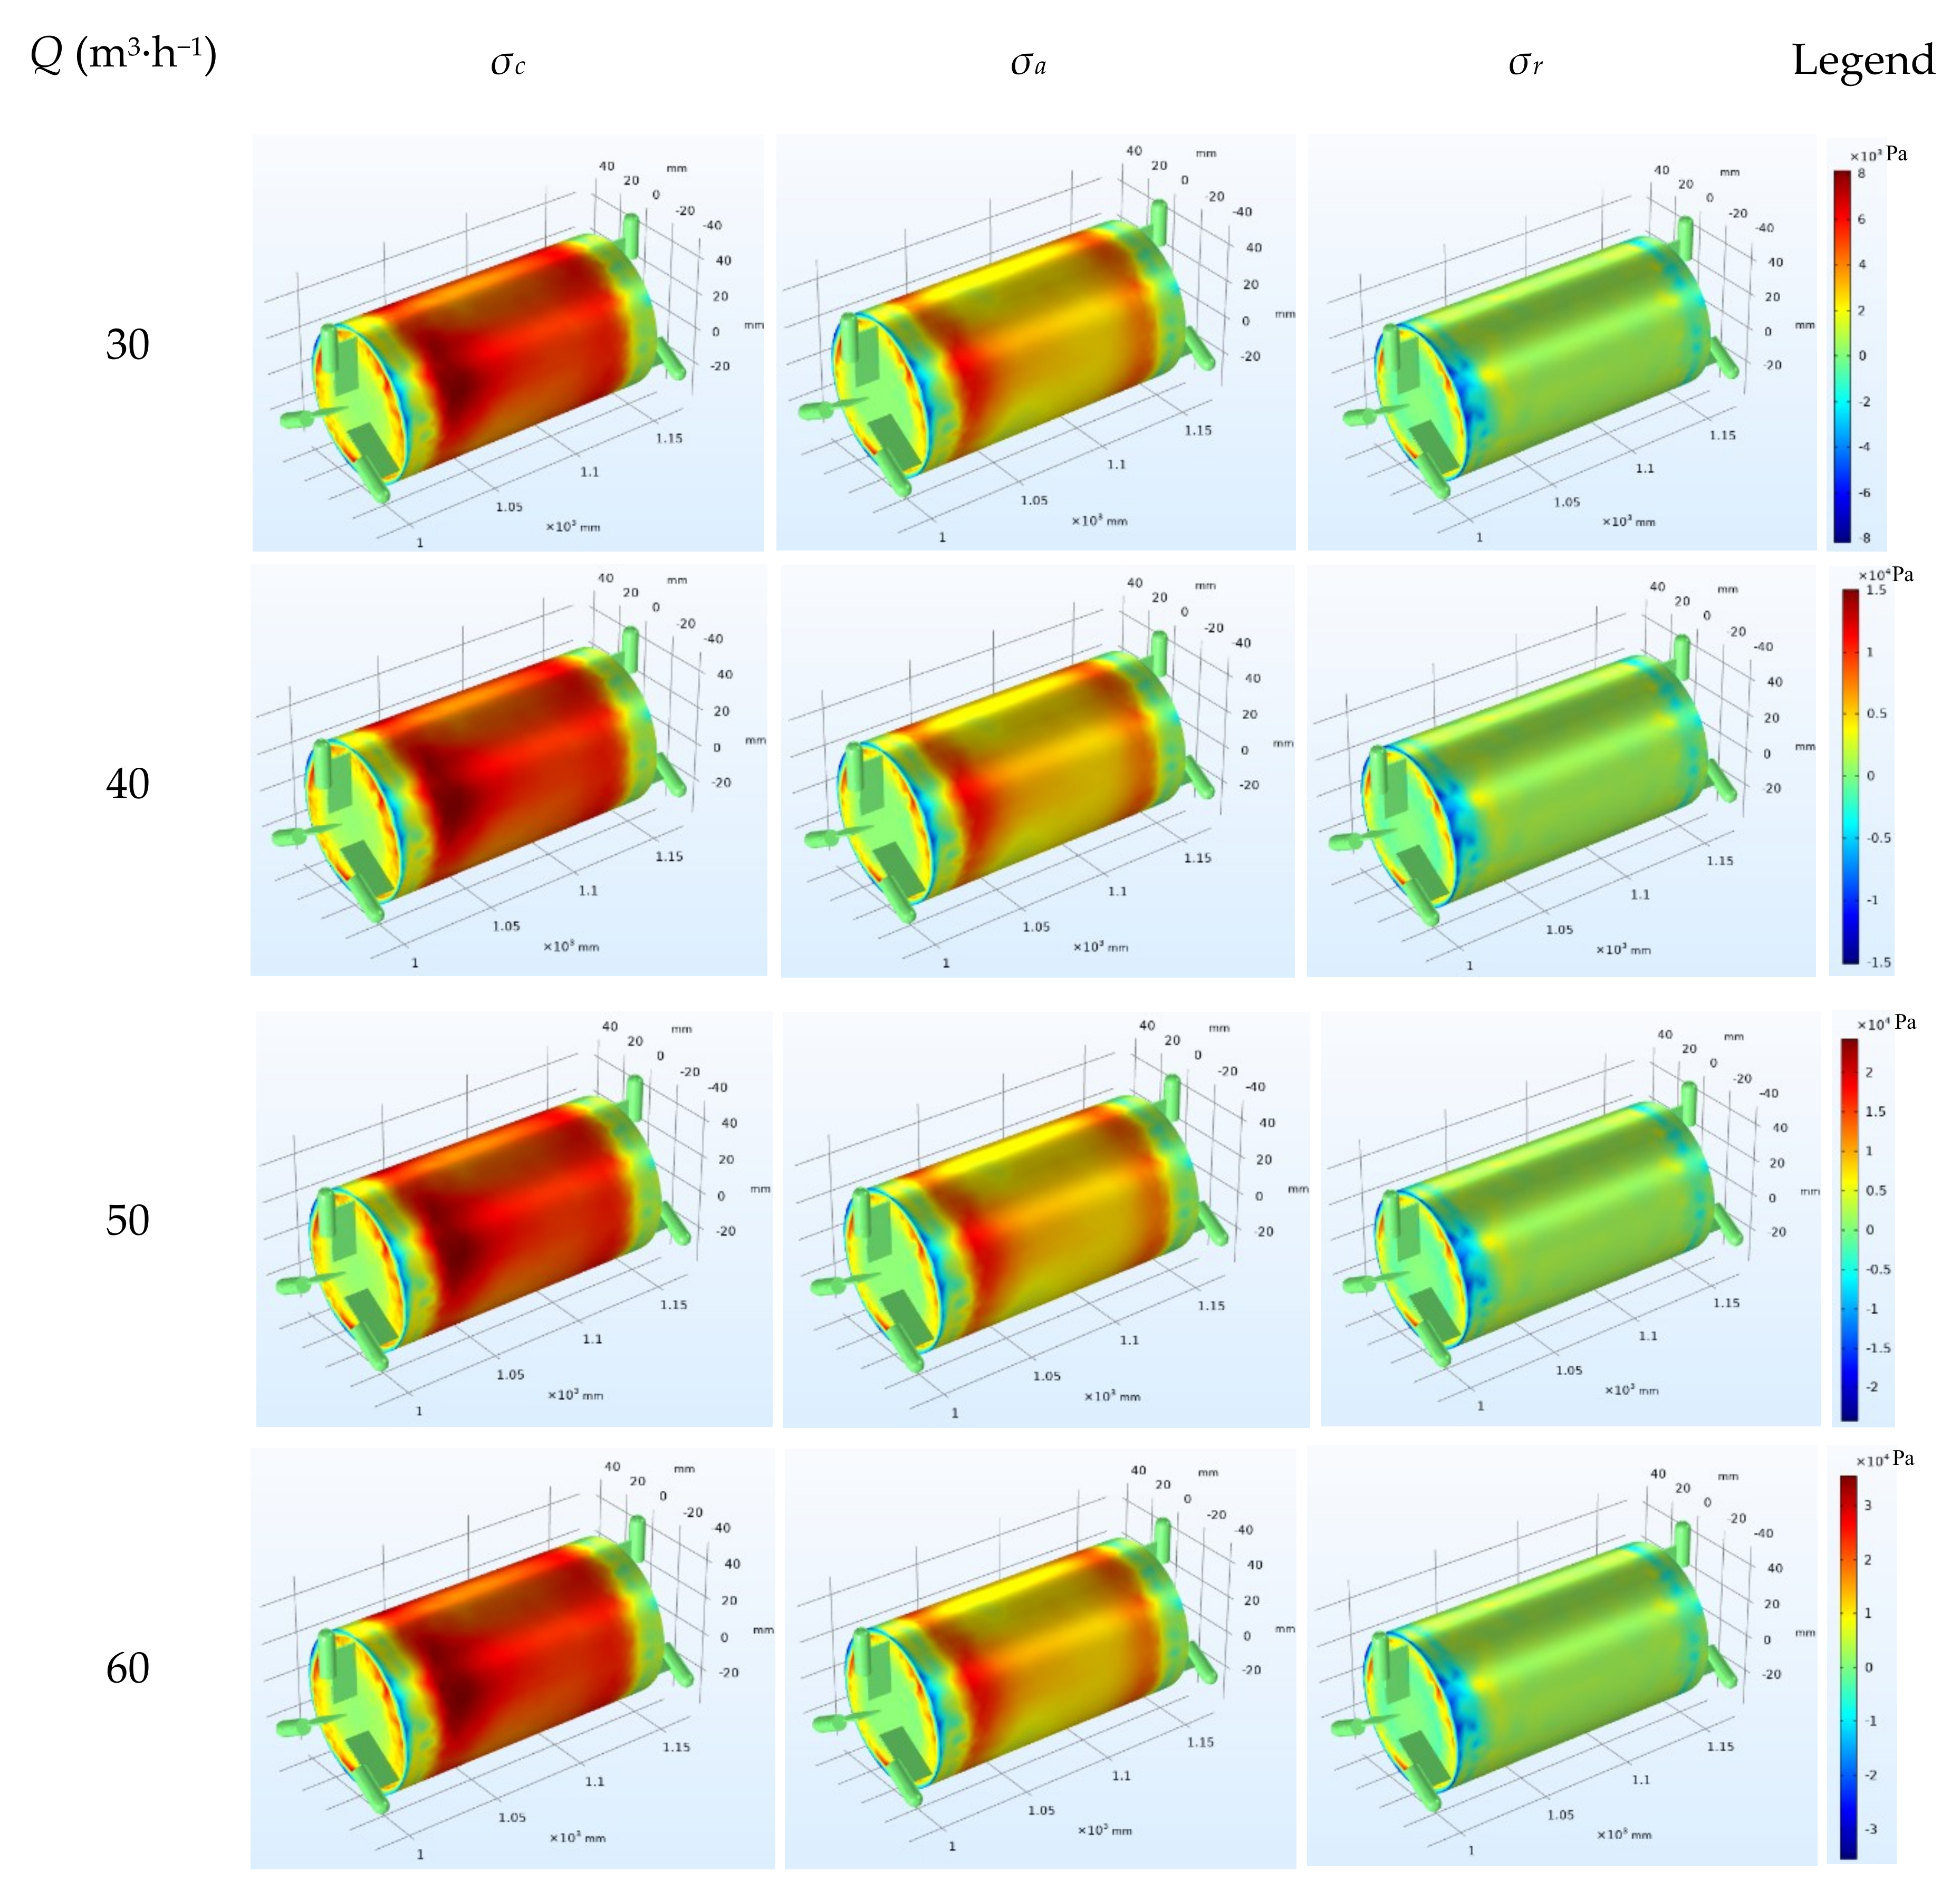
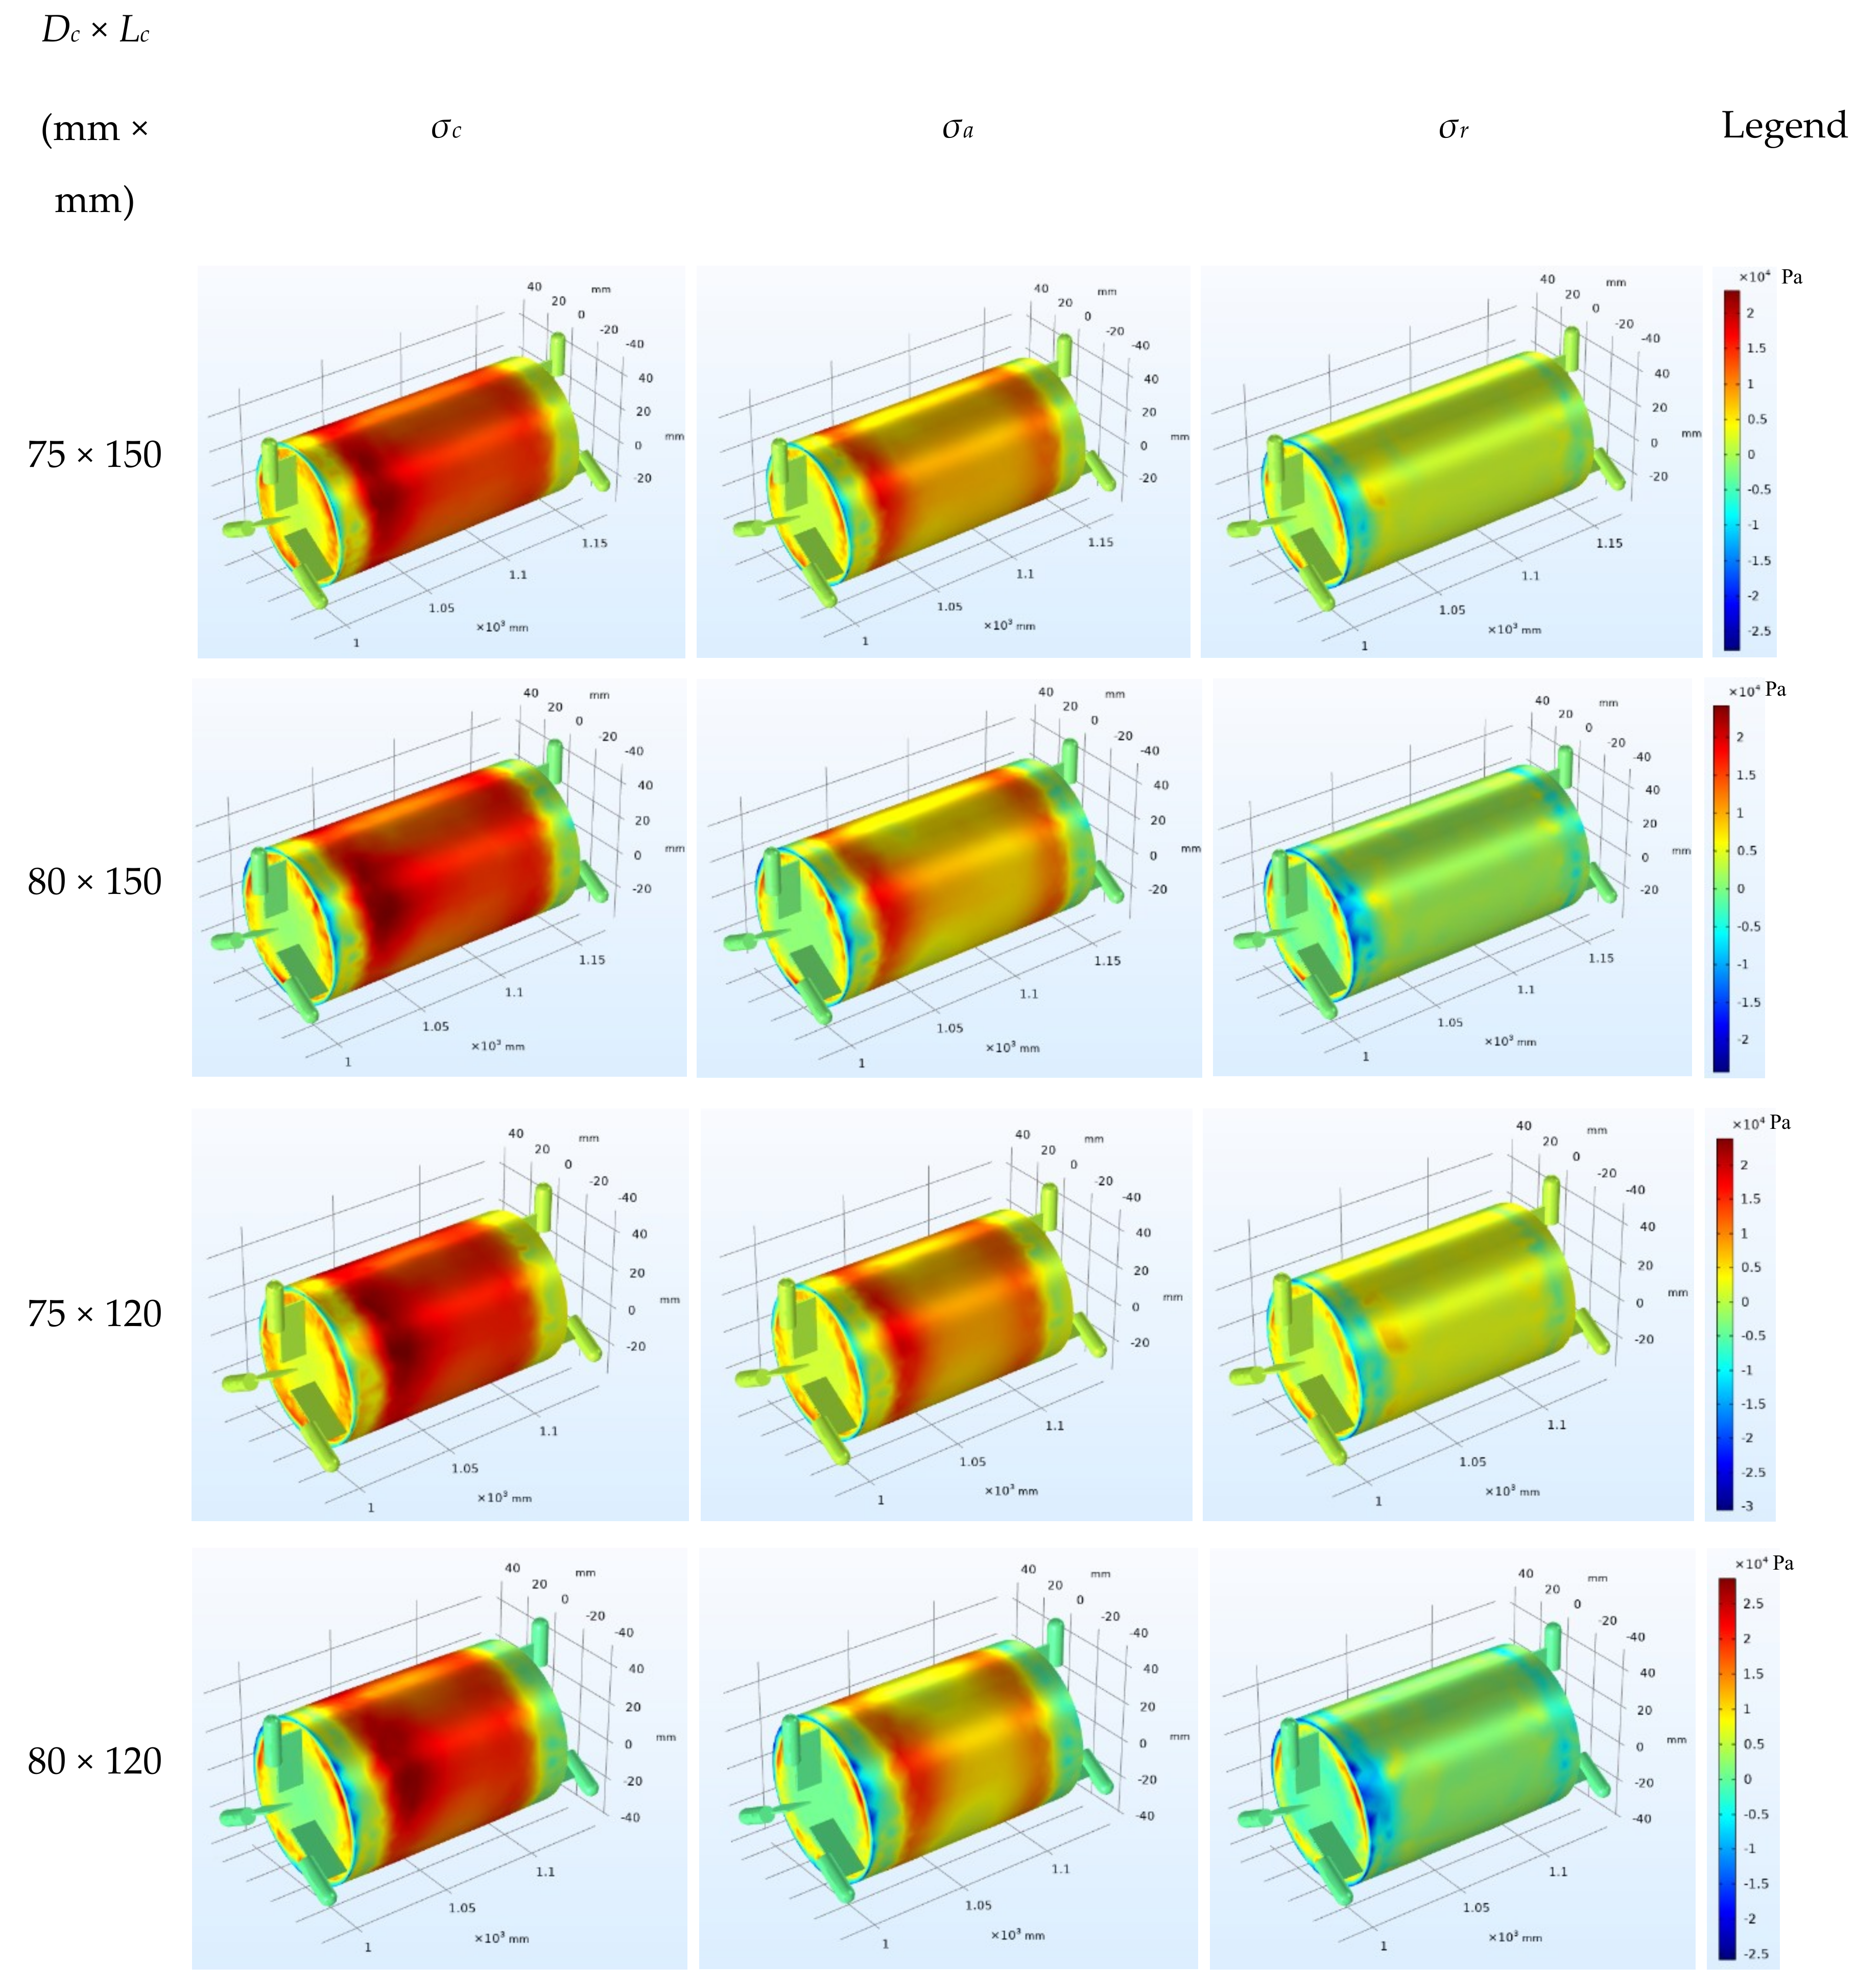
The principal stress on the cylinder wall of a piped carriage is divided into the axial component σa parallel to the axial direction of the pipe carriage, the circumferential component σc perpendicular to the axial direction of the pipe carriage, and the radial component σr along the radius direction. The three component values are expressed as: σa > σc > σr.
Figure 13 is the principal stress distribution diagram on the cylinder wall of piped carriage with Dc × Lc = 80 mm × 150 mm at a different discharge. As can be seen from the Figure 13, with the increased of the discharge in the pipe, the three components of the principal stress on the cylinder wall of the piped carriage increased, and the influence of the discharge on the three components of the principal stress was described in detail in Section 6.4. The distribution of the circumferential and axial components of the principal stress was similar. From the rear-end to the front-end of the cylinder, the distribution of stress components shows the M type, first increased, then decreased, then increased and decreased. The minimum value appeared at the rear-end and front-end of the piped carriage, and was negative. The two peaks appeared near the position of 25 mm from the rear-end and the front-end of the cylinder respectively, and the maximum appeared between the two groups of support feet near 25 mm from the rear-end of the cylinder. This is mainly due to the separation of flow caused by the pipe flow passing through the rear-end of the piped carriage, which resulted in a reverse pressure zone, in which the direction of the flow changed, resulting in a negative circumferential and axial component of the principal stress. When the flow field was separated from the rear-end of the piped carriage, the pressure decreased rapidly, and then the separated fluid re-attached to the cylinder wall. When the fluid arrives at the front-end of the piped carriage, the moving fluid must not only overcome the viscous effect of the outer wall of the piped carriage, but also resist the pressure difference caused by the sudden expansion of the water-crossing section, so that the flow separates again. When some fluid particles are insufficient to overcome the two effects, there would be a reflux in the reverse pressure zone again, and negative values of the circumferential and axial components of principal stress appear again. The radial component of the principal stress on the cylinder wall of the piped carriage was very small compared with the other two components of the principal stress. The minimum value also appeared in the front and rear ends of the cylinder.
Figure 14 showed the principal stress distribution on the cylinder wall of different sizes of the piped carriage when the discharge of the pipe was 50m3·h−1. By comparing the distribution of the three components of the principal stress on the cylinder wall of the piped carriage with different sizes, it can be seen that when the cylinder length Lc of the piped carriage was a constant, the larger the diameter Dc was, and the larger were the three components of the corresponding principal stress. However, when the diameter Dc of the cylinder was a constant, the shorter the length Lc of the cylinder, the greater the three components of the principal stress.

6.4. Effect of Discharge on the Wall Stress of Piped Carriage

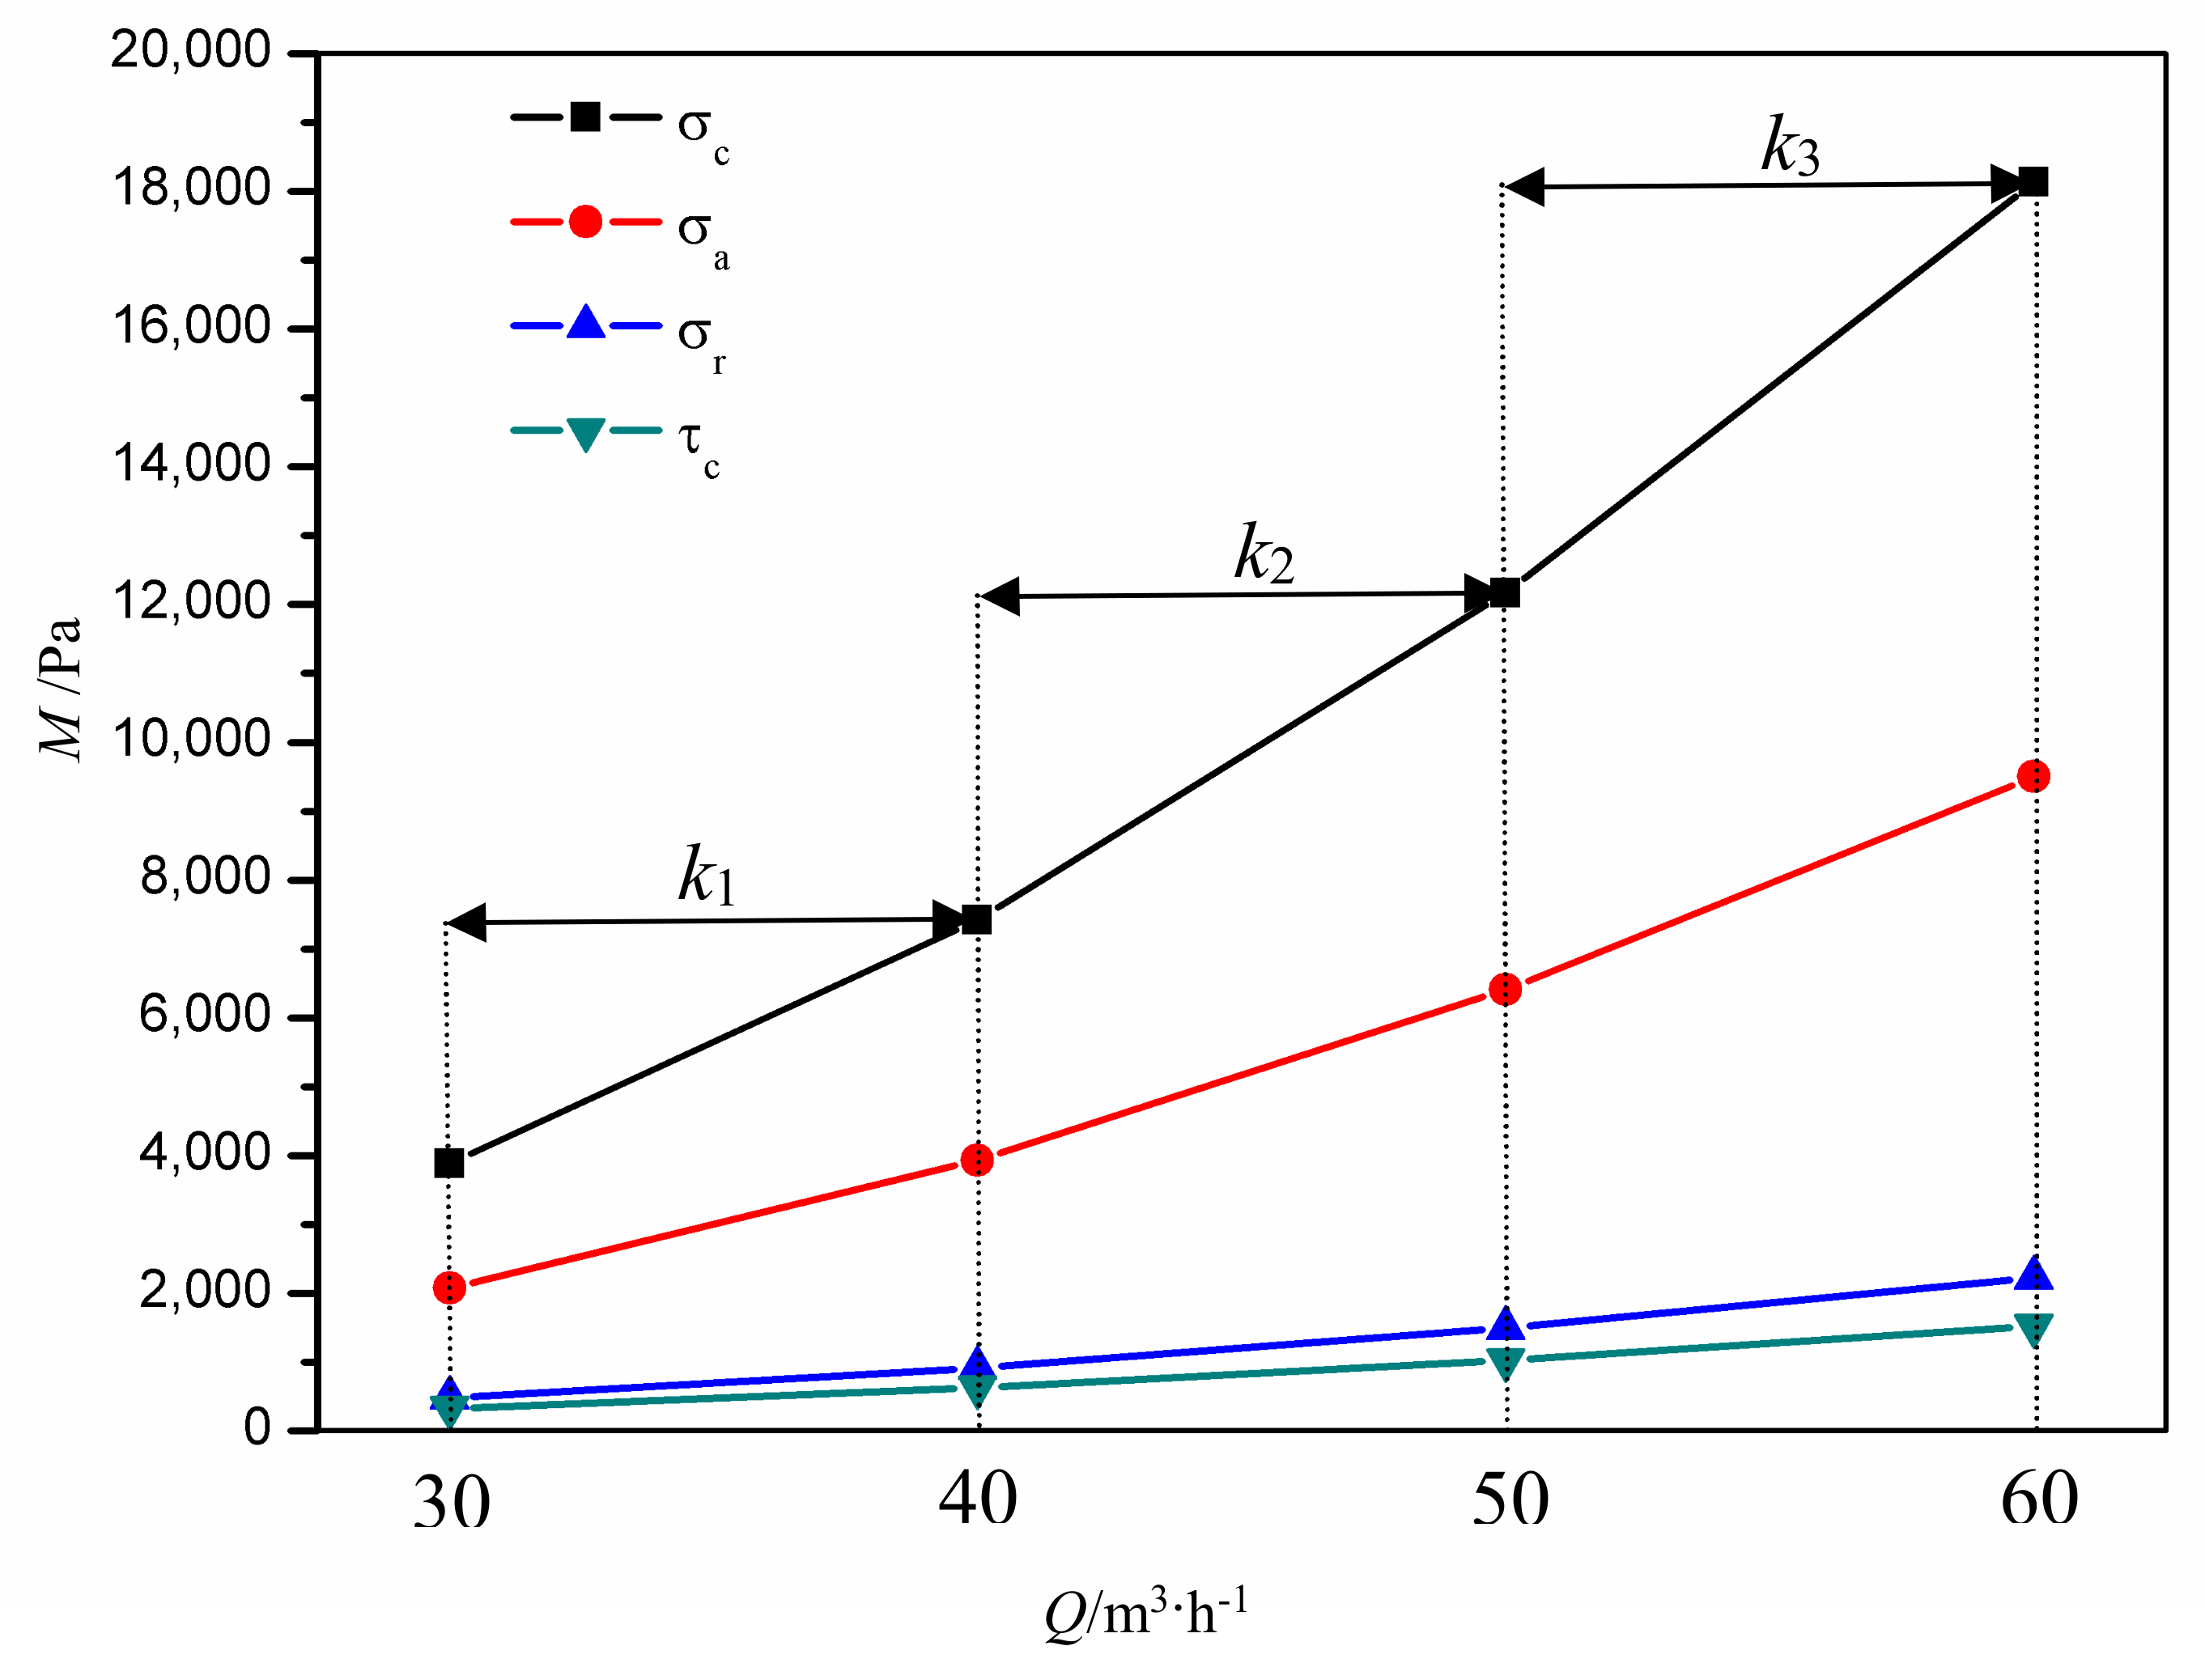
In this paper, the influence of the discharge on the three components of principal stress and shear stress of the cylinder wall was discussed by taking the middle position of the cylinder of the piped carriage (Dc × Lc = 80 mm × 150 mm) as an example when the θ = 0°, as shown in Figure 15. Variable k was used to express the effect of unit discharge on the wall stress of the piped carriage.
k = Δ M Δ Q
where ∆M represents the stress difference on the cylinder wall of the piped carriage; ∆Q represents the discharge difference of the pipe flow.
From Figure 15, it can be seen that the change of the unit discharge had the greatest influence on the circumferential component of the principal stress and the smallest influence on the wall shear stress of the cylinder. In this article, the slope of stress on the cylinder wall of the piped carriage between the different discharge sections was recorded as k1, k2 and k3. The corresponding stress was added with the corresponding lower corner mark. The slopes of the unit discharge stress change of the three components of the principal stress and shear stress on the cylinder were expressed by k ¯ τ c , k ¯ σ c , k ¯ σ a and k ¯ σ r respectively. As can be seen from Figure 15, the relation was k ¯ σ c > k ¯ σ a > k ¯ σ r > k ¯ τ c . For the three components of principal stress and wall shear stress, the stress change rate of smaller discharge was less than that of the larger discharge, that is, k1 < k2 < k3. It shows that the larger the discharge was, the greater was the influence of the unit discharge on the stress of the piped carriage.

7. Conclusions

In the process of hydraulic transportation of the piped carriage, the study of the stress of the water flow act on the cylinder wall of the piped carriage can help to improve the design of the piped carriage structure, and even the selection of piped carriage materials. It has important engineering significance in improving transportation efficiency and reducing energy consumption. The distribution of the flow field around the piped carriage and the stress distribution on the cylinder wall of the piped carriage were investigated by numerical simulation methods, when the carriages were stationary in different flow conditions. The reliability of the simulation results was verified by the model experiment. The experimental and simulated axial velocity values and circumferential component of the principal stress presented maximum deviations of 8.21% and 9.80% respectively, which showed that the arbitrary Lagrangian–Eulerian (ALE) method can be applied for fluid-structure problems well. The following conclusions can be drawn from this study.
-
With the increase of the discharge in the pipe, the flow velocity around the piped carriage increased obviously, especially in the region between the inner wall of the pipe and the piped carriage. The influence of the diameter of the cylinder Dc on the flow field around the piped carriage was greater than that of the length of the cylinder Lc.
-
The wall shear stress on cylinder of the piped carriage was greater than zero, that is, the wall shear stress along the direction of the pipe flow, and the maximum value appeared between the two groups of support feet in the middle and rear section of the cylinder. When the length of the cylinder Lc was fixed, the larger the diameter of cylinder Dc, the greater the wall shear stress.
-
The stress components on the cylinder wall of the piped carriage obeyed the rule as follow: σa > σc > σr. From the rear-end to the front-end of the piped carriage, the distribution of stress components shows the M type, first increased, then decreased, then increased and decreased. The minimum value appeared at the rear-end and front-end of the piped carriage, and it was negative. The maximum value appeared between the two groups of support feet 25 mm away from the rear-end of the cylinder. When the length of cylinder Lc was fixed, the larger the diameter Dc was, the greater were the three components of the corresponding principal stress. When the diameter of the cylinder, Dc, was a constant, the shorter the cylinder length Lc, the greater the three components of the principal stress.
-
The larger the flow, the greater the influence of unit flow on the wall shear stress and principal stress of the piped carriage, that is, k1 < k2 < k3. At the same time, the increase of the flow has the greatest influence on the circumferential component of the principal stress of the cylinder, followed by the axis component, and the smallest influence on the wall shear stress of the cylinder, i.e., k ¯ σ c > k ¯ σ a > k ¯ σ r > k ¯ τ c .
In this study, Comsol Multiphysics was used to investigate the distribution of shear stress and principal stress on the cylinder wall of the piped carriage. This provides a theoretical basis for the capsule pipeline transportation mode and the material-log pipeline transportation mode. In addition to that, it also provides a research method for fluid-structure coupling problems, such as the flow around a cylinder.

Author Contributions

Formal analysis, X.Y.; funding acquisition, J.M., Y.L., X.S. and Y.L. (Yonggang Li); investigation, X.Y., Y.L. (Yongye Li) and X.J.; Resources, Y.L. (Yongye Li) and X.S.; writing—original draft, X.Y.; writing—review & editing, J.M. and Y.L. (Yonggang Li).

Funding

The research was funded by the National Natural Science Foundation of China (51179116, 51109155, 50579044, 51705352) and the Natural Science Foundation of Shanxi Province (2015011067, 201701D221137).

Acknowledgments

The research was supported by the Collaborative Innovation Center of New Technology of Water-Saving and Secure and Efficient Operation of Long-Distance Water Transfer Project at Taiyuan University of Technology.

Conflicts of Interest

The authors declare no conflicts of interest.

References

  1. Liu, H.; Assadollahbaik, M. Energy Conservation Value of Hydraulic Container Pipeline (HCP); U.S. Dept. of Energy, Division of Transportation Energy Conservation: Washington DC, USA, 1979.
  2. Liu, H.; Assadollahbaik, M. Feasibility of using hydraulic capsule pipeline to transport coal. J. Pipeline 1981, 1, 295–306. [Google Scholar]
  3. Liu, H.; Wu, J.P. Economic Feasibility of Using Hydraulic Pipeline to Transport Grain in the Midwest of the United States; Freight Pipeline (Proc. 6th Int. Symp, on Freight Pipelines); Hemisphere Publishing Corp: New York, NY, USA, 1990; pp. 135–140. [Google Scholar]
  4. Brown, R.A.S. Capsule pipeline research at the Alberta Research Council, 1985–1978. J. Pipeline 1987, 6, 75–82. [Google Scholar]
  5. Liu, H. Hydraulic Capsule Pipeline. J. Pipeline 1981, 1, 11–23. [Google Scholar]
  6. Liu, H.; Graze, H.R. Lift and drag on stationary capsule. J. Hydraul. Eng. 1983, 109, 28–47. [Google Scholar] [CrossRef]
  7. Liu, H.; Richards, J.L. Hydraulics of stationary capsule in pipe. J. Hydraul. Eng. 1994, 120, 22–40. [Google Scholar] [CrossRef]
  8. Gao, X.; Liu, H. Hydraulics predicting incipient velocity of capsules in pipe. J. Hydraul. Eng. 2000, 126, 470–473. [Google Scholar] [CrossRef]
  9. Cheng, C.C.; Liu, H. Tilt of stationary capsule in pipe. J. Hydraul. Eng. 1996, 12, 90–96. [Google Scholar] [CrossRef]
  10. Kroonenberg, H.H. Mathematical model for concentric horizontal capsule transport. Can. J. Chem. Eng. 1962, 56, 538–543. [Google Scholar] [CrossRef]
  11. Charles, M.E. The pipeline flow of capsules: Part 2: Theoretical analysis of the concentric flow of cylindrical forms. Can. J. Chem. Eng. 1963, 41, 46–51. [Google Scholar]
  12. Tomita, Y.; Yamamoto, M.; Funatsu, K. Motion of a single capsule in a hydraulic pipeline. J. Fluid Mech. 1986, 171, 495–508. [Google Scholar] [CrossRef]
  13. Latto, B.; Chow, K.W. Hydrodynamic transport of cylindrical capsules in a vertical pipeline. Can. J. Chem. Eng. 1982, 60, 713–722. [Google Scholar] [CrossRef]
  14. Michiyoshp, I.; Nakajima, T. Fully developed turbulent flow in a concentric annulus11. J. Nucl. Sci. Technol. 1968, 5, 354–359. [Google Scholar] [CrossRef]
  15. Nouri, J.M.; Umur, H.; Whitelaw, J.H. Flow of Newtonian and non-Newtonian concentric and eccentric annuli. J. Fluid Mech. 1993, 253, 617–641. [Google Scholar] [CrossRef]
  16. Quadrio, M.; Luchini, P. Direct numerical simulation of the turbulent flow in a pipe with annular cross section. Eur. J. Mech. 2002, 21, 413–427. [Google Scholar] [CrossRef]
  17. Khalil, M.F.; Kassab, S.Z.; Adam, I.G.; Samaha, M.A. Turbulent flow around single concentric long capsule in a pipe. Appl. Math. Model. 2010, 34, 2000–2017. [Google Scholar] [CrossRef] [Green Version]
  18. Asim, T.; Mishra, R.; Nearchou, A.; Ubbi, K. Effect of the length and diameter of a cylindrical capsule on the pressure drop in a horizontal pipeline. J. Phys. Conf. Ser. 2012, 1, 364. [Google Scholar] [CrossRef]
  19. Sun, X.H.; Li, Y.Y.; Yan, Q.F. Experimental study on starting conditions of the hydraulic transportation on the piped carriage. In Proceedings of the 20th National Conference on Hydrodynamics, Taiyuan, China, 23–25 August 2007; pp. 425–431. [Google Scholar]
  20. Li, Y.Y.; Sun, X.H. Hydraulic characteristics of transportation of different piped carriages in pipe. J. Drain. Irrig. Mach. Eng. 2010, 28, 174–178. [Google Scholar]
  21. Jing, Y.H. Characteristics of Slit Flow Velocity by the Formation of Stable Moving Piped Carriage with Different Diameter in Straight Piped Segments. Master’s Thesis, Taiyuan University of Technology, Taiyuan, China, 2014. [Google Scholar]
  22. Zhang, C.; Sun, X.; Li, Y.; Zhang, X.; Zhang, X.; Yang, X.; Li, F. Hydraulic characteristics of transporting a piped carriage in a horizontal pipe based on the bidirectional fluid-structure interaction. Math. Probl. Eng. 2018, 2018, 1–27. [Google Scholar] [CrossRef]
  23. Xiaoni, Y.; Yongye, L.; Xihuan, S. Analysis on hydraulic characteristics of hydrocyclone in horizontal straight pipeline under operation. J. Hydroelectr. Eng. 2015, 34, 98–102. [Google Scholar]
  24. Yang, X.N. Study on the Character of Spiral Flow Caused by Different Length Guide Vanes. Master’s Thesis, Taiyuan University of Technology, Taiyuan, China, 2013. [Google Scholar]
  25. Zhang, X.L.; Sun, X.H.; Li, Y.Y.; Xi, X.N.; Guo, F.; Zheng, L.J. Numerical investigation of the concentric annulus flow around a cylindrical body with contrasted effecting factors. J. Hydrodyn. 2015, 27, 273–285. [Google Scholar] [CrossRef]
  26. Zhang, C.; Sun, X.; Li, Y.; Zhang, X.; Zhang, X.; Yang, X.; Li, F. Effects of guide vane placement angle on hydraulic characteristics of flow field and optimal design of hydraulic capsule pipelines. Water 2018, 10, 1378. [Google Scholar] [CrossRef]
  27. Li, Y.Y.; Sun, X.H.; Yan, Q.F. Experimental research on the piped hydraulic transportation with the different diversion angle. J. Hydrodyn. 2008, 23, 86–89. [Google Scholar]
  28. Zhang, C.J.; Sun, X.H.; Li, Y.Y.; Zhang, X.Q. Effects of guide strip angles on hydraulic characteristics of moving boundary annular gap flow. J. Drain. Irrig. Mach. Eng. 2019, 37, 136–141,147. [Google Scholar]
  29. Xi, X.N. Research on Hydraulic Characteristics of the Pipe Hydraulic Transportation of Tube-Contained Raw Materials under Different Reynolds Numbers. Master’s Thesis, Taiyuan University of Technology, Taiyuan, China, 2012. [Google Scholar]
  30. Li, Y.Y.; Sun, X.H.; Yan, Y.F. Hydraulic characteristics of tube-contained raw material hydraulic transportation under different loads on the piped carriage. Trans. Chin. Soc. Agric. Eng. 2008, 39, 93–96. [Google Scholar]
  31. Ma, C.G.; Wu, J.; Lu, Y.F.; Li, Y.Y.; Zhang, X.L. Study on the characteristics of slot flow velocity at different flow conditions of same double piped carriages. Water Power 2018, 44, 90–93. [Google Scholar]
  32. Lu, Y.F. Research on the Numerical Simulation of the Velocity of the Concentric Annular Gap Spiral Flow around the Stationary Column in the Horizontal Straight Pipeline. Master’s Thesis, Taiyuan University of Technology, Taiyuan, China, 2018. [Google Scholar]
  33. Abdi, R.; Rezazadeh, N.; Abdi, M. Investigation of passive oscillations of flexible splitter plates attached to a circular cylinder. J. Fluid. Struct. 2019, 84, 302–317. [Google Scholar] [CrossRef]
  34. Souli, M.; Ouahsine, A.; Lewin, L. ALE formulation for fluid–structure interaction problems. Comput. Methods Appl. Mech. Eng. 2000, 190, 659–675. [Google Scholar] [CrossRef]
  35. Lee, J.S.; Lee, S.H. Fluid-structure interaction for the propulsive velocity of a flapping flexible plate at low Reynolds number. Comput. Fluids 2013, 71, 348–374. [Google Scholar] [CrossRef]
  36. Govier, G.W.; Aziz, K. The Flow of Capsules in Pipes. In The Flow of Complex Mixtures in Pipes; Van Nostrand-Reinhold: New York, NY, USA, 1972; pp. 712–757. [Google Scholar]
  37. Zhang, Z.C.; Li, G.D.; Li, Z.Q. Hydraulics; China Water & Power Press: Beijing, China, 2011; Volume 1. [Google Scholar]
  38. Fan, F.; Liang, B.C.; Li, Y.R.; Bai, Y.C.; Zhu, Y.J.; Zhu, Z.X. Numerical investigation of the influence of water jumping on the local scour beneath a pipeline under steady flow. Water 2017, 9, 642. [Google Scholar] [CrossRef]
  39. Yao, R.T.; Guo, D.P. Computational Fluid Dynamics Foundation and STAR-CD Engineering Application; National Defense Industry Press: Beijing, China, 2015. [Google Scholar]
  40. Turek, S.; Hron, J. Proposal for numerical benchmarking of fluid–structure interaction between an elastic object and laminar incompressible flow. In Fluid–Structure Interaction; Springer: Berlin/Heidelberg, Germany, 2006; pp. 371–385. [Google Scholar]
  41. Damiri, H.S.; Bardaweel, H.K. Numerical design and optimization of hydraulic resistance and wall shear stress inside pressure-driven microfluidic networks. Lab. Chip. 2015, 15, 4187–4196. [Google Scholar] [CrossRef]
  42. Thim, T.; Hagensen, M.K.; Falk, E.; Hørlyck, A.; Kim, W.Y.; Niemann, A.K.; Bøtker, H.E. Wall shear stress and local plaque development in stenosed carotid arteries of hypercholesterolemic minipigs. J. Cardiovasc. Dis. Res. 2012, 3, 76–83. [Google Scholar] [CrossRef] [PubMed] [Green Version]
  43. Santos, D.S.; Faia, P.M.; Garcia, F.A.P.; Rasteiro, M.G. Oil/water stratified flow in a horizontal pipe: Simulated and experimental studies using EIT. J. Petrol. Sci. Eng. 2019, 174, 1179–1193. [Google Scholar] [CrossRef]
  44. Zheng, D.S.; Jiang, Y.Z. Determination of optimum location of a right angle strain flower using optimization. J. Vib. Meas. Diag. 1997, 17, 53–56. [Google Scholar]
  45. Sundstrom, L.R.J.; Cervantes, M.J. Characteristics of the wall shear stress in pulsating wall-bounded turbulent flows. Exp. Therm. Fluid Sci. 2018, 96, 257–265. [Google Scholar] [CrossRef]
  46. Marusic, I.; Mckeon, B.J.; Monkewitz, P.A.; Nagib, H.M.; Smits, A.J.; Sreenivasan, K.R. Wall-bounded turbulent flows at high Reynolds numbers: Recent advances and key issues. Phys. Fluids 2010, 22, 1–58. [Google Scholar] [CrossRef]
  47. Ariyaratne, C. Design and Optimization of Swirl Pipes and Transition Geometries for Slurry Transport. Ph.D. Thesis, The University of Nottingham, Nottingham, UK, 2005. [Google Scholar]
  48. Asim, T.; Algadi, A.; Mishra, R. Effect of capsule shape on hydrodynamic characteristics and optimal design of hydraulic capsule pipelines. J. Pet. Sci. Eng. 2018, 161, 390–408. [Google Scholar] [CrossRef]
  49. Lin, J.Z.; Ruan, X.D.; Chen, B.G.; Wang, J.P.; Zhou, J.; Ren, A.L. Fluid Mechanics, 2nd ed.; Tsinghua University Press: Beijing, China, 2005. [Google Scholar]
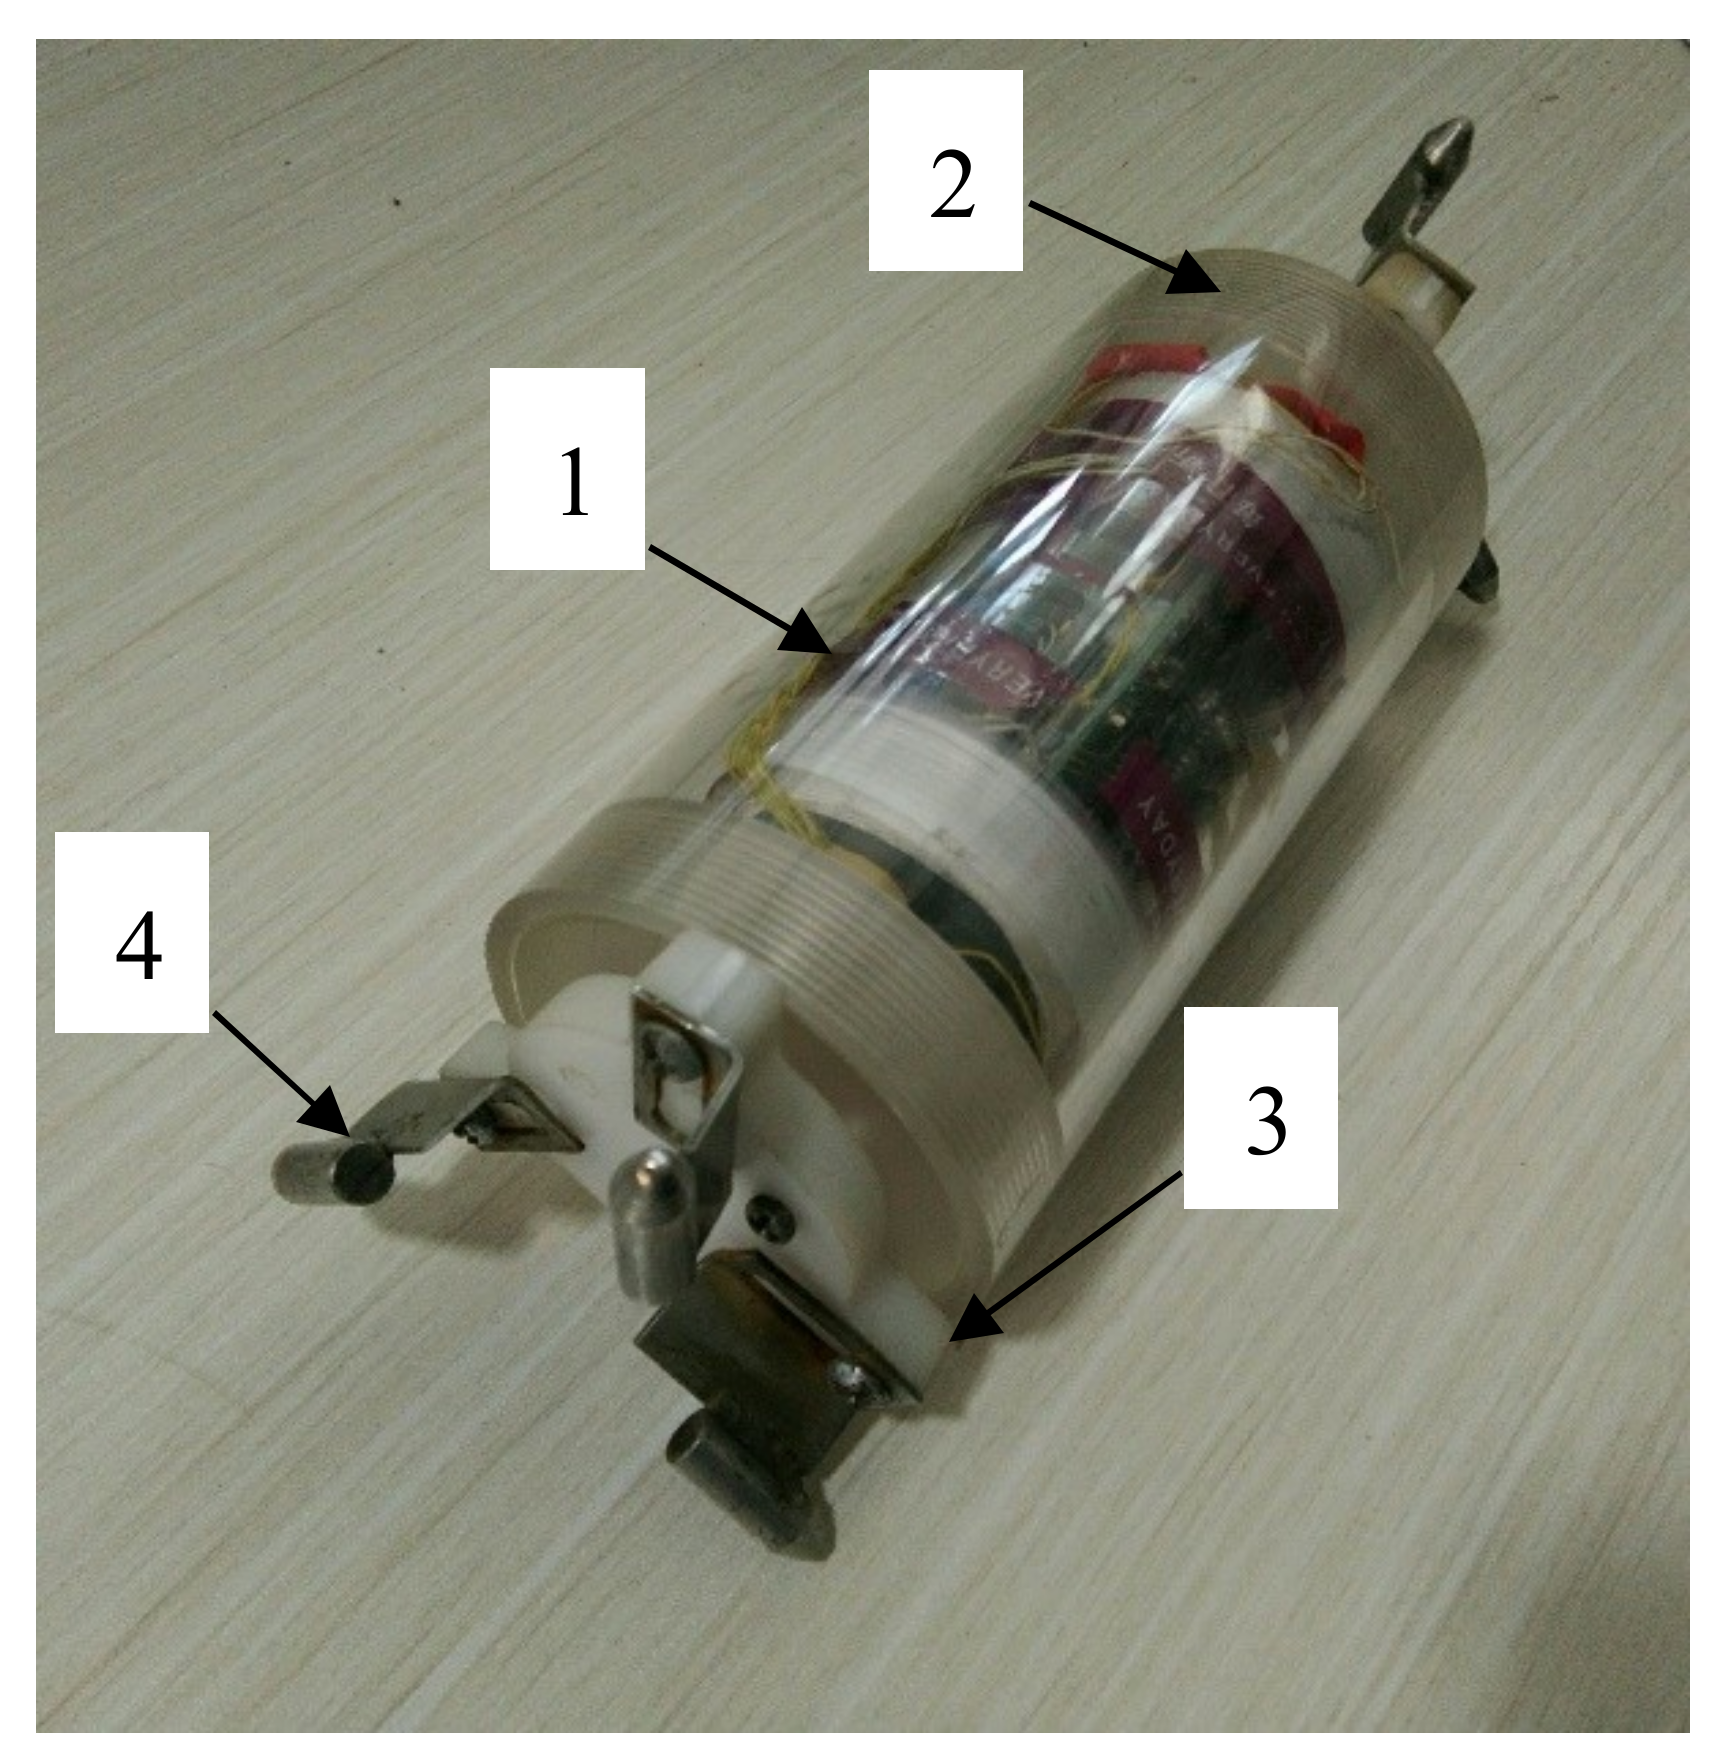
Figure 1. The structural sketch of piped carriage. Note: 1—Cylinder; 2—Plug; 3—Support body; 4—Support foot.
Water 11 01910 g001
Figure 2. Forces acting on a stationary piped carriage in a straight pipe.
Water 11 01910 g002
Figure 3. Geometric model and mesh generation of the piped carriage. (a) Geometric model, (b) Mesh generation.
Water 11 01910 g003
Figure 4. Layout sketch of experiment facilities. Note: 1—Centrifugal pump; 2—Gate valve; 3—Electromagnetic flowmeter; 4—Placement device; 5—Braking device; 6—Straight pipe segment; 7—Square water jacket; 8—LDV; 9—Piped carriage; 10—Flange; 11—Bend pipe; 12—Straight pipe segment; 13—Water tank; 14—Steady flow grid.
Water 11 01910 g004
Figure 5. Experimental devices and instruments. Note: 1—Main engine of force measurement system; 2—Gateway of force measurement system; 3—System software TSTDAS V5.0; 4—Square water jacket; 5—Probes of LDV; 6—Coordinate frame.
Water 11 01910 g005
Figure 6. The layout of measuring points near the cylinder wall of piped carriage. (a) Layout of test section around cylinder; (b) Distribution of measuring points on each test section.
Water 11 01910 g006
Figure 7. Comparison of the simulation results and experiment results for axial velocity.
Water 11 01910 g007
Figure 8. Comparison of the simulation results and experiment results for circumferential component of the principal stress.
Water 11 01910 g008
Figure 9. The velocity distribution cloud of the XZ plane of the piped carriage with different discharge. (Dc × Lc = 80 mm × 150 mm) Note: (a) Q = 30 m3·h−1; (b) Q = 40 m3·h−1; (c) Q = 50 m3·h−1; (d) Q = 60 m3·h−1.
Water 11 01910 g009
Figure 10. The velocity distribution cloud of the XZ plane of different sizes piped carriage with the discharge of 50 m3·h−1. Note: (a) Dc × Lc = 75 mm × 150 mm; (b) Dc × Lc = 80 mm × 150 mm; (c) Dc × Lc = 75 mm × 120 mm; (d) Dc × Lc = 80 mm × 120 mm.
Water 11 01910 g010
Figure 11. Wall shear stress distribution of the same piped carriage with different discharge (Dc × Lc = 80 mm × 150 mm). Note: (a) Q = 30 m3·h−1; (b) Q = 40 m3·h−1; (c) Q = 50 m3·h−1; (d) Q = 60 m3·h−1.
Water 11 01910 g011
Figure 12. Wall shear stress distribution for different sizes of piped carriage with the discharge of 50 m3·h−1. Note: (a) Dc × Lc = 75 mm × 150 mm; (b) Dc × Lc = 80 mm × 150 mm; (c) Dc × Lc = 75 mm × 120 mm; (d) Dc × Lc = 80 mm × 120 mm.
Water 11 01910 g012
Figure 13. Principal stress distribution of the same piped carriage with a different discharge (Dc × Lc = 80 mm × 150 mm).
Water 11 01910 g013
Figure 14. Principal stress distribution for different sizes of the piped carriage with the discharge of 50 m3·h−1.
Water 11 01910 g014
Figure 15. Variation of stress on the cylinder wall of the piped carriage with the flow rate.
Water 11 01910 g015
Table 1. The summary of experimental parameters.
RunsDc × Lc (mm × mm)Q (m3·h−1)Up (m/s)E (Pa)νsRe
175 × 15030/40/50/601.06/1.41/1.77/2.1211.2 × 1090.49105,366/140,488/175,610/210,731
280 × 150
375 × 120
480 × 120
Note: Q is the flow discharge; Up is the mean velocity over the pipe cross-sectional area; E is the Young’s modulus of Piped carriage; νs is the Poisson’s ratio of plexiglass at 20 °C. Re is the Reynolds number for each fully developed flow (Re = UpD/ν, where ν is the kinematic viscosity of water at 20 °C).