Article

Hydrochemical Characteristics and Water Quality Assessment for the Upper Reaches of Syr Darya River in Aral Sea Basin, Central Asia

1
State Key Laboratory of Desert and Oasis Ecology, Xinjiang Institute of Ecology and Geography, Chinese Academy of Sciences, Urumqi 830011, China
2
Research Center for Ecology and Environment of Central Asia, Chinese Academy of Sciences, Urumqi 830011, China
3
University of Chinese Academy of Sciences, Beijing 100049, China
4
Institute of Geology, National Academy of Sciences of Kyrgyzstan, Bishkek 720461, Kyrgyzstan
*
Author to whom correspondence should be addressed.
Water 2019, 11(9), 1893; https://doi.org/10.3390/w11091893
Submission received: 26 July 2019 / Revised: 1 September 2019 / Accepted: 6 September 2019 / Published: 11 September 2019
(This article belongs to the Section Water Quality and Contamination)

Abstract

:
Based on water sampling of the upper reaches of the Syr River and its tributaries from the parts of Aral Sea Basin in Kyrgyzstan, the chemical compositions of river waters were systematically analyzed for revealing the hydrochemical characteristics and evaluating the water quality. Research indicates that there are some differences in ion concentration between the low-flow season (LFS) and high-flow season (HFS), but the hydrochemical classification reflected that all water samples fall in the calcium bicarbonate category, except that only three samples fall in the not dominant category during the LFS. The water quality classification shows that the water samples fall in the excellent to good categories for irrigation use. The analysis shows that the main ions of river waters come from the weathering of rocks, and the dissolution of carbonates is higher than that of silicates. Human activities have had an impact on the waterbody, especially inferred from the indicators of NH4-N and fecal coliform (FC). FC groups were detected in some rivers, in which the detection rate at the high-water level increased. The contents of potentially toxic elements are lower than international drinking water standards, but there are clustering differences between the LFS and HFS. There may be anthropogenic intrusions of Cu, Pb, and Zn during the LFS period and of Cu, Pb, Zn, and Cd during the HFS period. The results fill the gaps in the study of the hydrochemical composition and water quality assessment in the Aral Sea Basin and will also provide a basis for water resource management and for the study of water quality evolution in the future.

1. Introduction

The shrinkage of Aral Sea [1], related to changes in water storage [2,3], water quality [4], regional climate [5,6], and environmental conditions [7,8,9], have been hotspots of research attention in the past few decades. The Syr Darya River, which originates in the Tian Shan Mountains in Kyrgyzstan and is the second largest river in the Aral Sea Basin, has also received more research focus. Former studies focused on the source of water evaporation in the Syr Darya River [10,11], the changes in water volume of the Syr Darya River [12,13,14,15], the coping strategy for water resource [16,17], and the climate change effects [18,19,20]. The deteriorated water quality of lakes and rivers threatens the livelihood of local people, the economic development, and biological diversity of riverside wetlands. On the one hand, the chemical substances in the salt storms from the Aral Sea are directly derived from the river inputs [21,22]. On the other hand, the Syr Darya River resources are widely used in agricultural irrigation, and the water quality is directly related to societal and economic development. However, previous studies have paid less attention to the variabilities in hydrochemistry, including major ions and potentially toxic elements.
The hydrochemistry of natural surface water accurately reflects the interactions of precipitation, evaporation, and chemical weathering processes [23,24], and groundwater–surface water interaction [25]. Natural surface water also records the impacts of human activities on its hydrochemistry [26]. Due to the lack of water ecosystem surveys and monitoring data in the Aral Sea Basin, only individual studies on the clarification of the drivers of water stress to the Naryn River, the main tributary of the Syr Darya River [27] and radionuclide contamination in the Syr Darya River were conducted in Kazakhstan [28] and Kyrgyzstan [29], respectively. These limited data can hardly meet the needs of water protection in the Aral Sea Basin. To further meet the ecological needs and determine the key regional targets for ecological protection of water, it is imperative to conduct hydrochemical investigations in the Aral Sea Basin.
Aiming at the lack of hydrochemical research on the river waters in the Aral Sea Basin, the primary objective of this study was to examine the temporal variability in hydrochemistry and to understand the possible factors contributing to these changes. The results of the detailed evaluation of the hydrochemistry reported in this paper will provide a basis for the scientific assessment of water use and conservation and for future studies on the hydrochemical processes in the Aral Sea Basin.

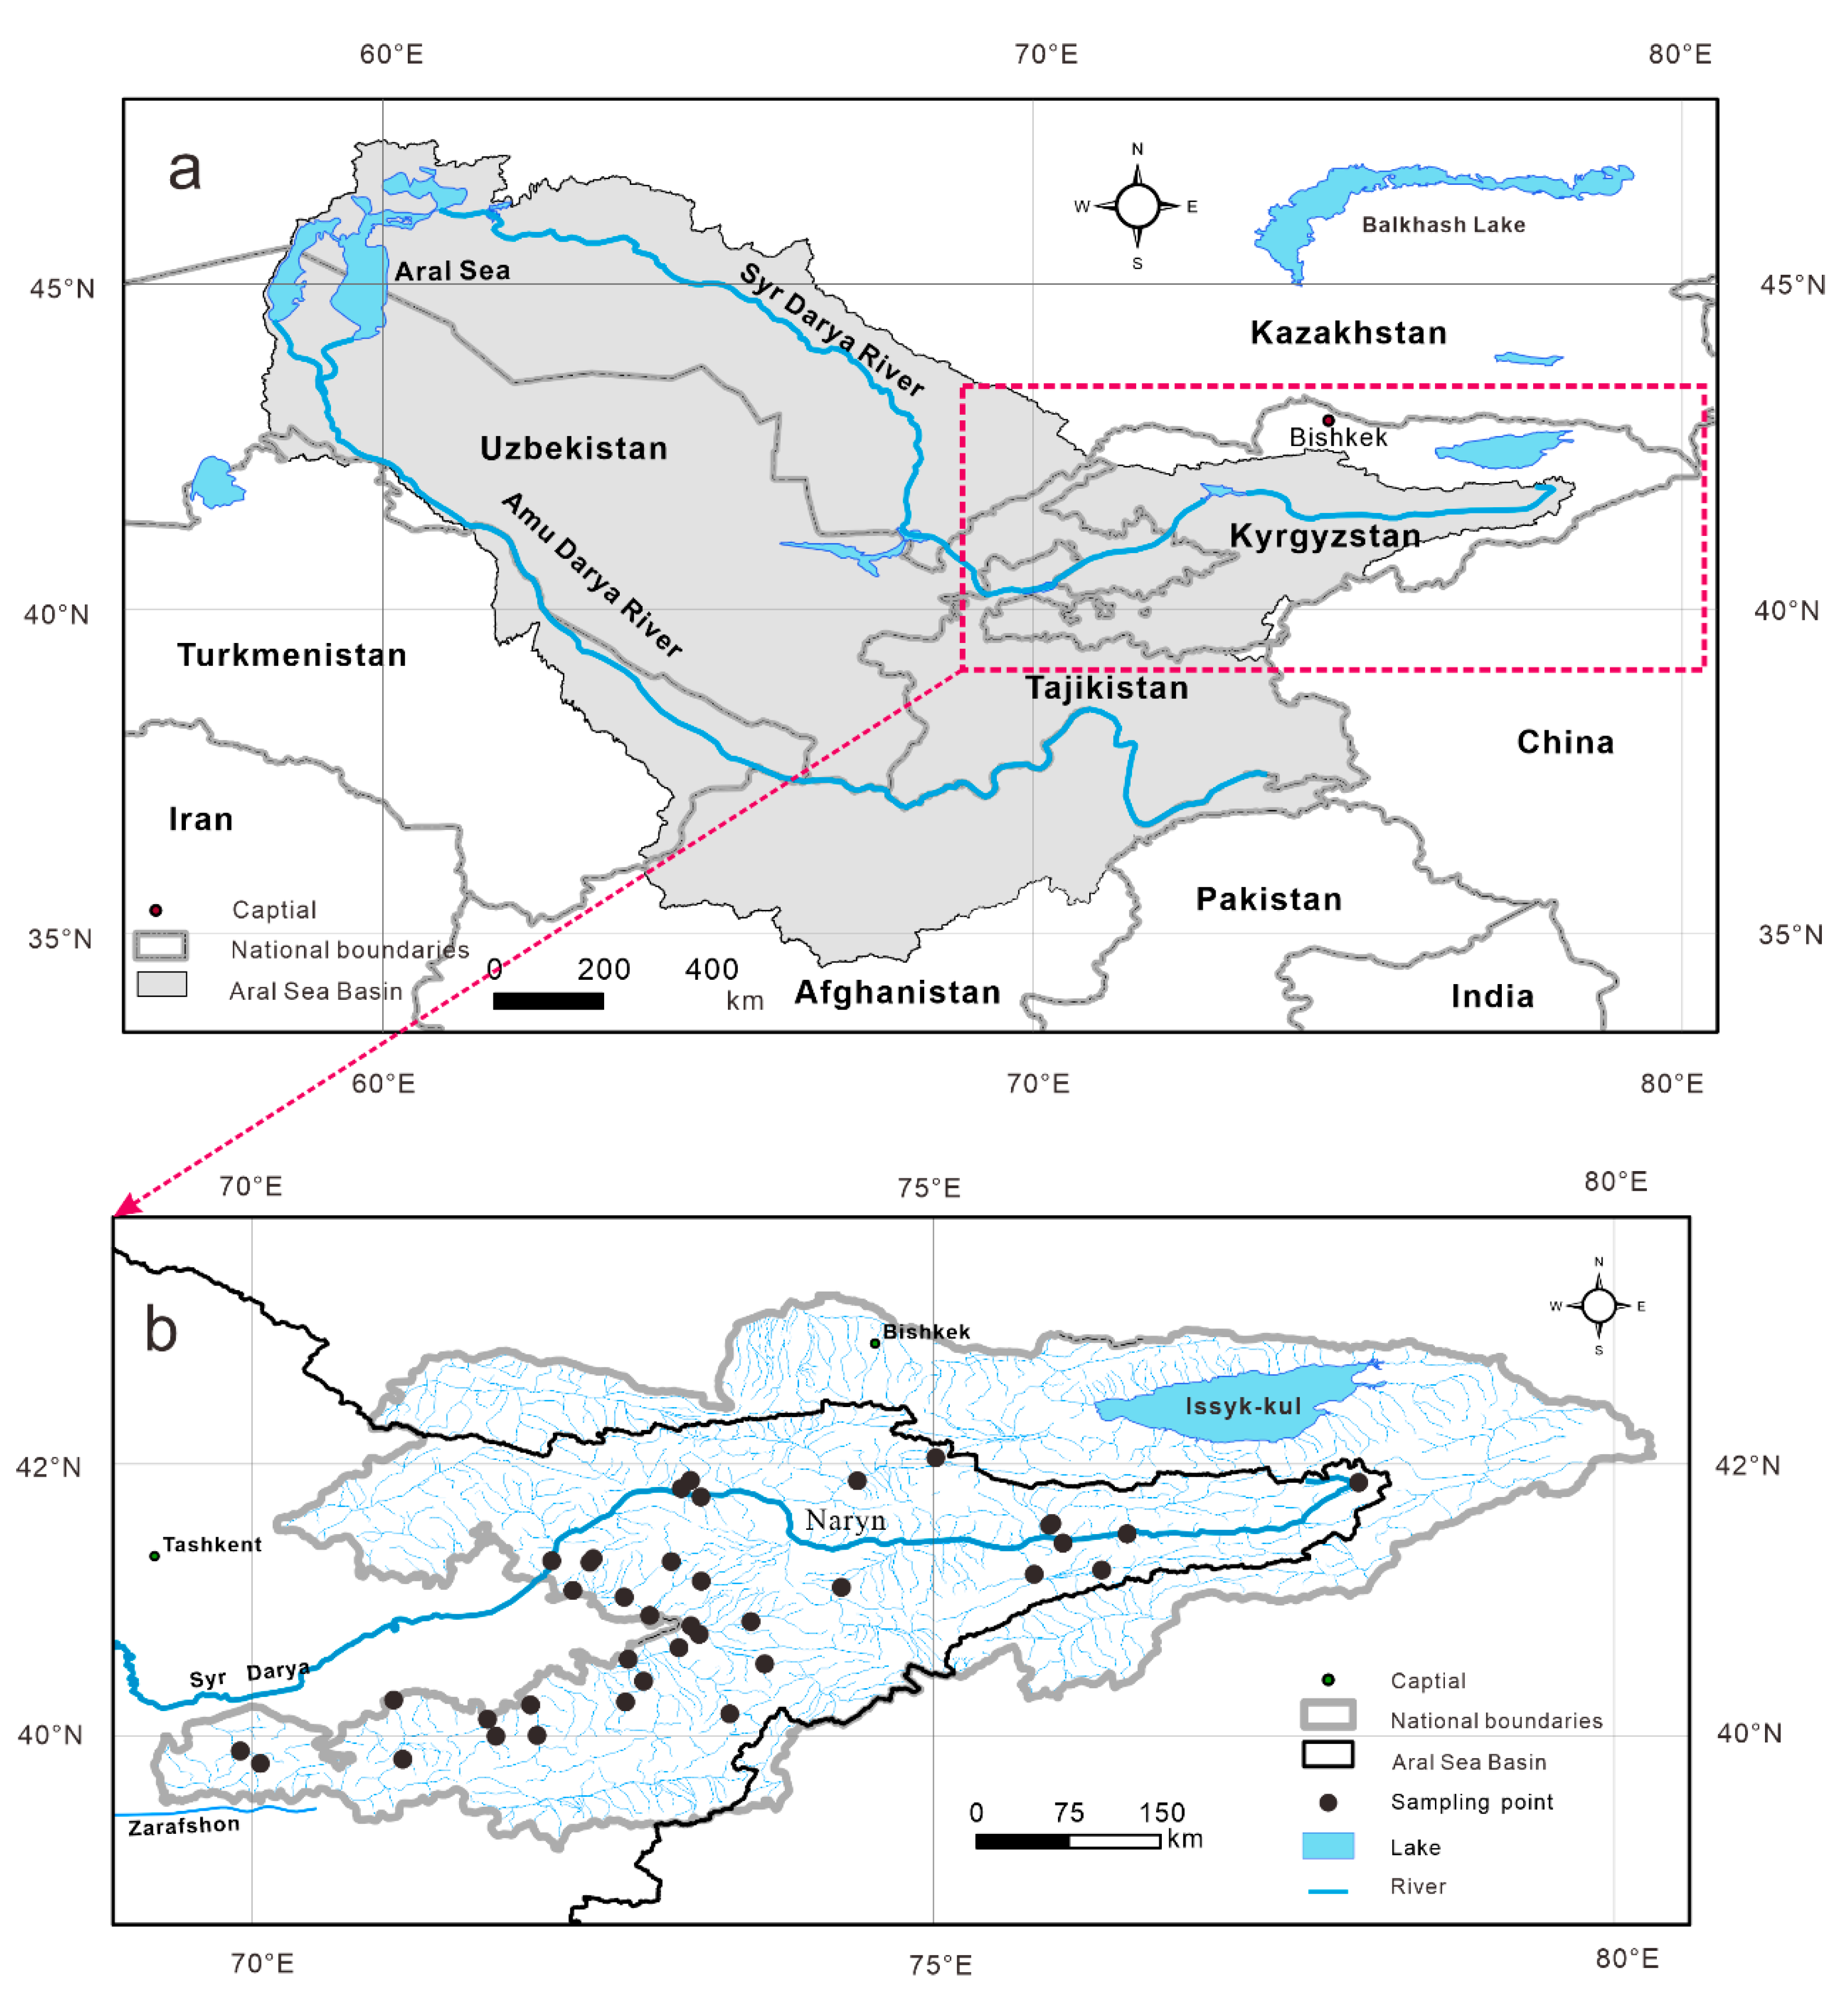
2. Geographic Background

The Syr Darya River is mainly supplied from glaciers and snowmelt at a length of 2500 km [12]. The 75% of the annual flow of Syr Darya (36.57 km3) waters is formed in Kyrgyzstan [30]. The study area refers to parts of the Aral Sea Basin in Kyrgyzstan (Figure 1). Kyrgyzstan has a total population of about 6.3 million (2018). Tian Shan mountain ranges covering over 80% of its surface area. Of the total land area, 56.2% is classified as agricultural land, of which 87% is pasture and only 7.3% (equal to 1.4 million ha) is arable. Three quarters (1.1 million ha) of this arable land are irrigated [31]. The Syr Darya Rivers in Kyrgyzstan (Naryn River) flows through the Fergana Valley into Uzbekistan. The peak flow in the study area occurs in July and August, and the dry season is from November to April [27]. The bedrocks in the study region are mainly composed of sedimentary carbonate rocks, siliciclastic rocks, acid plutonic rocks, mixed sedimentary rocks and unconsolidated sediments [32]. According to the soil classification in the Harmonized World Soil Database (v 1.2) [33], the soils in the study area are composed of Calcisols, Kastanozem, and Leptosol. The study area has a continental climate caused by its position between the temperate and sub-tropical zones [34]. The summer temperatures in southwestern Fergana Valley can reach up to 40 °C [34]. The yearly precipitation in Kyrgyzstan varies between 100 and 1000 mm and is distributed unevenly [34]. From the perspective of the interannual temperature distribution, the monthly average temperature curve showed a single-peak distribution, and the highest temperature occurred in July [35]. However, the monthly total precipitation curve shows a bimodal distribution pattern, and the two peaks appear in April and November [36,37].

3. Materials and Methods

3.1. Sampling and Hydrochemistry Analyses

Sampling was conducted in August 2017 (high-flow season, HFS) and in May 2017 (low-flow season, LFS), and the sample positions were shown in Figure 1. Thirty-eight water samples from the Syr River and its tributaries were collected during the HFS period, and 38 river water samples were collected during the LFS period. Water samples were collected from the central part of each river. For preventing contamination, waters were sampled using a 5 L polyethylene bucket rinsed with the in-situ water three times before sampling. After that, the sampled water was stored in a 1.5 L polyethylene terephthalate bottle rinsed three times with the sample water. Subsamples were filtered through 0.45 μm filters (cellulose acetate) and collected in high-density polyethylene tubes for measurements of ions and heavy metals. Before sampling for analyses on cations and heavy metals were acid-washed in a 10% HNO3 and filled with three drops of HNO3 (65%) for subsample acidification (pH < 2). The pH, electrical conductivity (EC), and total dissolved solids (TDS) were measured in situ with a multiparameter water quality meter (HI 9828, HANNA Instruments, Limena, Italy). The total organic carbon (TOC) content was measured by the total organic carbon analyzer (Multi N/C 2100, Analytic Jena AG, Jena, Germany) with a detection limit of 0.15 mg L−1. Using a compact titrator (G20, Mettler Toledo AG, Greifensee, Switzerland) with a detection limit of 3 mg L−1, the HCO3 and CO3 concentrations were determined by potentiometric titration [38,39]. The cations Ca2+, K+, Mg2+, and Na+ and the anions Cl, NO3, SO42−, and F were measured ionic chromatography system (Dionex ICS 900, Thermo Fisher Scientific Inc., USA) with detection limits for cations Ca2+ (3 mg L−1), K+ (0.1 mg L−1), Mg2+ (3 mg L−1), and Na+ (1 mg L−1) and the anions Cl (2 mg L−1), NO3 (0.2 mg L−1), SO42− (2 mg L−1), and F (0.1 mg L−1). The ammonium-nitrogen (NH4-N), nitrate-nitrogen (NO3-N), and nitrite-nitrogen (NO2-N) were detected by colorimetric methods [40,41] using a UV-Vis-spectrophotometer (Cary 60, Agilent Technologies, Santa Clara, USA) with a detection limit of 0.1 mg L−1.The test accuracy for the major cations and anions was evaluated by the percentage of the charge balance error (CBE, %) [42,43]. The CBE in this study was less than 5%. Fecal coliform (FC) groups were determined by multi-tube fermentation [44]. With Agilent 8800 (Agilent Technologies, Santa Clara, USA), the levels of potentially toxic elements, zinc (Zn), copper (Cu), cadmium (Cd), lead (Pb), total chromium (ΣCr), hexavalent chromium (Cr6+), and arsenic (As), were determined by inductively coupled plasma mass spectrometry [45,46] with detection limits for Zn (0.003 μg L−1), Cu (0.003 μg L−1), Cd (0.003 μg L−1), Pb (0.001 μg L−1), ΣCr (0.02 μg L−1), Cr6+ (0.02 μg L−1), and As (0.006 μg L−1). Laboratory analyses we conducted at the Research Center for Ecology and Environment of Central Asia (Bishkek, Kyrgyzstan).

3.2. Data Processing Methods

To evaluate the irrigation suitability, a classification diagram (USSL diagram) was plotted by the electrical conductance EC and sodium absorption ratio (SAR) (Equation (1) [47]). The SAR reflects the risk of an alkali or sodium hazard to crops [48]. A high Na+ concentration in irrigation water will result in negative influences on the soil structure resulting in poor internal drainage and restricted circulation of air and water when Na+ is displaced by Mg2+ and Ca2+ and is adsorbed by clay soil particles [48]. If not indicated below, the ionic concentrations are expressed in milliequivalents per liter (meq L−1).
SAR = Na + ( Ca 2 + + Mg 2 + ) 2
A Wilcox diagram [49] was plotted by the EC and sodium percentage (Na%). The sodium percentage Na% was calculated as follows:
Na % = Na + Na + + Ca 2 + + Mg 2 + + K + × 100 %
A Piper diagram [50] is usually plotted to classify the major ion composition and to separate the hydrogeochemical facies [51,52,53,54]. The Gibbs diagram [23] reflects the ratios of cations [Na+/(Na+ + Ca2+)] and anions [Cl/(Cl + HCO3)] against the TDS. Gibbs diagram can reveal three natural mechanisms (rock dominance, evaporation dominance, and precipitation dominance) that influence the hydrochemistry [55]. Mixing diagrams [56,57] can be used to reveal details about the processes of rock weathering.
Hierarchical cluster analysis [58] and two-way cluster analysis [59] was used to examine the characteristics of ions and potentially toxic elements and to determine the similarity of the samples and the hydrochemical compositions. The colored cells were coded based on scales of Z-scores for the concentrations of ions and potentially toxic elements. The Z-score formula is:
Z = x μ σ
where, x is the original data, μ is the mean of all data, and σ is the standard deviation.

4. Results

As shown in Figure 2, the pH ranges from 7.68 to 8.46, with a median value of 8.21, during the LFS period, and the pH has a range of 7.81 to 8.51 and a median value of 8.22 during the HFS period. The TDS ranges from 149.9 to 452.9 mg L−1 with a median value of 302.3 mg L−1 during the LFS period, and the TDS a range of 82.37 to 464.6 mg L−1 with a median value of 280.5 mg L−1 during the HFS period. The EC ranges from 95.5 to 570 μS cm−1 with a median value of 318.4 μS cm−1 during the LFS period, and the EC has a range of 74 to 568 μS cm−1 with a median value of 318.3 μS cm−1 during the HFS period. The TOC ranges from 1.54 to 4.61 mg L−1 with a median value of 2.75 mg L−1 during the LFS period, and the TOC a range of 1.79 to 3.13 mg L−1 with a median value of 2.35 mg L−1 during the HFS period.
Anion HCO3 had the highest concentration among all of the ions. The concentrations of Ca2+ are higher than those of Mg2+, and the concentrations of Na+ are higher than those of Cl in each period. The Na% ranged from 1.8% to 17.59%, with a median value of 7.03% during the LFS, and the Na% ranged from 1.44% to 18.7%, with a median value of 6.93% during the HFS. The SAR ranged from 0.055 to 0.67 with a median value of 0.22 during the LFS, and the SAR ranged from 0.024 to 0.67 with a median value of 0.22 during the HFS. The minimum, median and maximum values of the ammonium-nitrogen (NH4-N) concentration are 0.51, 0.73, and 0.84 mg L−1, respectively, during the LFS period, which are higher than those during the HFS period. The minimum, median and maximum values of the nitrate-nitrogen (NO3-N) concentration are 0.3, 0.96 and 2.26 mg L−1, respectively, during the LFS period, which are higher than those (0.18, 0.63, and 1.35 mg L−1, respectively) during the HFS period. No nitrite-nitrogen (NO2-N), cyanide and anionic surfactants are present in the water samples during both sampling periods. Ion F concentration above 1.0 mg L−1 leads to an increased risk of dental and skeletal fluorosis [60]. The maximum F concentrations are 0.84 and 0.83 mg L−1 during the LFS and HF, respectively. The FC values were the same at 2 MPN 100 mL−1 (most probable number per 100 mL) for the four river samples during the LFS. During the HFS period, FC was detected in 16 river samples, and the maximum of FC values was 9 MPN 100 mL−1.
The Zn concentration ranges from 0.348 to 15.55 μg L−1, with a median value of 1.981 μg L−1, during the LFS, compared with a Zn concentration range of 0.2395 to 10.28 μg L−1, with a median value of 3.559 μg L−1, during the HFS. The Cu concentration ranges from 0.13 to 4.911 μg L−1 during the LFS, compared with a Cu concentration range of 0.007 to 4.251 μg L−1 during the HFS. Cd ranges from 0.009 to 0.747 μg L−1 during the LFS) and from 0.033 to 0.424 μg L−1 during the HFS. The Pb level ranges from 0 to 1.911 μg L−1 with a median value of 0.087 μg L−1 during the LFS, compared with a Pb range of 0 to 2.224 μg L−1 with a median value of 0.494 μg L−1during the HFS. As ranges from 0.179 to 1.377 μg L−1 during the LFS and from 0.102 to 1.022 μg L−1 during the HFS. The ΣCr value ranges from 0.01 to 0.08 mg L−1 with a median value of 0.03 mg L−1 during the LFS, and the ΣCr value ranges from 0.01 to 0.08 mg L−1 with a median value of 0.035 mg/L during the HFS. Cr6+ ranges from 0.01 to 0.03 mg L−1 during the LFS and from 0.006 to 0.038 mg L−1 during the HFS.

5. Discussion

5.1. Sources and Influencing Factors for the Major Ions and Potentially Toxic Elements

Natural processes, including precipitation, evaporation, and water-rock interactions, control the ionic composition of the river water samples [57]. Most of the river samples were plotted in the water–rock interaction array (Figure 3). The anions and cations in the river water samples from the upper reaches of Syr Darya River and its tributaries are mainly controlled by water–rock interactions. All water samples plot the arrays of carbonates and silicates (Figure 3), which indicates that the ionic compositions are mainly controlled by carbonate dissolution and silicate weathering. However, Figure 3 shows that the water samples from the upper riches of the Syr Darya River had higher Ca/Na ratios, which suggests that the dissolution of carbonates is more notable than that of silicates [61].
Almost all water samples fall in the calcium bicarbonate array (Figure 4). During the LFS, only three samples fall in the not dominant category of the lower parts of the ternary diagrams. Generally, there were no significant differences in hydrochemical facies classification between the water samples collected during the LFS and HFS (Figure 4). Because the water samples from the upper reaches of Syr Darya River and its tributaries mainly belong to the calcium bicarbonate category, carbonate dissolution may dominate the hydrochemical composition. If only carbonate dissolution occurs, the values of Ca2+/HCO3 and (Ca2+ + Mg2+)/HCO3 will be close to 0.5 [62]. In this area, the values of Ca2+/HCO3 and (Ca2+ + Mg2+)/HCO3 were higher than 0.5 (Figure 5), which suggests that the excess Ca2+ and Mg2+ were not only the result of carbonate dissolution but were also influenced by other natural sources, e.g., gypsum and the silicate mineral of anorthite [62].
If the Ca2+ originates from gypsum dissolution, the ratio of Ca2+/SO42− will be nearly equal to 1 [63]. However, in this study, the ratio of Ca2+/SO42− is much greater than 1 (Figure 5), suggesting that the excess Ca2+ may be derived from the dissolution of carbonates or silicate minerals [64]. In addition, if the ion ratio of Ca2+/Mg2+ was higher than 2, the natural process is the weathering of silicates [63]. Similarly, in this region, the value of the Ca2+/Mg2+ ratio is much higher than 2, which suggests that the major Ca2+ ion should also be influenced by the process of silicate weathering in addition to carbonate dissolution.
If the Na+ in the water samples come from halite dissolution, then the ratio of Na+/Cl is about 1 [65]. However, in this study, the ratio of Na+/Cl is much greater than 1, indicating that the excess Na+ comes from the weathering of silicates due to the ion exchange process. The results are similar to studies in Kanding, southeastern China [63], the Yellow River source region, the northeastern Qinghai-Tibetan Plateau [56], and the results are different from studies in southern Germany [62], India [66] and China [67].
NH4-N was detected at each sampling point in different sampling periods, which reflected the influences of human activities. The concentration during the HFS period is lower than that during the LFS period, which reflects the dilution effect to a certain extent. Kyrgyzstan has large grazing livestock, which is the traditional vocation of the Kyrgyz people. The fecal contamination caused by livestock and humans will lead to increased risks of disease outbreaks, reflected by the fecal contamination [68]. In this study, FC bacteria were detected in four river samples (Isfairam-Sai (2), Jazy (2) Kok-Art (2) and Naryn (1) in the Supplementary Materials (Table S1)) among the 38 samples, and the FC values were the same at 2 MPN 100 mL−1 (most probable number per 100 mL) for the four river samples during the LFS. However, there are clear differences with those during the HFS period, and FC bacteria were detected in 16 river samples (Ala-Buga (1), Ak-Buura (1), Ak-Buura (2), Ak-Suu (1), Ak-Suu (2), At-Bashy (1), At-Bashy (2), Chon Naryn, Isfairam-Sai (1), Jumgal (2), Kichi-Naryn, Kurshab (1), Mailuu-Suu (2), Naryn (1), Soh (1), and Soh (2) in the Supplementary Materials (Table S1)), which indicates that a large amount of untreated feces flowed into rivers from pastures with surface runoff during the HFS period.
From the dendrogram of hierarchical clustering analysis (Figure 6a,b), during the HFS period (Figure 6b), Cd was close to the Zn, Cu, and Pb groups, which may reflect differences with that during the LFS (Figure 6a). The similarity between heavy metals did not reflect sources of heavy metals and their influencing factors. The dendrogram created by two-way analysis illustrates the apparent characteristics of the analytes and the spatial sample locations (Figure 6c,d). The Euclidean distance was used to reflect the measure of similarity between the monitoring points or the analytes. From the point of view of the clustering dendrogram between the heavy metals and major ions, there are also significant differences between the different periods. During the LFS period (Figure 6c), Zn, Cu, Pb exhibited significant differences from the main ions and the other potentially toxic elements. During the HFS period (Figure 6d), Zn, Cu, Pb and Cd had significant differences from the main ions. However, the other potentially toxic elements are close to the major ions. There may be anthropogenic intrusions of Cu, Pb, and Zn during the LFS period and of Cu, Pb, Zn, and Cd during the HFS period. The affinities between samples in the two-way clustering diagram were mainly determined by the relationships between ions and heavy metals. From the view of the sample clustering, the sampling points are quite different between the HFS and LFS, which reflects the complexity of the geographical background and hydrological conditions.

5.2. Evaluation of the Irrigation Suitability

The concentrations of the potentially toxic elements were lower than the drinking water standards from the drinking water quality guidelines of the World Health Organization [69], the Council Directive 98/83/EC on the quality of water intended for human consumption, the European Union [70], the National Primary Drinking Water Regulations, the United States Environmental Protection Agency [71] and the China National Standards for drinking water quality (GB5749-2006) [72], which indicated that the water quality of the water from the parts of Aral Sea Basin in Kyrgyzstan is good (Table 1).
The river water of the Syr Darya River is used extensively for irrigation [73], and the upstream water quality has an important impact on downstream irrigation. Moreover, the rivers in the study area flow into the Fergana Valley, which has one of the highest population densities in Central Asia and is among the conflict-prone areas for water resources [74,75], and the rivers in this study area are the main sources for irrigation. Wilcox and USSL diagrams were used to classify and assess the water quality for irrigation [76]. From the USSL diagram (Figure 7), the water samples fall into the C1–S1 to C2–S1 category of low sodium (alkali) hazards to low/medium salinity hazards, respectively, suggesting that the river water quality was satisfactory for irrigation use. The sodium percentage (%Na) vs. EC was plotted in a Wilcox diagram for assessing the irrigation water quality, which showed that all water samples fall in the excellent to good categories for irrigation use.

6. Conclusions

With a total of 76 river water samples collected during the LFS and HFS periods, the hydrochemistry and potential influencing factors in the upper reaches of the Syr River and its tributaries were systematically analyzed. The results are as follows:
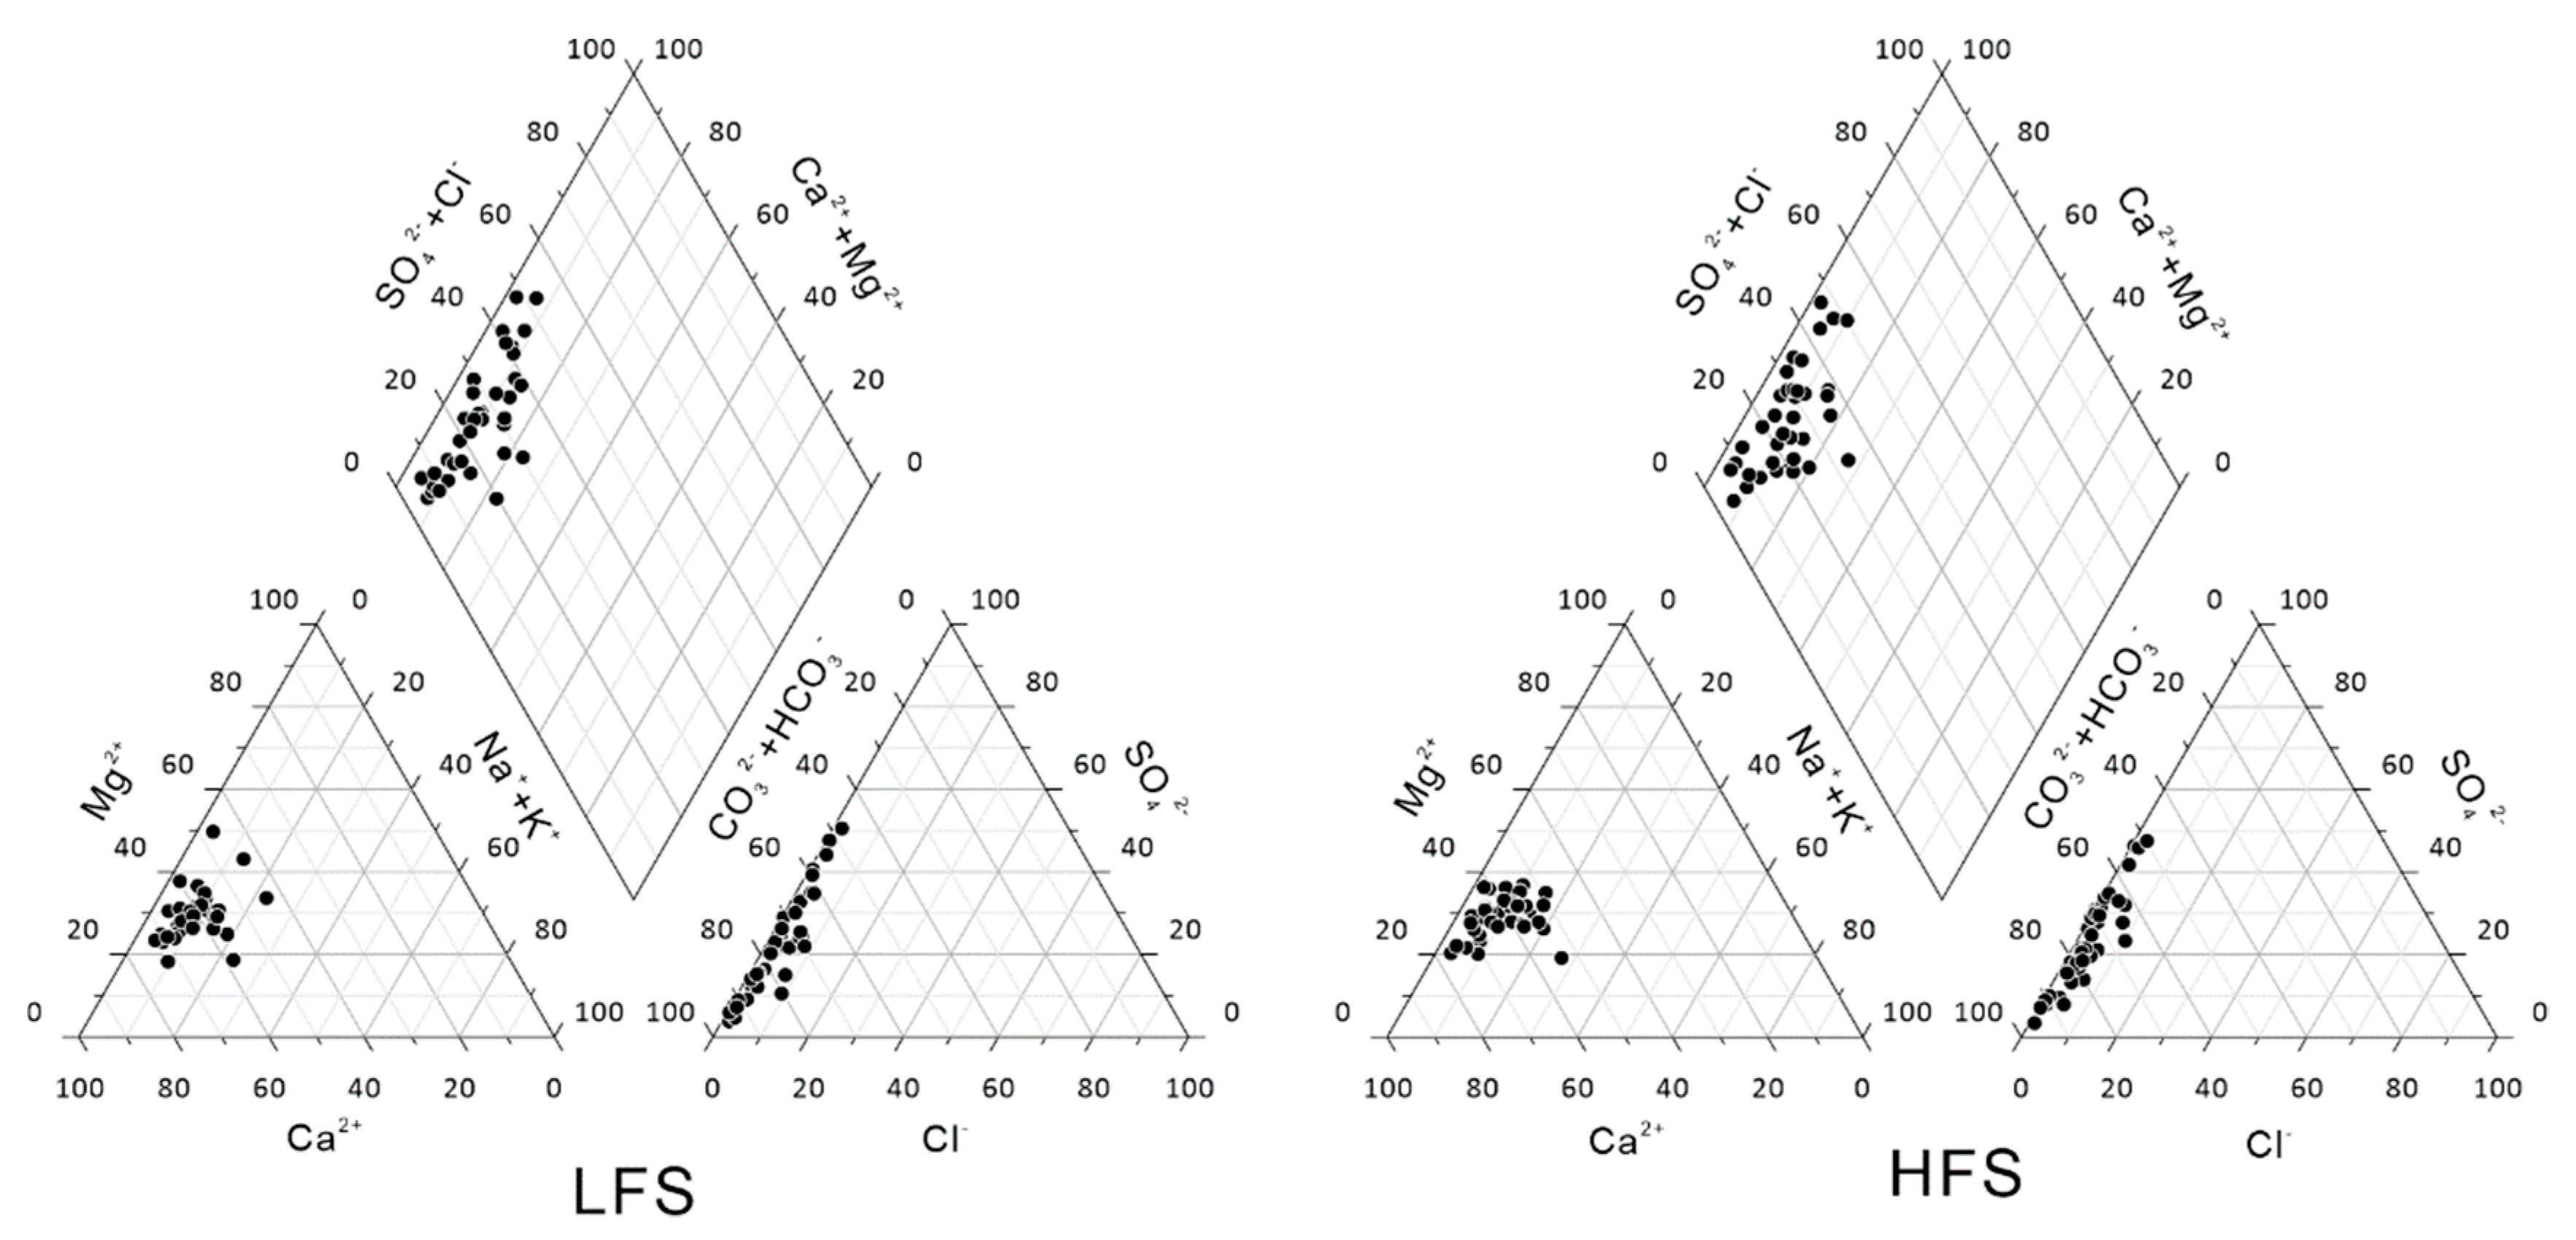
  • There are some differences in ion concentration between the LFS and HFS periods, but the hydrochemical classification reflected that all water samples fall in the calcium bicarbonate category, except that only three samples fall in the not dominant category during the LFS.
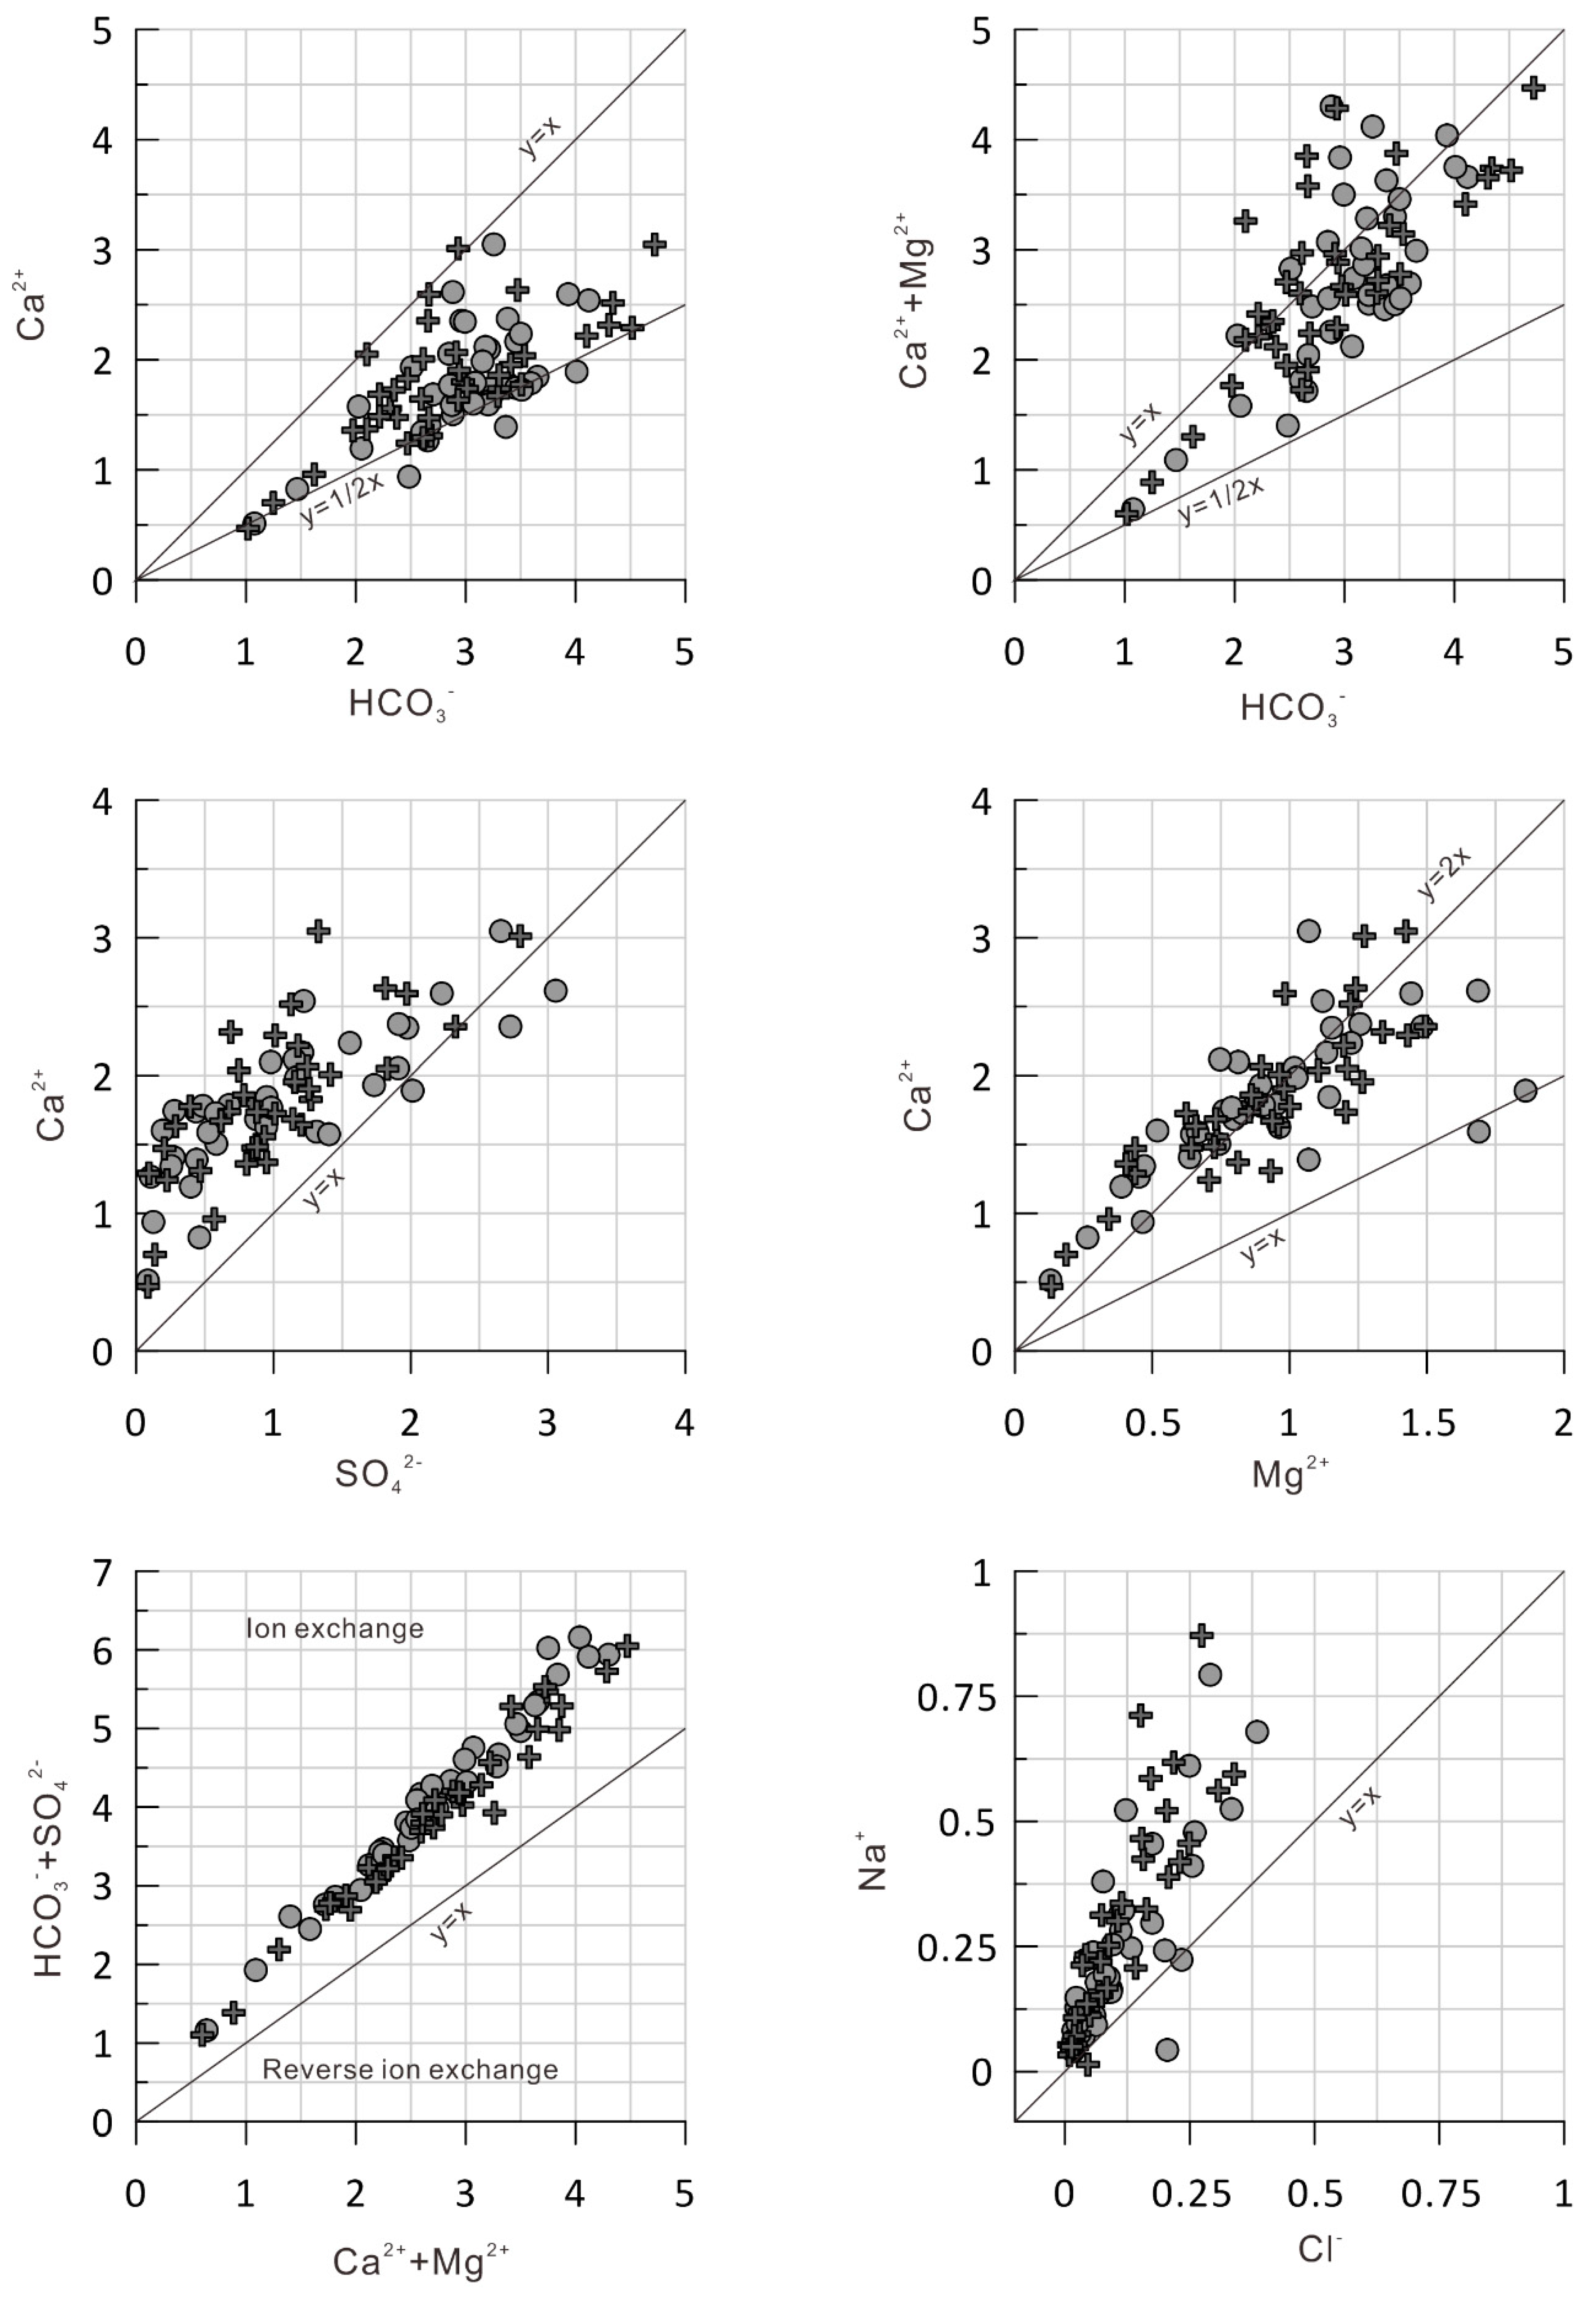
  • The analysis shows that the main ions in the water from the upper reaches of Syr Darya River and its tributaries in Kyrgyzstan, come from the bedrock, and the intensity of carbonate dissolution is higher than that of silicate weathering.
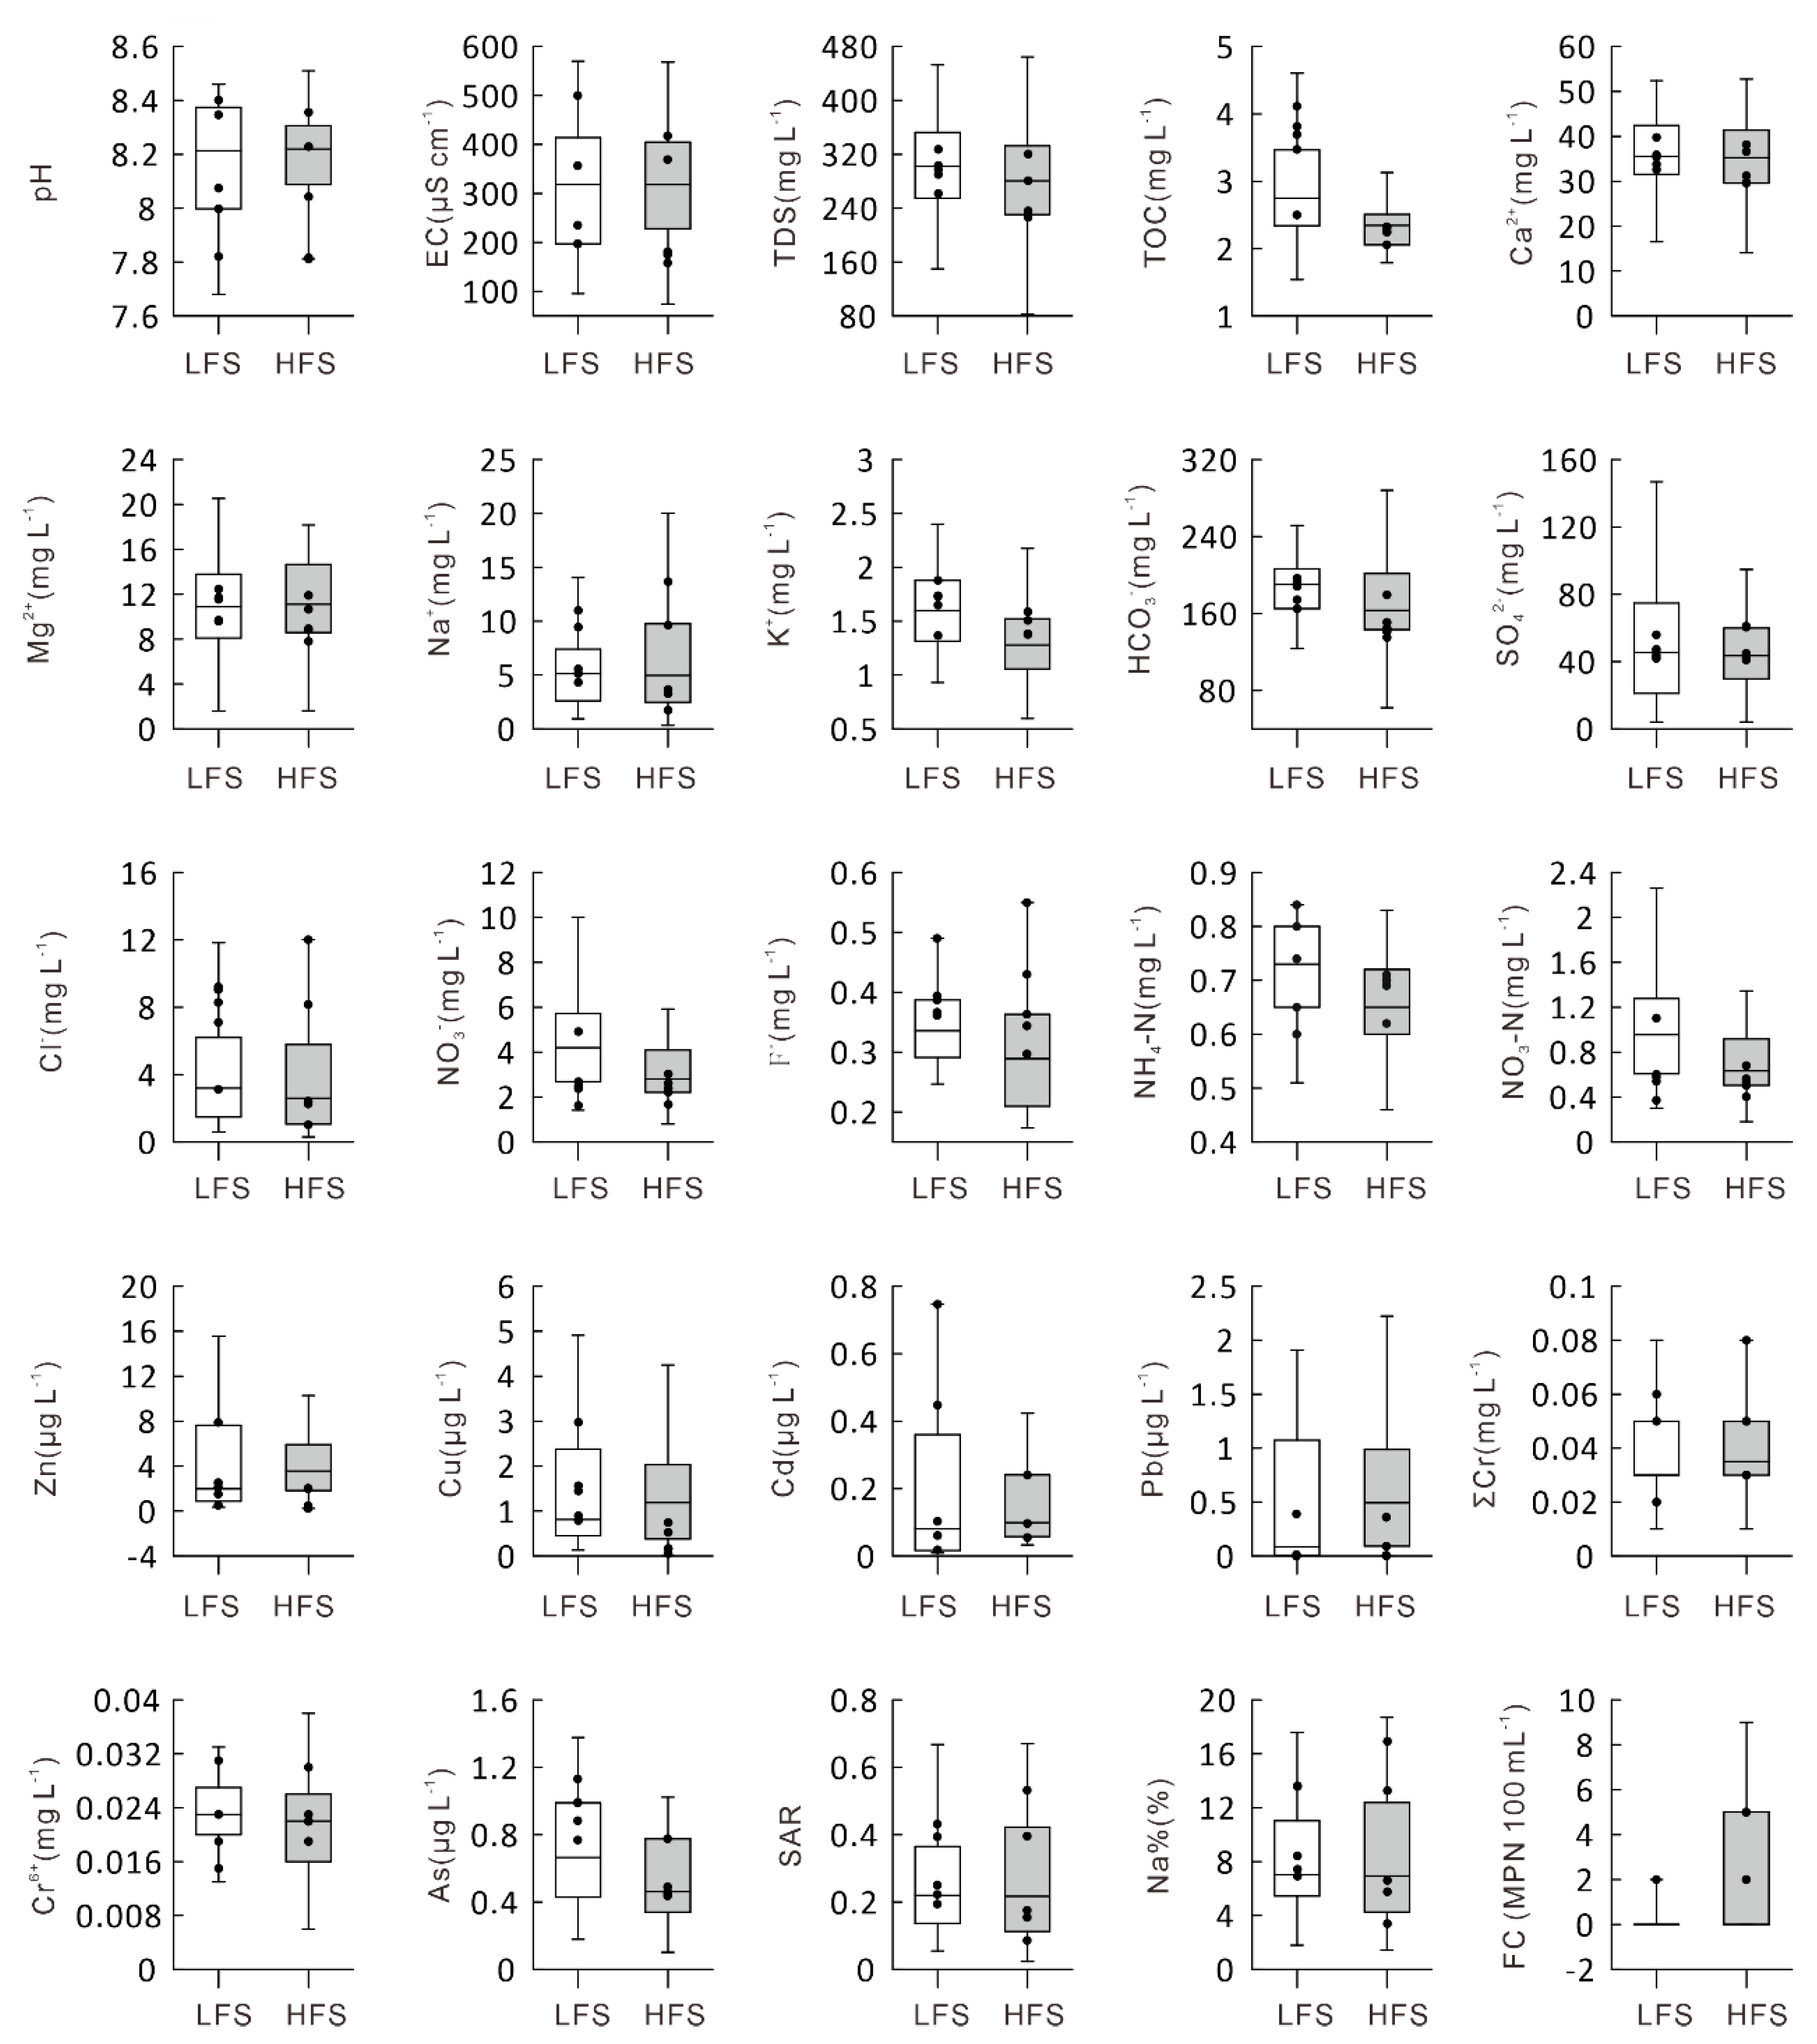
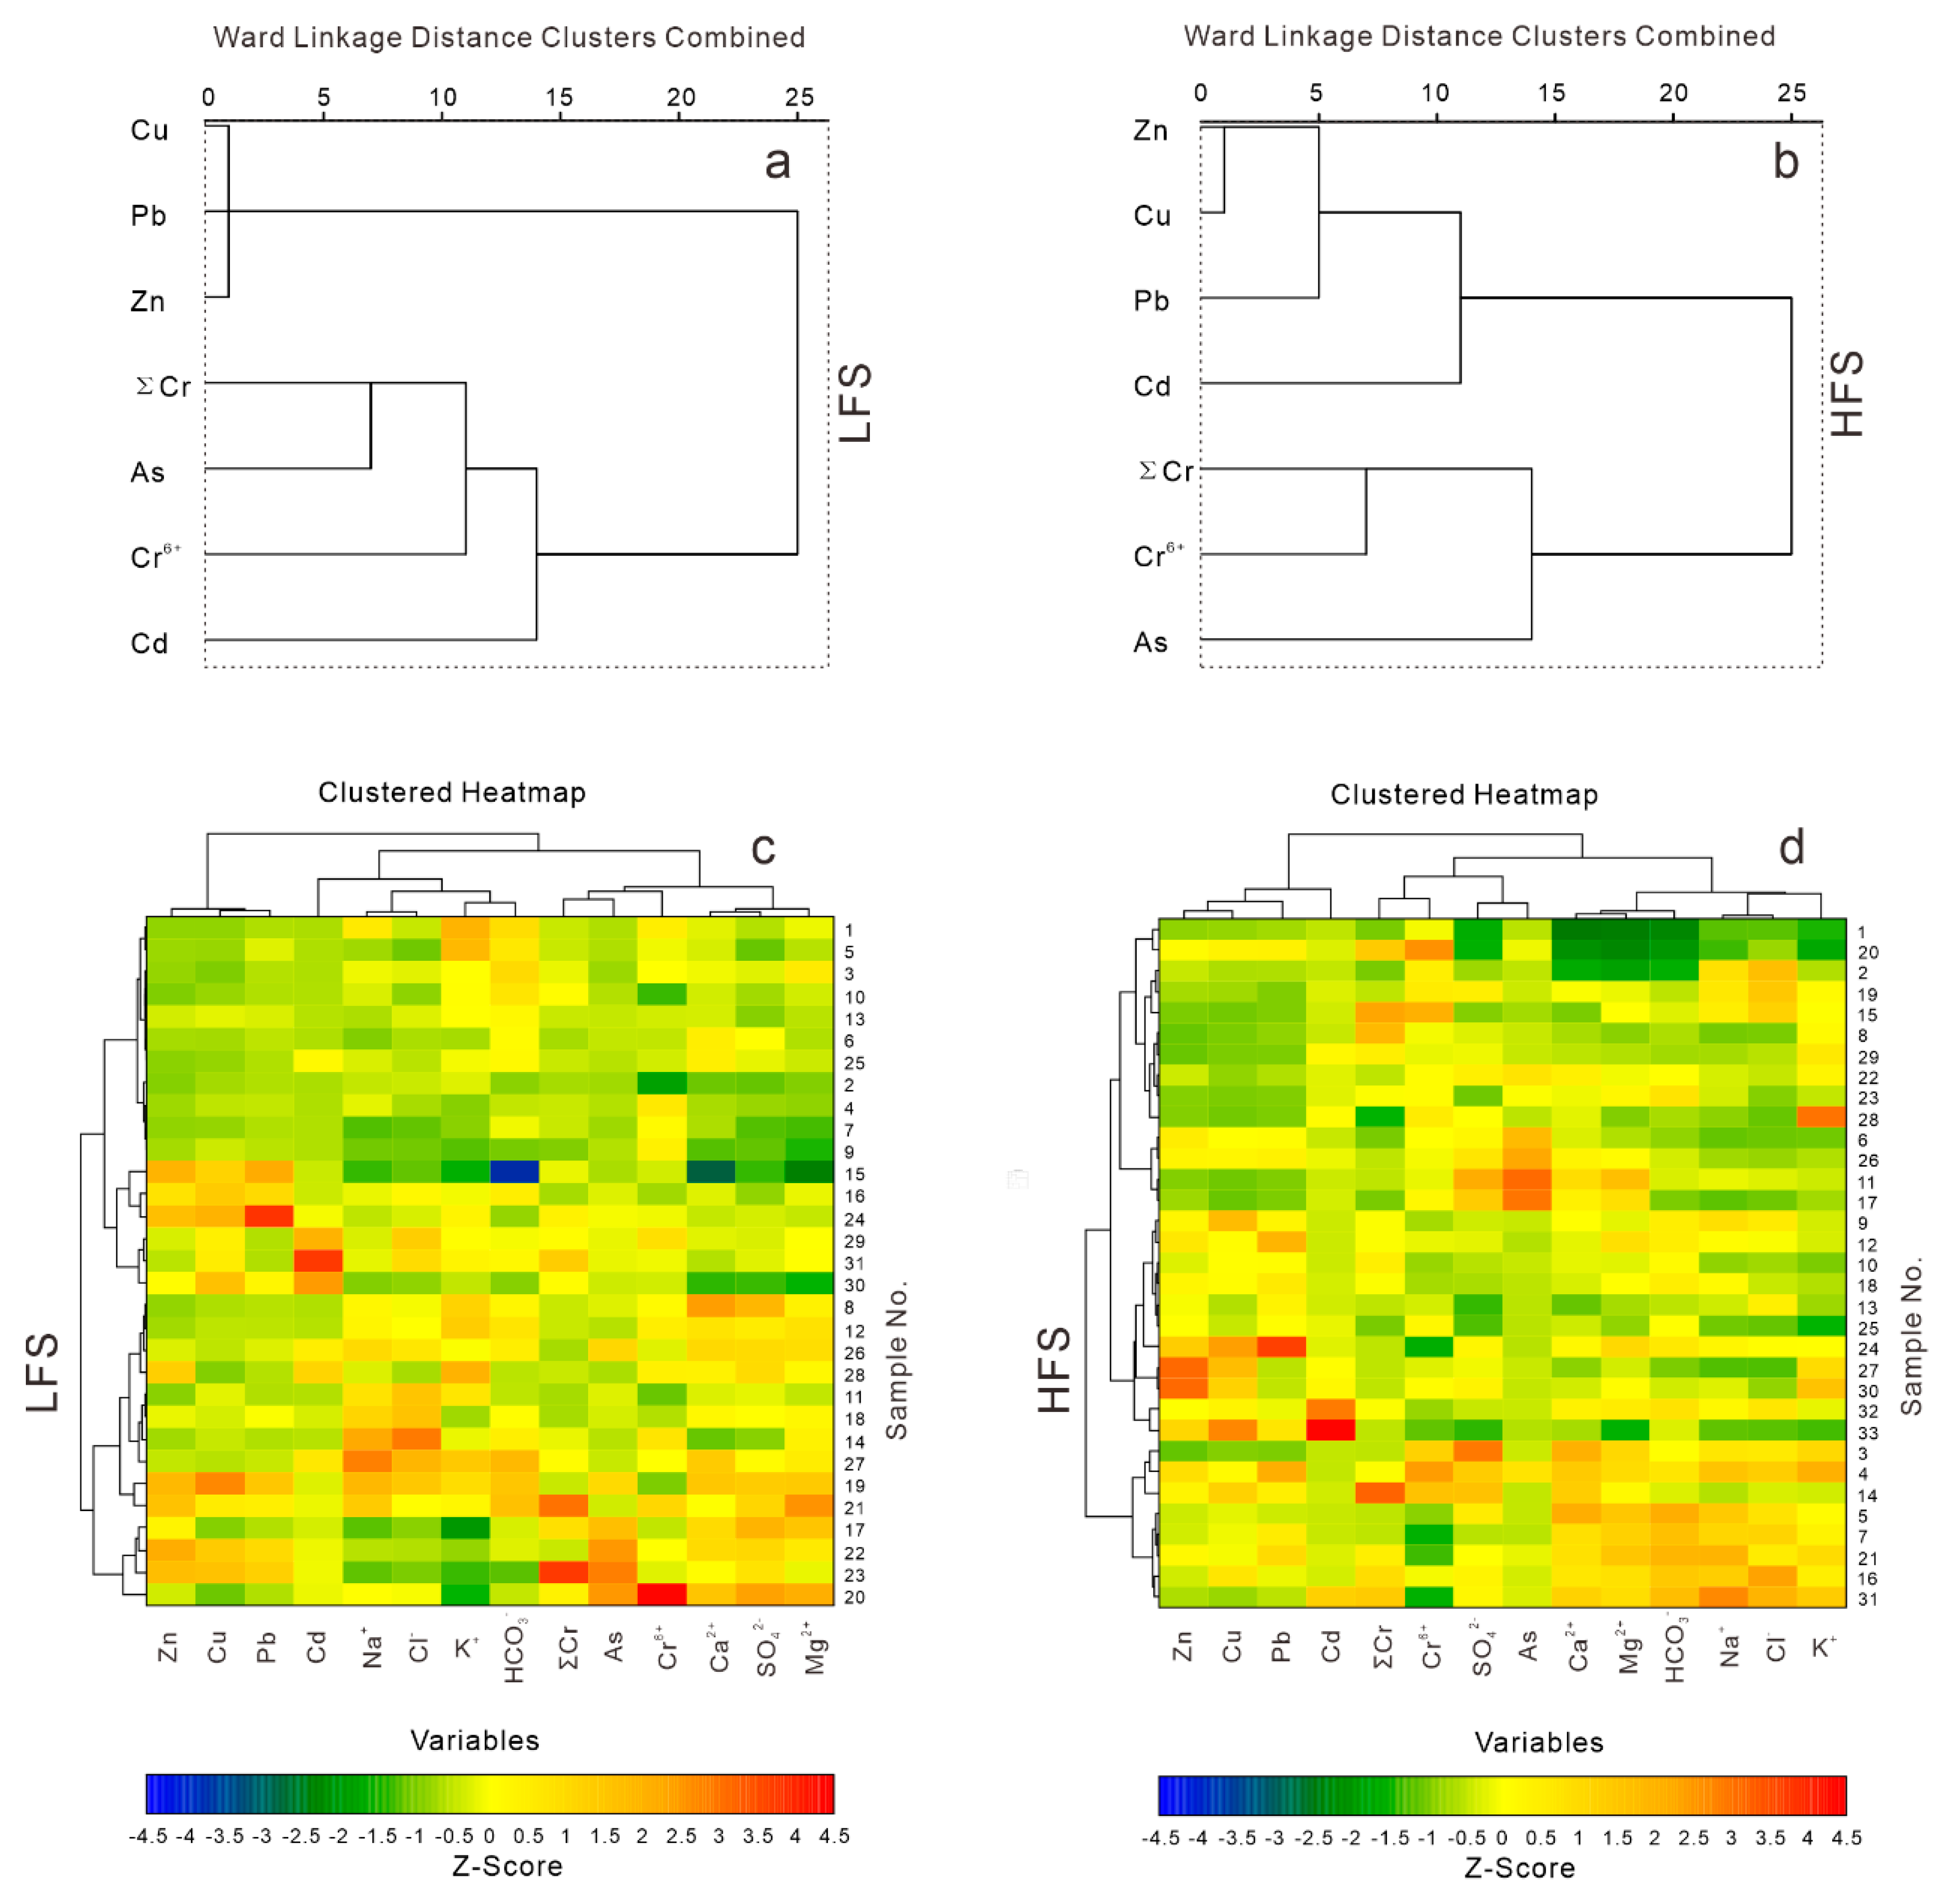
  • Human activities have had an impact on the water body, which is especially inferred from the indicators of the NH4-N concentration, FC contamination, and levels of potentially toxic elements. FC bacteria were detected in four river samples from the main channel of Syr Darya River (Naryn) and its tributaries during the LFS. However, FC bacteria were detected in 16 river samples from the main channel of Syr Darya River (Naryn) and its tributaries during the HFS. There may be anthropogenic intrusions of Cu, Pb, and Zn during the LFS period and of Cu, Pb, Zn, and Cd during the HFS period.
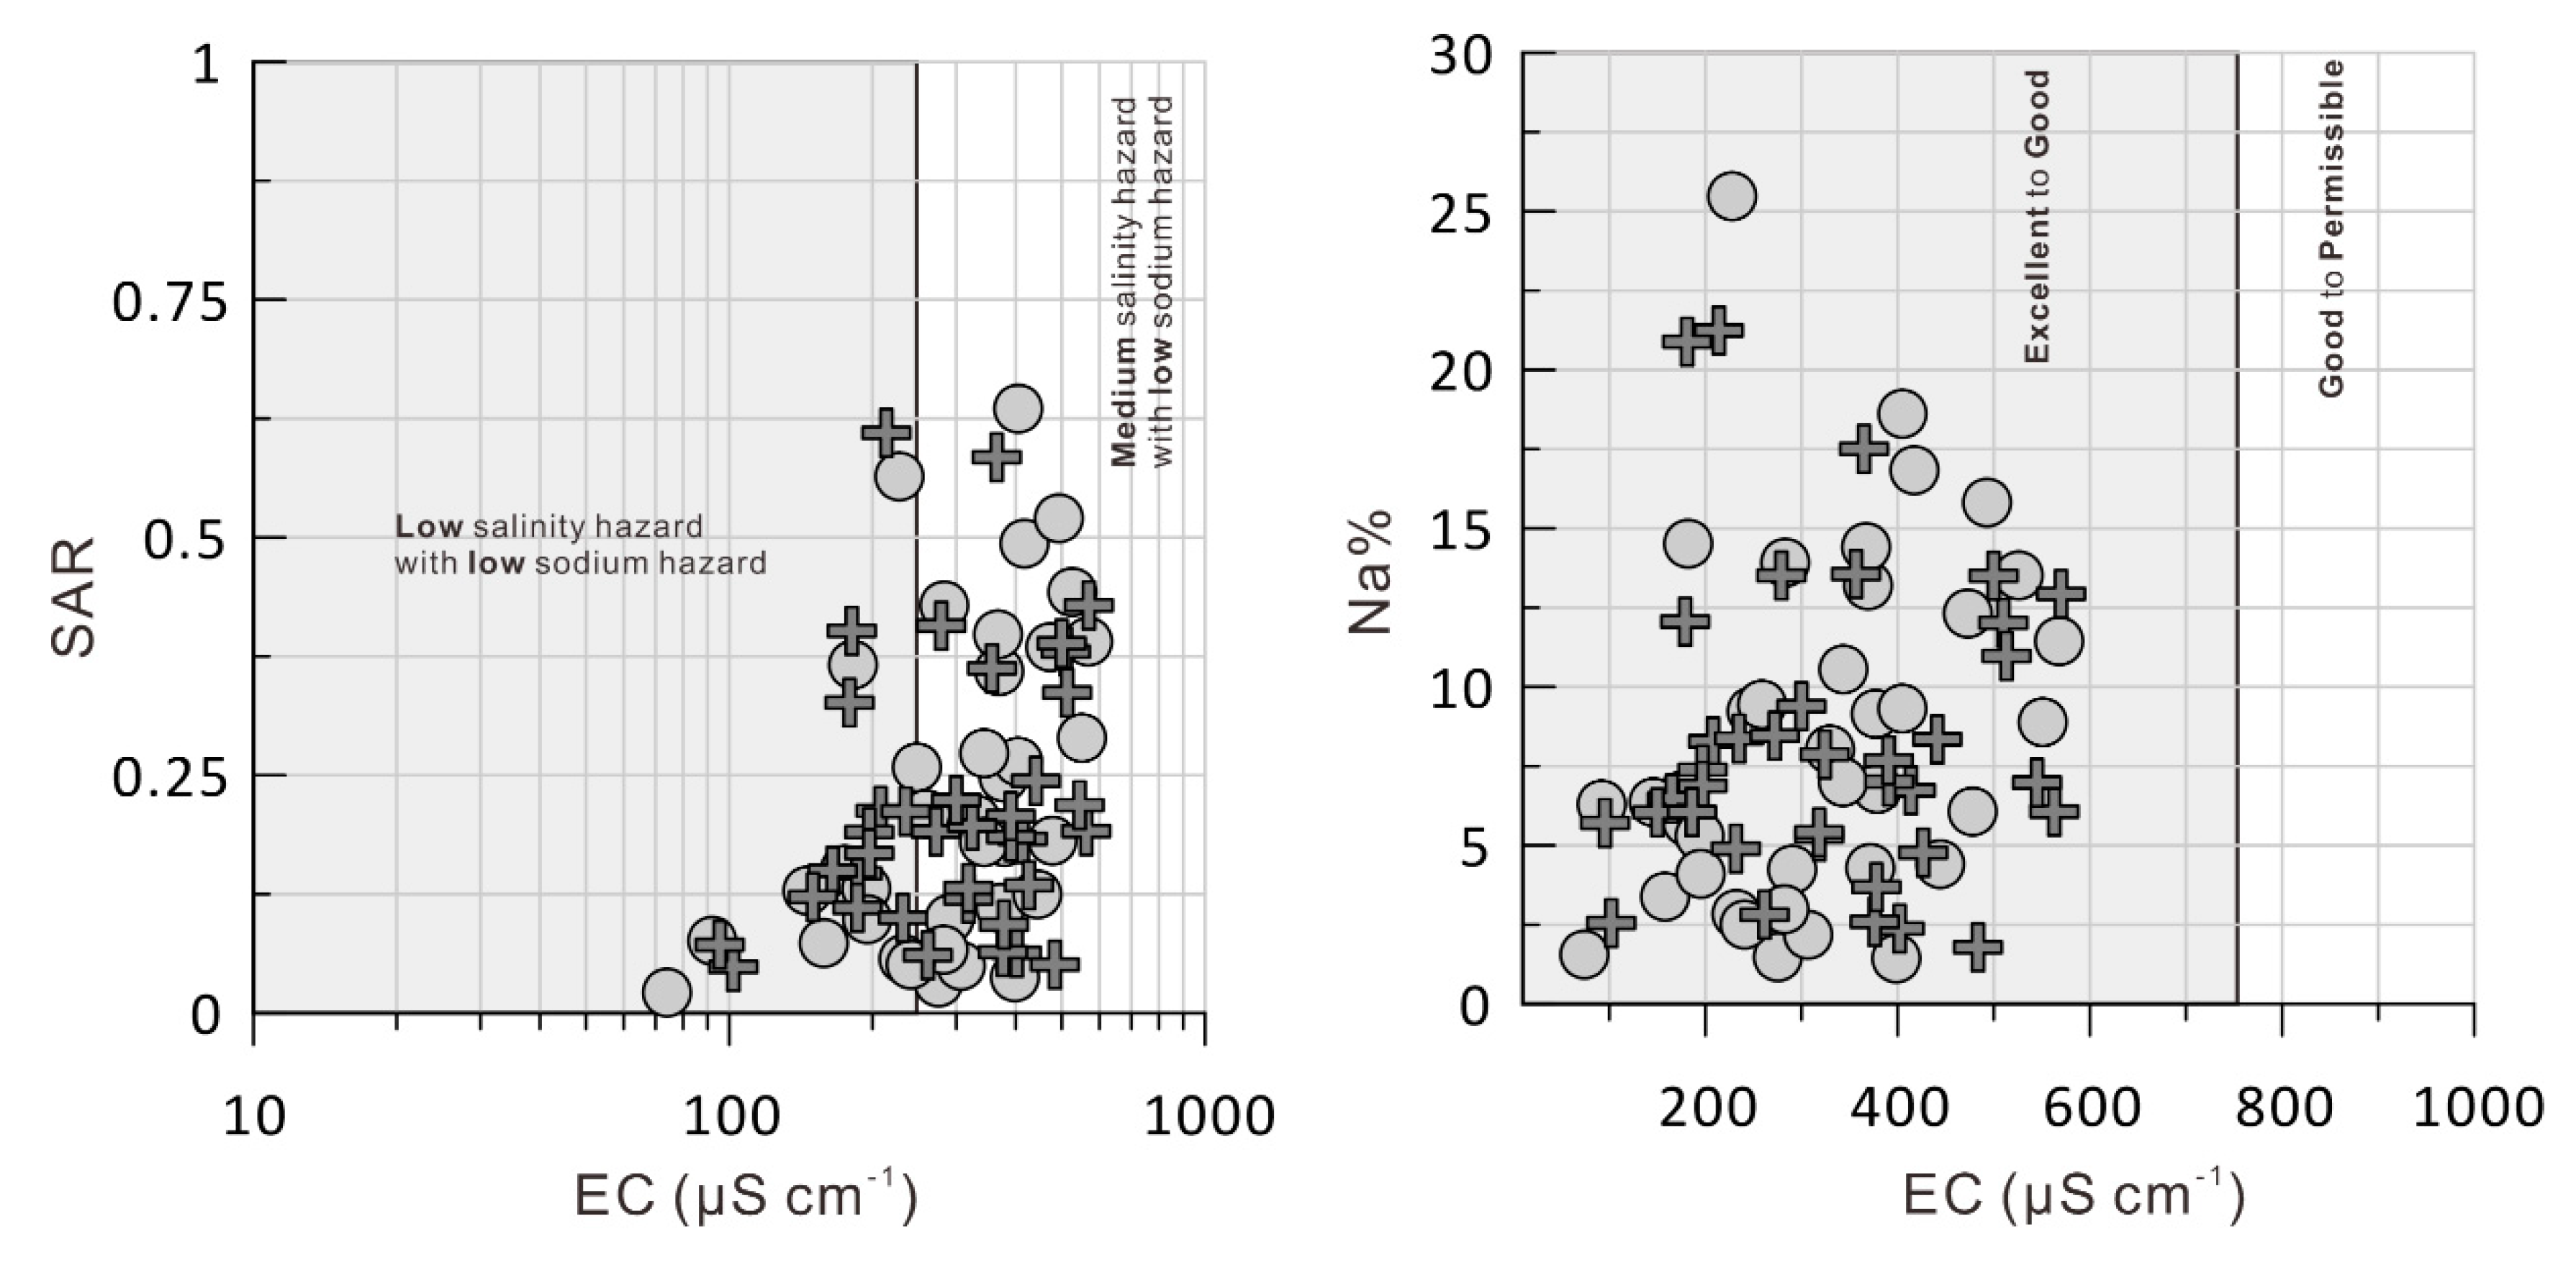
  • The contents of potentially toxic elements in the water from the parts of the Aral Sea Basin in Kyrgyzstan are lower than international drinking water standards, but there are clustering differences between the LFS and HFS periods. The water quality classification shows that the water samples fall in the excellent to good categories for irrigation use.

Supplementary Materials

The following are available online at https://www.mdpi.com/2073-4441/11/9/1893/s1, Table S1: The detailed information for sampling points.

Author Contributions

Formal analysis, L.M.; funding acquisition, J.A.; investigation, A.S. and S.M.; methodology, L.M. and Y.L.; project administration, Y.L.; writing—original draft, L.M.

Funding

This research is funded by the Strategic Priority Research Program of Chinese Academy of Sciences (XDA20060303), West Light Foundation of Chinese Academy of Sciences (2016-QNXZ-A-4), National Natural Science Foundation of China (U1603242), Tianshan Youth Program of Xinjiang Uygur Autonomous Region, China (2018Q008).

Acknowledgments

We acknowledge the Strategic Priority Research Program of Chinese Academy of Sciences, National Natural Science Foundation of China, and Youth Innovation Promotion Association, CAS.

Conflicts of Interest

The authors declare no conflict of interest.

References

  1. Micklin, P. The Aral Sea Disaster. Annu. Rev. Earth Planet. Sci. 2007, 35, 47–72. [Google Scholar] [CrossRef] [Green Version]
  2. Wurtsbaugh, W.A.; Miller, C.; Null, S.E.; DeRose, R.J.; Wilcock, P.; Hahnenberger, M.; Howe, F.; Moore, J. Decline of the world’s saline lakes. Nat. Geosci. 2017, 10, 816–821. [Google Scholar] [CrossRef]
  3. Wang, J.; Song, C.; Reager, J.T.; Yao, F.; Famiglietti, J.S.; Sheng, Y.; MacDonald, G.M.; Brun, F.; Schmied, H.M.; Marston, R.A.; et al. Recent global decline in endorheic basin water storages. Nat. Geosci. 2018, 11, 926–932. [Google Scholar] [CrossRef] [PubMed] [Green Version]
  4. Makkaveev, P.N.; Gordeev, V.V.; Zav’yalov, P.O.; Polukhin, A.A.; Khlebopashev, P.V.; Kochenkova, A.I. Hydrochemical Characteristics of the Aral Sea in 2012–2013. Water Resour. 2018, 45, 188–198. [Google Scholar] [CrossRef]
  5. Small, E.E.; Sloan, L.C.; Nychka, D. Changes in surface air temperature caused by desiccation of the Aral Sea. J. Clim. 2001, 14, 284–299. [Google Scholar] [CrossRef]
  6. Roy, S.B.; Smith, M.; Morris, L.; Orlovsky, N.; Khalilov, A. Impact of the desiccation of the Aral Sea on summertime surface air temperatures. J. Arid Environ. 2014, 110, 79–85. [Google Scholar] [CrossRef]
  7. Razakov, R.M.; Kosnazarov, K.A. Dust and salt transfer from the exposed bed of the Aral Sea and measures to decrease its environmental impact. In The Aral Sea Basin; Springer-Verlag: Berlin and Heidelberg, Germany, 1996; pp. 95–102. [Google Scholar]
  8. O’Hara, S.L.; Wiggs, G.F.S.; Mamedov, B.; Davidson, G.; Hubbard, R.B. Exposure to airborne dust contaminated with pesticide in the Aral Sea region. Lancet 2000, 355, 627–628. [Google Scholar] [CrossRef]
  9. Issanova, G.; Abuduwaili, J.; Galayeva, O.; Semenov, O.; Bazarbayeva, T. Aeolian transportation of sand and dust in the Aral Sea region. Int. J. Environ. Sci. Technol. 2015, 12, 3213–3224. [Google Scholar] [CrossRef] [Green Version]
  10. Schiemann, R.; Glazirina, M.G.; Schär, C. On the relationship between the Indian summer monsoon and river flow in the Aral Sea basin. Geophys. Res. Lett. 2007, 34, L05706. [Google Scholar] [CrossRef]
  11. Abdullaev, I.; Molden, D. Spatial and temporal variability of water productivity in the Syr Darya Basin, central Asia. Water Resour. Res. 2004, 40, W08S02. [Google Scholar] [CrossRef]
  12. Nezlin, N.P.; Kostianoy, A.G.; Lebedev, S.A. Interannual variations of the discharge of Amu Darya and Syr Darya estimated from global atmospheric precipitation. J. Mar. Syst. 2004, 47, 67–75. [Google Scholar] [CrossRef]
  13. Ismaiylov, G.K.; Fedorov, V.M.; Nezhad, S.D.S. Assessment of possible anthropogenic changes in the runoff of the Syr Darya River on the basis of a mathematical model. Water Resour. 2007, 34, 359–371. [Google Scholar] [CrossRef]
  14. Brun, F.; Berthier, E.; Wagnon, P.; Kääb, A.; Treichler, D. A spatially resolved estimate of High Mountain Asia glacier mass balances from 2000 to 2016. Nat. Geosci. 2017, 10, 668–673. [Google Scholar] [CrossRef] [PubMed]
  15. Kriegel, D.; Mayer, C.; Hagg, W.; Vorogushyn, S.; Duethmann, D.; Gafurov, A.; Farinotti, D. Changes in glacierisation, climate and runoff in the second half of the 20th century in the Naryn basin, Central Asia. Glob. Planet. Chang. 2013, 110, 51–61. [Google Scholar] [CrossRef]
  16. Sorg, A.; Mosello, B.; Shalpykova, G.; Allan, A.; Hill Clarvis, M.; Stoffel, M. Coping with changing water resources: The case of the Syr Darya river basin in Central Asia. Environ. Sci. Policy 2014, 43, 68–77. [Google Scholar] [CrossRef]
  17. Siegfried, T.; Bernauer, T. Estimating the performance of international regulatory regimes: Methodology and empirical application to international water management in the Naryn/Syr Darya basin. Water Resour. Res. 2007, 43, W11406. [Google Scholar] [CrossRef]
  18. Yao, J.Q.; Chen, Y.N. Trend analysis of temperature and precipitation in the Syr Darya Basin in Central Asia. Theor. Appl. Climatol. 2015, 120, 521–531. [Google Scholar] [CrossRef]
  19. Aizen, V.B.; Aizen, E.M.; Melack, J.M.; Dozier, J. Climatic and hydrologic changes in the Tien Shan, central Asia. J. Clim. 1997, 10, 1393–1404. [Google Scholar] [CrossRef]
  20. Sorg, A.; Bolch, T.; Stoffel, M.; Solomina, O.; Beniston, M. Climate change impacts on glaciers and runoff in Tien Shan (Central Asia). Nat. Clim. Chang. 2012, 2, 725–731. [Google Scholar] [CrossRef]
  21. Indoitu, R.; Kozhoridze, G.; Batyrbaeva, M.; Vitkovskaya, I.; Orlovsky, N.; Blumberg, D.; Orlovsky, L. Dust emission and environmental changes in the dried bottom of the Aral Sea. Aeolian Res. 2015, 17, 101–115. [Google Scholar] [CrossRef]
  22. Ge, Y.; Abuduwaili, J.; Ma, L.; Wu, N.; Liu, D. Potential transport pathways of dust emanating from the playa of Ebinur Lake, Xinjiang, in arid northwest China. Atmos. Res. 2016, 178, 196–206. [Google Scholar] [CrossRef]
  23. Gibbs, R.J. Mechanisms controlling world water chemistry. Science 1970, 170, 1088–1090. [Google Scholar] [CrossRef] [PubMed]
  24. Anderson, M.H.; Ensher, J.R.; Matthews, M.R.; Wieman, C.E.; Cornell, E.A. Mechanisms Controlling World Water Chemistry: Evaporation-Crystallization Process. Science 1971, 172, 870–872. [Google Scholar]
  25. Martinez, J.L.; Raiber, M.; Cox, M.E. Assessment of groundwater–surface water interaction using long-term hydrochemical data and isotope hydrology: Headwaters of the Condamine River, Southeast Queensland, Australia. Sci. Total Environ. 2015, 536, 499–516. [Google Scholar] [CrossRef] [PubMed]
  26. Pant, R.R.; Zhang, F.; Rehman, F.U.; Wang, G.; Ye, M.; Zeng, C.; Tang, H. Spatiotemporal variations of hydrogeochemistry and its controlling factors in the Gandaki River Basin, Central Himalaya Nepal. Sci. Total Environ. 2018, 622–623, 770–782. [Google Scholar] [CrossRef] [PubMed]
  27. Hill, A.F.; Minbaeva, C.K.; Wilson, A.M.; Satylkanov, R. Hydrologic Controls and Water Vulnerabilities in the Naryn River Basin, Kyrgyzstan: A Socio-Hydro Case Study of Water Stressors in Central Asia. Water 2017, 9, 325. [Google Scholar] [CrossRef]
  28. Kadyrzhanov, K.K.; Barber, D.S.; Solodukhin, V.P.; Poznyak, V.L.; Kazachevskiy, I.V.; Knyazev, B.B.; Lukashenko, S.N.; Khazhekber, S.; Betsill, J.D.; Passell, H.D. Radionuclide contamination in the Syrdarya river basin of Kazakhstan—Results of the Navruz Project. J. Radioanal. Nucl. Chem. 2005, 263, 197–205. [Google Scholar] [CrossRef]
  29. Alvarado, J.C.; Balsiger, B.; Röllin, S.; Jakob, A.; Burger, M. Radioactive and chemical contamination of the water resources in the former uranium mining and milling sites of Mailuu Suu (Kyrgyzstan). J. Environ. Radioact. 2014, 138, 1–10. [Google Scholar] [CrossRef]
  30. FAO. The Aral Sea Transboundaryriver Basin. 2012. Available online: www.fao.org/nr/water/aquastat/basins/aral-sea/aral.sea-CP_eng.pdf (accessed on 6 January 2019).
  31. FAO. Kyrgyzstan and Tajikistan: Expanding Finance in Rural Areas. 2006. Available online: http://www.fao.org/3/aj276r/aj276r00.pdf (accessed on 6 January 2019).
  32. Hartmann, J.; Moosdorf, N. The new global lithological map database GLiM: A representation of rock properties at the Earth surface. Geochem. Geophys. Geosyst. 2012, 13, Q12004. [Google Scholar] [CrossRef]
  33. FAO. Harmonized World Soil Database, version 1.2.; FAO: Rome, Italy; IIASA: Laxenburg, Austria, 2012. [Google Scholar]
  34. Akimaliev, D.A.; Zaurov, D.E.; Eisenman, S.W. The Geography, Climate and Vegetation of Kyrgyzstan. In Medicinal Plants of Central Asia: Uzbekistan and Kyrgyzstan; Eisenman, S.W., Zaurov, D.E., Struwe, L., Eds.; Springer: New York, NY, USA, 2013; pp. 1–3. [Google Scholar] [CrossRef]
  35. Seim, A.; Omurova, G.; Azisov, E.; Musuraliev, K.; Aliev, K.; Tulyaganov, T.; Nikolyai, L.; Botman, E.; Helle, G.; Dorado Liñan, I.; et al. Climate Change Increases Drought Stress of Juniper Trees in the Mountains of Central Asia. PLoS ONE 2016, 11, e0153888. [Google Scholar] [CrossRef]
  36. Chen, F.; Huang, W.; Jin, L.; Chen, J.; Wang, J. Spatiotemporal precipitation variations in the arid Central Asia in the context of global warming. Sci. China Ser. D Earth Sci. 2011, 54, 1812–1821. [Google Scholar] [CrossRef]
  37. Schiemann, R.; Lüthi, D.; Vidale, P.L.; Schär, C. The precipitation climate of Central Asia—Intercomparison of observational and numerical data sources in a remote semiarid region. Int. J. Climatol. 2007, 28, 295–314. [Google Scholar] [CrossRef]
  38. Burkhardt, S.; Zondervan, I.; Riebesell, U. Effect of CO2 concentration on C:N:P ratio in marine phytoplankton: A species comparison. Limnol. Oceanogr. 1999, 44, 683–690. [Google Scholar] [CrossRef]
  39. Talling, J.F. The Depletion of Carbon Dioxide from Lake Water by Phytoplankton. J. Ecol. 1976, 64, 79–121. [Google Scholar] [CrossRef]
  40. Sohail, M.; Adeloju, S.B. Nitrate biosensors and biological methods for nitrate determination. Talanta 2016, 153, 83–98. [Google Scholar] [CrossRef] [PubMed]
  41. Lambert, J.L.; Zitomer, F. Differential Colorimetric Determination of Nitrite and Nitrate lons. Anal. Chem. 1960, 32, 1684–1686. [Google Scholar] [CrossRef]
  42. Wu, C.; Wu, X.; Qian, C.; Zhu, G. Hydrogeochemistry and groundwater quality assessment of high fluoride levels in the Yanchi endorheic region, northwest China. Appl. Geochem. 2018, 98, 404–417. [Google Scholar] [CrossRef]
  43. Yidana, S.M.; Bawoyobie, P.; Sakyi, P.; Fynn, O.F. Evolutionary analysis of groundwater flow: Application of multivariate statistical analysis to hydrochemical data in the Densu Basin, Ghana. J. Afr. Earth Sci. 2018, 138, 167–176. [Google Scholar] [CrossRef]
  44. American Public Health Association. Standard Methods for the Examination of Water and Wastewater; American Public Health Association: Washington, DC, USA, 1995; Volume 21. [Google Scholar]
  45. Beauchemin, D.; Berman, S. Determination of trace metals in reference water standards by inductively coupled plasma mass spectrometry with on-line preconcentration. Anal. Chem. 1989, 61, 1857–1862. [Google Scholar] [CrossRef]
  46. Vu, C.T.; Lin, C.; Shern, C.-C.; Yeh, G.; Le, V.G.; Tran, H.T. Contamination, ecological risk and source apportionment of heavy metals in sediments and water of a contaminated river in Taiwan. Ecol. Indic. 2017, 82, 32–42. [Google Scholar] [CrossRef]
  47. Wilcox, L. Classification and Use of Irrigation Waters; USDA Circular No. 969.; United States Department of Agriculture: Washington, DC, USA, 1955; p. 19.
  48. Wang, X.; Ozdemir, O.; Hampton, M.A.; Nguyen, A.V.; Do, D.D. The effect of zeolite treatment by acids on sodium adsorption ratio of coal seam gas water. Water Res. 2012, 46, 5247–5254. [Google Scholar] [CrossRef] [PubMed]
  49. Zhang, B.; Song, X.; Zhang, Y.; Han, D.; Tang, C.; Yu, Y.; Ma, Y. Hydrochemical characteristics and water quality assessment of surface water and groundwater in Songnen plain, Northeast China. Water Res. 2012, 46, 2737–2748. [Google Scholar] [CrossRef] [PubMed]
  50. Piper, A.M. A graphic procedure in the geochemical interpretation of water-analyses. Eos Trans. Am. Geophys. Union 1944, 25, 914–928. [Google Scholar] [CrossRef]
  51. Roques, C.; Aquilina, L.; Boisson, A.; Vergnaud-Ayraud, V.; Labasque, T.; Longuevergne, L.; Laurencelle, M.; Dufresne, A.; de Dreuzy, J.R.; Pauwels, H.; et al. Autotrophic denitrification supported by biotite dissolution in crystalline aquifers: (2) transient mixing and denitrification dynamic during long-term pumping. Sci. Total Environ. 2018, 619–620, 491–503. [Google Scholar] [CrossRef]
  52. Chamier, J.; Wicht, M.; Cyster, L.; Ndindi, N.P. Aluminium (Al) fractionation and speciation; getting closer to describing the factors influencing Al3+ in water impacted by acid mine drainage. Chemosphere 2015, 130, 17–23. [Google Scholar] [CrossRef] [PubMed]
  53. Han, S.; Hu, Q.; Yang, Y.; Wang, J.; Wang, P.; Wang, Q. Characteristics and driving factors of drainage water in irrigation districts in arid areas. Water Resour. Manag. 2015, 29, 5323–5337. [Google Scholar] [CrossRef]
  54. McPhillips, L.E.; Creamer, A.E.; Rahm, B.G.; Walter, M.T. Assessing dissolved methane patterns in central New York groundwater. J. Hydrol. Reg. Stud. 2014, 1, 57–73. [Google Scholar] [CrossRef] [Green Version]
  55. Nguyen, T.T.; Kawamura, A.; Tong, T.N.; Nakagawa, N.; Amaguchi, H.; Gilbuena, R. Clustering spatio-seasonal hydrogeochemical data using self-organizing maps for groundwater quality assessment in the Red River Delta, Vietnam. J. Hydrol. 2015, 522, 661–673. [Google Scholar] [CrossRef]
  56. Li, S.; Xia, X.; Zhou, B.; Zhang, S.; Zhang, L.; Mou, X. Chemical balance of the Yellow River source region, the northeastern Qinghai-Tibetan Plateau: Insights about critical zone reactivity. Appl. Geochem. 2018, 90, 1–12. [Google Scholar] [CrossRef]
  57. Qu, B.; Zhang, Y.; Kang, S.; Sillanpää, M. Water quality in the Tibetan Plateau: Major ions and trace elements in rivers of the “Water Tower of Asia”. Sci. Total Environ. 2019, 649, 571–581. [Google Scholar] [CrossRef]
  58. Hajigholizadeh, M.; Melesse, A.M. Assortment and spatiotemporal analysis of surface water quality using cluster and discriminant analyses. Catena 2017, 151, 247–258. [Google Scholar] [CrossRef]
  59. Iqbal, M.; Khan, S.M.; Khan, M.A.; Ahmad, Z.; Ahmad, H. A novel approach to phytosociological classification of weeds flora of an agro-ecological system through Cluster, Two Way Cluster and Indicator Species Analyses. Ecol. Indic. 2018, 84, 590–606. [Google Scholar] [CrossRef]
  60. Maheshwari, R.C. Fluoride in drinking water and its removal. J. Hazard. Mater. 2006, 137, 456–463. [Google Scholar]
  61. Gao, Z.; Lin, Z.; Niu, F.; Luo, J.; Liu, M.; Yin, G. Hydrochemistry and controlling mechanism of lakes in permafrost regions along the Qinghai-Tibet Engineering Corridor, China. Geomorphology 2017, 297, 159–169. [Google Scholar] [CrossRef]
  62. van Geldern, R.; Schulte, P.; Mader, M.; Baier, A.; Barth, J.A.C.; Juhlke, T.R.; Lee, K. Insights into agricultural influences and weathering processes from major ion patterns. Hydrol. Process. 2018, 32, 891–903. [Google Scholar] [CrossRef] [Green Version]
  63. Zhang, Y.; Xu, M.; Li, X.; Qi, J.; Zhang, Q.; Guo, J.; Yu, L.; Zhao, R. Hydrochemical characteristics and multivariate statistical analysis of natural water system: A case study in Kangding County, Southwestern China. Water (Switzerland) 2018, 10, 80. [Google Scholar] [CrossRef]
  64. Yuan, J.; Xu, F.; Deng, G.; Tang, Y.; Li, P. Hydrogeochemistry of Shallow Groundwater in a Karst Aquifer System of Bijie City, Guizhou Province. Water 2017, 9, 625. [Google Scholar] [CrossRef]
  65. Walter, J.; Chesnaux, R.; Cloutier, V.; Gaboury, D. The influence of water/rock-water/clay interactions and mixing in the salinization processes of groundwater. J. Hydrol. Reg. Stud. 2017, 13, 168–188. [Google Scholar] [CrossRef]
  66. Kanagaraj, G.; Elango, L. Hydrogeochemical processes and impact of tanning industries on groundwater quality in Ambur, Vellore district, Tamil Nadu, India. Environ. Sci. Pollut. Res. 2016, 23, 24364–24383. [Google Scholar] [CrossRef]
  67. Zhang, T.; Pu, J.; Li, J.; Yuan, D.; Li, L. Stable isotope and aquatic geochemistry of a typical subtropical karst subterranean stream in southwest China. Carbonates Evaporites 2017, 32, 415–430. [Google Scholar] [CrossRef]
  68. Tallon, P.; Magajna, B.; Lofranco, C.; Leung, K.T. Microbial Indicators of Faecal Contamination in Water: A Current Perspective. Water Air Soil Pollut. 2005, 166, 139–166. [Google Scholar] [CrossRef]
  69. WHO. Guidelines for Drinking-Water Quality, Fourth Editon. 2011. Available online: http://whqlibdoc.who.int/publications/2011/9789241548151_eng.pdf (accessed on 6 January 2019).
  70. EU. Council Directive 98/83/EC on the Quality of Water Intended for Human Consumption. 1998. Available online: https://eur-lex.europa.eu/legal-content/EN/TXT/PDF/?uri=CELEX:31998L0083 (accessed on 6 January 2019).
  71. USEPA. National Primary Drinking Water Regulations; United States Environmental Protection Agency: Washington, DC, USA, 2009.
  72. Ministry of Health of the People’s Republic of China; Standardization Administration of the People’s Republic of China. China National Standards for Drinking Water Quality; GB5749-2006; Ministry of Health of the People’s Republic of China, Standardization Administration of the People’s Republic of China: Beijing, China, 2006. [Google Scholar]
  73. Wegerich, K.; Van Rooijen, D.; Soliev, I.; Mukhamedova, N. Water Security in the Syr Darya Basin. Water 2015, 7, 4657–4684. [Google Scholar] [CrossRef] [Green Version]
  74. Nikanorova, A.; Dronin, N. Optimal Future for the Irrigation Agriculture Under Climate Change in the Fergana Valley, Central Asia. Res. Artic. 2017, 3, 555607. [Google Scholar] [CrossRef]
  75. Bichsel, C. Conflict Transformation in Central Asia: Irrigation Disputes in the Ferghana Valley; Routledge: London, UK, 2009; Volume 14. [Google Scholar]
  76. Gu, X.; Xiao, Y.; Yin, S.; Hao, Q.; Liu, H.; Hao, Z.; Meng, G.; Pei, Q.; Yan, H. Hydrogeochemical Characterization and Quality Assessment of Groundwater in a Long-Term Reclaimed Water Irrigation Area, North China Plain. Water 2018, 10, 1209. [Google Scholar] [CrossRef]
Figure 1. Geographical location of the study area (a) and distribution of the sampling points (b). The detailed information for sampling points is provided in the Supplementary Materials (Table S1).
Water 11 01893 g001
Figure 2. Hydrochemistry of the river water samples from the upper reaches of the Syr Darya River system during the high-flow season (HFS) period (filled with a black color, n = 38) and the low-flow season (LFS) period (filled with a white color, n = 38). The data of the main channel of Syr Darya River were marked with solid dots.
Water 11 01893 g002
Figure 3. Gibbs and mixing diagrams for the water samples from the upper reaches of Syr Darya River and its tributaries, Aral Sea Basin. The grey dots represent the water samples collected during the low-flow season (LFS) and the black crosses are those collected during the high-flow season (HFS).
Water 11 01893 g003
Figure 4. Piper diagram for the water samples from the upper reaches of Syr Darya River and its tributaries.
Water 11 01893 g004
Figure 5. Diagram of the major ion relations for the water samples from the upper reaches of Syr Darya River and its tributaries. The grey dots are the water samples collected during the low-flow season (LFS) and the black crosses are those collected during the high-flow season (HFS).
Water 11 01893 g005
Figure 6. Dendrograms of the hierarchical clustering of the potentially toxic elements ((a) for LFS period and (b) for HFS period) and two-way cluster analysis of the river water samples and chemical compositions ((c) for LFS period and (d) for HFS period).
Water 11 01893 g006
Figure 7. The standards of the USSL diagram (sodium absorption ratio (SAR) vs. electrical conductivity (EC)) and Wilcox diagram (%Na vs. EC) for assessing the water quality for irrigation use. The grey dots are the water samples collected during the low-flow season (LFS) and the black crosses are those collected during the high-flow season (HFS).
Water 11 01893 g007
Table 1. Comparison of the measured toxic elements concentration and different world standards for drinking water quality.
Potentially Toxic ElementsMaximum of ConcentrationsStandards for Drinking Water Quality from Different Countries and Organizations
LFS (mg L−1)HFS (mg L−1)World Health Organization (mg L−1)European Union (mg L−1)United States (mg L−1)China (mg L−1)
Zn0.0160.0103.0/5.01.0
Cu0.00490.00431.02.01.31.0
Pb0.00190.00220.010.010.0150.01
Cd0.000750.000420.0030.0050.0050.005
As0.00140.00100.010.010.010.01
Cr6+0.0330.0380.050.050.10.05

