Article

Multi-Objective Optimal Scheduling Model of Dynamic Control of Flood Limit Water Level for Cascade Reservoirs

School of Hydropower and Information Engineering, Huazhong University of Science and Technology, Wuhan 430074, Hubei, China
*
Author to whom correspondence should be addressed.
Water 2019, 11(9), 1836; https://doi.org/10.3390/w11091836
Submission received: 9 August 2019 / Revised: 30 August 2019 / Accepted: 2 September 2019 / Published: 4 September 2019
(This article belongs to the Section Water Resources Management, Policy and Governance)

Abstract

:
Reservoirs play a significant role in water resources management and water resource allocation. Traditional flood limited water level (FLWL) of reservoirs is set as a fixed value which over-considers the reservoir flood control and limits the benefits of reservoirs to a certain extent. However, the dynamic control of the reservoir FLWL is an effective solution. It is a method to temporarily increase the water level of the reservoir during the flood season by using forecast information and discharge capacity, and it can both consider flood control and power generation during the flood season. Therefore, this paper focuses on multi-objective optimal scheduling of dynamic control of FLWL for cascade reservoirs based on multi-objective evolutionary algorithm to get the trade-off between flood control and power generation. A multi-objective optimal scheduling model of dynamic control of FLWL for cascade reservoirs which contains a new dynamic control method is developed, and the proposed model consists of an initialization module, a dynamic control programming module and an optimal scheduling module. In order to verify the effectiveness of the model, a cascade reservoir consisting of seven reservoirs in the Hanjiang Basin of China were selected as a case study. Twenty-four-hour runoff data series for three typical hydrological years were used in this model. At the same time, two extreme schemes were chosen for comparison from optimized scheduling schemes. The comparison result showed that the power generation can be increased by 9.17 × 10⁸ kW·h (6.39%) at most, compared to the original design scheduling scheme, while the extreme risk rate also increased from 0.1% to 0.268%. In summary, experimental results show that the multi-objective optimal scheduling model established in this study can provide decision makers with a set of alternative feasible optimized scheduling schemes by considering the two objectives of maximizing power generation and minimizing extreme risk rate.

1. Introduction

Water resources are one of the most indispensable resources in human life. Excess water resources will lead to flood disasters, while shortages in water resources will lead to drought disasters [1,2]. Reservoirs are one of the most efficient measures to solve the problem of the uneven distribution of water resources in time and space and it has become the most significant infrastructure for allocating water resources among various purposes [3,4,5]. While distributing water resources, the reservoirs also undertake many other tasks, such as flood control, shipping, power generation, irrigation and recreation [6,7,8,9,10]. Therefore, it is of great significance to ensure the comprehensive utilization of water resources while ensuring the flood control requirements of the reservoir during the flood season.
In the flood season, the water level of reservoirs cannot be kept too high due to the possibility that large floods may occur, while the water level of the reservoir cannot be kept too low due to water storage requirements [11,12]. The flood limited water level (FLWL) is one of the most important characteristic parameters of a reservoir and it can make an effective compromise between water storage and flood control [13,14]. During the flood season, the water level of the reservoir must be maintained below the limit water level in order to reserve adequate flood storage capacity. After the flood peak passes and begins to recede, the water level of reservoirs must be lowered to the FLWL as quickly as possible in order to provide sufficient storage for the next flood. The currently designed approach is called static control of FLWL (SC-FLWL) [15], and the scheduling mode is called FLWL static control mode. The SC-FLWL is further divided into static control of annual FLWL (SC-AFLWL) and static control of seasonal FLWL (SC-SFLWL) according to different FLWL determination methods. The FLWL of SC-AFLWL is determined using the annual design storm or annual design flood through reservoir regulation, while the FLWL of SC-SFLWL is determined using the seasonal design storm or seasonal design flood through reservoir regulation. Liu et al. [16] proposed a simulation-based optimal seasonal FLWL model to maximize power generation benefits under the promise of not increasing the original design risk. The results show that the seasonal FLWL model can be applied to get more economic benefits than the SC-AFLWL without increasing the original design risk. Yun and Singh [17] proposed that there are two approaches to improve reservoir water storage under the condition of flood control safety. One is a multiple duration limiting water level, which is similar to seasonal FLWL because it estimates FLWL by using a multiple duration design storm. And the other is dynamic control of FLWL (DC-FLWL), in which the water level of the reservoir can fluctuate between the upper limit and the lower limit of dynamic control domain.
The dynamic control bound of reservoir FLWL is the basis of reservoir FLWL dynamic control mode. It is significant to estimate a feasible control bound of FLWL because it can avoid the following two undesirable situations: “FLWL is too low on account of enhancing flood prevention capacity” and “FLWL is too high on account of increasing conservation benefits” [15]. Li et al. [18] proposed a dynamic control operation model of the FLWL which considers the uncertainty of inflow forecasting and flood hydrograph shape. The model consists of a pre-release module, a refill operation module and a risk analysis module and it is used in the Three Gorges reservoir. The results indicate that the FLWL dynamic control mode of the reservoir can increase power generation and the water resource utilization rate without increasing the risk of flood control. With further research, the DC-FLWL has developed from a single reservoir to cascade reservoirs. Chen et al. [15] presented a simulation-based optimization model of DC-FLWL for cascade reservoirs which consists of an aggregation module, a storage decomposition module and a simulation operation module. The results indicate that the model with an objective of maximize power generation can improve the benefits of the Qingjiang cascade reservoirs without reducing the flood control standard. After combining the above two models, Zhou et al. [19] proposed a mixed reservoir system by extending the dynamic control models of FLWL for a single reservoir and cascade reservoirs. The model contains three dynamic control operation modules, a module for a single reservoir, a module for cascade reservoirs and a module for mixed cascade reservoir systems. The results show that the model with an objective of maximize power generation can make an effective trade-off between power generation and flood control of the Three Gorges reservoir and the Qingjiang cascade reservoirs without compromising flood prevention objectives.
In previous studies on DC-FLWL, most models consider only a single objective, such as maximizing power generation or minimizing risk rate. However, in actual scheduling, it is difficult to effectively reflect on the complex requirements of flood control and power generation by considering only a single target. Therefore, it is recommended to construct a multi-objective optimization scheduling model that considers both flood protection and power generation requirements to provide a more abundant scheduling scheme for decision makers. In this study, a multi-objective optimal scheduling model of DC-FLWL for cascade reservoirs which contains a new dynamic control method has been developed to obtain a set of alternative and feasible optimized scheduling schemes by considering the two objectives of maximizing power generation and minimizing extreme risk rate. The cascade reservoir consisting of seven reservoirs in the Hanjiang Basin of China was selected as the case study. Major contributions are outlined as follows:
(1) A multi-objective optimal scheduling model of DC-FLWL for cascade reservoirs with two objectives is formulated, which contains maximizing power generation objective and minimizing extreme risk rate objective.
(2) A new dynamic control method of DC-FLWL with four submodules is proposed, which contains normal operation submodule, flood retention and refill submodule, adaptive grading pre-release submodule and flood control dispatching submodule. The method mainly focuses on small and medium floods.
(3) Non-dominated sorting culture differential evolution algorithm (NSCDE) is used to solve the multi-dimension, multi-objective and multi-stage optimization problem: a case study of seven reservoirs in the Hanjiang Basin of China.
The remainder of this paper is organized as follows. In Section 2, a multi-objective optimal scheduling model of DC-FLWL for cascade reservoirs is formulated. In Section 3, the Hanjiang Basin, related data and algorithm parameter are introduced in detail. In Section 4, the optimization results are compared and analyzed. Finally, Section 5 concludes the study.

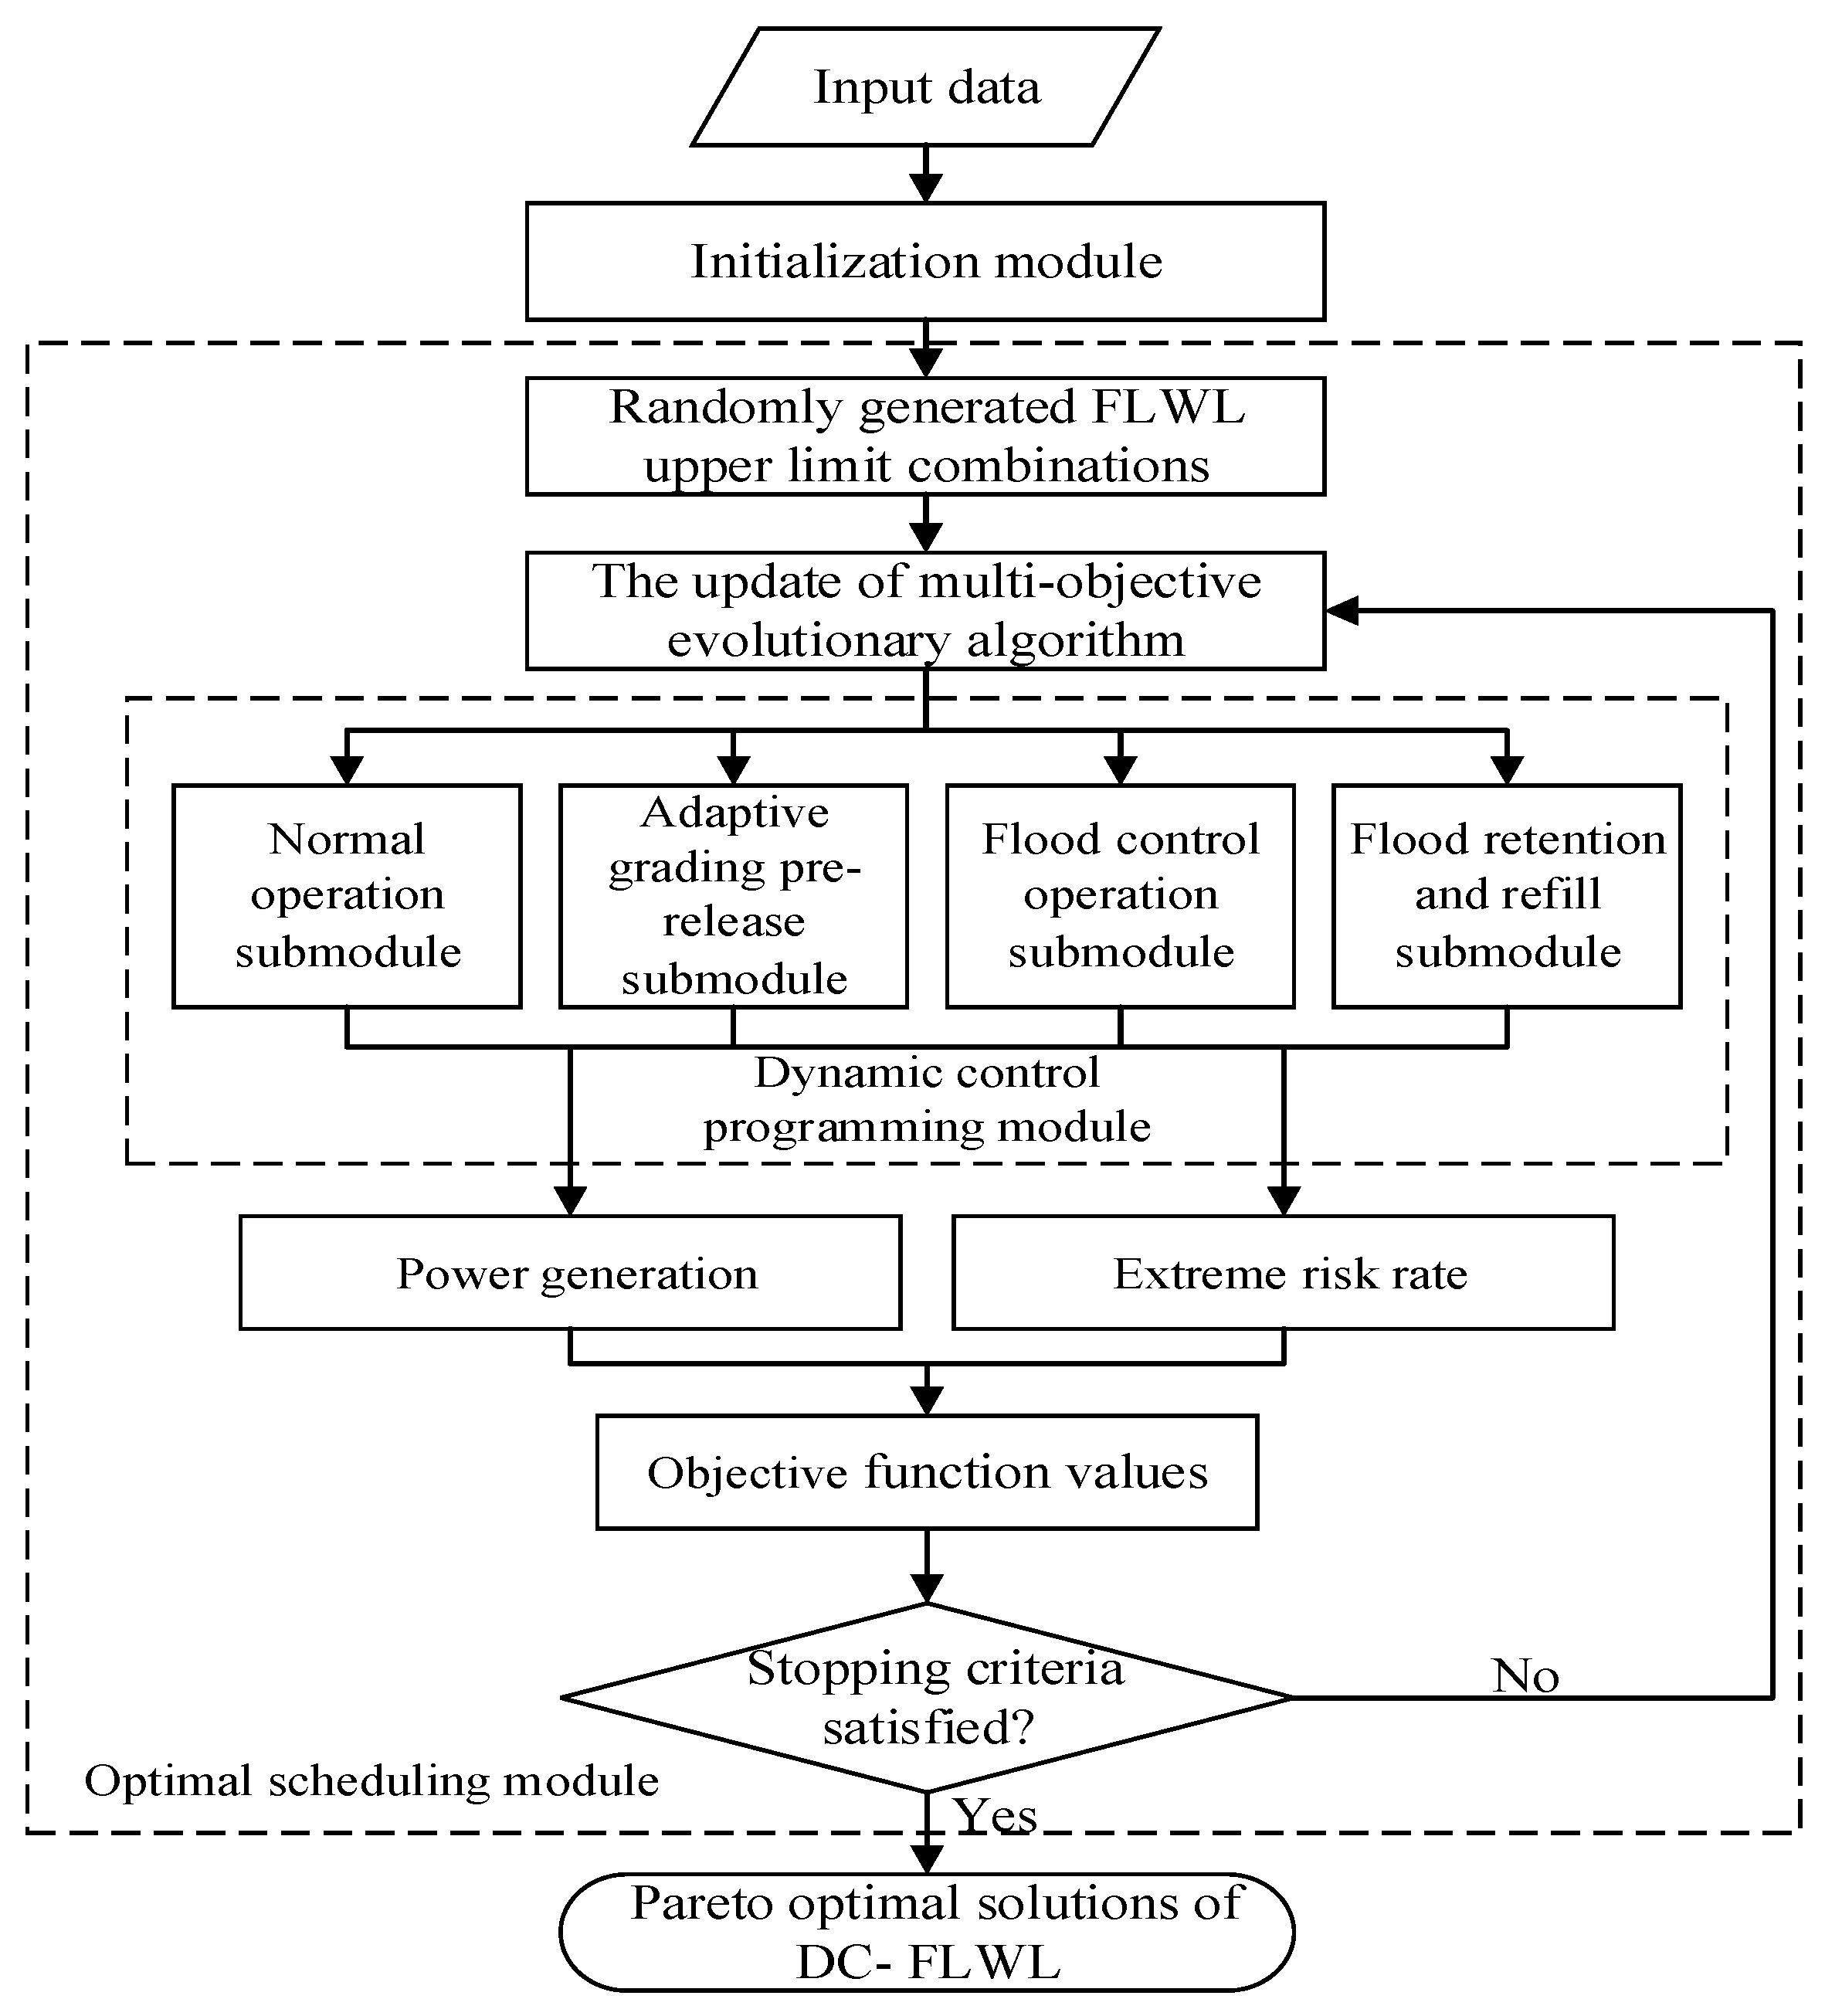
2. Multi-Objective Optimal Scheduling Model of DC-FLWL for Cascade Reservoirs

The general framework of multi-objective optimal scheduling model of DC-FLWL for cascade reservoirs is shown in Figure 1. The model proposed in this paper consists of three modules: (1) an initialization module based on the capacity-constrained pre-release method; (2) an optimal scheduling module based on the multi-objective evolutionary algorithm; and (3) a dynamic control programming module. The first module was used to determine the dynamic control bound of reservoirs which is operated in FLWL dynamic control mode. The second module was used to optimize the combinations of the upper limit of FLWL in cascade reservoirs by constantly updating in order to maximize the power generation of cascade reservoirs while minimizing the average risk rate of cascade reservoirs. The third module was used to determine the scheduling schemes of each reservoir and was operated in FLWL dynamic control mode in cascade reservoirs.

2.1. Initialization Module

As the first module of this model, the initialization module has a pivotal position. The initialization module is used to determine the dynamic control bound of reservoirs which is operated in FLWL dynamic control mode based on the inflow forecast information.
The dynamic control bound of reservoir FLWL is the basis of the reservoir FLWL dynamic control mode. The FLWL static control mode can be regarded as a special case where the upper and lower limits of the dynamic control bound are equal in the FLWL dynamic control mode. This paper employs the capacity-constrained pre-release method to determine the dynamic control bound of reservoirs operated in the FLWL dynamic control mode [18]. The capacity-constrained pre-release method determines the upper limit of dynamic control bound by considering the effective lead-time of inflow forecasting, the inflow forecasting error and the safety discharge of the downstream flood protection site, and original design FLWL is used as the lower limit of dynamic control bound, i.e.,
V u = V d + t 0 t 0 + T p Q i n ( t ) d t Q max T p
Z u = f ( V u )
where, Z u is the upper limit of dynamic control bound; V u is the reservoir storage corresponding to Z u ; V d is the reservoir storage corresponding to the original design FLWL; Q i n ( t ) is the forecasted inflow; Q max is the maximum safety discharge of downstream flood protection site; t 0 is the current time; T p is the effective lead-time of inflow forecasting; f ( * ) is the relationship between reservoir water level and storage.

2.2. Optimal Scheduling Module

After the determination of the dynamic control bound, this module is used to find out a series of optimal combinations of the upper limit of FLWL in the cascade reservoir that can make a good trade-off between the economic benefits of hydropower generation and risk rate of flood control. In this module, the optimal scheduling model of dynamic control of FLWL for a cascade reservoir with multi-objectives and several constraints is formulated.

2.2.1. Objective Function

The target of FLWL dynamic control is to get more economic benefit with minimal risk, in which many constraints and objectives should be taken into consideration. The objectives of this model are expressed in detail as follows:
(1) Maximizing the joint power generation of the cascade reservoirs:
max F 1 = max t = 1 T i = 1 L N i ( t ) Δ t ,   N i ( t ) = K i Q x , i ( t ) H i ( t )
where N i ( t ) is the output of the i-th reservoir in period t; Q x , i ( t ) is the release discharge for power generation of the i-th reservoir in period t; H i ( t ) is the net water head of the i-th reservoir in period t; K i is the hydropower generation efficiency of the i-th reservoir; Δ t is the operation interval; T is the number of periods; L is the number of reservoirs in the cascade reservoir.
(2) Minimizing the average extreme risk rate of reservoirs which are operated in the FLWL dynamic control mode [20]:
min F 2 = min i = 1 D R i ( Z c , Z d ) D ,   R i ( Z c , Z d ) = p { ϕ ( Z m Z d ) | ϕ ( Z c ) }
where Z c is the start water level of flood routing; this paper selects the upper limit of the FLWL as the start water level of flood routing; Z d is the allowable highest water lever, the value of Z d (risk controlling index) may be one of the check flood level, design flood level and the top elevation of the dam. The risk is variational with different Z d value, this paper selects the design flood level as risk controlling index; D is the number of reservoirs which are operated in FLWL dynamic control mode; ϕ ( Z c ) is the event that a certain frequency design flood regulated from Z c ; Z m is the highest value of the reservoir’s water level though the flood routing; ϕ ( Z m Z d ) is the event that Z m exceeds Z d ; R i ( Z c , Z d ) is defined as the extreme risk (probability) of the i-th reservoir that a certain frequency flood regulated from Z c exceeds Z d ; it can be derived by flood routing.

2.2.2. Constraints

(1) Water volume balance constraints:
V i ( t ) = V i ( t 1 ) + ( I i ( t ) Q i ( t ) ) Δ t
(2) Water level constraints:
Z min , i ( t ) Z i ( t ) Z max , i ( t )
(3) Reservoir discharge flow constraints:
Q min , i ( t ) Q i ( t ) Q max , i ( t )
(4) Reservoir discharge flow constraints:
N L i , t N i ( t ) N U i , t
where V i ( t ) is the storage capacity in period t of the i-th reservoir; Z i ( t ) is the reservoir water level of the i-th reservoir; I i ( t ) is inflows of the reservoir in period t of the i-th reservoir; Q i ( t ) is outflows of the reservoir in period t of the i-th reservoir; Z min , i ( t ) , Z max , i ( t ) are lower and upper water level in period t of the i-th reservoir; Q min , i ( t ) , Q max , i ( t ) are lower and upper discharge flow in period t of the i-th reservoir; N L i , t , N U i , t are the lower and upper limits of the hydropower output.

2.3. Dynamic Control Programming Module

After the combinations of the upper limit of FLWL are determined, the next step is to perform the scheduling scheme by adopting a certain method. An excellent dynamic control method can fully exert the advantages of FLWL dynamic control mode. This paper proposes a new dynamic control method and divides it into four submodules: normal operation submodule, adaptive grading pre-release submodule, flood control dispatching submodule, and flood retention and refill submodule, respectively. Each submodule is described in detail below.

2.3.1. Normal Operation Submodule

In the flood season, the water resources that can be used are not only floods, but also include inflows with large flows but not enough to be called a flood. A normal operation submodule is adopted to make full use of the inflow of larger flows. This module contains two situations: (1) there is no flood forecasted in the effective lead-time; (2) a flood is forecasted during the effective lead-time, but the reservoir water level is lower than the lower limit of the FLWL. In the first situation, there are two different operation modes depending on the current reservoir level. When the current reservoir water level is above the lower limit of the FLWL, this means that the current inflow is richer, and the normal operation is performed with the full flow of the hydroelectric power station in order to take full advantage of abundant inflow for power generation in time. When the current reservoir water level is below the lower limit of the FLWL, this indicates that the current inflow is less, and the normal operation is discharged with the minimum discharge not being less than the release of the generating firm capacity in order to store water as much as possible. In the second situation, there will be a flood coming soon, but the reservoir still has room for water conservation. Appropriate water storage operation can be carried out by controlling the discharge not being more than the inflow, but the reservoir water level of water storage cannot surpass the upper limit of FLWL and the discharge cannot be less than the release of the generating firm capacity.

2.3.2. Adaptive Grading Pre-Release Submodule

Before the flood occurs, the water level of the reservoir must decrease to the lower limit of the FLWL in effective lead-time in order to accommodate the impending flood. An adaptive grading pre-release submodule is employed to provide adequate storage by reducing the water level of the reservoir to the lower limit of the FLWL safely. When a flood is forecasted during the effective lead-time, the adaptive grading pre-release submodule adaptively estimates the current occupied flood storage capacity based on the current reservoir storage. The effective lead-time is divided into n levels, and the occupied storage capacity for flood control is allocated to each level in descending order from the n-th level, and the pre-release flow of each level is calculated in turn, i.e.,
V o c = V 0 V d
V o c , k = { min { t k × ( k + 1 ) m × l k × V o c ,   Q max × t k × w } k = n min { t k × ( k + 1 ) m × l k × ( V o c i = k + 1 n V o c , i ) ,   Q max × t k × w } 1 k < n
Q p , k = V o c , k t k 1 k n
Q x , k = Q p , k + t 0 t 0 + t k Q i n ( t )
where V o c is the occupied storage capacity for flood control, (108 m3); V 0 is the reservoir storage corresponding to the water level of reservoir when forecasting there will be a flood, (108 m3); k is the number of levels; V o c , k is the occupied storage capacity for flood control of the k-th level, (108m3); t k is the effective lead-time duration of allocation of the k-th level, (h); m is the greatest common divisor of the effective lead-time duration of allocation of each level; w is the unit conversion factor from (m3 ·h/s) to (108 m3), w = 3.6 × 10 5 ; Q p , k is the pre-release flow of the k-th level but not the final discharge, (m3/s); Q x , k is the discharge flow of the k-th level, (m3/s); l k is the grading factor of the k-th level, l k = i = 1 k t i × ( i + 1 ) m .

2.3.3. Flood Control Operation Submodule

Flood control operation is aimed to use flood control projects or flood control systems to plan floods in real-time to achieve optimal flood control. A flood control operation submodule is used to reduce flood damage and properly consider other comprehensive utilization requirements at the same time. Each reservoir has its own unique flood control operation rules. This submodule is performed with the flood control operation rules corresponding to each reservoir

2.3.4. Flood Retention and Refill Submodule

During the flood recession period, there are abundant water resources available. Flood retention and refill submodule is employed to detain the flood during the flood recession period for power generation in order to meet conservation demands or increase the economic benefits of hydropower. Three conditions are required to perform the operation of this module: (1) there is no other flood forecasted in the effective lead-time; (2) the current reservoir water level is lower than the upper limit of the FLWL; (3) current inflow is less than the maximum safety discharge of the downstream flood protection site. Under the premise of meeting the conditions, this submodule is operated with minimum discharge not being less than the release of generating firm capacity, and the reservoir water level of flood retention and refill cannot surpass the upper limit of the FLWL.

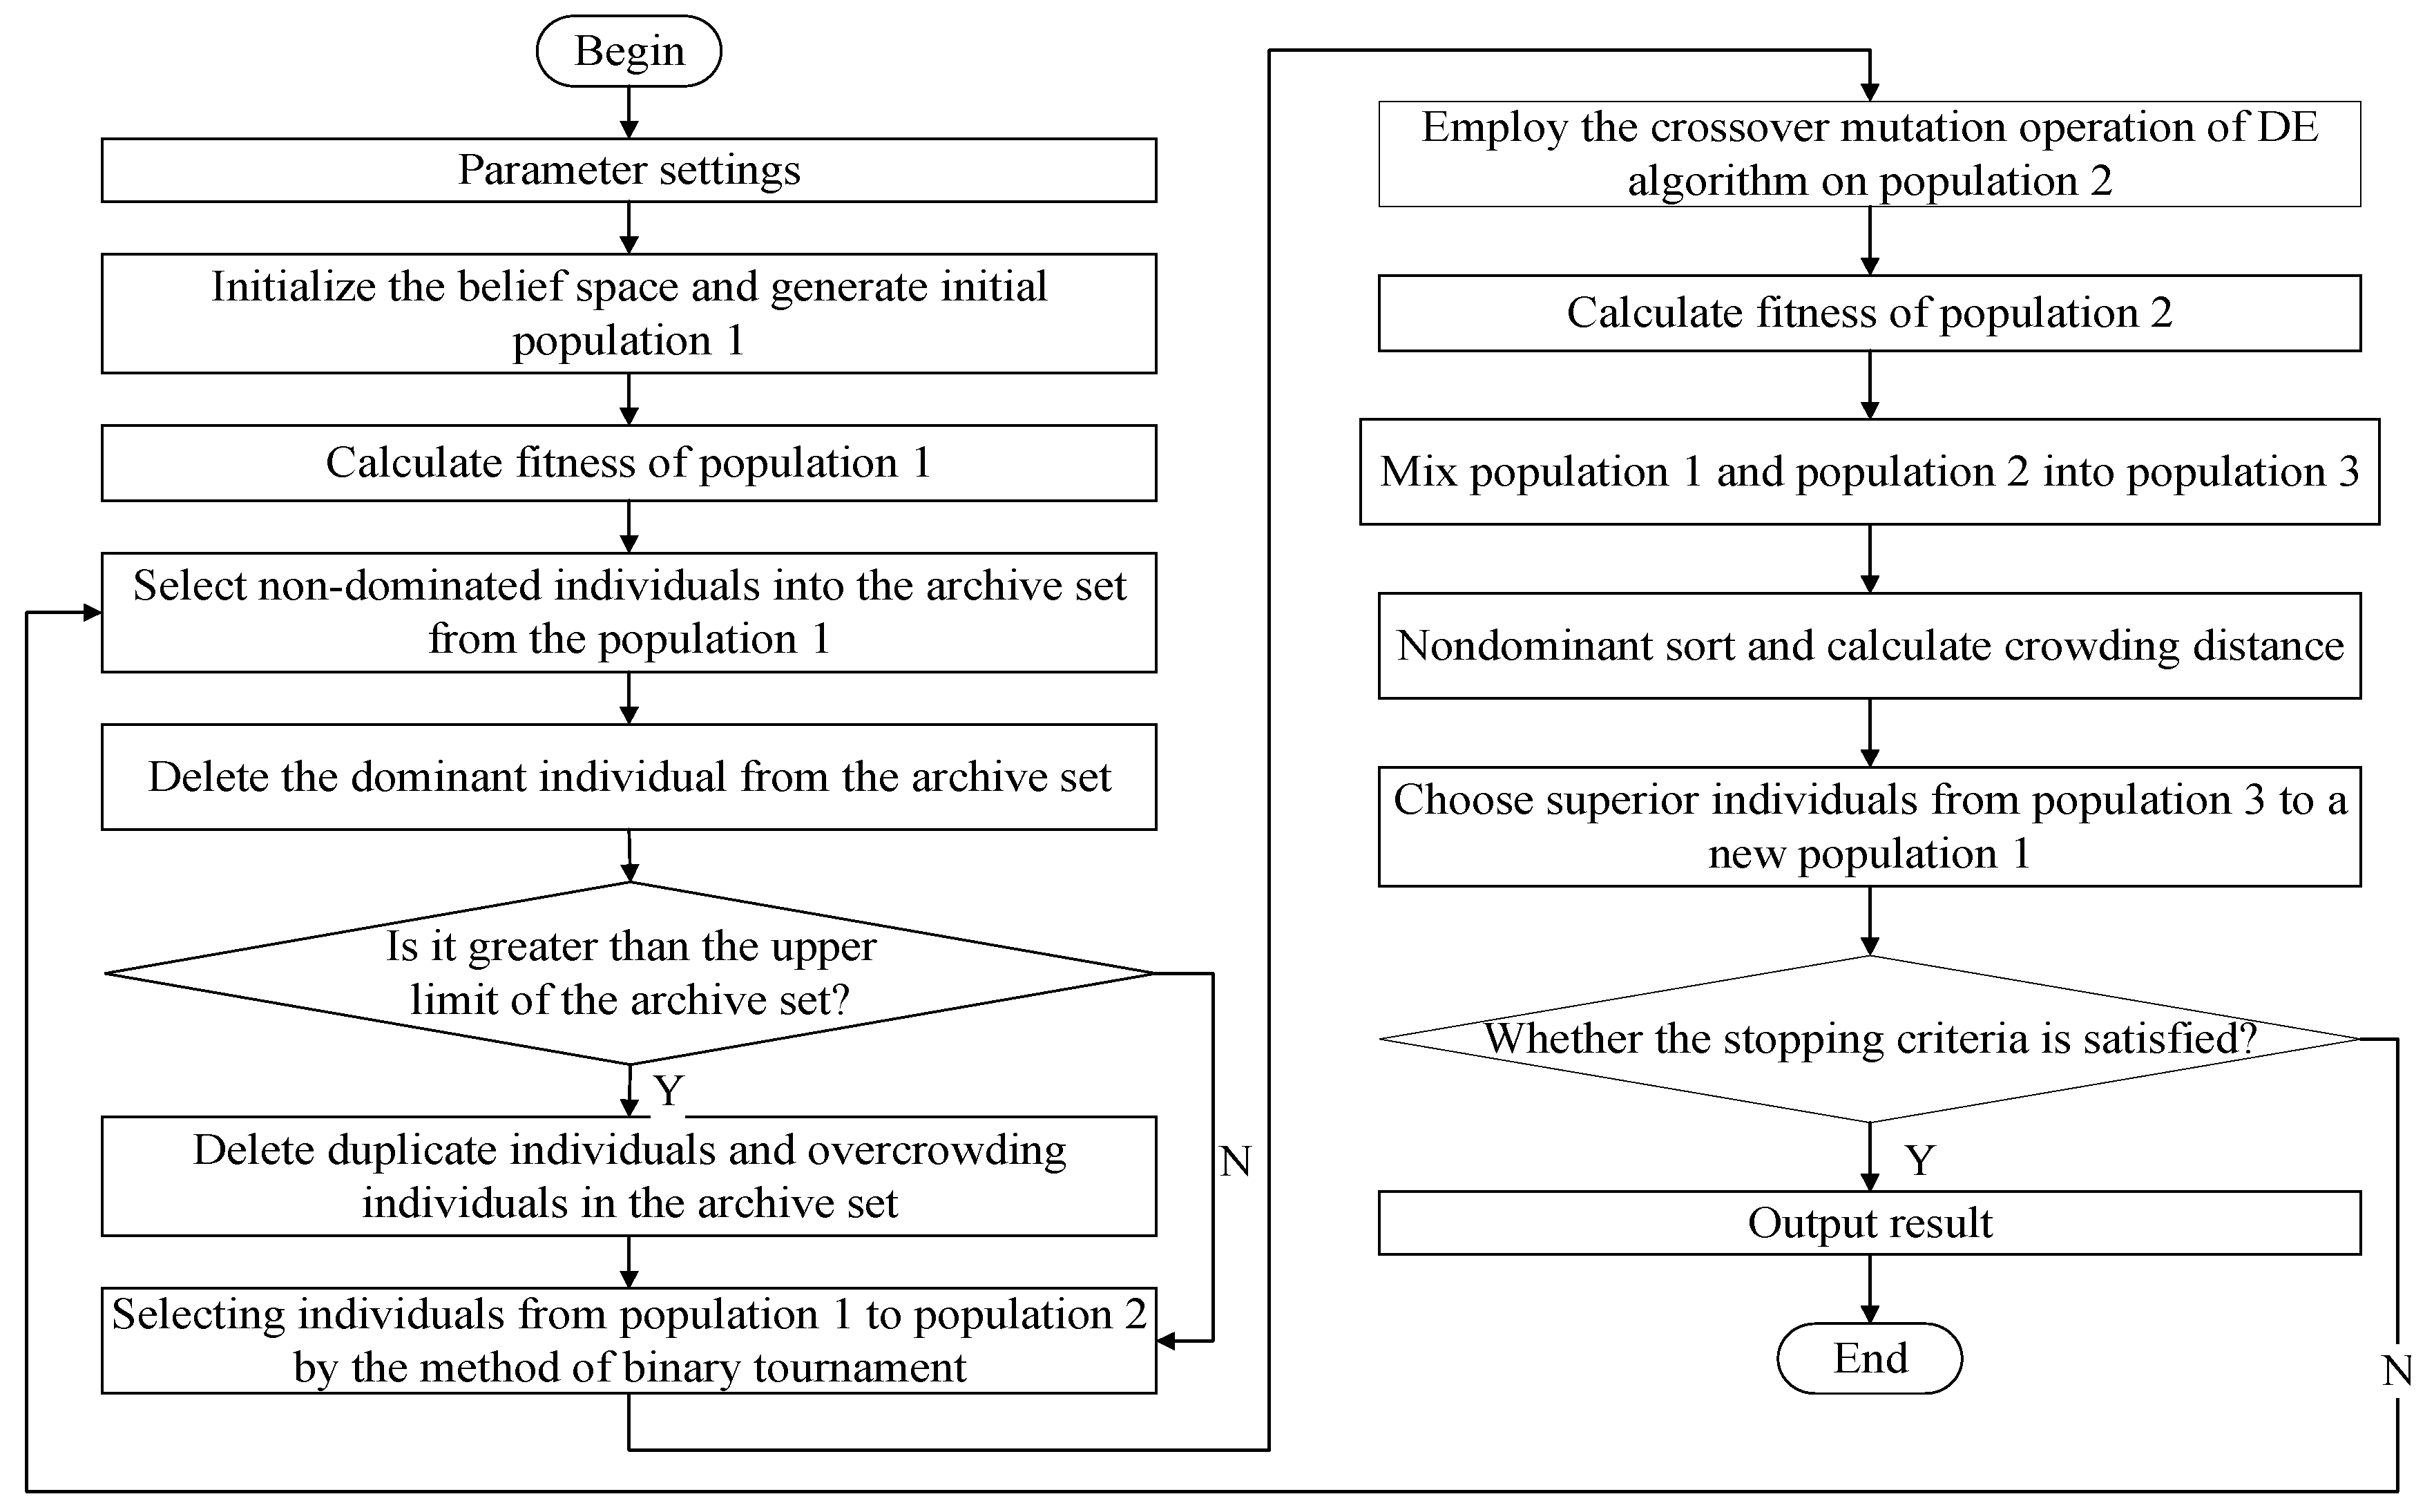
3. Non-Dominated Sorting Culture Differential Evolution (NSCDE) Algorithm

There is a multi-dimension, multi-objective and multi-stage optimization problem in the optimal selection of FLWL for each reservoir in cascade reservoirs based on the scheduling model of DC-FLWL for cascade reservoirs. This paper employs a multi-objective evolutionary algorithm named non-dominated sorting culture differential evolution (NSCDE) algorithm to solve these multi-objective optimization problems (MOPs) [21]. In the NSCDE algorithm, the culture algorithm (CA) is used to improve the performance of algorithms by adding domain knowledge [22]. The most significant feature of the CA is belief space where different kinds of knowledge can be obtained from the process of evolutionary and population space where individuals are updated according to a certain algorithm [23]. Non-dominated sorting genetic algorithm II (NSGA-II) [24] is used as the population space of the CA and normative knowledge and situational knowledge are used as the belief space of the CA. Differential evolution (DE) algorithm [25] is chosen as the evolutionary algorithm in NSCDE and NSCDE can dynamically update the evolutionary algorithm parameters of DE by using the normative knowledge of belief space. The optimal solutions obtained from the population space is called the archive set, and situational knowledge is constituted of archive sets. An upper limit of the archive set is used to prevent local optimum. A truncation step like the strength pareto evolutionary algorithm 2 (SPEA2) [26] is employed to eliminate the repeated and overcrowding individuals when the number of individuals exceeds the upper limit of the archive set. The flowchart of NSCDE is shown in Figure 2.

4. Case Study

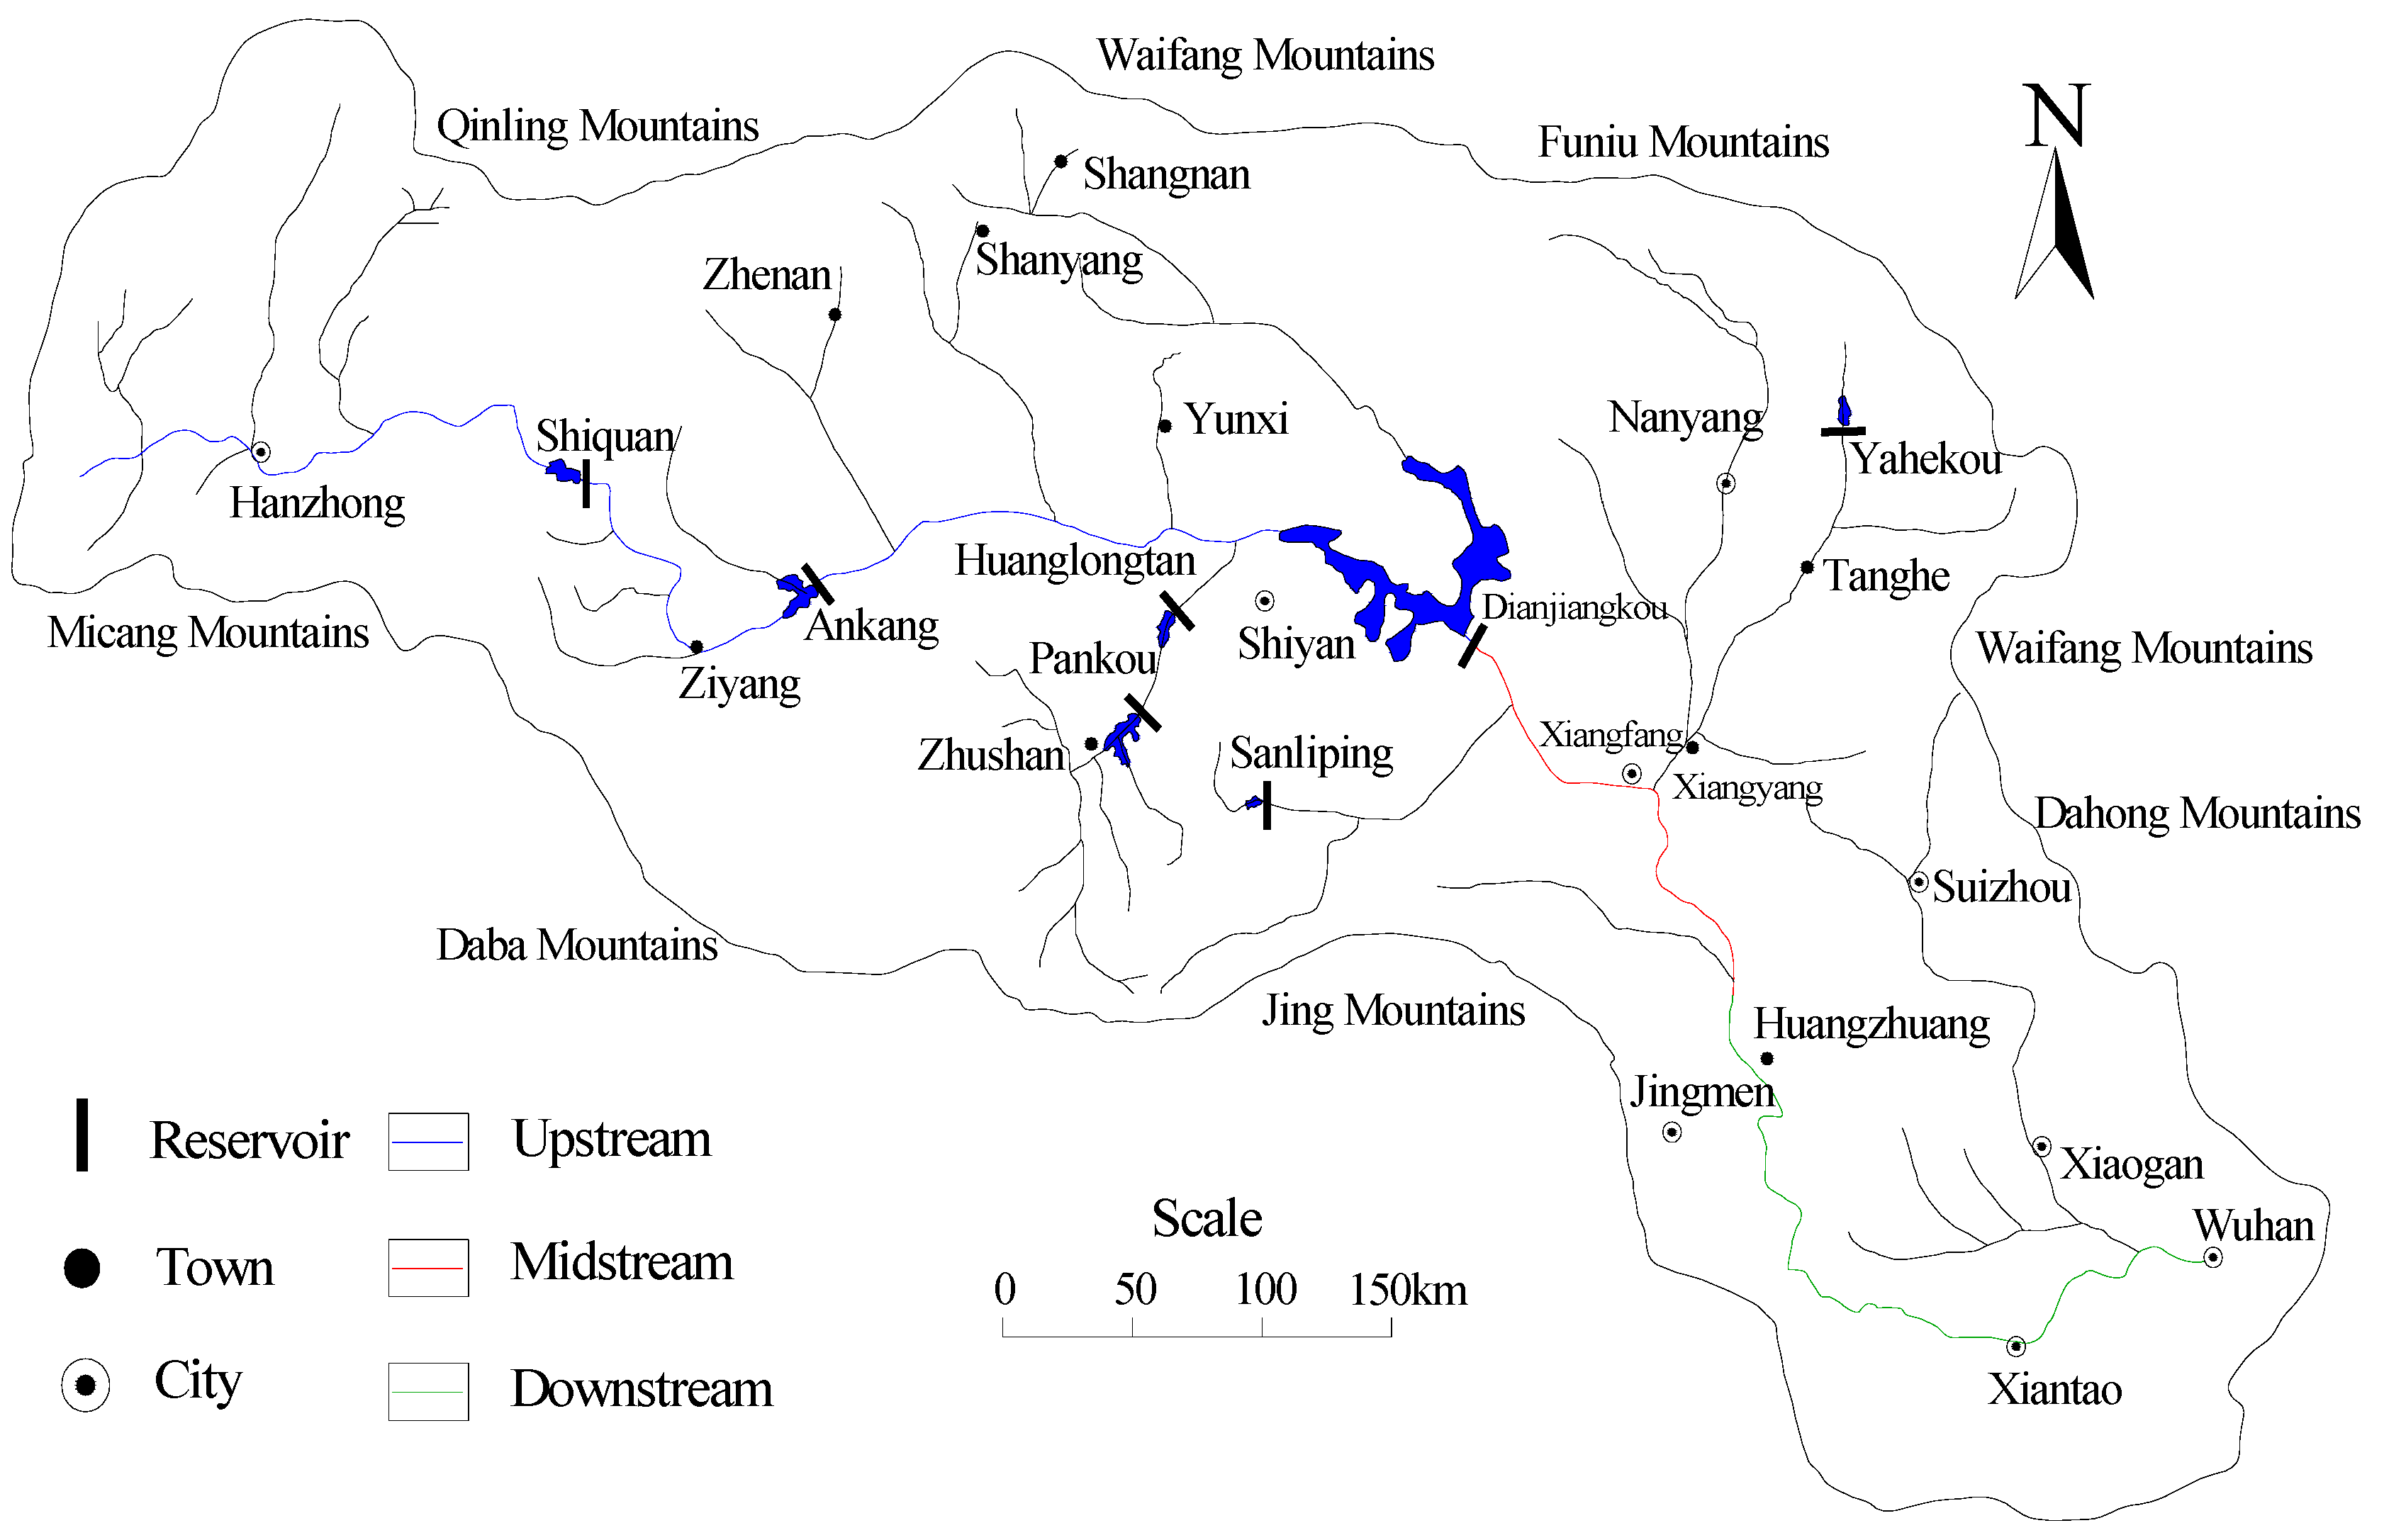
4.1. Hanjiang Basin Overview

The Hanjiang Basin is located at 160 ° 1 5 ~ 114 ° 2 0 east longitude and 30 ° 1 0 34 ° 2 0 north latitude, with a drainage area of about 159,000 km2. Hanjiang is the largest tributary of the middle reaches of the Yangtze River [27]. The schematic diagram of the Hanjiang Basin is shown in Figure 3. The upper part of the Danjiangkou is upstream. The river is about 925 km long and the control basin area is 95,200 km2. It is dominated by middle and low mountains, with deep valleys, steep slopes on both sides, and rapid water flow and many river beaches. Danjiangkou to Huangzhuang is the middle reaches, with a length of 270 km and a controlled drainage area of 46,800 km2. The river flows through the hilly valley basin. The Hanjiang Basin belongs to the East Asian subtropical monsoon climate zone and has obvious seasonality. The annual average annual precipitation of the basin is about 700~1100 mm, which increases from upstream to downstream, and the upstream area decreases from south to north. Rainstorms often occur from July to October. There are summer rainstorms and autumn rainstorms. The corresponding floods also have summer floods and autumn floods [28]. Summer floods generally occur before the end of August, often full-terrain, with high peaks and the volume of floods is large. The autumn floods generally occur after the end of August, and the main inflow areas are the upper reaches of the Hanjiang, mostly continuous flood peaks, which last for a long time and the volume of floods is large [29].
The larger water conservancy hubs of the Hanjiang include Ankang and Danjiangkou. The tributaries also have cascade reservoirs, but most of them have smaller storage capacity. In this study, Shiquan, Ankang, Pankou, Huanglongtan, Danjiangkou, Yahekou and Sanliping reservoirs in the middle and upper reaches of the Hanjiang Basin were selected for dispatching and the specific location of each reservoir in the basin is shown in Figure 3. In the cascade reservoirs, the Danjiangkou, Yahekou and Sanliping reservoirs are operated in seasonal FLWL control mode which is often used in seasonally flooded river basins, and it divides flood season into the summer flood season (S) and the autumn flood season (A). The characteristic parameter values of the seven reservoirs are given in Table 1. With the improvement of meteorological and hydrological forecasting capabilities, the 72-hour effective lead-time of inflow forecasting of the middle and upper reaches of the Hanjiang Basin has reached the availability level [30,31], and the operation period is taken for 72 h in this study.

4.2. Scheduling Period and Usage Data

The flood season in the middle and upper reaches of the Hanjiang Basin is concentrated from June to September. The flood season of Shiquan and Ankang reservoirs is from July 1st to September 30th. The flood season of Pankou and Huanglongtan reservoirs is from June 20th to August 20th. The flood season of Danjiangkou, Yahekou and Sanliping reservoirs is from June 20st to September 30th. Therefore, in this paper, 24-hour runoff data series during June 20st to September 30th was employed for optimal operation and three typical hydrological years (i.e., a wet year (1983) with a 1% frequency, a normal year (2007) with 50% frequency and a dry year (2016) which the frequency is 95%) were used as the case study.
In China, the annual runoff frequency or the annual precipitation frequency less than 25% is usually referred to as the wet year, the annual runoff frequency or the annual precipitation frequency more than 75% is usually referred to as the dry year and the year in which the annual runoff frequency or the annual precipitation frequency is between 25% and 75% is usually referred to as the normal year. For rigor, it is important to point out that potential global warming and climate change may change future patterns (and frequencies) of three typical hydrological years. The frequencies of three typical hydrological years were measured in 2018.

4.3. Parameter Settings of NSCDE Algorithm

The program was written in Java to optimize the model according to the optimization idea and process of the NSCDE algorithm. Each individual in the population was composed of a set of FLWL upper limit values of the cascade reservoir and the gene coding of each individual was the upper limit of the FLWL of each reservoir in the cascade. The population size was set as 50, the maximum number of iterations was 500, the size of the archive set was selected as 40, the crossover probability was 0.7 and the mutation probability was 0.05.

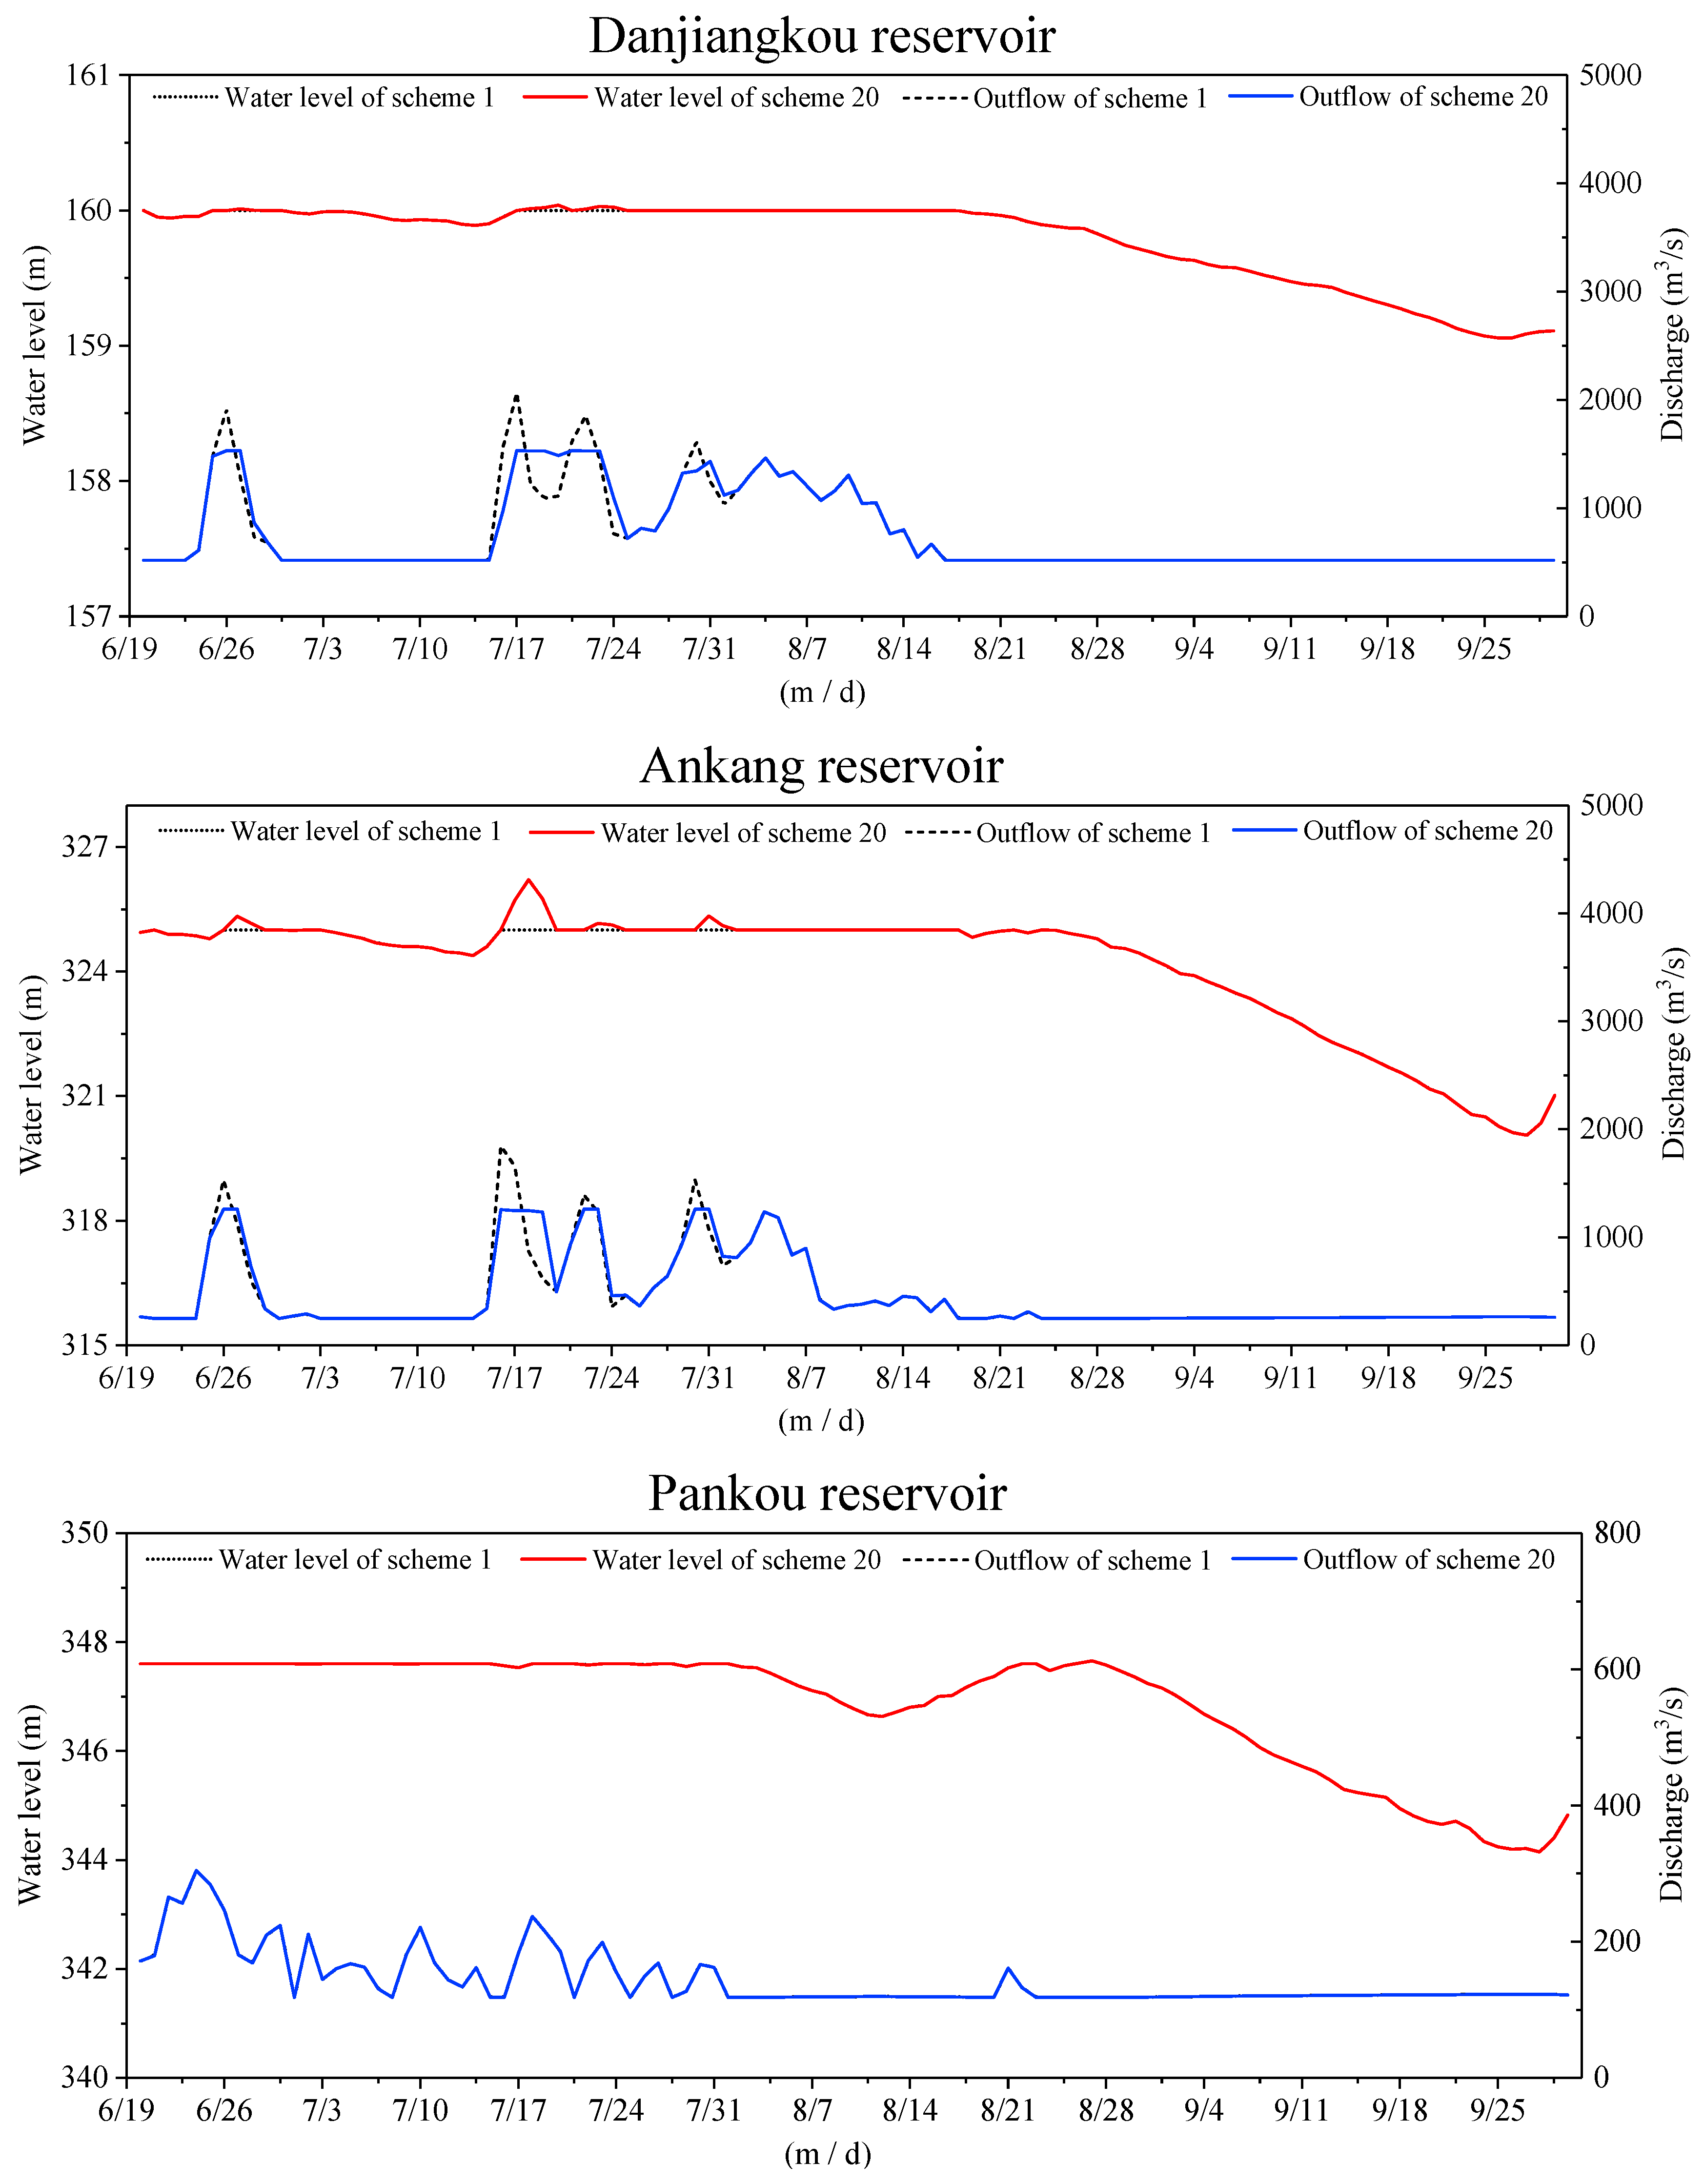
5. Results and Discussion

Reservoirs with larger flood storage capacity will have an excellent storage capacity and flood utilization potential. Therefore, in this study, the Danjiangkou, Pankou and Ankang reservoirs with relatively large flood control capacity in the cascade reservoirs were selected, and the three reservoirs were operated in the FLWL dynamic control mode. The other four reservoirs were dispatched in the FLWL static control mode.
After the control mode of each reservoir in the cascade reservoirs was determined, the FLWL dynamic control bound of Danjiangkou, Pankou and Ankang reservoirs using 72-hour lead-time inflow forecasting was estimated by the dynamic control bound determination submodule. The results are shown in Table 2. It shows that the upper limit of FLWL of Danjiangkou in summer flood season, Danjiangkou in autumn flood season, Ankang and Pankou has increased by 1.5 m, 1.5 m, 2 m and 3 m, respectively, than the lower limit of FLWL by considering 72-hour lead-time inflow forecasting.
Under the condition of guaranteeing the maximum of the average joint power generation benefit of the cascade reservoirs, the minimum of the average extreme risk rate was also considered. A part of optimization schemes of multi-objective optimal scheduling model of DC-FLWL for cascade reservoirs is presented in the Table 3. As mentioned above, scheme 1 is operated in FLWL static control mode and can be understood as a special case where the upper and lower limits of the dynamic control bound are equal in the FLWL dynamic control mode. With the increase of the FLWL upper limit of Danjiangkou, Ankang and Pankou reservoirs, the average power generation and average extreme risk rate of each scheme are also rising. It can be observed from Table 3 that the average power generation and the average extreme risk rate are positively correlated. An increase in either of the two objectives will inevitably lead to a decrease in the other objective.
For a comprehensive analysis of the relationship among the various schemes, all schemes were chosen for comparison. After comparing all the schemes, we found that in the first 14 schemes (schemes 1–14), the increase rate of the extreme risk rate was flat with the increase of power generation; while in the latter six schemes (schemes 15–20), with the increase of power generation, the increase rate of the extreme risk rate had a remarkable improvement. This phenomenon is a good match for the distribution of the Pareto optimal solution set. Through this we can find that it is worth appropriately increasing the upper limit of FLWL of reservoirs because it can achieve a large increase in power generation with a lower extreme risk rate.
For an in-depth analysis of the relationship among the various schemes, two extreme schemes were chosen for comparison: scheme 1 (minimize extreme risk rate), scheme 20 (maximize power generation). In fact, scheme 1 is the original design scheduling scheme. On the one hand, when the decision maker takes maximizing power generation as the main objective, it will be at the expense of enduring a relatively large extreme risk rate to generate more power, such as scheme 20. On the other hand, when the decision maker takes minimize extreme risk rate as the main objective, it will sacrifice part of the power generation to ensure the safety of the hydropower station in flood season operation, such as scheme 1. The operation results of scheme 1 and scheme 20 of power generation (PG) and extreme risk rate (ERR) during the operation period are listed in Table 4. Due to the large amount of data, this paper mainly discusses the data of the reservoirs operated in FLWL dynamic control mode, (i.e., Danjiangkou, Ankang and Pankou reservoirs). It can be seen from Table 4 that the PG of scheme 20 is 9.17 × 10⁸ kW·h (6.39%) larger than the PG of scheme 1. Meanwhile, the ERR of scheme 20 has increased by 168% than that of scheme 1. Scheme 20 can generate more PG by 3.63 × 10⁸ kW·h (6.07%), 4.66 × 10⁸ kW·h (9.89%), 0.88 × 10⁸ kW·h (3.2%) in the wet, normal and dry years, respectively, compared with scheme 1.
In the multi-objective optimal scheduling model of DC-FLWL for cascade reservoirs, spilled water (SW) and water resource utilization rates (WRUR) of each operation scheme during the operation period have also been considered and the results are summarized in Table 5. It shows that the SW of scheme 20 decreased by 8.34 × 10⁸ m (1.41%), 2.29 × 10⁸ m (13.41%) and 2.96 × 10⁸ m (65.72%) in the wet, normal and dry years, respectively, compared with scheme 1. In addition, compared to scheme 1, the WRUR of scheme 20 increased by 5.17%, 7.38% and 1.8% in the wet, normal and dry years, respectively. The three-year average SW decreased by 13.72 × 10⁸ m (26.85%) and the three-year average WRUR increased by 4.78%.
Comparison of water level processes and discharge processes of Danjiangkou, Ankang and Pankou reservoirs between scheme 1 and scheme 20 during the operation period in the wet, normal and dry years is presented in Figure 4, Figure 5 and Figure 6, respectively.
Due to the abundant inflow in the wet year, the PG and SW of each reservoir in each scheme are the most among the three typical hydrological years. As can be seen from Table 4, in the wet year, the joint PG of the cascade reservoirs of scheme 20 increased by 3.36 × 10⁸ kW·h compared with scheme 1. It can be seen from Table 5 that in each scheme, the inflow in the wet year was larger than that in the normal year, but the WRUR of the Danjiangkou reservoir in the wet year was less than that of the Danjiangkou reservoir in the normal year. It can be seen from Figure 4 that this is because the Danjiangkou reservoir experienced a lager flood in the wet year, the speed of inflow was fast, and the volume of the flood was large, and the inflow quickly exceeded the maximum safety discharge of the downstream flood protection site. The reservoir can only reduce the water level of the reservoir to the lower limit of the FLWL by pre-release operation and operate in conventional flood control operation mode in time, resulting in water resources not being used. Even so, in a wet year, the WRUR of the cascade reservoir of scheme 20 increased by 5.17% compared with scheme 1.
In the normal year, where the small and medium floods occured frequently, the advantages of DC-FLWL were fully exerted. It can be seen from Table 5 that in the normal year, the cascade reservoir WRUR of scheme 1 and scheme 20 were both the largest among the three typical hydrological years. In addition, the cascade reservoir WRUR of scheme 20 increased by 7.38% compared with scheme 1. This is because in scheme 20, there were many scheduling rules that utilized small and medium floods based on forecasted inflow. When no flood occurs during the effective lead-time, the redundant water which is occupying the flood control storage capacity is used to generate electricity in time. When floods occurs during the effective lead-time, the water level is reduced by adaptive grading pre-release method in order to provide sufficient flood storage capacity before the flood comes. When the flood begins to decline, flood retention and refill operation will intercept the flood of recession and store water as much as possible so that the reservoir operates at the upper limit of the FLWL to meet conservation demands or increase the economic benefits of hydropower.
In the dry year when inflow is particularly small, the PG and SW of each reservoir in each scheme were the least among the three typical hydrological years. As can be seen from Table 4, in the dry year, the power generation of Pankou reservoir was exactly the same in scheme 1 and scheme 20. And as shown in Figure 6, the water level change process of Danjiangkou, Ankang and Pankou reservoirs almost coincided in scheme 1 and scheme 20. This was because there was so little water in the dry year, that the reservoirs of each scheme operated with the discharge of generating firm capacity in order to meet the minimum working flow requirements of the turbine. However, it is worth noting that although the water in the dry year was very scarce, the cascade reservoir SW of scheme 20 decreased 65.72% (2.96 × 10⁸ m) less than that of scheme 1 and the cascade reservoir PG of scheme 20 increased by 0.88 × 10⁸ kW·h (3.2%) more than that of scheme 1
By comparing scheme 1 and scheme 20, the FLWL dynamic control method in this paper is more suitable for the normal year where small and medium floods occur frequently, because the flood level of the normal year is not large and is easier to use. In contrast, this method cannot work as well during a wet year in which big floods occur, because the floods last longer, the volume of floods is larger, and the utilization difficulty is high. For the dry year, the inflow is too small, so that the FLWL dynamic control method cannot play a role.
A multi-objective optimal scheduling model of DC-FLWL for cascade reservoirs which contains a new dynamic control method proposed in this paper can be well applied to the Hanjiang Basin. However, there is still a lot of research and exploration on whether it can be applied to basins with different hydrological properties. In the future, to extend the recommendations of dynamic control of FLWL to other basins more studies will be implemented in working on a model of DC-FLWL with high fitness which can be applied to various basins with different hydrological properties.

6. Conclusions

A multi-objective optimal scheduling model of DC-FLWL for cascade reservoirs which contains a new dynamic control method is proposed in this study and solved by a multi-objective evolutionary algorithm named NSCDE. A cascade reservoir consisting of seven reservoirs in the Hanjiang Basin was selected as the case study and it should be pointed out that the conclusions are valid only for the Hanjiang Basin. The results are summarized as follows:
(1) The multi-objective optimal scheduling model of DC-FLWL for cascade reservoirs can provide decision makers with a set of alternative and feasible, optimized scheduling schemes by considering the two objectives of maximizing power generation and minimizing extreme risk rate. Decision makers can choose the appropriate optimal scheduling scheme according to their own preferences and actual scheduling processes.
(2) By comparing the two extreme schemes in the optimization results, the power generation can be increased by 9.17 × 10⁸ kW·h (6.39%) at most compared to the original design scheduling scheme, while the extreme risk rate also increased from 0.1% to 0.268%.
(3) The FLWL dynamic control method proposed in this paper can significantly improve water resource utilization of DC-FLWL, and the method is more suitable for applying to the normal year when small and medium floods occur frequently.

Author Contributions

Conceptualization, G.L. and H.Q.; methodology, G.L.; software, Y.L.; validation, H.Q., G.L.; formal analysis, G.L.; investigation, R.T.; resources, H.Q.; data curation, H.Q.; writing—original draft preparation, G.L.; writing—review and editing, H.Q.; visualization, G.L.; supervision, Q.S.; project administration, H.Q.; funding acquisition, H.Q.

Funding

This work was supported by the National Key R&D Program of China (2016YFC0402209) and the National Natural Science Foundation of China (No. 91647114 and No.51979113). Special thanks are given to the anonymous reviewers and editors for their constructive comments.

Acknowledgments

The authors want to thank Zhendong Zhang, Shaoqian Pei, Jie Li, Lingyun Tang and Longjun Zhu for their help in the field work.

Conflicts of Interest

The authors declare no conflicts of interest.

Abbreviations and Nomenclature

FLWLflood limited water level.
SC-FLWLstatic control of flood limited water level.
SC-AFLWLstatic control of annual flood limited water level.
SC-SFLWLstatic control of seasonal flood limited water level.
DC-FLWLdynamic control of flood limited water level.
NSCDEnon-dominated sorting culture differential evolution algorithm.
MOPsmulti-objective optimization problems.
CAculture algorithm.
NSGA-IInon-dominated sorting genetic algorithms II.
DEdifferential evolution algorithm.
SPEA2strength pareto evolutionary algorithm 2.
PGpower generation.
ERRextreme risk rate.
SWspilled water.
WRURwater resource utilization rate.

References

  1. Gleick, P.H. Water and conflict: Fresh water resources and international security. Int. Secur. 1993, 18, 79–112. [Google Scholar] [CrossRef]
  2. Loucks, D.P.; Van Beek, E. Water Resource Systems Planning and Management: An Introduction to Methods, Models, and Applications; Springer: Ithaca, NY, USA, 2017. [Google Scholar]
  3. Guo, S.L.; Zhang, H.G.; Chen, H.; Peng, D.Z.; Liu, P.; Pang, B. A reservoir flood forecasting and control system in China. Hydrol. Sci. J. 2004, 49, 959–972. [Google Scholar] [CrossRef]
  4. Wei, C. A real-time optimization model for flood control. American Geophysical Union, Fall Meeting Abstracts. H21A-1319. 2005. Available online: http://adsabs.harvard.edu/abs/2005AGUFM.H21A1319W (accessed on 4 September 2019).
  5. Chou, F.N.F.; Wu, C.W. Expected shortage based pre-release strategy for reservoir flood control. J. Hydrol. 2013, 497, 1–14. [Google Scholar] [CrossRef]
  6. Labadie, J.W. Optimal operation of multireservoir systems: State-of-the-art review. J. Water Resour. Plann. Manag. 2004, 130, 93–111. [Google Scholar] [CrossRef]
  7. Ahmed, J.A.; Sarma, A.K. Genetic algorithm for optimal operating policy of a multipurpose reservoir. Water Resour. Manag. 2005, 19, 145–161. [Google Scholar] [CrossRef]
  8. Eum, H.I.; Vasan., A.; Simonovic, S.P. Integrated reservoir management system for flood risk assessment under climate change. Water Resour. Manag. 2012, 26, 3785–3802. [Google Scholar] [CrossRef]
  9. Ostadrahimi, L.; Mariño, M.A.; Afshar, A. Multi-reservoir operation rules: Multiswarm PSO-based optimization approach. Water Resour. Manag. 2012, 26, 407–427. [Google Scholar] [CrossRef]
  10. Zhou, Y.L.; Guo, S.L. Incorporating ecological requirement into multipurpose reservoir operating rule curves for adaptation to climate change. J. Hydrol. 2013, 498, 153–164. [Google Scholar] [CrossRef] [Green Version]
  11. Jain, S.K.; Yoganarasimhan, G.N.; Seth, S.M. A risk-based approach for flood control operation of a multipurpose reservoir. Water Resour. Bull. 1992, 28, 1037–1043. [Google Scholar] [CrossRef]
  12. Ding, W.; Zhang, C.; Peng, Y.; Zeng, R.; Zhou, H.; Cai, X. An analytical framework for flood water conservation considering forecast uncertainty and acceptable risk. Water Resour. Res. 2015, 51, 4702–4726. [Google Scholar] [CrossRef]
  13. Cheng, C.T.; Wang, W.C.; Xu, D.M.; Chau, K.W. Optimizing hydropower reservoir operation using hybrid genetic algorithm and chaos. Water Resour. Manag. 2008, 22, 895–909. [Google Scholar] [CrossRef]
  14. Diao, Y.; Wang, B. Scheme optimum selection for dynamic control of reservoir limited water level. Sci. China Ser. E: Technol. Sci. 2011, 54, 2605. [Google Scholar] [CrossRef]
  15. Chen, J.H.; Guo, S.L.; Li, Y.; Liu, P.; Zhou, Y.L. Joint operation and dynamic control of flood limiting water levels for cascade reservoirs. Water Resour. Manag. 2013, 27, 749–763. [Google Scholar] [CrossRef]
  16. Liu, P.; Guo, S.; Li, W. Optimal design of seasonal flood control water levels for the Three Gorges Reservoir. IAHS Publ. Ser. Proc. Rep. 2008, 319, 270–280. [Google Scholar]
  17. Yun, R.; Singh, V.P. Multiple duration limited water level and dynamic limited water level for flood control with implication on water supply. J. Hydrol. 2008, 354, 160–170. [Google Scholar] [CrossRef]
  18. Li, X.; Guo, S.L.; Liu, P.; Chen, G.Y. Dynamic control of flood limited water level for reservoir operation by considering inflow uncertainty. J. Hydrol. 2010, 391, 124–132. [Google Scholar] [CrossRef]
  19. Zhou, Y.; Guo, S.; Liu, P.; Xu, C. Joint operation and dynamic control of flood limiting water levels for mixed cascade reservoir systems. J. Hydrol. 2014, 519, 248–257. [Google Scholar] [CrossRef]
  20. Meng, X.L.; Liang, X.J.; Yan, B.Z.; Li, W.; Guo, L.H.; Feng, B. Optimizing schemes on dynamic control of reservoir normal elevation in flood season. Nat. Hazard. 2016, 81, 1161–1175. [Google Scholar] [CrossRef]
  21. Yin, X.L.; Cheng, L.G.; Wang, X.; Lu, J.; Qin, H. Optimization for Hydro-Photovoltaic-Wind Power Generation System Based on Modified Version of Multi-Objective Whale Optimization Algorithm. Energy Procedia. 2019, 158, 6208–6216. [Google Scholar] [CrossRef]
  22. Liu, Y.; Qin, H.; Mo, L.; Wang, Y.; Chen, D.; Pang, S.; Yin, X. Hierarchical Flood Operation Rules Optimization Using Multi-Objective Cultured Evolutionary Algorithm Based on Decomposition. Water Resour. Manag. 2019, 33, 337–354. [Google Scholar] [CrossRef]
  23. Liu, Y.; Qin, H.; Zhang, Z.; Yao, L.; Wang, C.; Mo, L.; Ouyang, S.; Li, J. A Region Search Evolutionary Algorithm for Many-Objective Optimization. Inf. Sci. 2019, 488, 19–40. [Google Scholar] [CrossRef]
  24. Deb, K.; Pratap, A.; Agarwal, S.; Meyarivan, T.A.M.T. A fast and elitist multiobjective genetic algorithm: NSGA-II. IEEE Trans. Evol. Comput. 2002, 6, 182–197. [Google Scholar] [CrossRef] [Green Version]
  25. Storn, R.; Price, K. Differential evolution—A simple and efficient heuristic for global optimization over continuous spaces. J. Global Optim. 1997, 11, 341–359. [Google Scholar] [CrossRef]
  26. Zitzler, E.; Laumanns, M.; Thiele, L. SPEA2: Improving the strength Pareto evolutionary algorithm. TIK-report. 2001, p. 103. Available online: https://www.research-collection.ethz.ch/bitstream/handle/20.500.11850/145755/eth-24689-01.pdfhttp://adsabs.harvard.edu/abs/2005AGUFM.H21A1319W (accessed on 4 September 2019).
  27. Changjiang Water Resources Commission. China Rivers and Lakes (Volume of Yangtze River); China Water Power Press: Beijing, China, 2010. [Google Scholar]
  28. Changjiang Water Resources Commission. Management of Danjiangkou Hydro Project. Handbook of Danjiangkou Reservoir Operation; China Water Power Press: Wuhan, China, 2012. [Google Scholar]
  29. Guan, G.M.; Chen, S.J.; Rao, G.H. Hanjiang Basin Planning. Hubei Hydropower. 2006, 3, 9–12. [Google Scholar]
  30. Duan, W.X. Study on operation and influence of controlled reservoirs in the Hanjiang Basin. Ph.D. Thesis, Wuhan University, Wuhan, China, 2017. [Google Scholar]
  31. Liu, Y.; Ye, L.; Qin, H.; Hong, X.; Ye, J.; Yin, X. Monthly streamflow forecasting based on hidden Markov model and Gaussian Mixture Regression. J. Hydrol. 2018, 561, 146–159. [Google Scholar] [CrossRef]
Figure 1. Framework of the multi-objective optimal scheduling model of dynamic control of flood limited water level (DC-FLWL) for cascade reservoirs.
Water 11 01836 g001
Figure 2. The flowchart of non-dominated sorting culture differential evolution (NSCDE).
Water 11 01836 g002
Figure 3. The schematic diagram of the Hanjiang Basin.
Water 11 01836 g003
Figure 4. Comparison of operation process between scheme 1 and scheme 20 in a wet year.
Water 11 01836 g004
Figure 5. Comparison of operation process between scheme 1 and scheme 20 in a normal year.
Water 11 01836 g005
Figure 6. Comparison of operation process between scheme 1 and scheme 20 in a dry year.
Water 11 01836 g006
Table 1. Characteristic parameters of the cascade reservoirs.
ReservoirNormal Water Level (m)Dead Water Level (m)FLWL (m)Installed Capacity (MW)Design Standards (%)Flood Storage Capacity (108 m3)
Shiquan41040040522510.98
Ankang330305325852.50.13.6
Pankou355330347.65130.14
Huanglongtan24722224749010
Danjiangkou170150160(S), 163.5(A)9000.1118(S), 81.2(A)
Yahekou177160175.5(S), 177(A)140.13.4(S), 0(A)
Sanliping416392403(S), 412(A)700.21.21(S), 0.41(A)
Notes: S is the summer flood season, A is the autumn flood season. Design standards mean the flood standard can ensure dam safety under normal conditions. The flood standard is usually expressed by the frequency of floods.
Table 2. The FLWL dynamic control bound of Danjiangkou, Pankou and Ankang reservoirs.
ReservoirAnkangPankouDanjiangkou (S)Danjiangkou (A)
Lower limit of FLWL (m)325347.6160163.5
Upper limit of FLWL (m)327350.6161.5165
Notes: S is the summer flood season, A is the autumn flood season.
Table 3. Multi-objective optimization scheduling schemes for multi-objective optimal scheduling model of DC-FLWL for cascade reservoirs.
SchemePower Generation (108 kW·h)Extreme Risk Rate (%)The Upper Limit of FLWL (m)
AnkangPankouDanjiangkou (S)Danjiangkou (A)
144.7020.100325.00347.60160.00163.50
245.0410.103325.00347.60160.23163.50
345.1820.105325.13347.74160.18163.50
445.4730.110325.05348.20160.20163.56
545.6790.113325.26347.71160.83163.51
645.9000.117325.25348.10160.80163.50
746.0940.121325.24348.19161.03163.50
846.2280.124325.29348.22161.19163.56
946.3570.128325.40348.24161.29163.50
1046.5340.134325.65348.24161.31163.50
1146.6760.139325.73348.41161.31163.50
1246.7980.144325.95348.41161.31163.50
1346.9560.151326.22348.46161.29163.50
1447.1130.159326.19348.84161.29163.51
1547.2290.168326.48348.82161.26163.51
1647.3990.183326.77349.07161.26163.51
1747.5880.204327.00349.51161.22163.53
1847.7720.236327.00350.34161.17163.57
1947.8140.247327.00350.60161.21163.53
2047.8600.268327.00350.60161.50165.00
Notes: S is the summer flood season, A is the autumn flood season.
Table 4. Results comparison between scheme 1 and scheme 20.
Reservoir PG of Wet Year
(108 kW·h)
PG of Normal Year
(108 kW·h)
PG of Dry Year
(108 kW·h)
Average PG
(108 kW·h)
ERR
(%)
DanjiangkouScheme 119.7415.7211.1815.550.100
Scheme 2020.1417.9511.4116.500.205
Difference0.402.220.230.950.105
Rate2.02%14.15%2.06%6.08%105.00%
AnkangScheme 118.8714.777.2313.620.100
Scheme 2020.1815.887.8814.640.250
Difference1.311.110.651.020.150
Rate6.97%7.51%8.94%7.80%150.00%
PankouScheme 16.885.112.684.890.100
Scheme 208.055.962.685.560.348
Difference1.180.840.000.670.248
Rate17.09%16.44%0.00%11.18%248.00%
Cascade ReservoirsScheme 159.8847.1527.3844.700.100
Scheme 2063.5151.8228.2547.860.268
Difference3.634.660.883.060.168
Rate6.07%9.89%3.20%6.39%168.00%
Notes: PG is the power generation, ERR is the extreme risk rate.
Table 5. Comparison of spilled water and water resource utilization rates between scheme 1 and scheme 20.
Reservoir Wet YearNormal YearDry YearAverage SW (108 m)Average WRUR (%)
SW (108 m)WRUR (%)SW (108 m)WRUR (%)SW (108 m)WRUR (%)
Cascade ReservoirsScheme 1593.23 44.43 222.64 65.22 4.51 97.46 273.46 69.04
Scheme 20584.89 46.72 192.78 70.03 1.54 99.21 259.74 71.99
Difference−8.34 2.29 −29.87 4.81 −2.96 1.75 −13.72 2.95
Rate−1.41%5.17%−13.41%7.38%−65.7%1.80%−26.85%4.78%
Notes: SW is the spilled water, WRUR is the water resource utilization rate.

