1. Introduction
With a significant share (72%) of the Ugandan population employed in agricultural activities and the sector contributing to about 21.5% of the GDP in 2017, it is expected to be the backbone of the economy for the foreseeable future [
1]. About 46% of Ugandan export earnings can be attributed to the agricultural sector; coffee, tea, cotton, and tobacco constitute a significant share of the total exports [
2], whereas, based on the area under cultivation, plantains (Matooke bananas), cassava, maize, and sorghum are some of the major crops. The majority of the farming in Uganda is on a subsistence basis. Despite the rise in commercial farming for lucrative export markets, their share in total production is low. More than 95% of the cultivated crops in the country is rain-fed. In 2012, an area of approximately 140 km
2 was irrigated [
3]. This high dependence on seasonal rainfall places crop production and the nation’s food security at a higher risk. Based on historical records, Mburu et al. [
4] conclude that the onset of rainfall has shifted by a month in some regions of Uganda with no change to dates of cessation, potentially leading to change in cropping patterns. There is a consensus amongst the literature on the impact of climate on rain-fed crop production in Sub-Saharan Africa (SSA); it projects a bleak outlook for the majority of staple crops [
5,
6,
7]. With a high share of rain-fed cultivation, Ugandan crop production is more exposed to climatic variability than its neighbors in the Eastern African region. All the Matooke (plantains), cassava, sorghum, and more than 90% of the maize produced in the country are not irrigated and hence vulnerable to climatic changes.
In the past, different methodologies have been employed to assess the climatic impact on crop production (both rain-fed and irrigated), each with its contributions and limitations. Wasige et al. were probably the first to classify Uganda into agro-ecological zones and analyze the climatic crop yield impact [
8]. Bagamba et al. [
9] describe a method using a statistical model (the tradeoff analysis model for multi-dimensional impact assessment (TOAMD)) to analyze historical data and derive relations. The model, though based on sound statistical principles, does not offer any spatial insights. Waithaka et al. [
10] and Dale et al. [
11] present the modelling results from the International Model for Policy Analysis of Agricultural Commodities and Trade (IMPACT) developed by the International Food Policy Research Institute (IFPRI). They provide good district level detail on yield variations under different emission scenarios, but they do not evaluate main staple crops like Matooke, which pose a higher food security risk than cash crops like coffee and tea. Villegas and Thornton [
6] use the results derived from an EcoCrop model to give broad indications on the impact of climate on nine major crops in the African continent. They chose five general circulation models (GCMs) and explored two representative concentration pathways (RCPs) (4.5 and 8.5 W/m
2). The above literature is only a small selection and there exist many more studies that try to approach the problem from different scientific and institutional perspectives. However, none of them explores the different extremes (not to be confused with extreme events like droughts and floods) that could be realized from the set of climate projections available under the Coupled Model Inter-Comparison Project (CMIP5) umbrella. The methodology developed for this analysis explores the gap mentioned above by taking into consideration the scenarios of extreme water availability from the available CMIP5 projections.
To address the growing food production concerns arising due to the climate, resource distribution, and management practices, to name a few, the government introduced an irrigation master plan [
2,
12] to be effective until 2035. The master plan provides a detailed technical pathway for irrigation infrastructure but does not discuss the energy implications of irrigating a large portion of the cultivatable land. Additionally, water availability under different climates will play a key role in determining the energy demand for irrigation. An arid future will increase crop water needs and hence increased pumping activity for irrigation. Hence, the master plan, though detailed on agricultural aspects, does not explore the interactions between the water–energy–food (WEF) systems, which this analysis aims to achieve.
Implementing policies in one sector (water, agriculture, energy, etc.) without taking into consideration the interactions and propagation effects on other interlinked sectors could lead to lopsided decisions, as demonstrated in different case studies [
13,
14,
15,
16]. In the last decade, the nexus between the WEF systems and inter-sectorial policymaking has gained traction [
17,
18,
19,
20,
21]. In the Ugandan context, there have been some national level nexus assessments [
22,
23] that explore the intersectoral synergies and tradeoffs in the country.
Under the larger umbrella of the WEF nexus, we attempt to shed some light on two research areas, first, on the climatic impact on rain-fed crop production in Uganda, taking into consideration a baseline and a set of dry and wet climate futures. The second focus is on an initial estimate of the pumping energy demand (for irrigation)—under different climates—taking into consideration site-specific crop water requirements, water table depth, and some limitations that arise from the non-availability of granular data.
A combination of GIS routines and a WEAP (water evaluation and planning tool) model developed for the region are used to highlight that despite the cumulative decrease in crop production under a dry climate and vice-versa, yearly variations will play a critical role in meeting local demands and minimum dietary requirements in the country. We estimate crop and catchment specific production changes for the analyzed climatic futures along with the energy demand for pumping water.
3. Results
In this section, two main outputs of this analysis are presented.
- (i)
The yield variations on rain-fed crop production under a baseline and a set of cumulative wettest and driest climatic futures.
- (ii)
The energy implications of implementing the irrigation master plan (to pump water).
3.1. Climatic Impacts on Rain-Fed Crop Production
In this section, we explore the decadal variation in Ugandan rain-fed crop production under the identified driest and wettest climate (cumulatively) futures. The analysis focused on seven major crops (Matooke plantains, cassava, maize, sorghum, coffee, sugarcane, and rice). The main paper discusses the results for principle staple crops: Matooke, cassava, and maize.
Table 2 shows the difference in crop production—on a national scale—for the cumulatively wettest and driest climates in comparison to the reference. We noticed that the crops varied in their response to climatic changes but showed a consistent increase in production for the wet scenario. For the driest scenario, there was a reduction in crop production, but the decrease was not as pronounced as the increase in the wettest scenario.
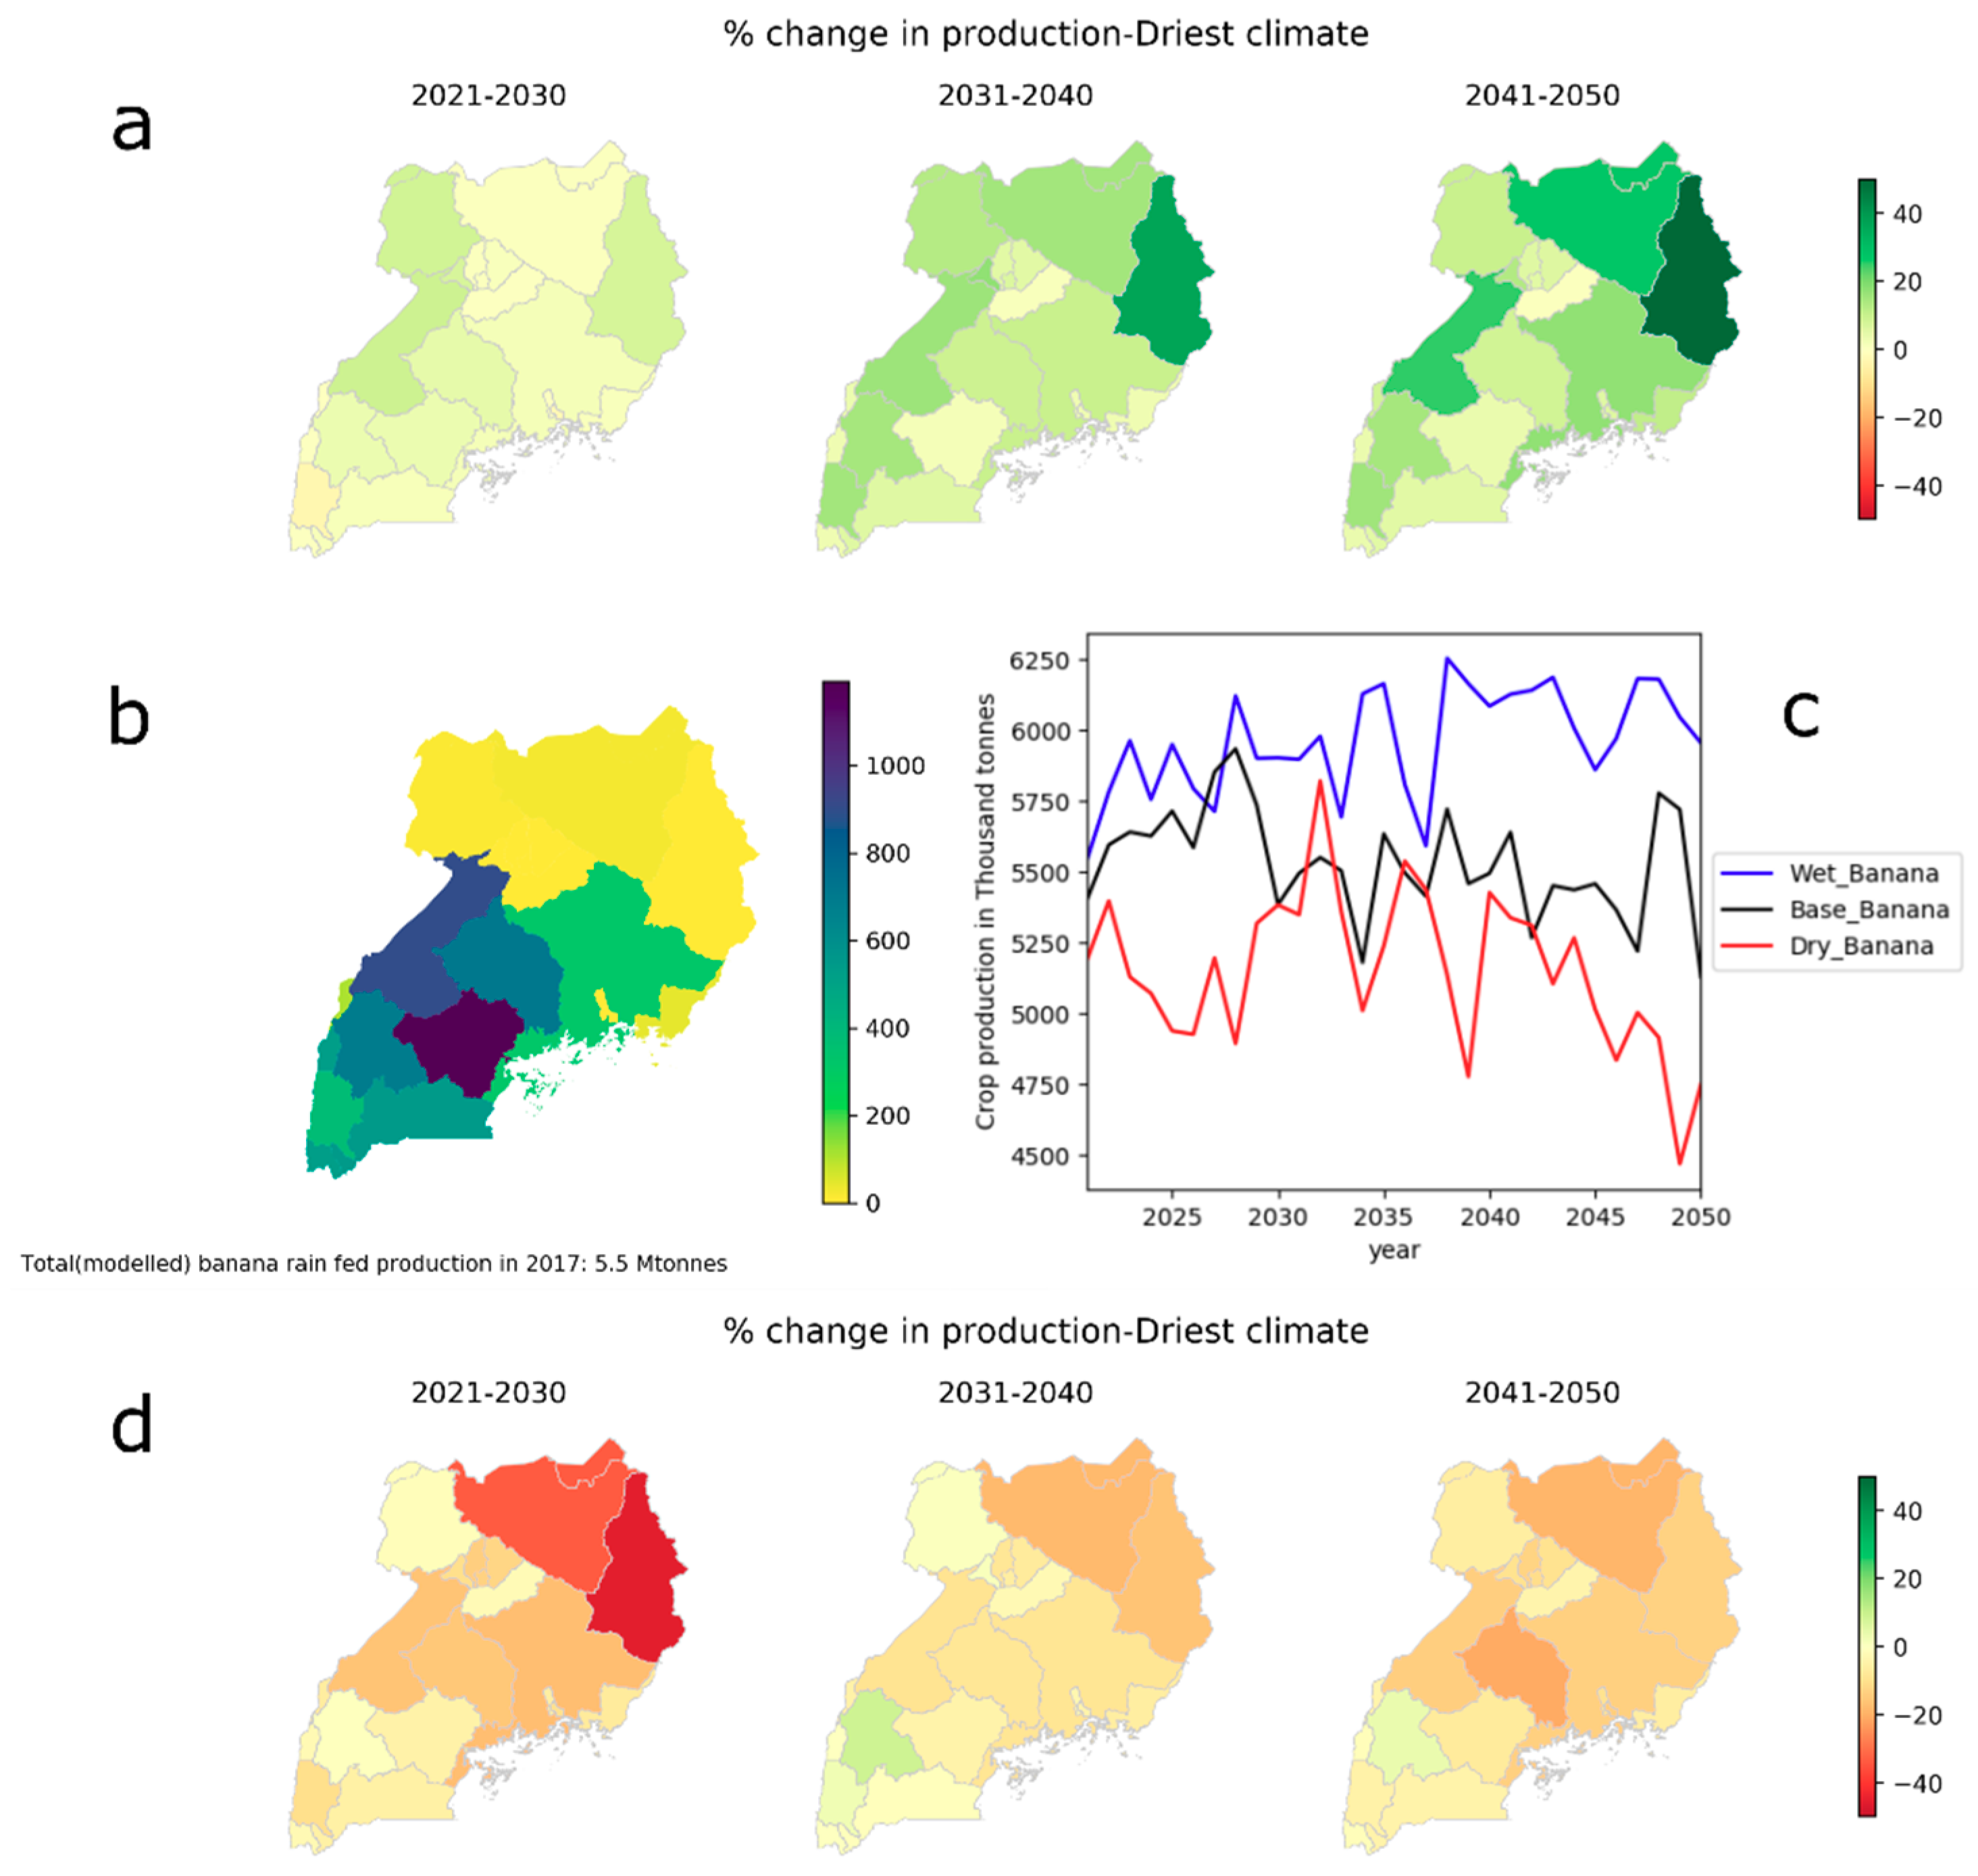
Figure 7,
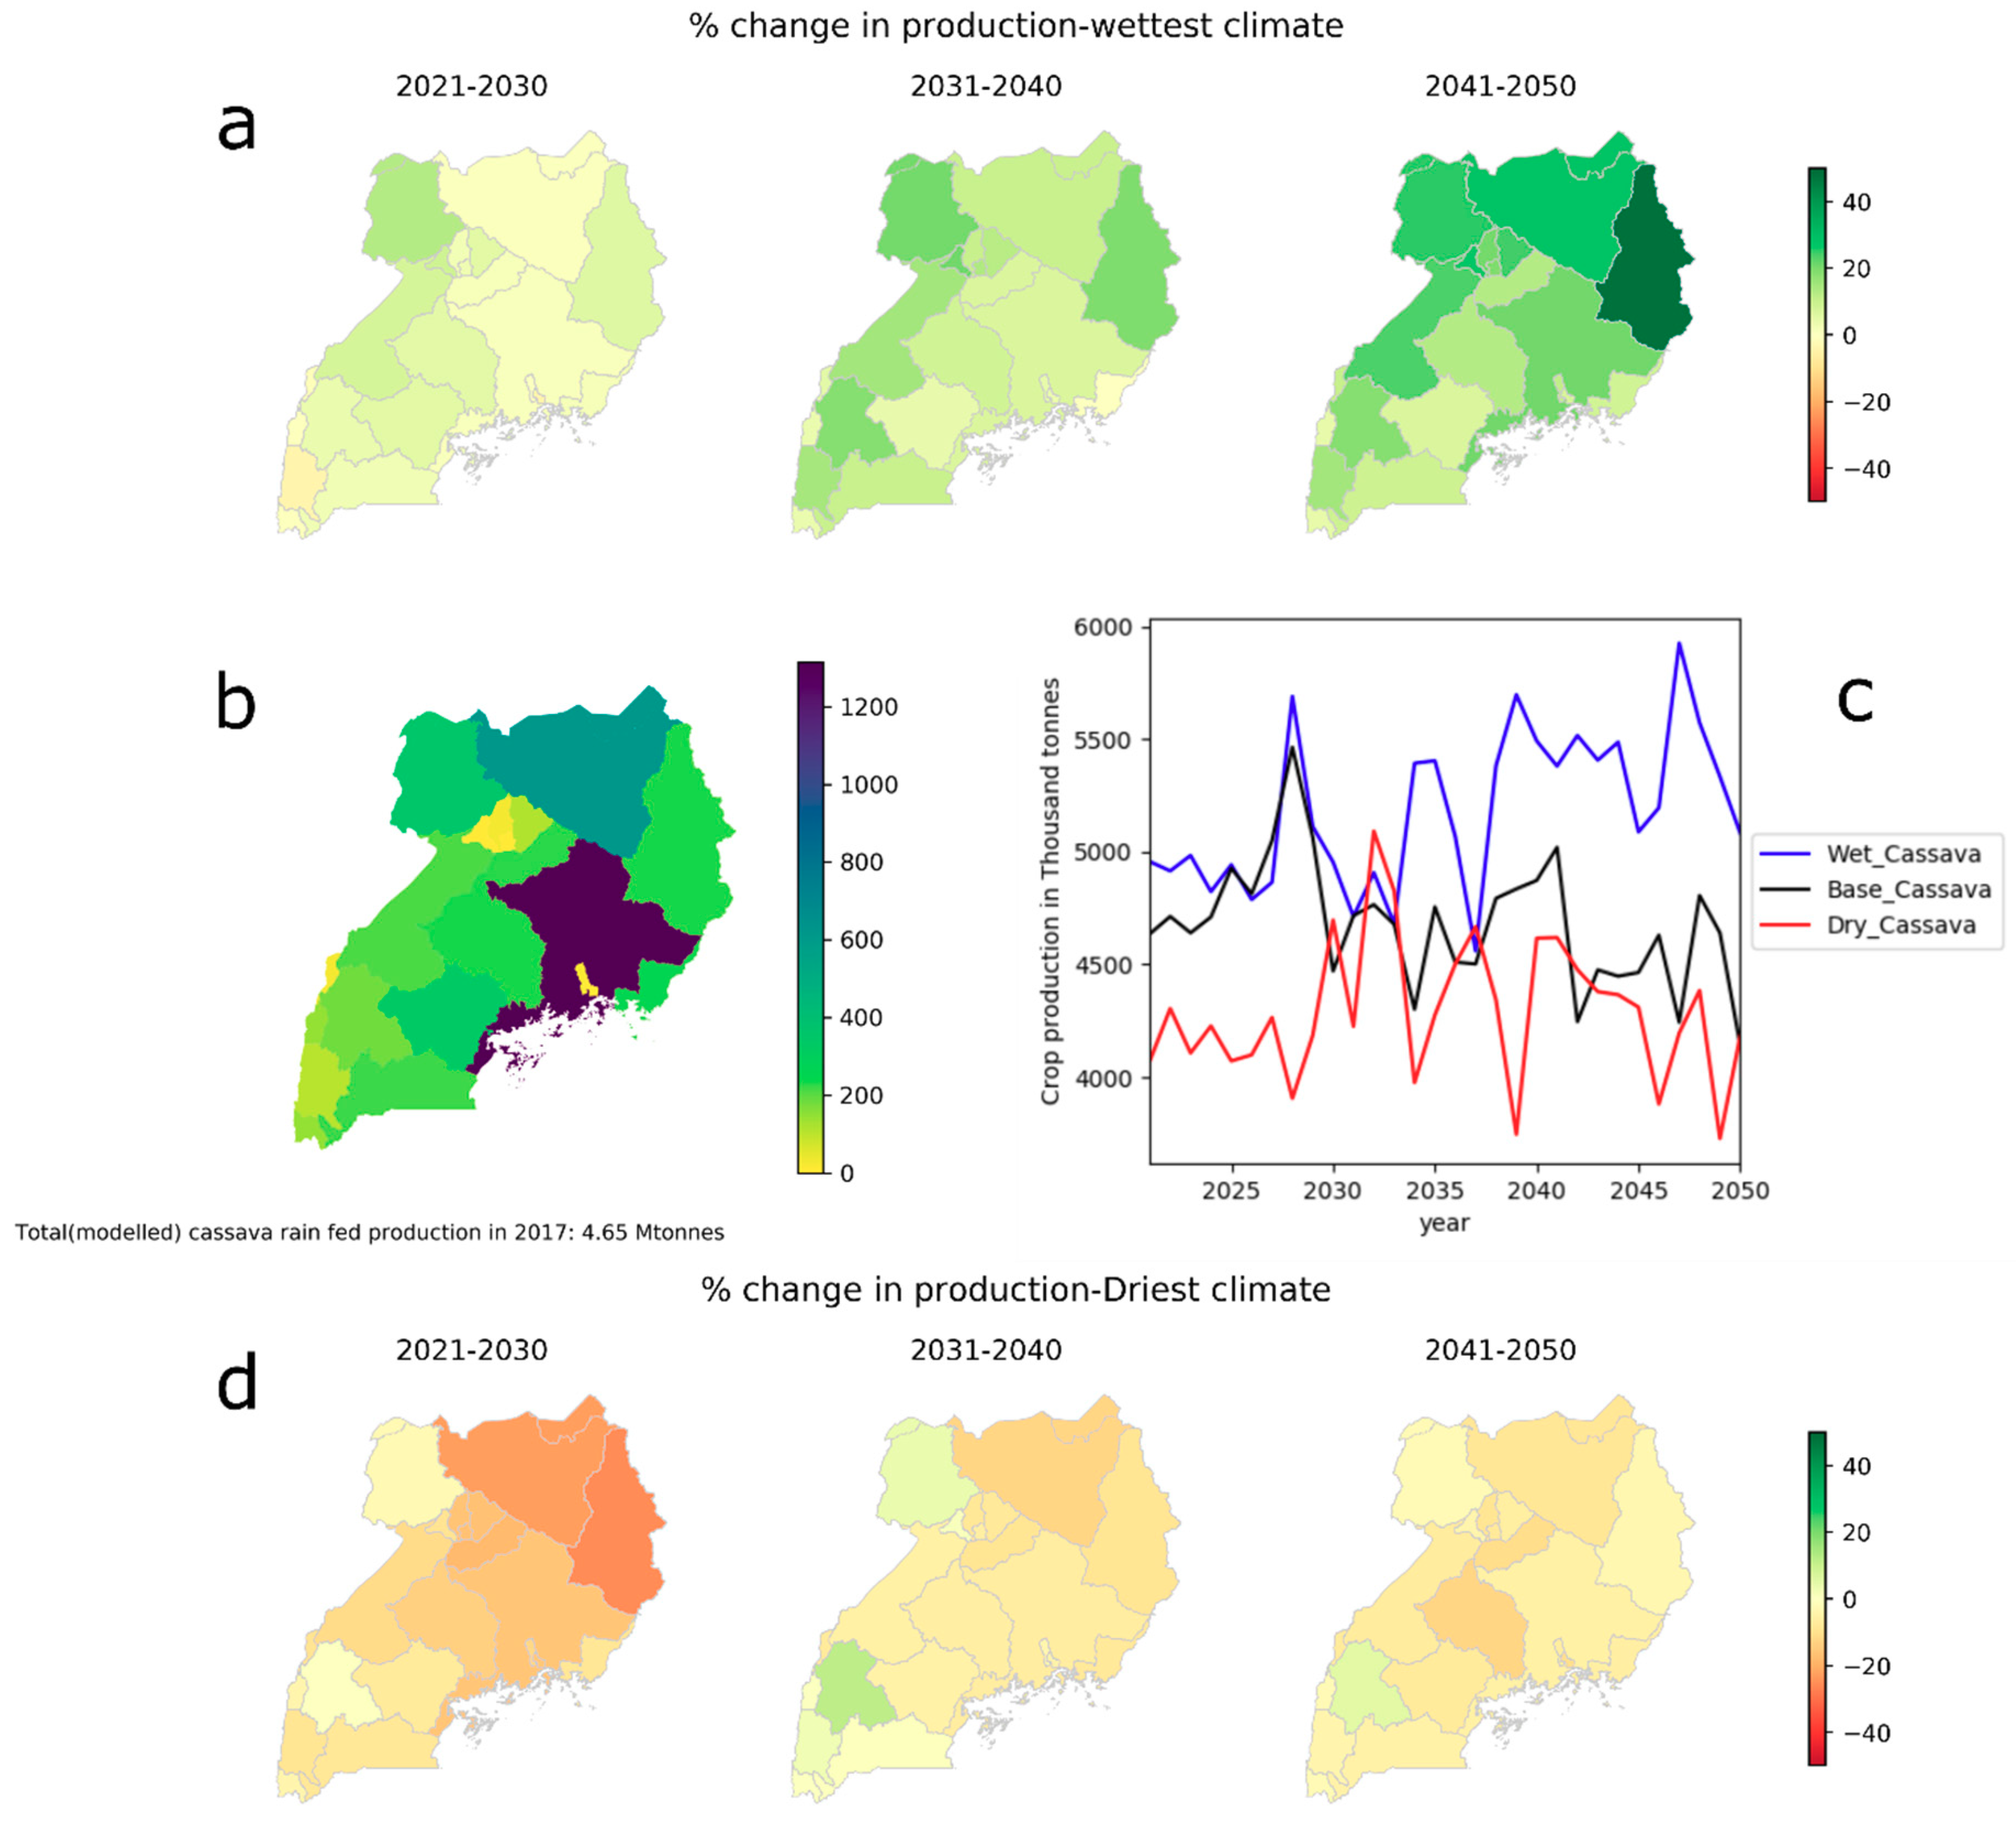
Figure 8 and
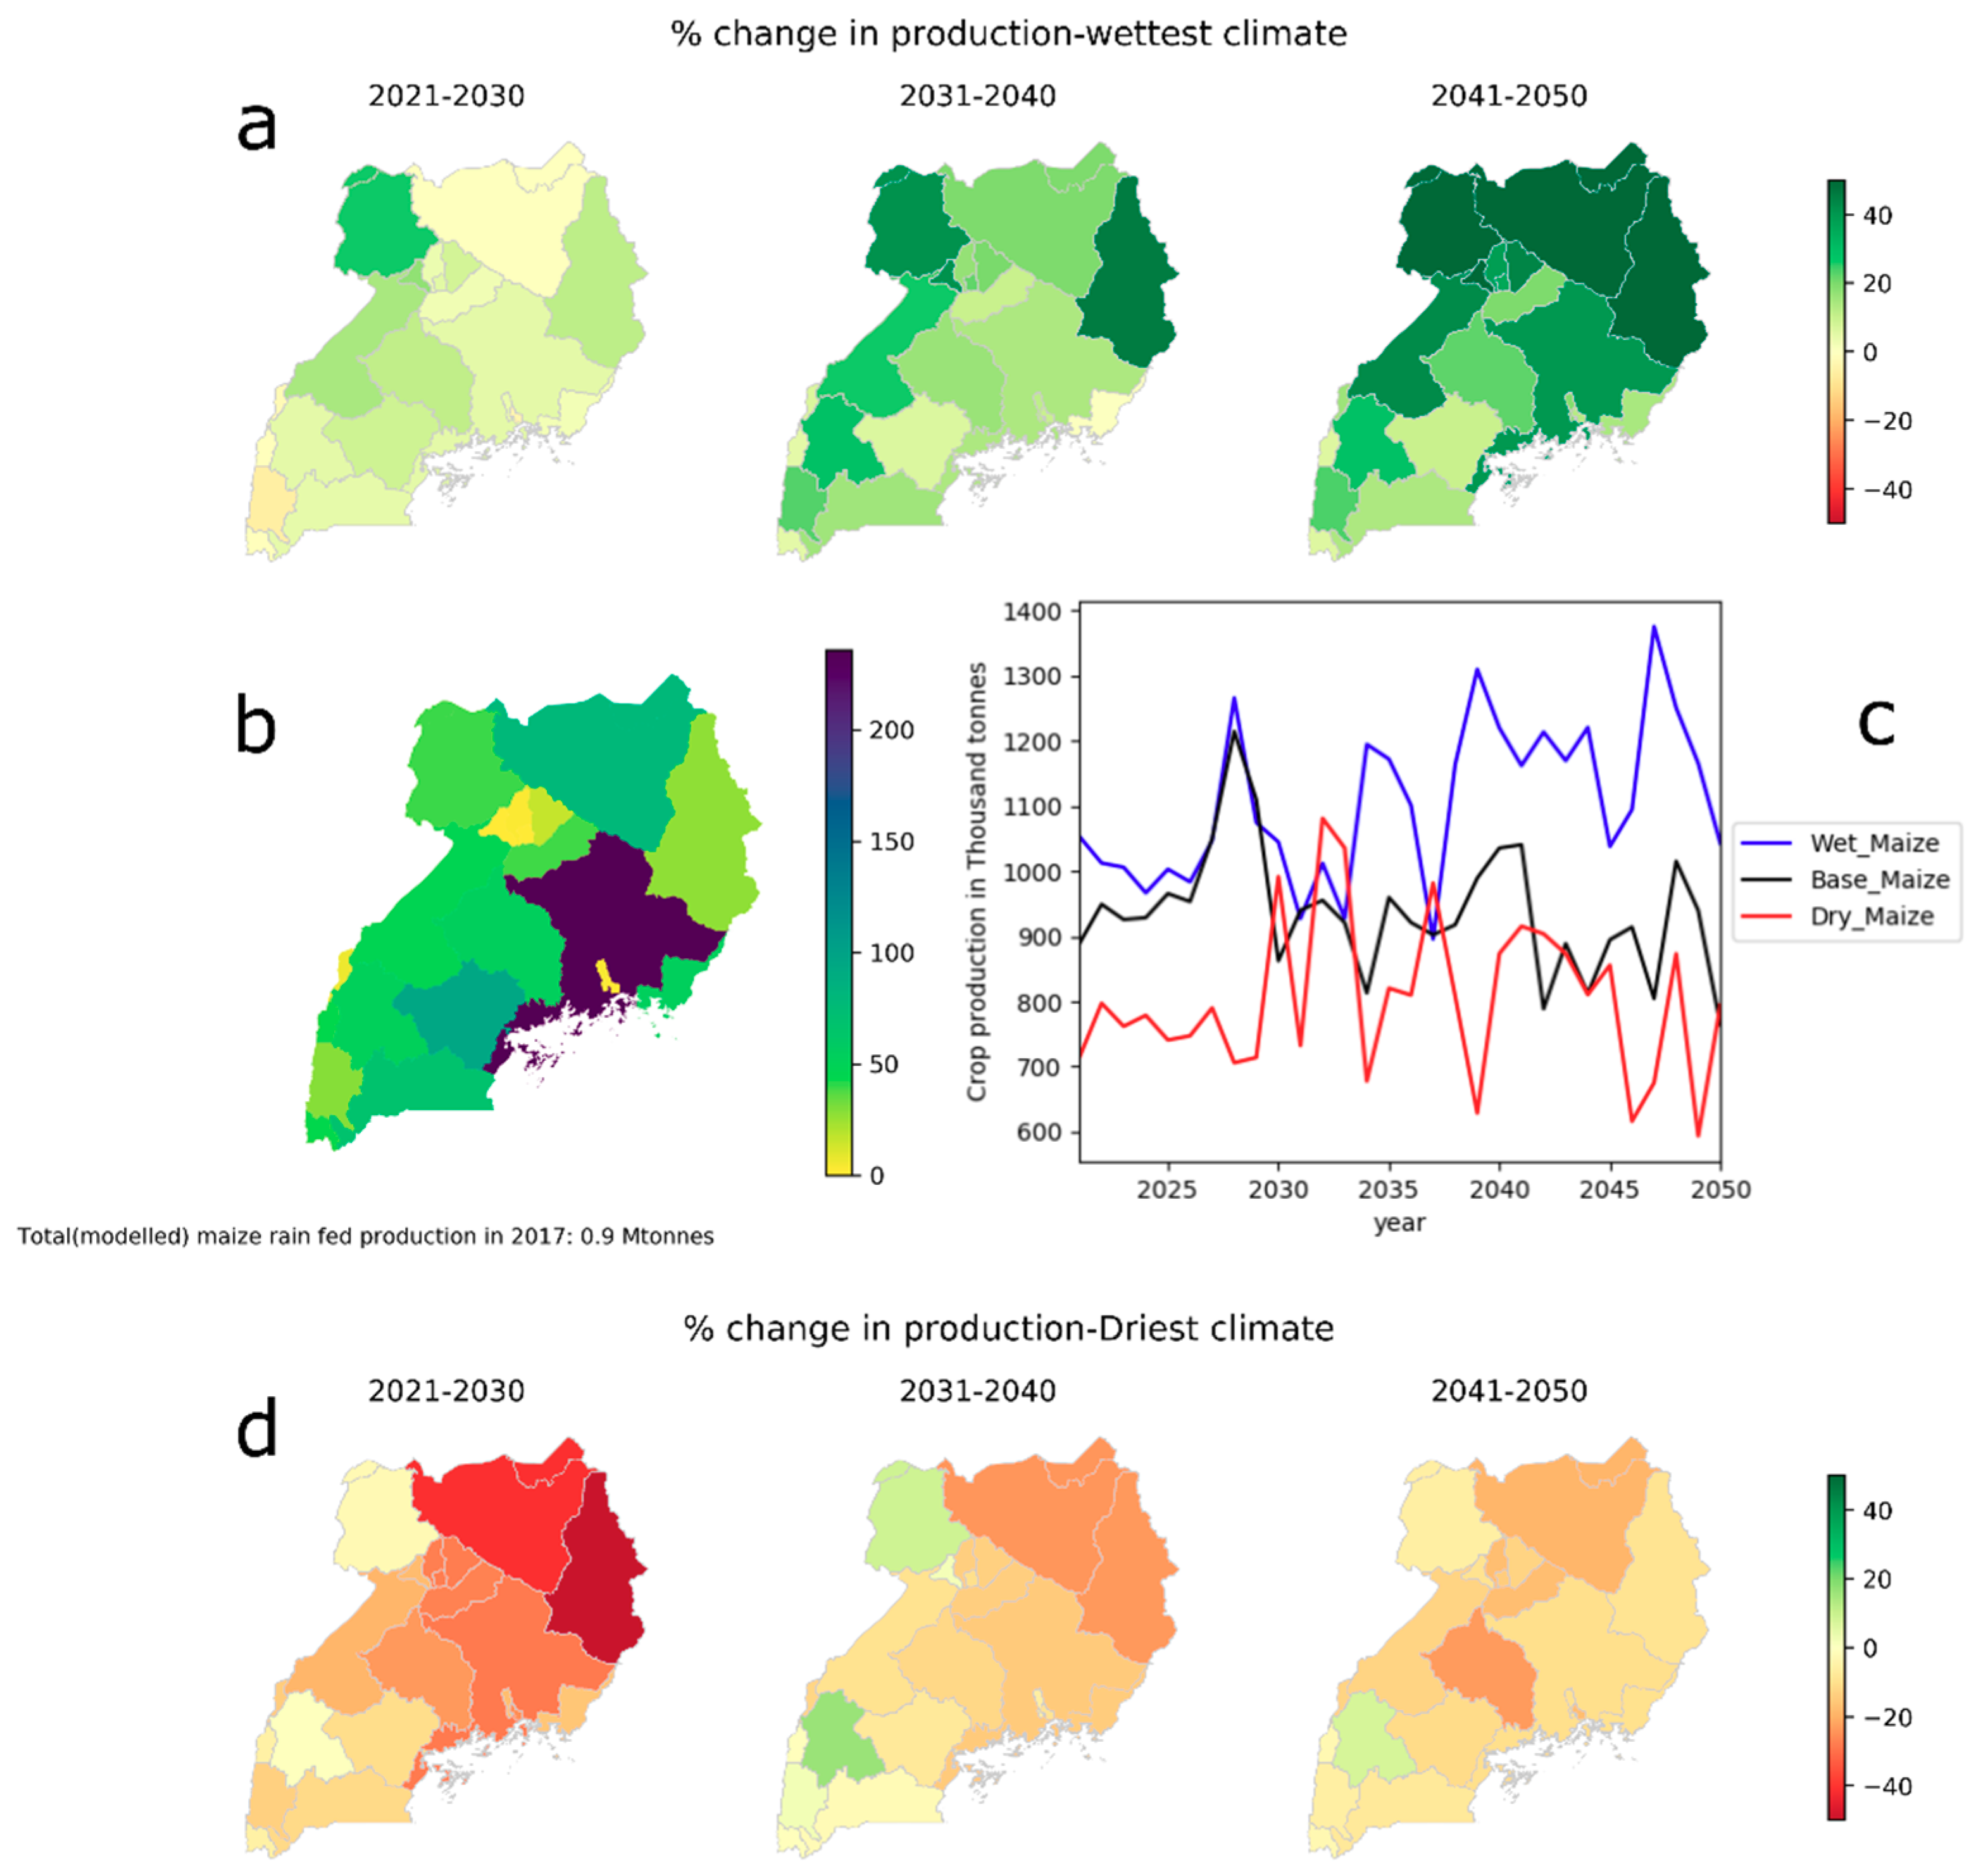
Figure 9 illustrate the potential variation in crop production (rain-fed) under the wettest and driest scenarios for three major crops. Each figure has four parts. Parts (a) and (d) highlight the catchment specific differences in crop production in the wettest and driest climate futures and the reference scenario, respectively. The three sub-figures in part (a) and (d) relate to the decades between 2020 and 2050. Part (b) illustrates the production (absolute) in different catchments as of 2017 (modelled) to serve as a reference to differentiate high production regions from the rest. Part (c) gives the modelled yearly production, on a national scale, for three climate futures: the reference, and the cumulatively wettest and driest. It must be noted that parts (a) and (d) should always be interpreted in relation to part (b).
In the case of Matooke bananas (plantain), the western and central catchments produced almost all the crop in the country. Hence, a small change in production, especially in the Isingoro, Bushenyi, and Mbarara districts (in the western part of the country), is expected to create a substantial impact on the principal staple food in the country. On the contrary, a significant percentage change in the northern and eastern regions is not expected to make a big difference as they account for less than 2% of the total plantain production. It must be noted that the driest and the wettest climates were cumulatively dry and wet. We noticed that some catchments in the western region experienced an increase in production in the last two decades under the driest climate future. On a national scale, plantain could suffer a significant reduction in yield in the first decade (about 8–9%) in the driest climate, compared to the baseline, whereas the increase in the wettest scenario is not as pronounced (3–4%). The last two decades (the 30 s and 40 s) are expected to experience a reversal; the magnitude of yield increase in the wettest scenario is expected to be more pronounced when compared to the decrease in the driest.
Figure 8 illustrates the climatic impact on the production of cassava, which is the second most-produced staple crop in the country.
We noticed that the catchments in the northern and eastern regions produced a significant share—almost two-thirds—of the cassava in the country. Areas around Lake Kyoga, where the share is the highest, could experience a significant reduction under the driest climate. Similar to plantains—on a national scale—the deviation in cassava production under the climatic futures are expected to be more pronounced in the first decade for the driest and the last decade for the wettest future.
Maize, the third most important crop by area harvested and total production, is a staple crop for the urban poor in Uganda and one of the critical staple exports [
65]. Cultivated primarily in the eastern and western regions of the country, maize is also a cash crop as it is exported to the neighboring DRC, South Sudan, Tanzania, and Kenya.
Figure 9 illustrates the climatic impact on rain-fed maize in Uganda. The analyzed climates are expected to produce a broader yield variation in comparison with plantain and cassava, with a significant change expected around Lake Kyoga. It must be taken into consideration that maize is also one of the few crops that is irrigated in Uganda, and the share is only expected to increase.
As part of this analysis, we also analyzed four other crops.
Figures S9–S12 in the Supplementary Materials illustrate the impact of climatic extremes on coffee, sorghum, rice, and sugarcane. Sugarcane production is expected to have a larger impact in the analyzed futures than on sorghum, rice, and coffee. Coffee, which constitutes approximately 18% of the total Ugandan exports, is grown at high altitudes (Mount Elgon in the east and the Rwenzori in the West) and some other lower altitude regions. Almost all the coffee in Uganda is rain-fed except for some minor pockets that are drip irrigated. Without a resilient climate plan, a significant share of Ugandan coffee exports could be exposed to the impacts of potential dry futures.
The impact of changes in precipitation and temperature on rain-fed agriculture gives us a glimpse of the food security concerns, especially for the economically poor and arid regions of Uganda where there is limited access to modern machinery, fertilizers, and irrigation facilities. Furthermore, since rain-fed agriculture is expected to be the mainstay in Uganda for the foreseeable future, the prospects of a dry climate, could result in a reduction in the seasonal food supply. With the population expected to reach 90 million in 2050, an 8% decrease in plantain production, owing to a low shelf life period, could increase levels of food insecurity in the country.
The following section highlights the energy (pumping demand) implications of implementing the irrigation master plan.
3.2. Irrigation and Energy Requirements
As of 2015, 0.1% of the total agricultural production comes from irrigated land [
11]. The master plan identifies an irrigation potential of about 567,000 ha, which when brought into practice will also warrant for an increase in infrastructure and, specifically, energy-related investments. Uganda is endowed with abundant water resources, but it is also essential to account for their location, seasonality, modes of transportation, and the associated costs when determining their availability. In this article, we estimated the energy requirements for irrigating the crops, as per the master plan, under the identified climatic futures.
Figure 10 illustrates the difference in total water requirement for irrigation under the three climate futures, on a national scale. Towards the end of the modelling period, we noticed the difference between the driest and wettest climate, brought about by the increase in land under irrigation and the combination of precipitation and temperature changes in the respective futures.
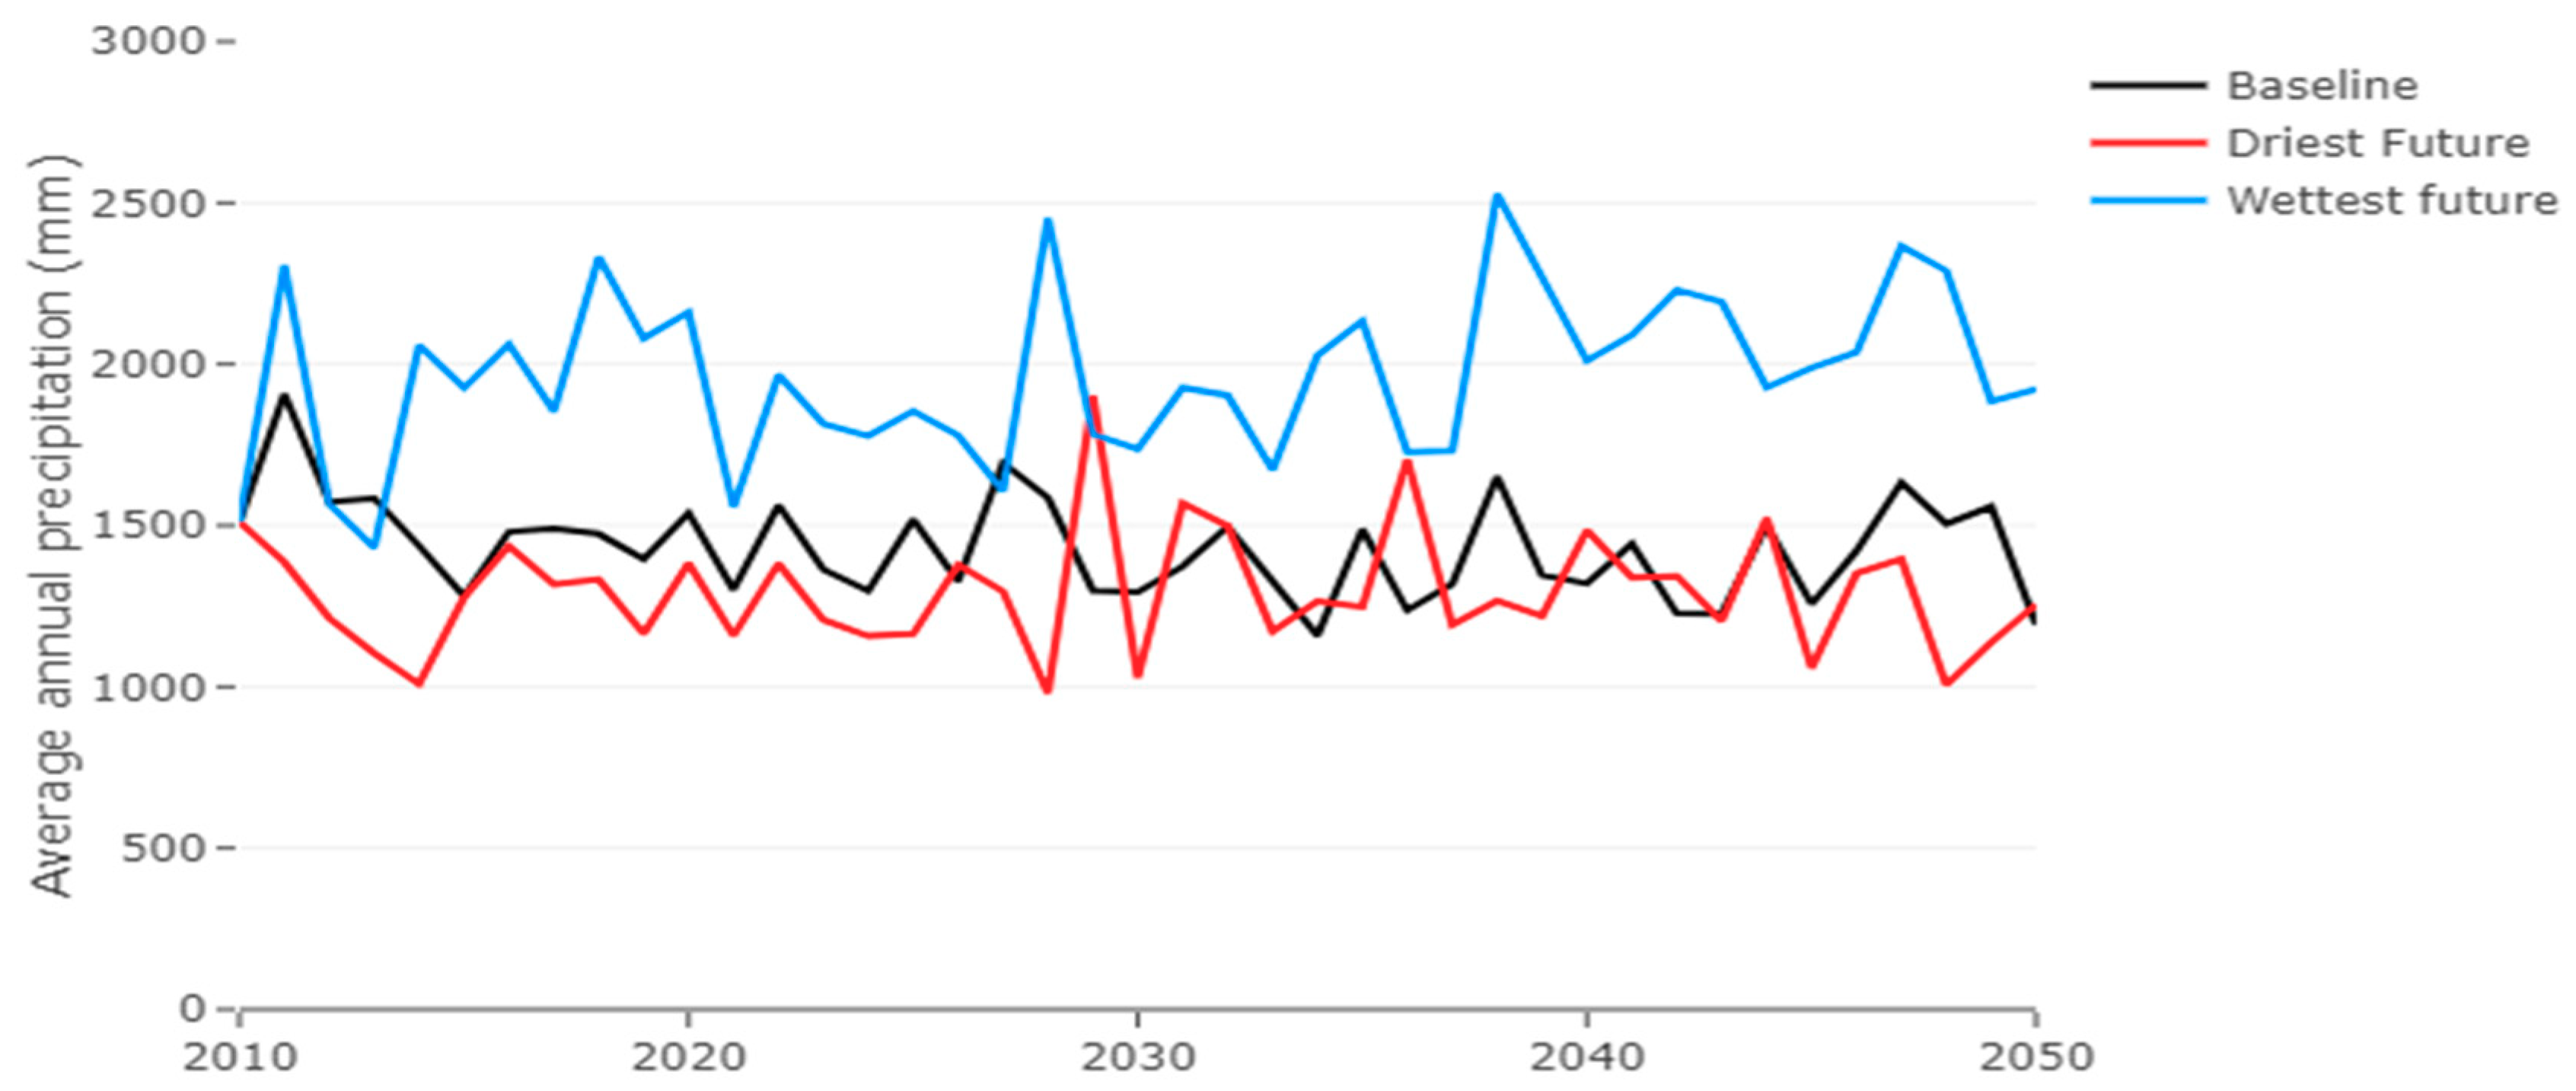
The average annual precipitation in the analyzed climate futures is given in
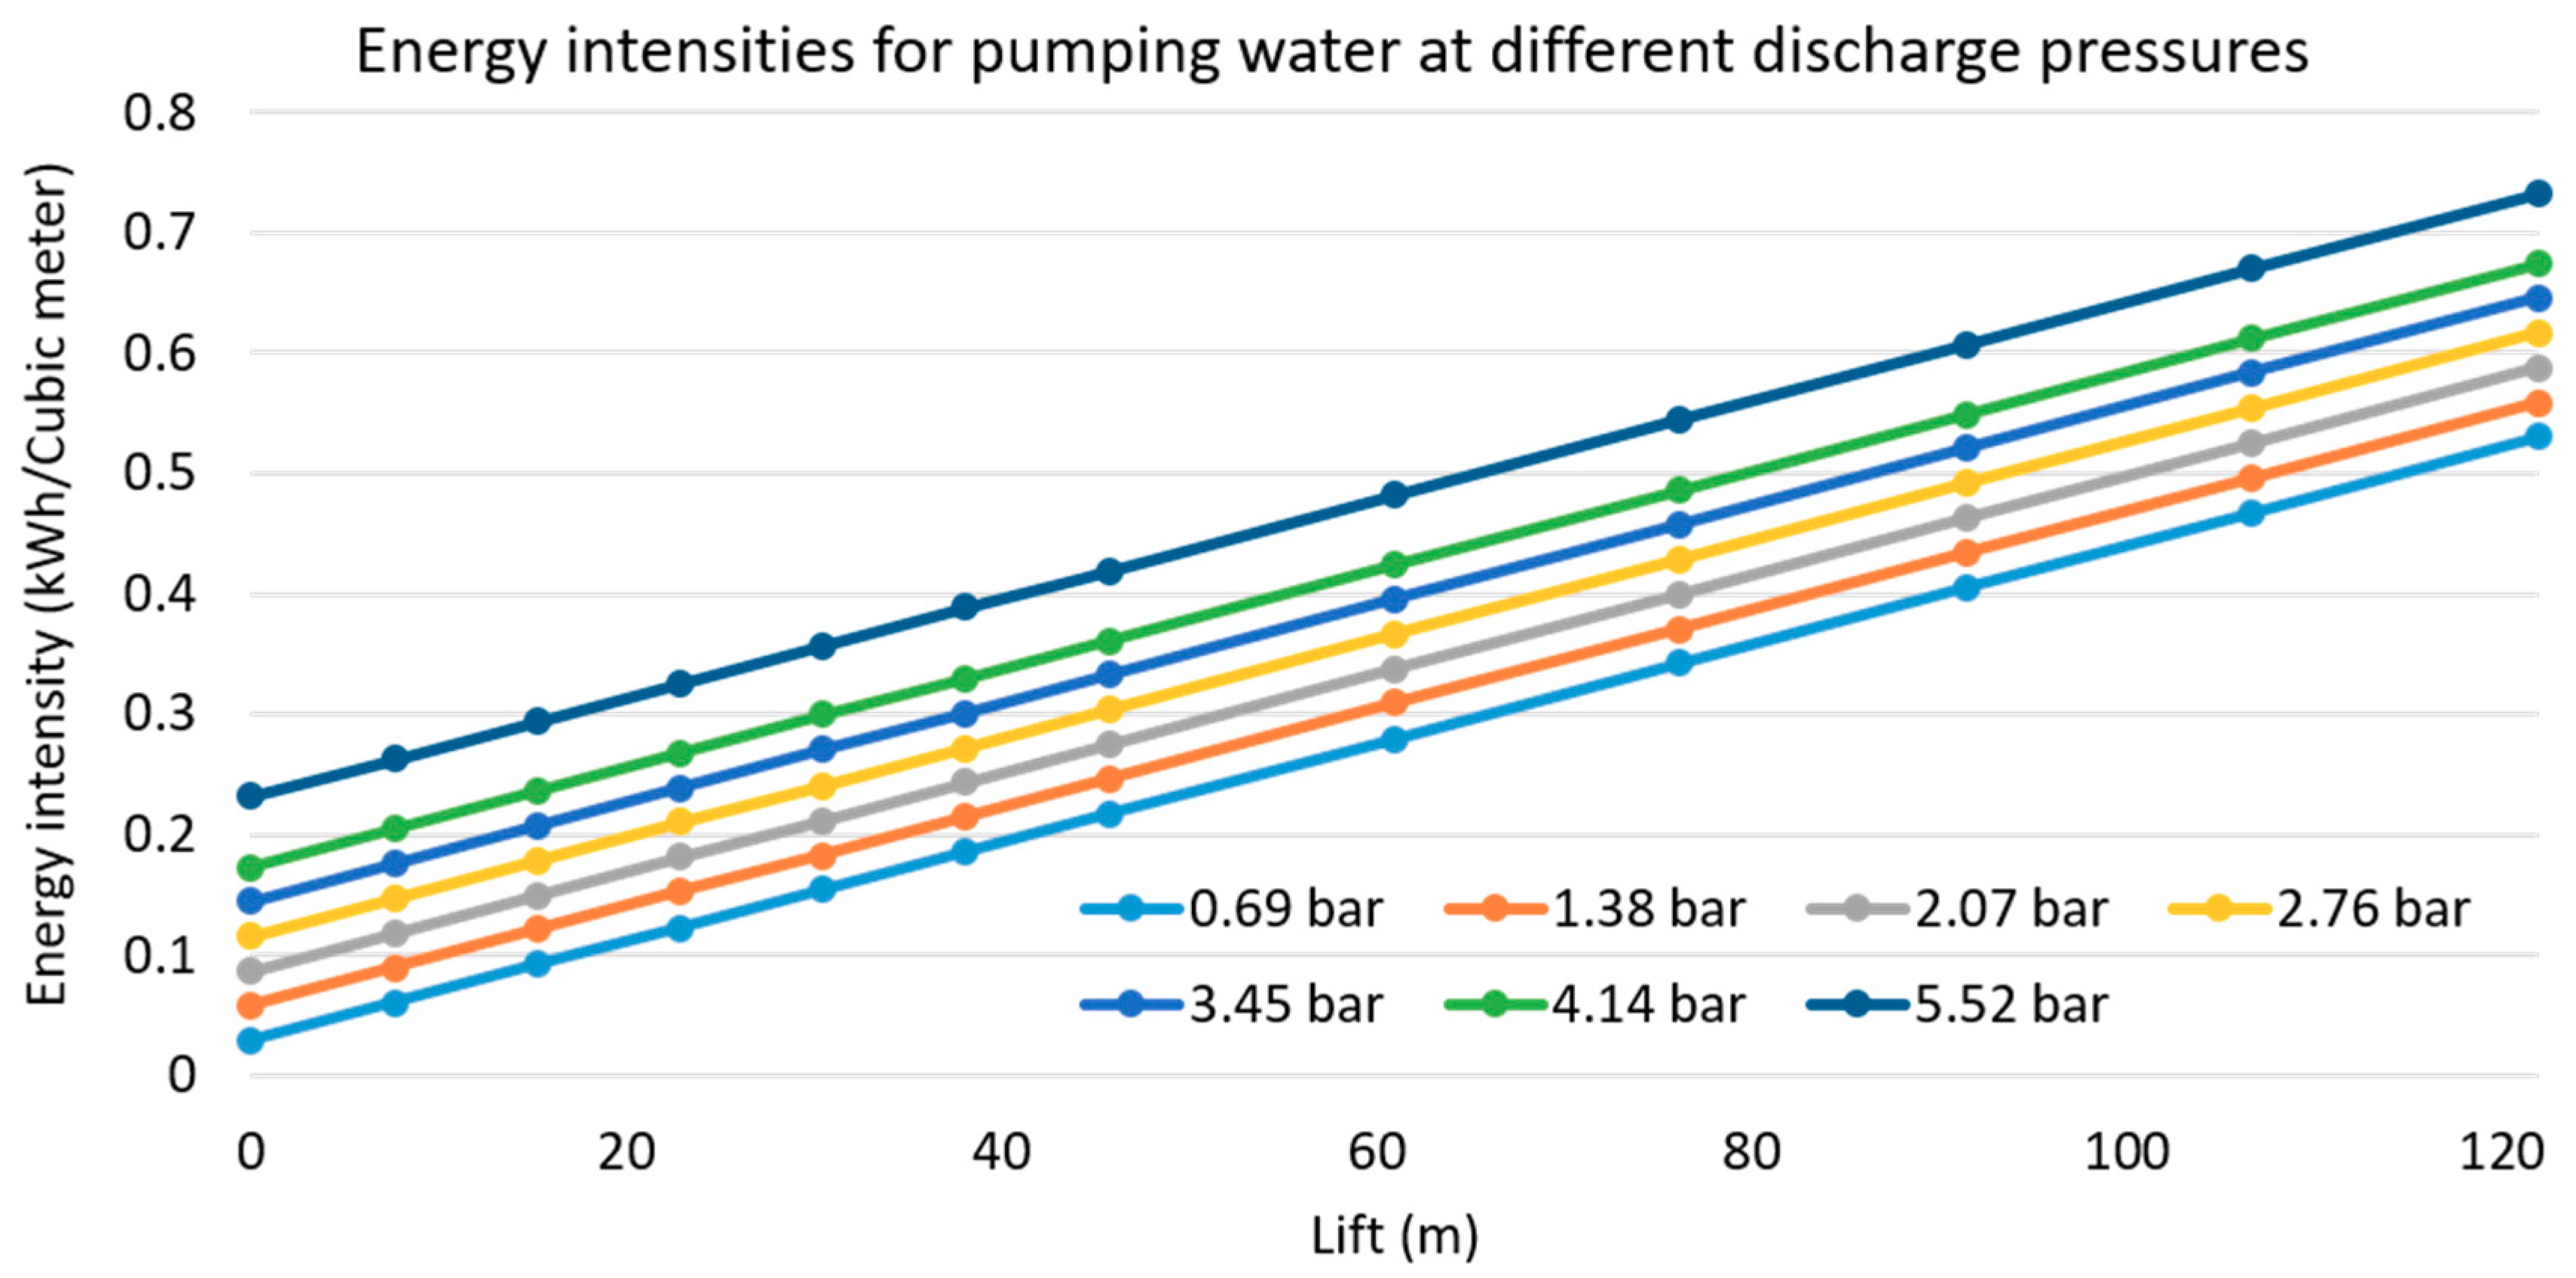
Figure 11. We noticed that even the driest climate future had an average annual precipitation of approximately 1000 mm; this is an indication of high rates of evapotranspiration in the country. The water requirement, in these results, is a function of the area that is brought under irrigation in each of the analyzed catchments, type of crop irrigated and the respective localized rates of evapotranspiration. To satisfy this water requirement, we calculated the energy required to pump it from groundwater sources using catchment specific average water table depths.
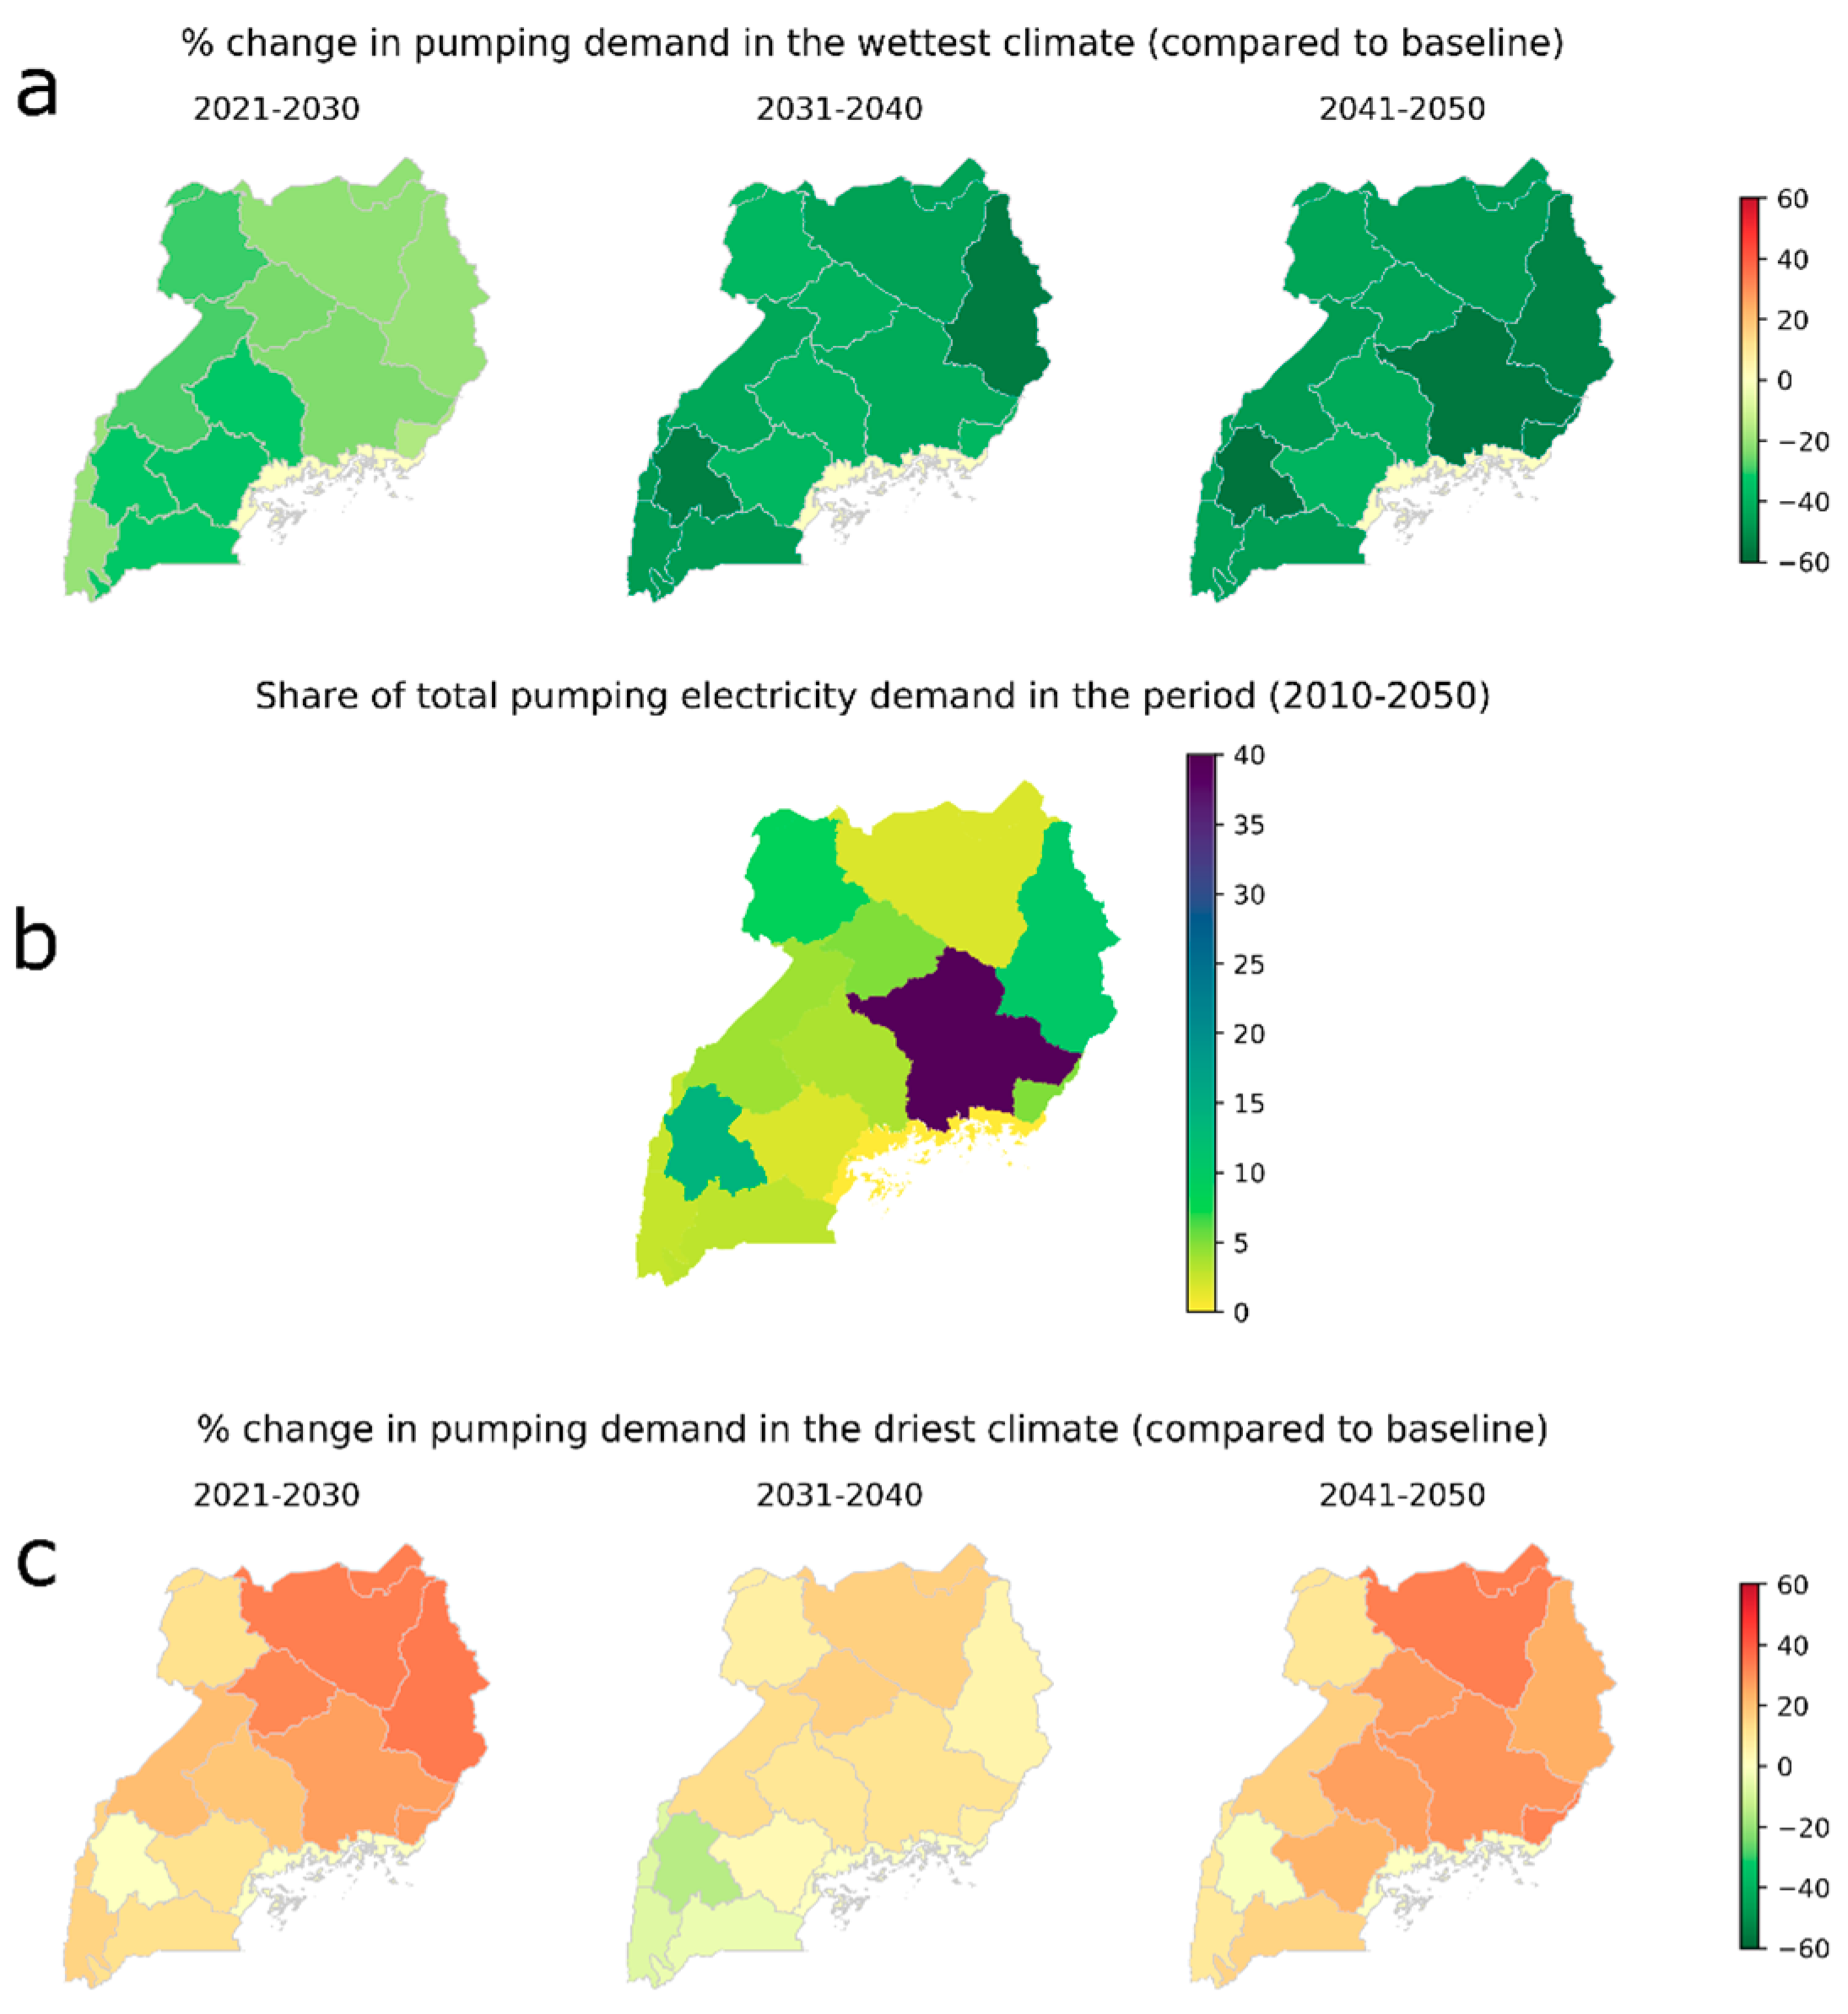
Figure 12 illustrates the differences in pumping electricity demand. Part (
a) indicates the decadal averages of the change in pumping demand in the cumulatively wettest future when compared to the baseline. The zero mark (0%) refers to the irrigation pumping demand in the baseline scenario. Part (
c) shows the same statistic for the cumulatively driest future. Part (
b) presents the catchment specific share of the total pumping demand in the country for the period (2021–2050). Parts (
a) and (
c) should always be interpreted in relation to part (
b).
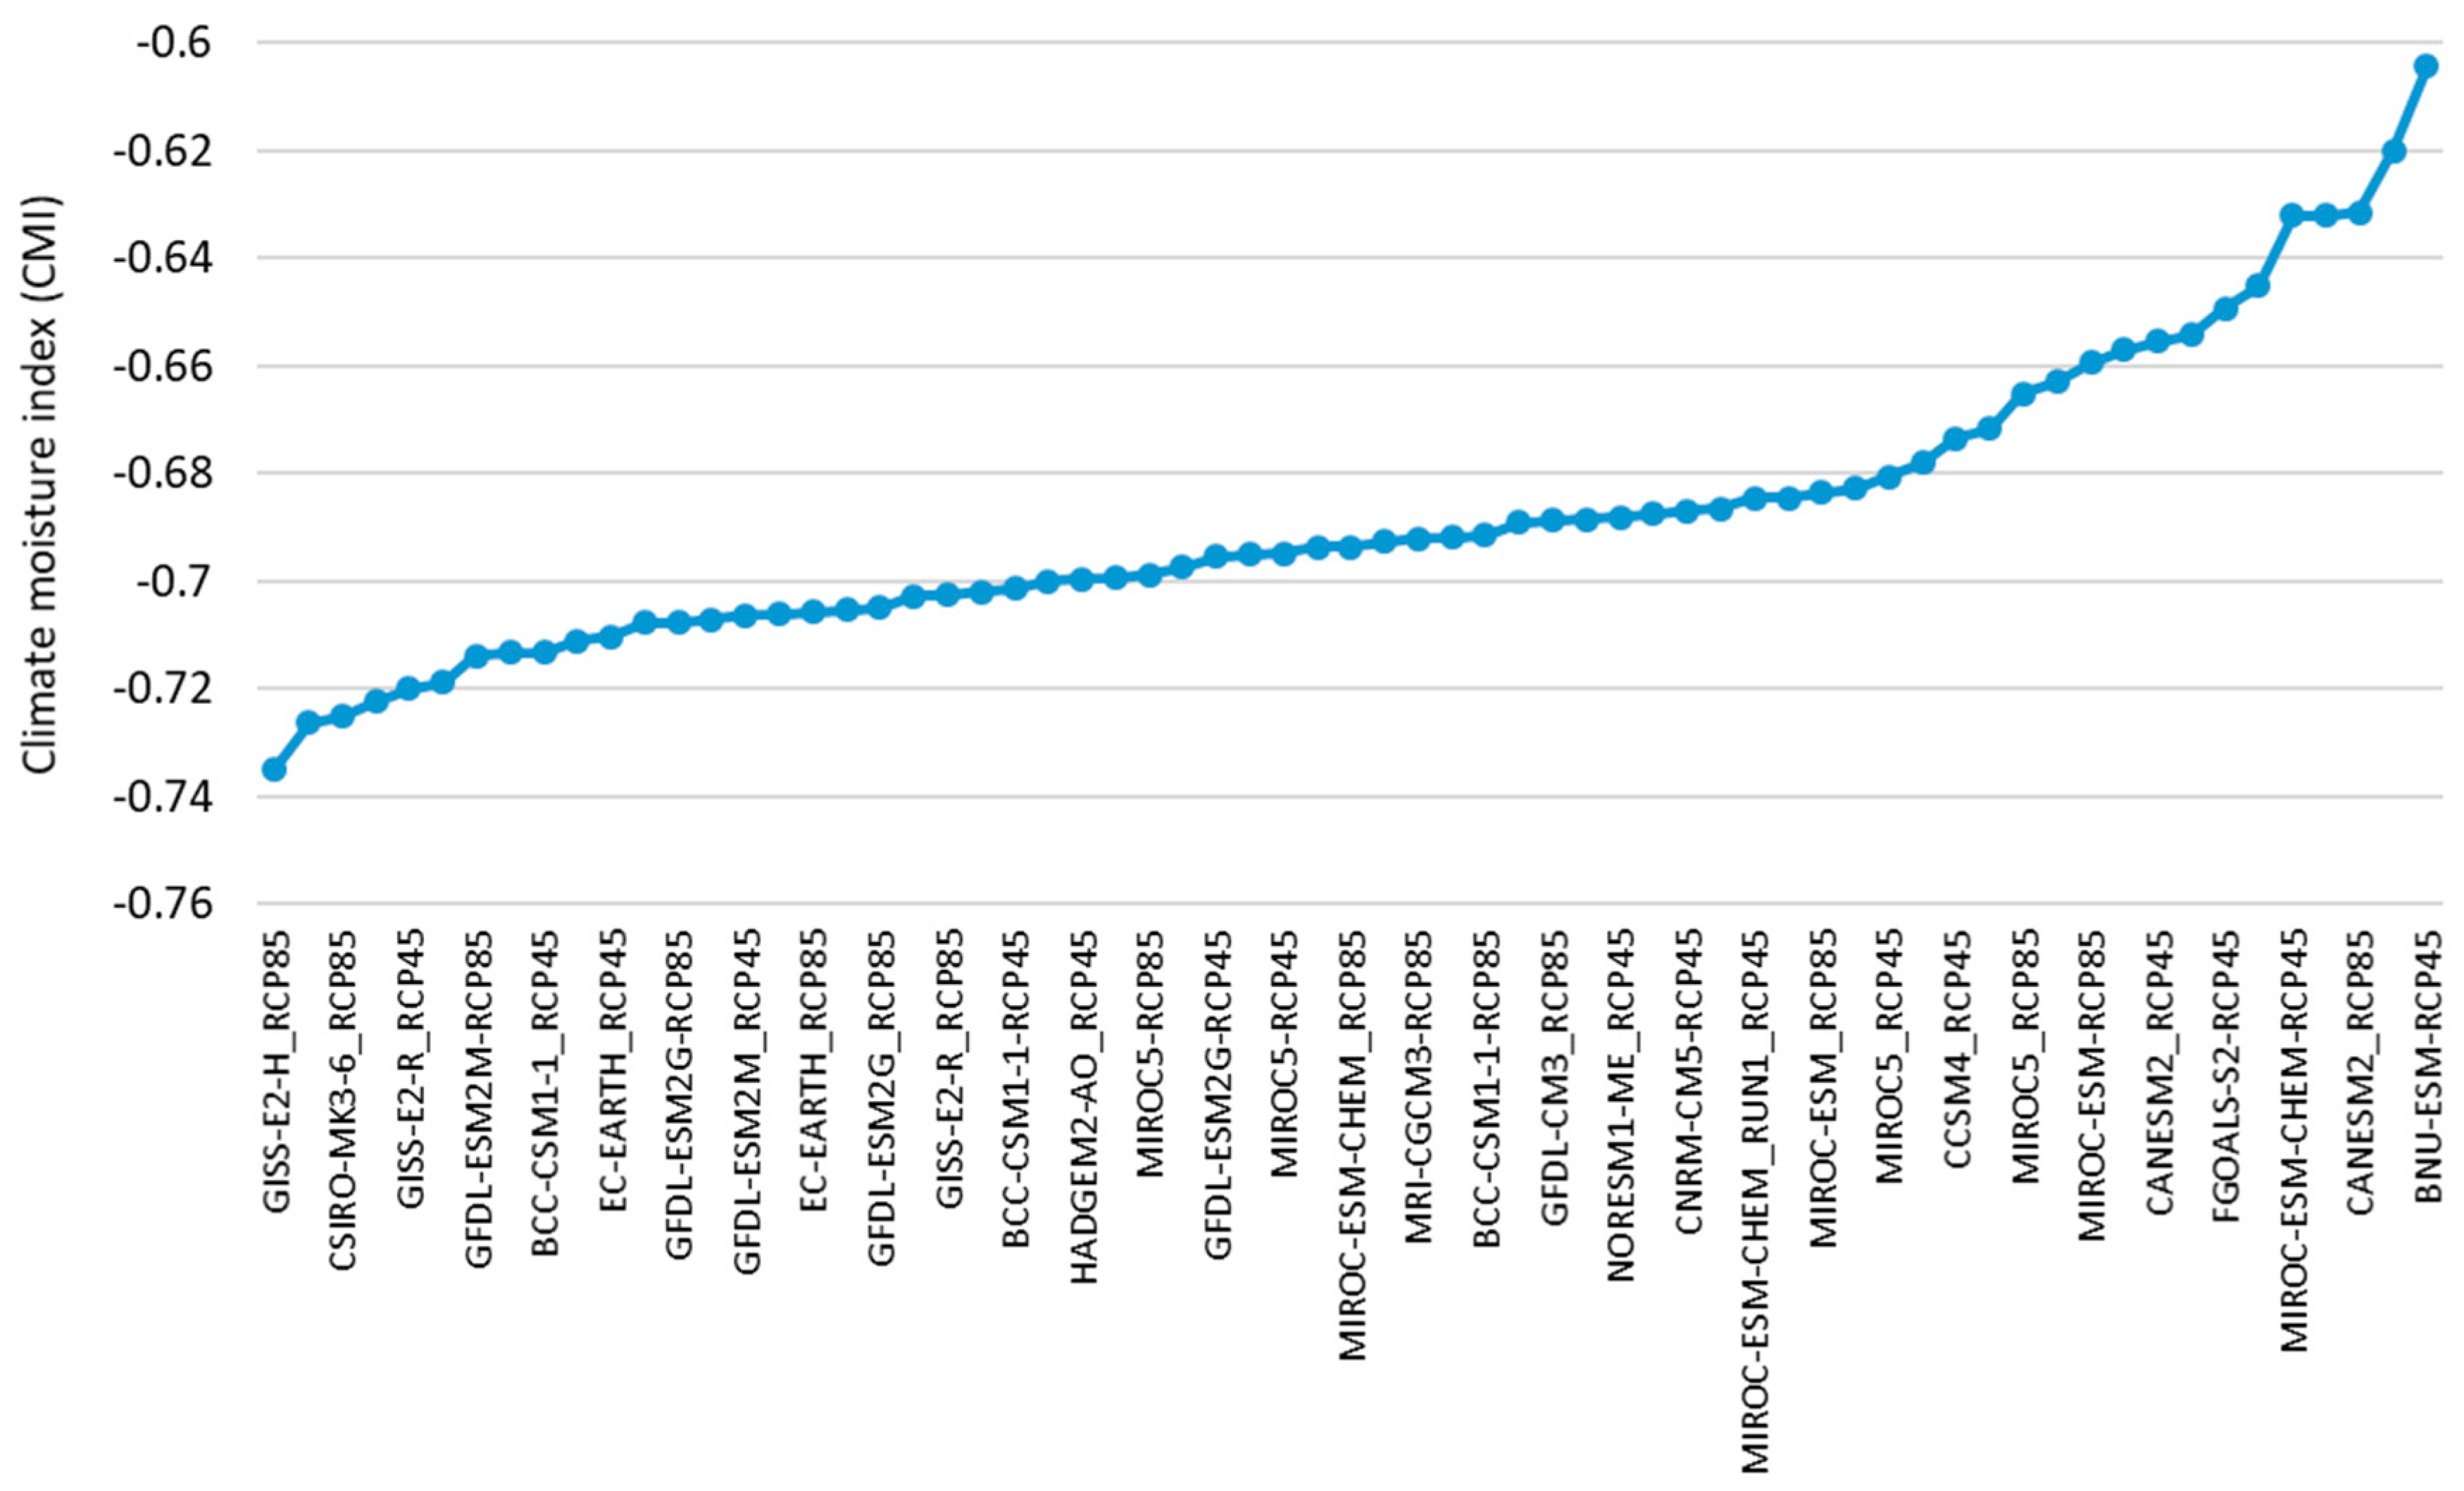
It is noticeable that irrespective of the climate, catchments around Lake Kyoga will have the highest share of pumping demand in the country, primarily due to the large area under rice cultivation that is expected to be irrigated. Catchments in the North, near river Aswa, have the lowest demand due to the least share of irrigated area (potential) in the country. Some regions along the shores of Lake Victoria are expected to have lower pumping requirements due to very high precipitation rates and the subsequent reduction in irrigation requirements. Under the cumulatively wettest climate, the pumping requirements are expected to reduce (compared to the baseline) while moving forward in the time, whereas, on the other hand, the demand for the driest climate is expected to reduce in the 30 s (2031–2040), compared to the 20 s and 40 s. One notable exception—in the driest climate—is the watershed around Lake George, where the pumping demand in the last two decades is expected to be less than the baseline. This is owing to lower relative change in temperature to the change in precipitation. We estimated that, towards the end of the modelling period, irrigating crops will require approximately 300 GWh of electricity each year in the baseline. The driest scenario is expected to require about ~11–12% more electricity compared to the baseline (for the entire modelling period), which is less severe than what we had expected. This behavior also sheds some light on the choice of studied climate futures. A climate future that is supposed to be cumulatively the driest—based on the average countrywide CMI—might not be the driest, taking into consideration irrigation water requirements and localized change in temperature and precipitation. This aspect must be taken into consideration when choosing climate futures in future studies.
4. Discussion
The results from this analysis indicate that despite the cumulative decrease in crop production under the driest climate future and vice-versa in the wettest, yearly variations will play a critical role in meeting local demands and minimum dietary requirements in the country. Uganda, on a national scale, receives abundant precipitation, but its variability and distribution are critical to sustaining crop yields [
66]. Bringing areas under irrigation, as identified in the irrigation master plan and the NWRA, is a natural choice considering the amount of renewable water resource in the country. It must be noted that, in this analysis, we considered only four crops (rice, maize, vegetables, and sugarcane) to be irrigated, with rice paddy being the largest by area. Hence, we arrived at a conservative estimate of the total pumping electricity demand. If plantain and the majority of maize cultivated in the country are irrigated, the electricity demand is only expected to increase rapidly. Cassava, being a draught resistant crop (with a
Ky < 1), is not expected to be irrigated in the near future.
On average, in the reference scenario, to achieve a set yield of 6600 kg/ha, the plantains are expected to experience a yearly evapotranspiration (
ET) shortfall of about 1.8 bcm of water, and this estimate is expected to jump to 2.5 bcm under the driest climate. We must also bear in mind that this estimate is when the expected yield is 6600 kg/ha. If the expected yield is higher, the ET shortfall and the energy required to pump/transport water to meet crop-water demand will rise sharply, putting a strain on the electricity system. This causes an alarm not only from the point of view on electricity consumption but also from the unsustainable use of water resources, resulting in faster depletion. Another infrastructure-related concern is access to electricity in the country. As of 2016, ~ 27% of the country has access to electricity (on and off-grid) [
67]. Despite the efforts to extend the national grid and the establishment of mini-grid infrastructure to improve electrification, there is no guarantee that the expansion will take agricultural needs as a priority. Alternatively, diesel pumps are also used for irrigation. The difference in diesel and electricity price in the country will be crucial to making a choice. At present, Uganda imports all of its fossil fuel, but the situation could change with the recent oil finds in the Lake Albert region. Moreover, electricity price, which is one of the highest in the region (at present), could drop with better grid infrastructure and reliable electricity generation from hydropower plants. Another possible supply-side solution could be the use of agricultural and crop residues to generate electricity [
68].
Another important aspect that was not considered in this analysis is water pricing. Price per unit (m
3) of pumped water, electricity pricing, and the market value of the irrigated crop will play a crucial role in determining the prospects of irrigation. Fruits, vegetables, and flowers that have a lucrative export market make irrigation feasible/attractive when compared to plantains, which are traded in bulk and primarily in local markets [
69]. This analysis implicitly considers wetlands as part of the study but does not explicitly consider rice paddy cultivation in managed wetlands. The master plan estimates that 77,000 ha of managed wetland will be used for paddy irrigation in the medium term but does not consider the impact of climate on wetland areas. According to the NWRA, the wetland conservation policies have been updated after the potentials were calculated, and there could be a situation where the potential might be lower, considering the new regulations.
Moreover, wetlands that have been converted into agricultural lands could result in depletion of water reserves, flash floods, changes in microclimate, reduced fish stocks, and biodiversity losses if not properly managed.
This study estimated the pumping electricity demand under the assumption that all the water is pumped from underground water sources. Uganda is also bestowed with abundant surface water sources, but they are distributed and seasonal (other than the major equatorial lakes and rivers). The geographic scope/scale of this study and the non-availability of potential irrigation sites (geo-location) led us to consider only the groundwater sources for the estimation of electricity demand. Moreover, many of Uganda’s small rivers are seasonal and do not maintain minimum flows during some months of the year, which might coincide with the crop growing season. That being said, if the hydrological scale of this study is improved to represent the flow in small seasonal rivers and the potential locations for irrigation sites determined, the existing model can be adapted to include the surface water sources. For the question on how the surface water sources will change the picture, it is dependent on the distance of the irrigated sites from the source of water, seasonality of river flows, the proximity of water storage sites, and the gradient between the source and the cropland, to name a few.
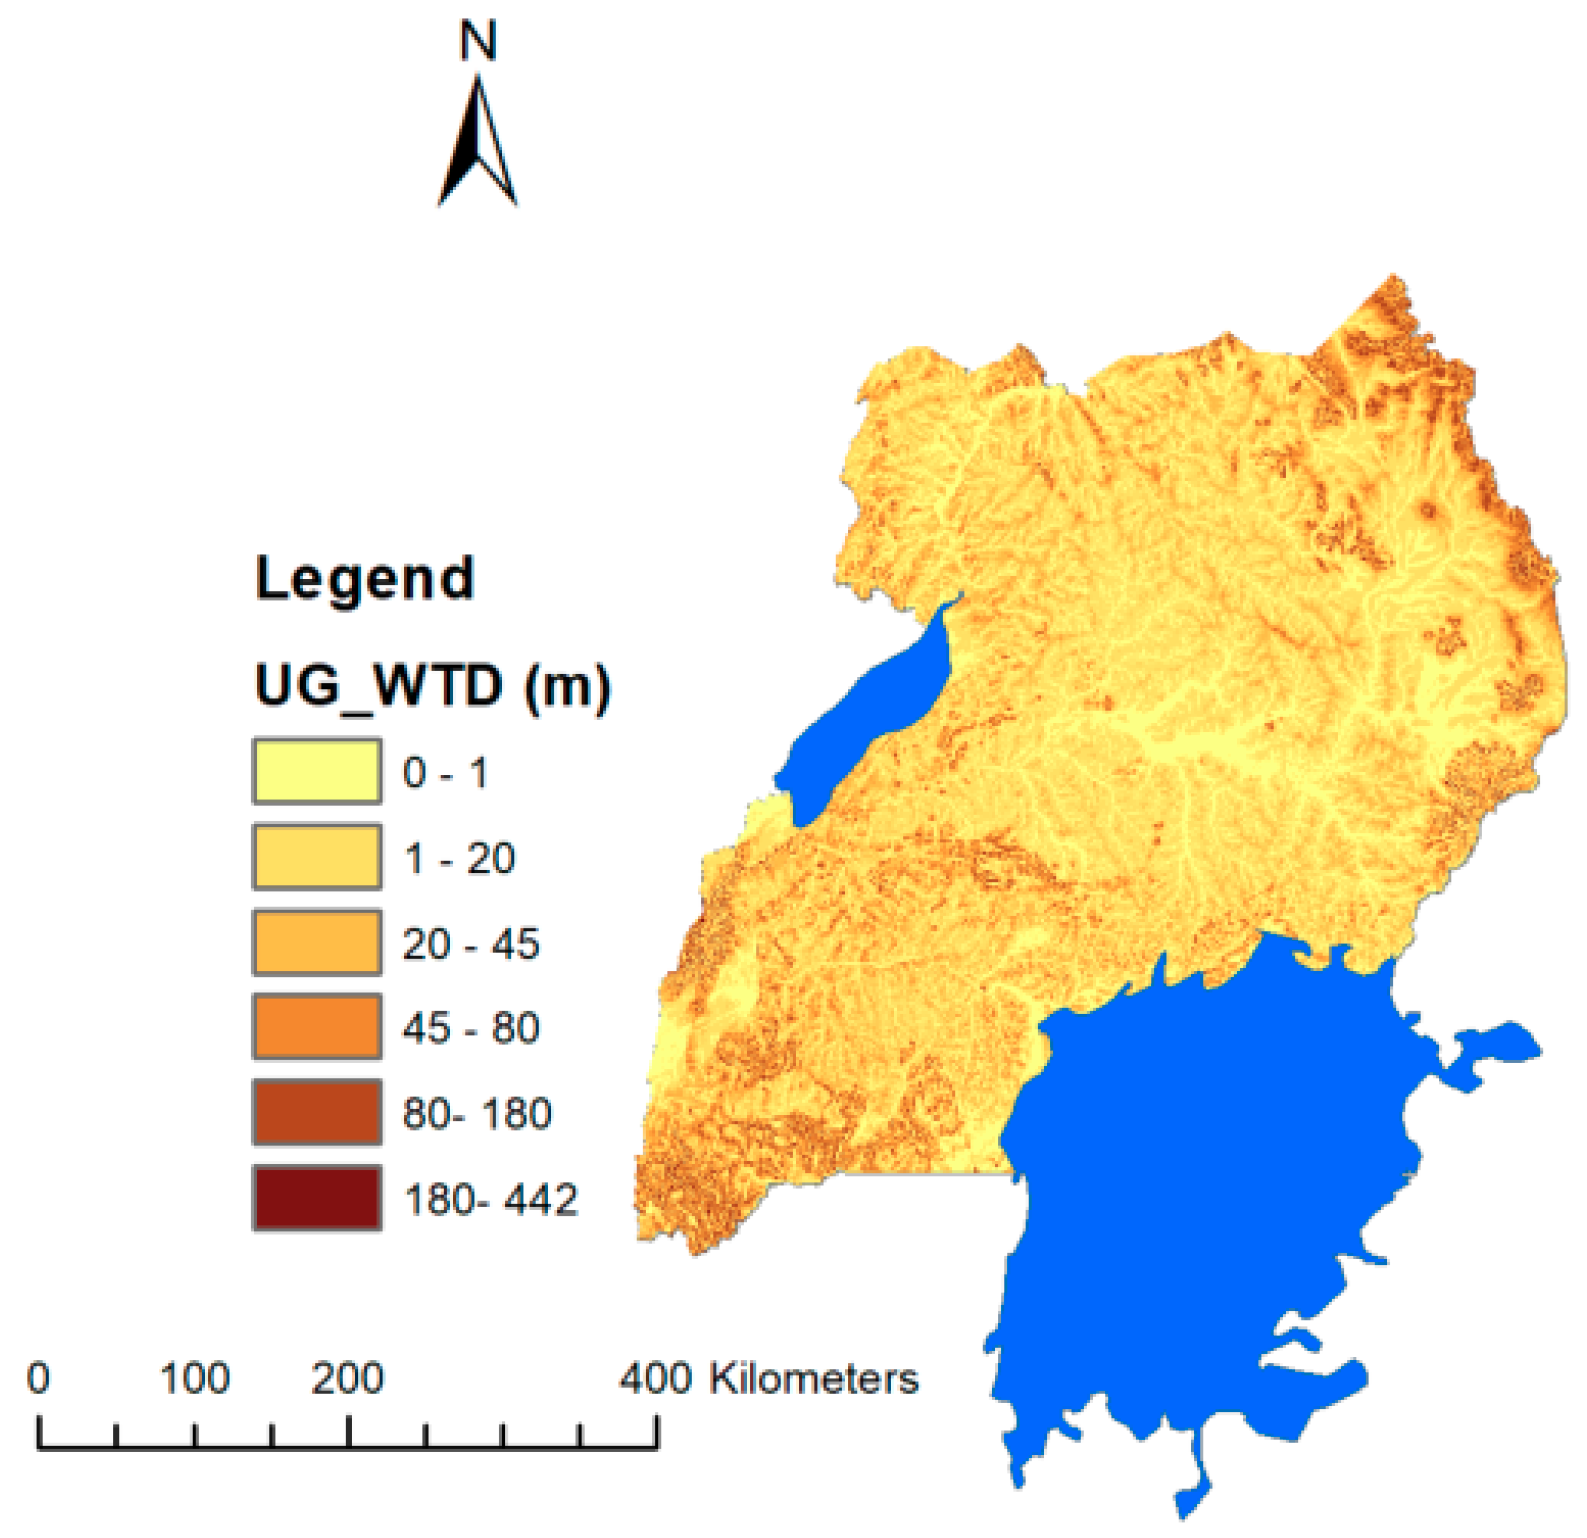
In this study, we assumed the mean WTD for each irrigated catchment, calculated using the zonal statistics function of the ArcGIS tool. We noticed that the maximum WTD, considered in this assessment, was around 46 m (
Table A5). The NWRA states that the average borewell depths in the country range between 50 and 106 mm [
27]. Hence, our estimation is expected to be on the conservative side, though many of the borewells are dug deeper from a long term planning perspective.
The results discussed in this article explore only the impact of climatic variables on crop yields/production, which, though significant, is only a part of the story. Crop production is influenced by many other factors like soil type, fertilizer usage, increased mechanizations (tractors), forested area, and fuel-wood usage, to name a few. Epule et al. [
70] highlight, from historical records that non-climatic factors like forested area, use of forest wood as fuel, and tractor usage might have a more significant impact on crop production than climatic factors like precipitation and temperature. Despite the existence of a substantial literature regarding climatic impacts on Sub-Saharan crop production, we must process these results with a grain of salt. There is a high probability that the results will differ if the above factors are taken into consideration. Nevertheless, Ugandan agriculture is expected to be of a subsistence type for the near future, and our analysis emphasizes the need to climate-proof crop production to ensure food security.
The choice of climate futures is critical to deriving meaningful insights from climate change impact assessments. Here, we employ a CMI based selection, which has been successfully tested in recent climate change studies [
52,
55,
56]. Though an averaged countrywide CMI might be a good indicator for choosing the driest and wettest futures, we find that when analyzing the water requirement for irrigation and the corresponding pumping electricity demand, the selection of climate futures should include more decision variables. The CMI calculation should include the irrigated crop calendar and climatic parameters specific to the irrigated area. Thus, there might not be one single driest or wettest future. There will be a dry or wet combination specific to the area and the crop that is to be irrigated.
Lastly, the uncertainty in climatic projections, though outside the scope of this article, cannot be ignored [
60,
61]. When no real probably exists for the realization of a particular climate future, infrastructure expansion planning—like irrigation and power systems—need some aspects of climate resilience included in early stages of planning. A possible extension of this study could be to analyze the resilience of irrigation expansion plans by considering a broad range of climates and associating some costs of inaction, as implemented by Sridharan et al. [
55] for the power sector.
