Article

Rapid and Sensitive Analysis of Hormones and Other Emerging Contaminants in Groundwater Using Ultrasound-Assisted Emulsification Microextraction with Solidification of Floating Organic Droplet Followed by GC-MS Detection

1
Institute of Chemistry, University of Bialystok, Ciołkowskiego 1K, 15-245 Bialystok, Poland
2
Faculty of Mechanical Engineering, Bialystok University of Technology, Wiejska 45C, 15-351 Białystok, Poland
*
Author to whom correspondence should be addressed.
Water 2019, 11(8), 1638; https://doi.org/10.3390/w11081638
Submission received: 24 June 2019 / Revised: 29 July 2019 / Accepted: 6 August 2019 / Published: 8 August 2019
(This article belongs to the Special Issue Removal of Organic Pollution in Water Environment)

Abstract

:
Ultrasound-assisted emulsification microextraction with solidification of floating organic droplet (USAEME-SFOD) has been applied to isolate hormones and other emerging contaminants from groundwater samples. Simultaneously with the extraction process, derivatization in the matrix was carried out using acetic anhydride. Quantification of studied organic pollutants was done through gas chromatography mass spectrometry (GC-MS). Hormones included β-estradiol (E2), estrone (E1), and diethylstilbestrol (DES). Other compounds belonged to groups of pharmaceuticals (diclofenac (DIC)), antiseptics (triclosan (TRC)), preservatives (propylparaben (PP) and butylparaben (BP)), sunscreen agents (benzophenone (BPH), and 3-(4-methylbenzylidene)camphor (3MBC)), repellents (N,N-diethyltoluamide (DEET)), industrial chemicals (bisphenol A (BPA), 4-t-octylphenol (4OP), 4-n-nonylphenol (4NP)). A non-toxic and inexpensive 1-undecanol was successfully used as the extraction solvent. Volume of extractant and derivatization agent, ionic strength, and time of extraction were optimized. Very low limits of detection (LoD) ranging from 0.01 to 5.9 ng/L were obtained. Recoveries ranged from 90% to 123%, with relative standard deviation being lower than 17%. The developed procedure was used to determine target compounds in groundwater collected at municipal waste landfills as well as in groundwater from wells distant from sources of pollution.

1. Introduction

According to the most popular definition given by the United States Geological Survey, an emerging contaminant (EC) is “any synthetic or naturally occurring chemical that is not commonly monitored in the environment but has the potential to enter the environment and cause known or suspected adverse ecological and/or human health effects” [1,2].
NORMAN Network Europe (network of reference laboratories, research centers, and related organizations for the monitoring and biomonitoring of emerging environmental substances) differentiates between emerging substances and emerging pollutants. Emerging substances are defined as “substances that have been detected in the environment, but which are currently not included in routine monitoring programs at EU level and whose fate, behavior, and (eco)toxicological effects are not well understood”. Emerging pollutants are defined as “pollutants that are currently not included in routine monitoring programs at the European level and which may be candidates for future regulation, depending on research on their (eco)toxicity, potential health effects and public perception and on monitoring data regarding their occurrence in the various environmental compartments” [3].
The EC group contains substances which vary in regard to their chemical structure, toxicity, and environmental behavior and includes, among others, industrial additives and by-products, personal care products, and human and animal pharmaceuticals (PPCPs), surfactants, flame retardants, hormones, and sterols [3]. This list is not complete and each year is extended with newly-detected artificial contaminants as well as naturally occurring trace compounds. In recent years it has expanded through the inclusion of nanomaterials and microplastic particles [4]. More than 2100 scientific studies published between 2007 and 2016 have proven that ECs, as biologically active compounds, exhibit a potential risk to humans, plants, and/or animals [2]. Many of them are able to alter the normal hormone function of wildlife and humans by mimicking or magnifying the effects of endogenous hormones, disrupting their synthesis and activity or the operation of hormone receptors. Strongest endocrine activity is demonstrated by natural and synthetic hormones which are introduced into the environment with insufficiently treated wastewater [5,6]. Estrone (E1) and β-estradiol (E2) are two common forms of natural estrogen secreted by the human body which are frequently found in aqueous environments. This is especially true in respect to E2 due to its widespread use as a contraceptive and in hormone replacement therapy (HRT). Another non-steroidal synthetic estrogen, diethylstilbestrol (DES), has been formerly used medicinally to prevent stillbirths and as a growth stimulant in feed given to poultry, cattle, and sheep. Despite the fact that its effects have been proven harmful it is still used in the treatment of breast and prostate cancer and, in some countries, in HRT [7,8]. Additionally, it has been shown that compounds making up some personal care products and industrial chemicals exhibit hormonal activity. The largest number of studies confirming their effect on the endocrine system is related to bisphenol A (BPA). It is suspected that estrogenic activity of BPA increases the risk of developing breast cancer in humans and may act as an antiandrogen causing feminizing side effects in men [9,10,11,12]. Other ECs, including, for example, propylparaben (PP), butylparaben (BP), 3-(4-methylbenzylidene)camphor (3MBC), 4-t-octylphenol (4OP), 4-n-nonylphenol (4NP), and triclosan (TRC), have also been confirmed or suspected of having endocrine disrupting effects on the functioning of estrogen, androgen, prolactin, insulin, or thyroid hormones. It is supposed that continuous exposure to some ECs causes increased birth weight in children, adult fat gain, diabetes, and may potentially affect eating disorders [9,10,13,14,15].
In recent years, micro-extraction in the liquid–liquid system (LLME) has become one of the most widely used techniques for the preparation of samples for EC determination [16,17]. The most commonly used LLME modification is a dispersive liquid–liquid microextraction (DLLME), developed in 2006 by Rezaee et al. [18]. This technique uses a ternary system consisting of an examined aqueous solution, an extraction solvent, and a dispersing solvent. The formation of the emulsion results in an unlimited contact area between two aqueous and organic phases producing prompt mass exchange. It is possible; however, to avoid the addition of a dispersing solvent to form the emulsion through the use of ultrasonic radiation. In 2008, Regueiro et al. [19] used ultrasound for the first time to support microextraction in a liquid–liquid system, developing the ultrasound-assisted emulsification-microextraction technique (USAEME). In liquid–liquid microextraction techniques it is usual to use solvents which are heavier than water, although these substances are mostly chlorinated. This is due to the fact that after the extraction process the microdroplet of the organic solvent in which the analyte is dissolved is located at the bottom of the tube. Its collection (e.g., with a syringe) is relatively easy, especially if test tubes with a conical bottom are used. In case of solvents that are lighter than water, it is much more difficult to separate the microdroplet of the organic solvent from the aqueous phase. One solution which facilitates work with such solvents uses the process of solidifying the floating solvent drop. The technique using the process of solidification of the floating organic drop microextraction (SFODME) was introduced in 2007 by Khalili Zanjani et al. [20]. In this technique, after the extraction process, the sample is placed in an ice bath to solidify the drop of the organic solvent in the upper part of the vessel in which the extraction is carried out. The drop is then transferred to a vial where it melts at room temperature. The solidification of the floating organic drop (SFOD) technique is combined with various liquid–liquid microextraction variants and used to determine both organic compounds and metal ions in various types of matrices [21,22,23,24,25,26].
In this study, a simple and sensitive analytical procedure for simultaneous determination of hormones and other EC compounds most frequently detected in surface water bodies is optimized. USAEME-SFOD is used for the separation and preconcentration of analytes, whereas GC-MS in the selected ion monitoring (SIM) mode is applied for their quantification. The influence of extraction and derivatization parameters (i.e., the type of organic solvent and solvent volume, extraction time, derivatization reagent volume, and amount of buffering salt) on analyte recovery is investigated. The developed USAEME-SFOD/GC-MS procedure was used to assay target compounds in groundwater samples from northeastern Poland. To our knowledge, this is the first study utilizing USAEME with a non-chlorinated solvent for the determination of studied compounds. The presence of compounds from the EC group in groundwater has been largely unexplored, especially when compared to surface and marine waters, and this work may provide important knowledge within this area.

2. Experimental

2.1. Reagents and Solvents

Materials, PP, BP, BPH, 3MBC, N,N-diethyltoluamide (DEET), OP, NP, TRC, BPA, diclofenac (DIC), E1, E2, DES, tricosane, and 1-undecanol, were obtained from Sigma-Aldrich (Darmstadt, Germany). Methanol and anhydrous disodium hydrogen phosphate (V) were provided by POCH (Gliwice, Poland). Acetic anhydride was purchased from Chempur (Piekary Śląskie, Poland). Stock solutions of each analyte (at 1 mg/mL of each) were prepared separately in methanol and stored at −18 °C for a period not exceeding one month. Working solutions were prepared by diluting the stock standard solution in methanol and storing them at −18 °C not longer than two weeks. Deionized water was obtained using a purification system (Milli-Q RG, Millipore, Burlington, MA, USA) and stored in glass bottles.

2.2. Groundwater Samples

Samples of groundwater were collected from six deep wells (the surface of water was at a depth of 15–46 m) and five shallow wells (the surface of the water was at a depth of 3–8 m) used for individual water supply. The wells are located in a region which is not directly affected by industrial sources of pollution. Samples of groundwater from contaminated sites (twelve) were collected from monitoring wells located in two municipal solid waste (MSW) landfill sites of non-hazardous and inert waste. All the sampling points were located in northeastern Poland. The geological structure of areas from which the samples were taken consists of clay–sand–gravel deposits. Samples were collected in glass bottles with Teflon-lined caps that were rinsed with the sample water on site and immediately carried to the laboratory where, upon arrival, they were filtered through a 0.45 µm pore size membrane filter and stored at −18 °C.

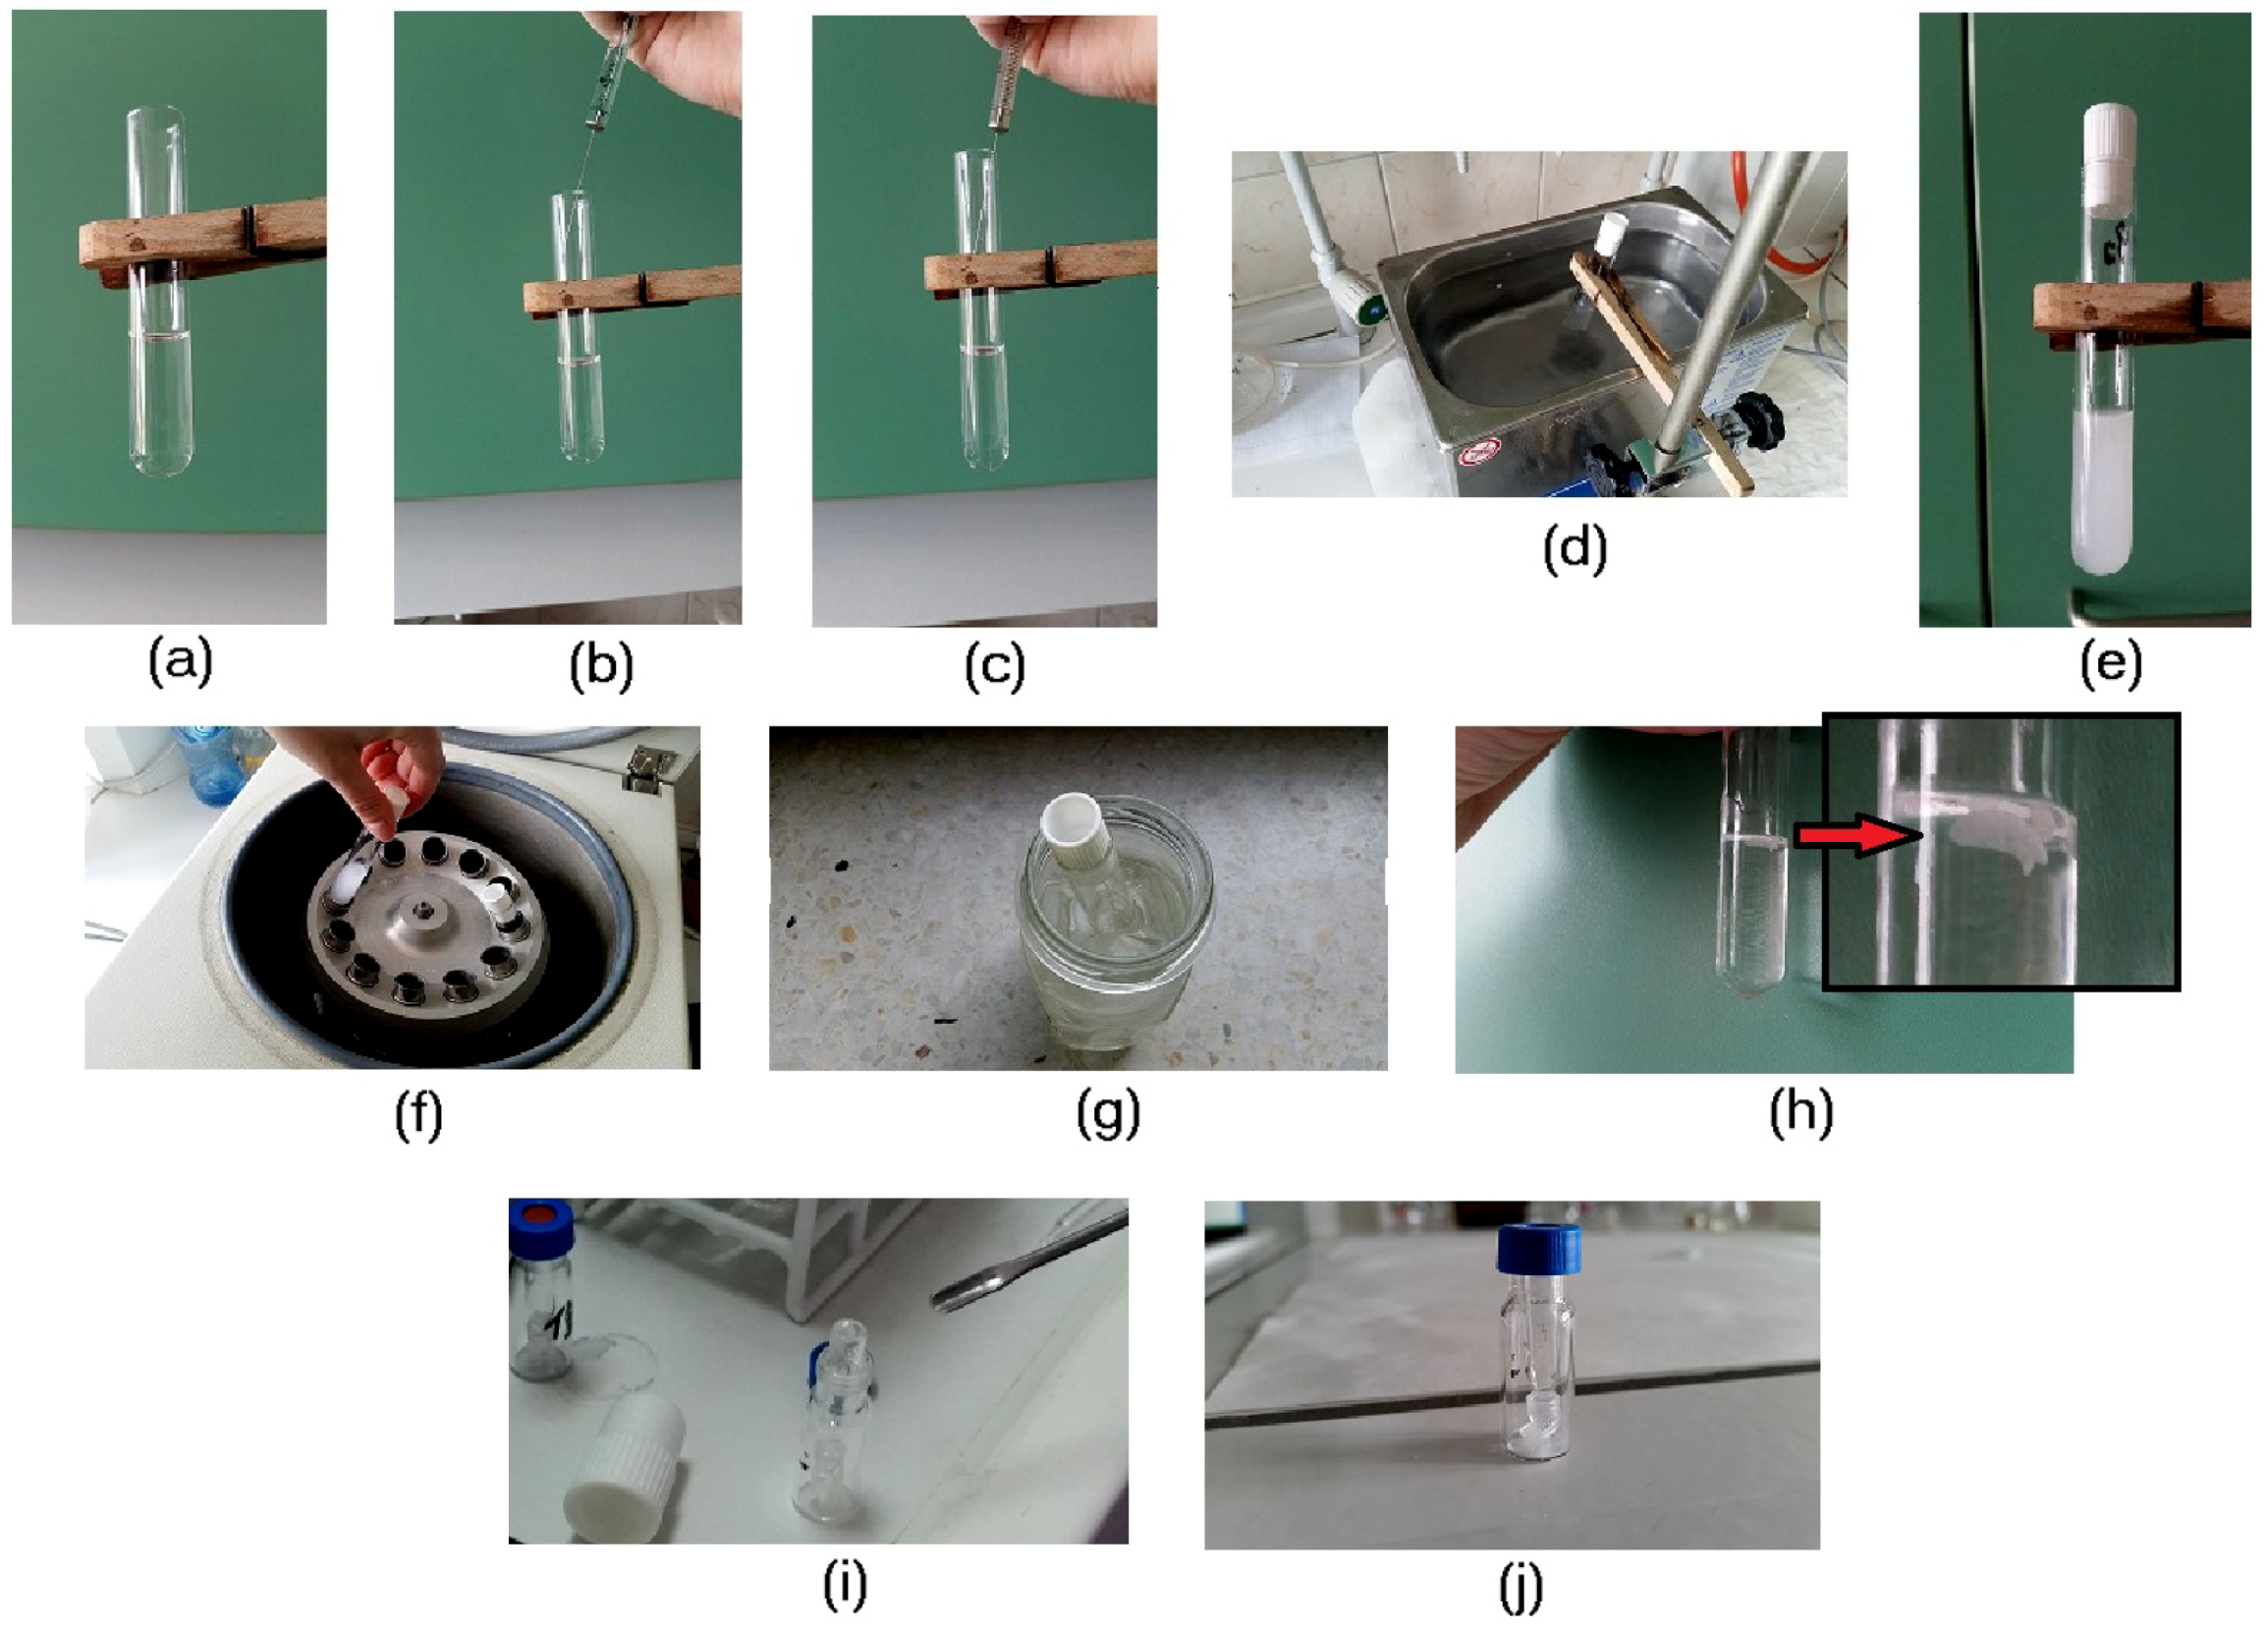
2.3. The Procedure of Ultrasound-Assisted Emulsification Microextraction with Solidification of Floating Organic Droplet (USAEME-SFOD) Coupled with In Situ Derivatization

For the simultaneous USAEME-SFOD and derivatization aliquots of 5 mL water samples were placed in 10 mL glass centrifuge tubes containing previously weighted 0.25 g of sodium hydrogen phosphate. The extraction solvent (1-undecanol, 20 µL) consisting of tricosane (5 µg/L) as an internal standard and the derivatization reagent (acetic anhydride, 250 µL) were added to the water sample and mixed. Immediately after, the tube was immersed in the ultrasonic Unitra Unima (Warsaw, Poland) water bath. Extractions were performed at 42 kHz ultrasound frequency and 230 W power for the duration of 8 min at room temperature. Emulsions were separated using centrifugation at 4000 rpm/min for 4 min in an MPW-250 Med. Instruments (Warsaw, Poland) laboratory centrifuge. After this process, the droplet of organic phase floated at the top of the test tube. The test tube was then cooled in an ice bath. After five minutes, 1-undecanol solidified and was transferred into a 150 µL micro vial with an integrated insert. It melted quickly at room temperature and GC-MS analysis of 1 µL of obtained solution was then performed as described in Section 2.4. The course of the USAEME-SFOD is shown in Figure 1.

2.4. GC-MS Conditions

Analysis was performed with an HP 6890 gas chromatograph coupled with a MSD5973 mass spectrometric detector and an HP 7673 autosampler (Agilent Technologies, Santa Clara, CA, USA). This device was equipped with an HP-5MS (5% phenylmethylsiloxane) column (size 30 m length × 0.25 mm; i.e., coated with 0.25 µm film thickness) and split/splitless injector. The injector was set to work in the splitless mode. Helium of 99.999% purity was used as a carrier gas at a flow rate of 1 mL/min. The injector temperature was set at 250 °C. The oven temperature program started from 160 °C and increased at increments of 2 °C/min to 170 °C (held for 2 min), 6.44 °C/min to 226 °C (held for 1 min), 10 °C/min to 233 °C (held for 2.5 min) and 10 °C/min to 300 °C (held for 4 min). The total run time was 26 min with the solvent delay time reaching 5.7 min. The MS detector worked in selected ion monitoring (SIM) mode. The electron impact source temperature was 230 °C with electron energy of 70 eV. The quadrupole temperature was 150 °C and the GC interface temperature was 280 °C. The chromatogram obtained during the GC-MS analysis of BPH, DEET, 3MBC, BPA, PP, BP, DES, DIC, OP, NP, E1, E2, and TRC together with the internal standard after USAEME-SFOD with in-situ acetylation is presented in Figure 2. The MS spectra of target compounds are given in Figure S1 (Supplementary Material). The chromatographic parameters, molecular weights of target compounds, together with quantification and identification ions are shown in Table 1. Based on the registered chromatograms, the relative areas of the chromatographic peaks were determined by dividing the values of the obtained peak areas of tested compounds by the peak area of the tricosane.

3. Results and Discussion

3.1. Optimization of Extraction and Derivatization Procedure

3.1.1. Selection of an Extraction Solvent

The efficiency of the liquid–liquid extraction process depends on the physico-chemical properties, such as water solubility (it has to be as low as possible) and its polarity or affinity to the isolated compounds (it has to be as high as possible), of the solvent used. Additionally, the selected organic solvent should exhibit low volatility and toxicity, and proper chromatographic behavior. The additional feature of the chosen solvent required for its application in USAEME is the ability to form an emulsion during the extraction procedure. To make solidification of the solvent droplet possible the melting point of the solvent should be near room temperature. Four solvents were tested (Table 2) for their usability in the isolation of studied compounds. Based on an analysis of their physicochemical properties and on preliminary tests, 1-dodecanol and n-hexadecane were eliminated. The former is characterized by a melting temperature that is too high and becomes solid during extraction, which would require conducting the experiments at an elevated temperature. The high boiling point of n-hexadecane masked a large part of the obtained GC-MS chromatogram making determination of some analytes impossible. As the extraction efficiency of 1-undecanol and 2-dodecanol were similar, 1-undecanol was chosen for further studies due to its lower boiling point allowing the GC-MS determination of more endocrine disrupting compounds (less chromatogram coverage).

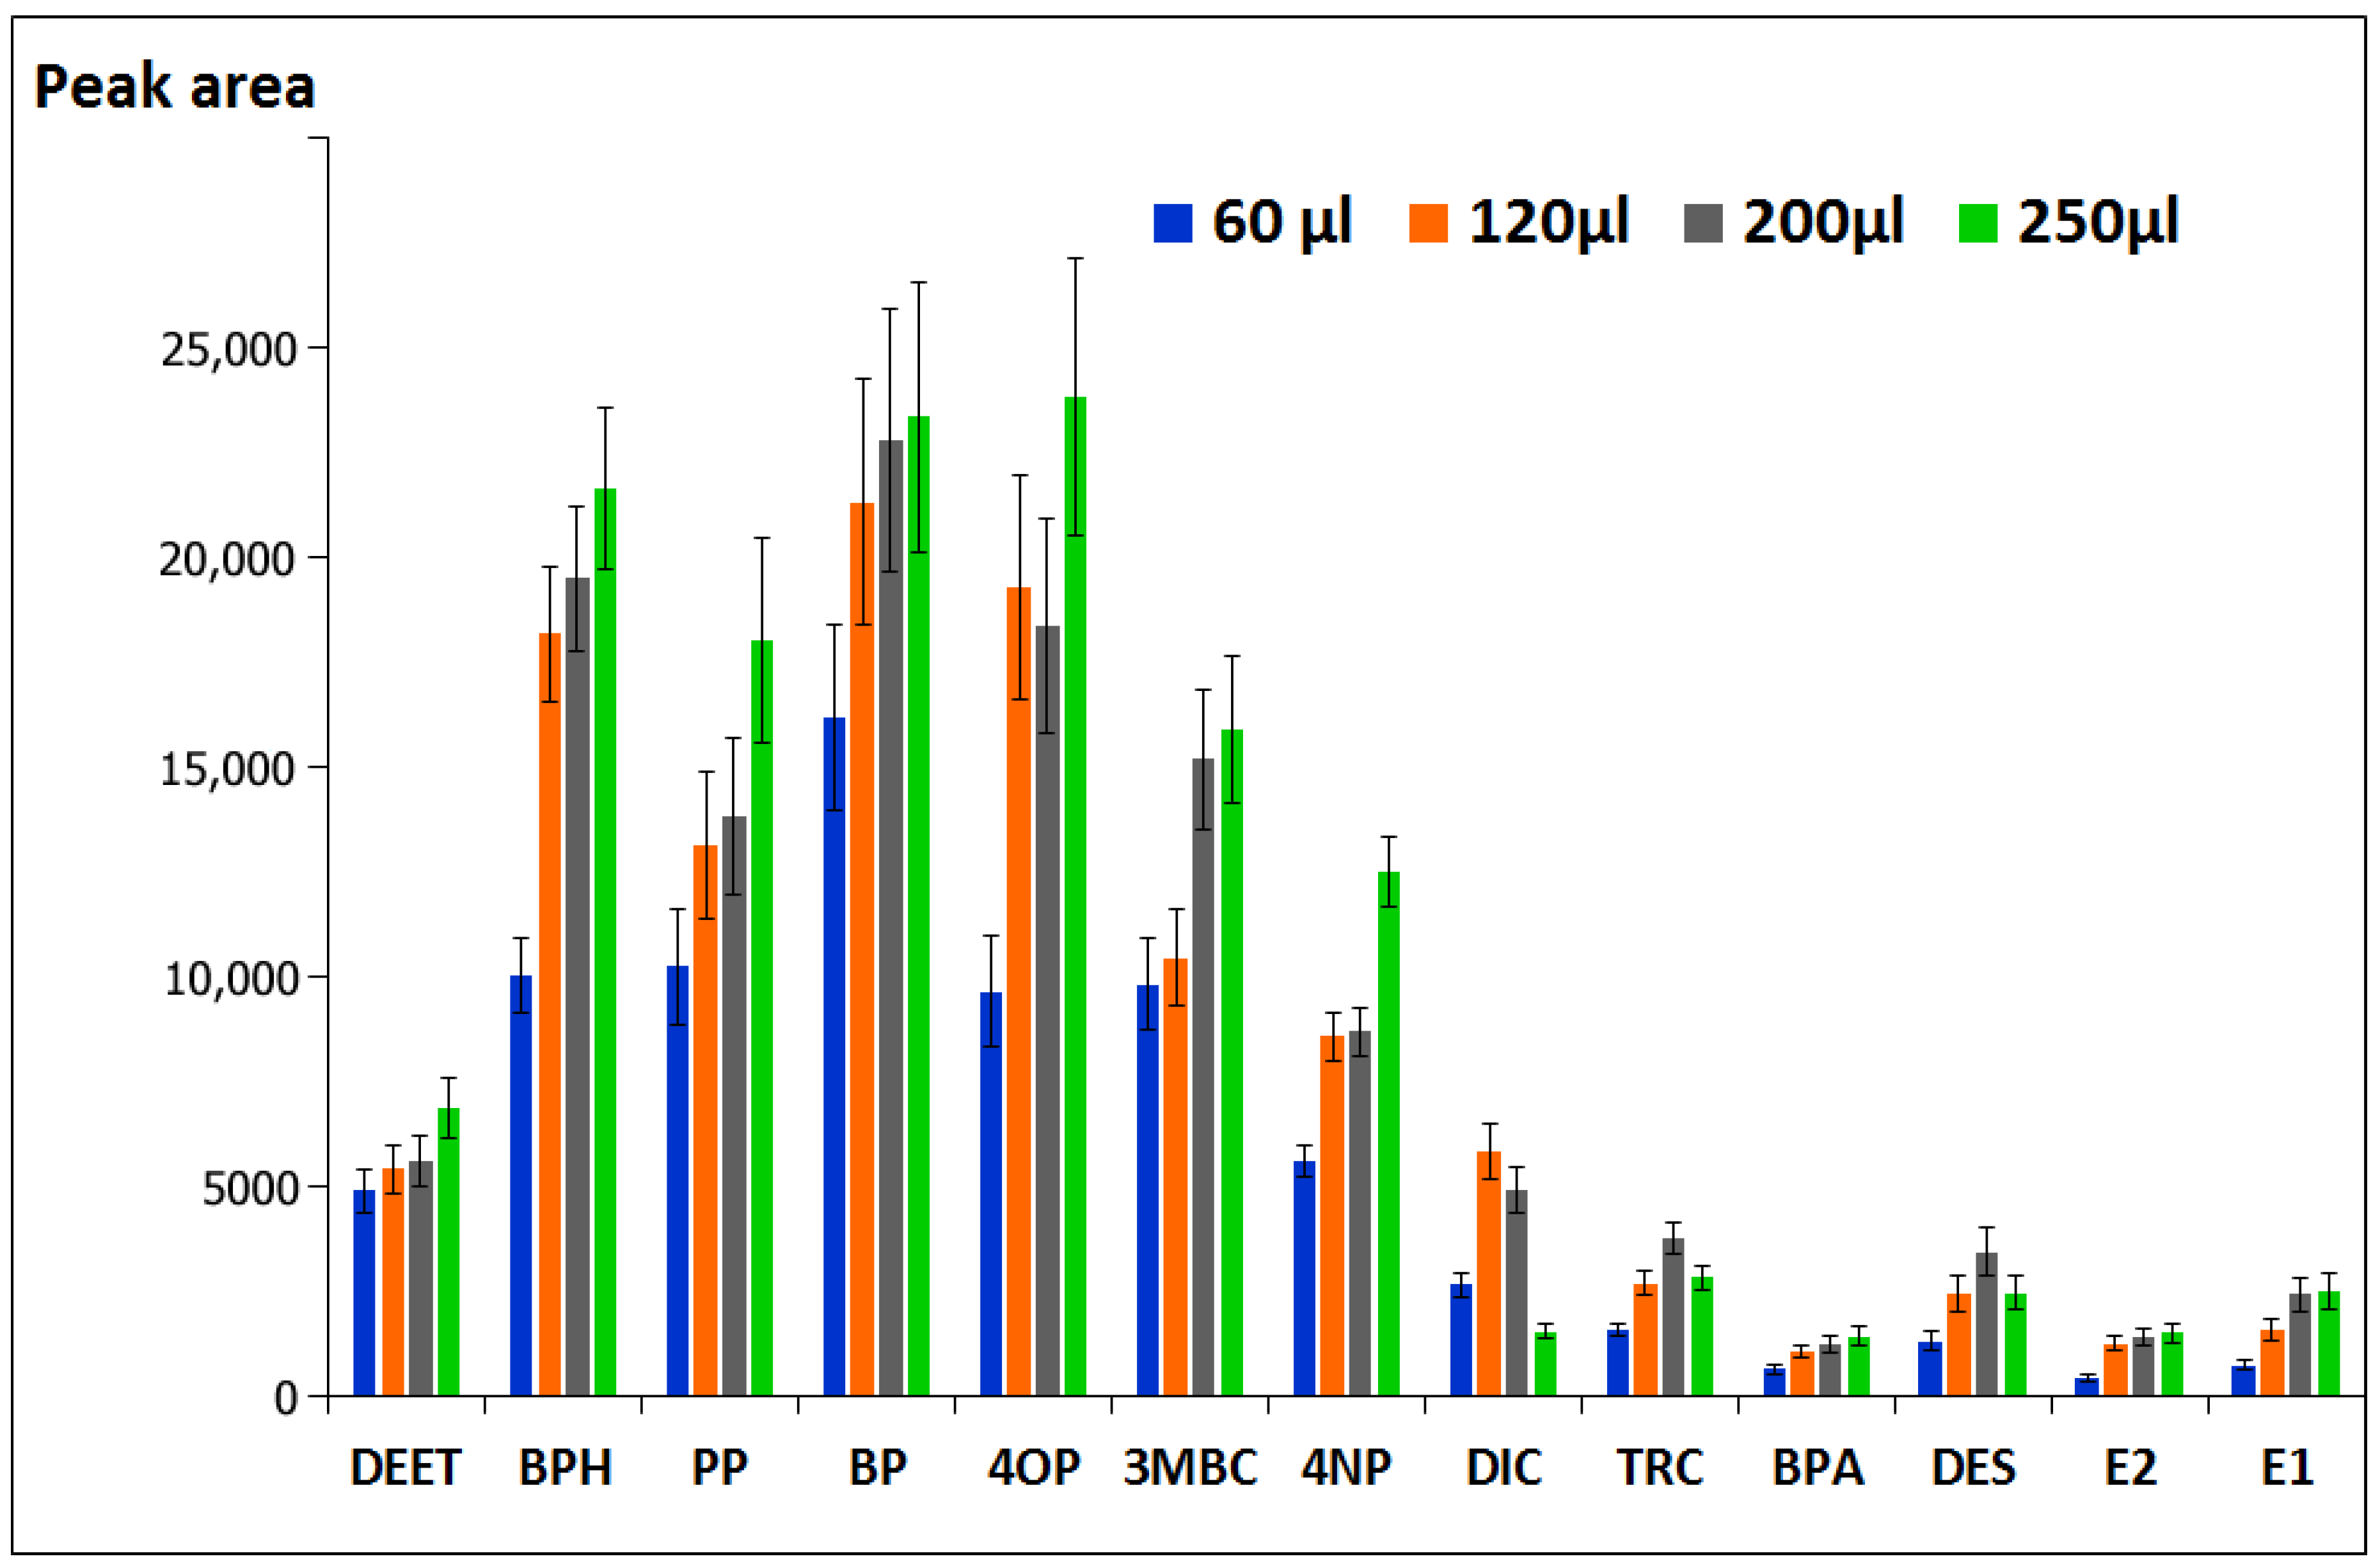
3.1.2. Selection of Solvent Volume

The analyte extraction efficiency strongly depends on the volume of the solvent used. Usually, a decrease in the volume of the organic phase produces higher enrichment of the analyte. The use of as small as possible amount of organic phase improves the limits of detection (LoD) and quantification (LoQ) of the applied detection technique. What is more, using the smallest possible amounts of solvents conforms to the guidelines of “green chemistry”.
In order to obtain the highest extraction efficiency of the USAEME-SFOD procedure, the volume of extraction solvent was optimized. For this purpose, different volumes of 1-undecanol within the range of 20–70 µL were examined (Figure 3). The obtained results showed that a decrease in the solvent volume resulted in the elevation of peak areas of analyzed compounds. It was determined that the use of 20 µL of 1-undecanol, the smallest volume making the introduction of the sample into the chromatograph with an autosampler possible, allowed the collection of 10 to 12 µL of solvent after the extraction process. Therefore, a volume 20 µL of 1-undecanol was deemed to be optimal in further studies.

3.1.3. Effect of Derivatization Reagent Volume

Ten of the thirteen examined endocrine compounds contain a hydroxyl or phenol group in their molecule, requiring appropriate conversion increasing volatility and thermal stability to improve their adaptation to GC-MS analysis. For this purpose, derivatization in the matrix using acetic anhydride was chosen and was carried out simultaneously with the extraction procedure. Besides providing chromatographic advantages, acetylation also improves the sensitivity of the method, as the extraction efficiency of the acetates formed in the reaction is much higher than the yield of phenol extraction [27]. In-situ derivatization with acetic anhydride is simple as well as fast, having little effect on the duration and complexity of the analytical procedure [28]. The acetylation reaction has been confirmed through the appearance within the spectrum a peak of 42 (or 84) units higher than the molecular weight of the compound being determined (see Figure S1, Supplementary Material). The effect of the volume of acetic anhydride on the relative peak area was studied in the range 60–250 µL (Figure 4). The results indicated that the volume of acetic anhydride equal to 250 μL is optimum, providing the highest efficiency of extraction. The use of large volumes of acetic anhydride is advantageous because it provides effective derivatization in the case of environmental samples with an unknown concentration of analytes. In addition, during the isolation, a reaction between the acetic anhydride and the solvent, which is the primary alcohol, undoubtedly takes place. A large stoichiometric excess of acetic anhydride means that the occurring reaction does not affect the process of derivatization of analytes, which is also confirmed by studies described in the literature [28].

3.1.4. Effect of Type and Amount of Buffering Salt

The acylation reaction requires the presence of buffer salt with sodium hydrogen carbonate, being most frequently used for this purpose. However, this substance turned out to be unsuitable for the USAEME-SFOD procedure, since the use of NaHCO3 resulted in the appearance of carbon dioxide bubbles which interfered with the agglomeration of the organic phase and was replaced with sodium hydrogen phosphate. The addition of salt to the solution also causes a salting-out effect which positively affects the efficiency of the extraction. To find the optimal concentration of salt, a series of experiments was performed using solutions with salt concentrations between 0% and 10%. Figure 5 shows the influence of sodium hydrogen phosphate concentration on the extraction efficiency of target compounds. It can be seen that the best results were obtained with the 10% solution and this concentration was used in subsequent experiments.

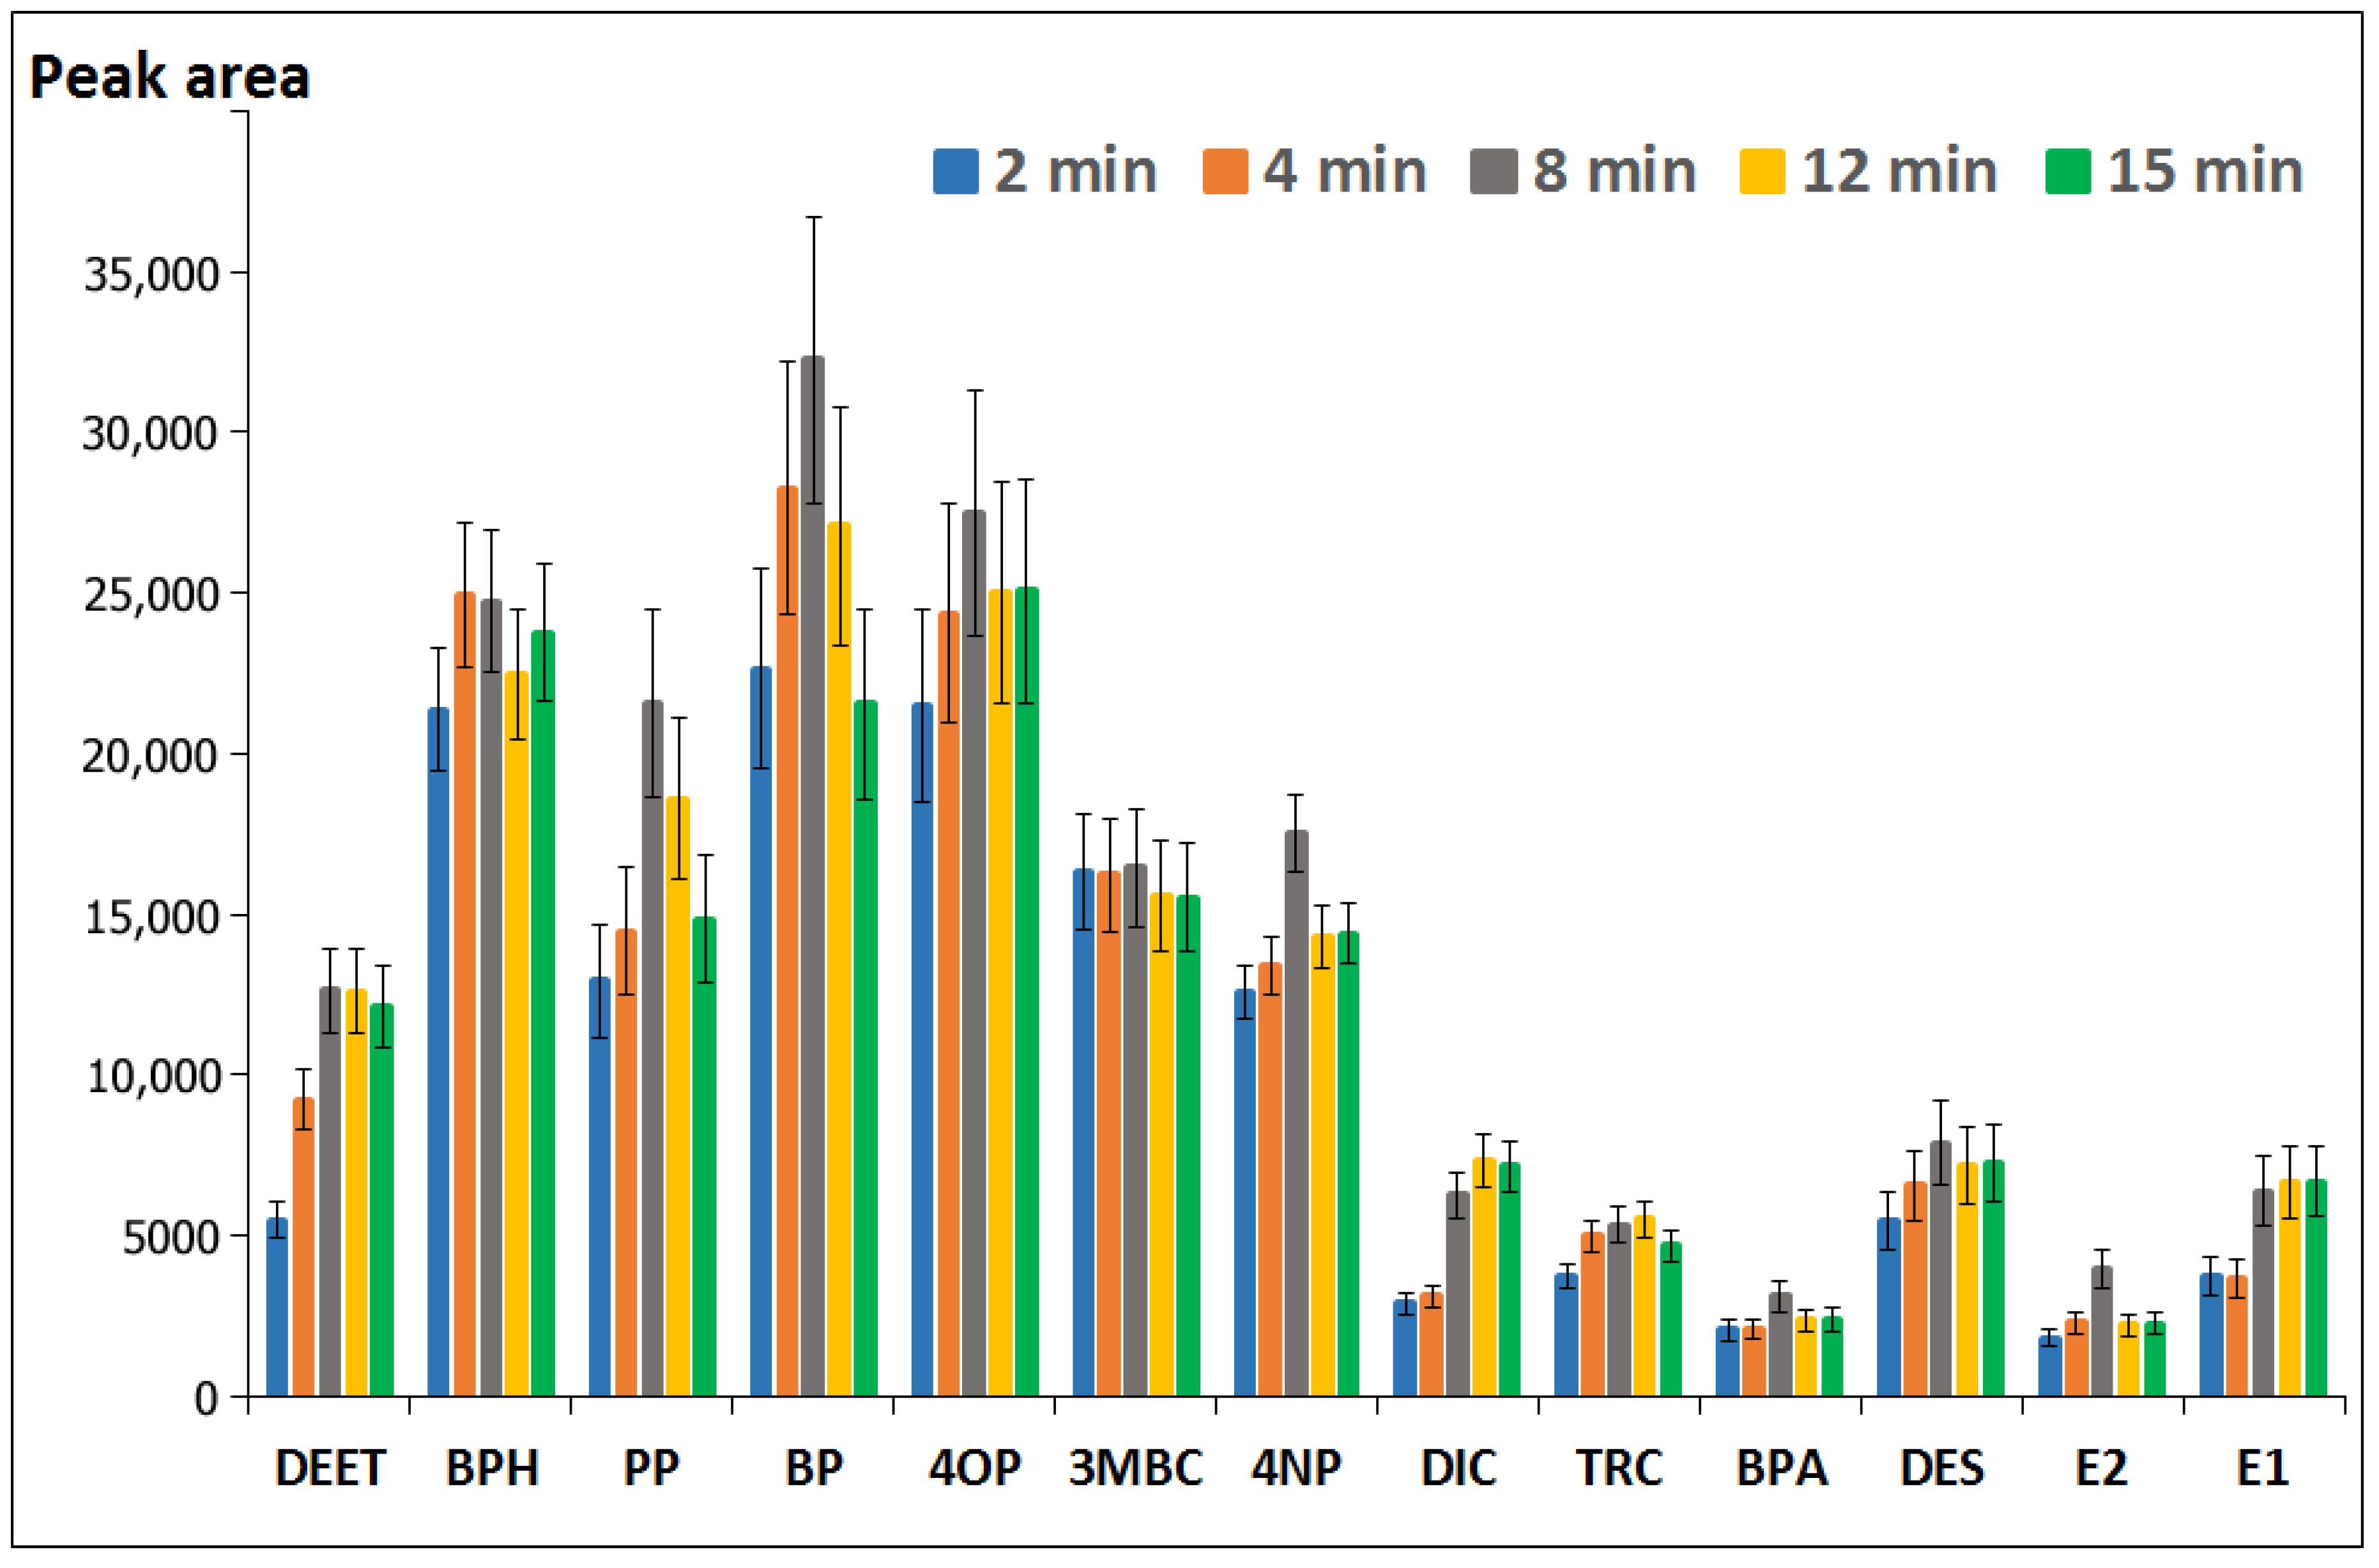
3.1.5. Effect of the Simultaneous Derivatization/Extraction Time

Literary data indicates that acetylation is a fast process which can be conducted with 100% efficiency within a time of two minutes [29]. Therefore, the rate of simultaneous derivatization and extraction is mainly related to the time required to achieve equilibrium in the distribution of the analyte between the aqueous and organic phases, which is of a great significance in all extraction procedures. When it comes to USAEME, extraction time is considered as the time between injection of the extraction solvent and the end of the sonication stage [30]. In order to select a time interval that ensures the highest efficiency of extraction, the isolation of studied compounds was done using varying sonication times ranging from 2 to 15 min (Figure 6). For the majority of the examined compounds the time of 8 min was enough to establish equilibrium between the aqueous and organic phases, a fact that can be clearly seen on the graph. In case of BPH and 3MBC, equilibrium concentrations in the 1-undecanol–water system were achieved after only two minutes of extraction. For DIC, TRC, and E1, slightly higher extraction efficiency was registered after 12 min of sonication. Since it is known that the achievement of equilibrium is not necessary for repetitive extraction in the liquid–liquid system, a time of 8 min was chosen as sufficient to perform the sample preparation procedure. The choice of this extraction time was also related to the fact that, for some acetylated compounds, a decrease of concentration in the organic phase was observed with the extension of the sonication time. The negative effect of extraction time elongation on extraction efficiency suggests that the derivatives may have slowly hydrolyzed to their free form after coming in contact with the aqueous phase.

3.2. Method Validation

Method validation was done using real groundwater samples, for which the absence of determined compounds was confirmed, as the sample matrix. Table 3 presents an overview of the method’s linearity studies. Table 4 shows limits of detection and quantification repeatability and trueness of the developed method as well as a comparison with values obtained when USAEME is used with solvent having a density higher than water. Within the studied concentration range 0.001–10 µg/L, calibration graphs were linear and corresponded with the expected concentrations in groundwater. It has been proven that conducting determinations based on a standard curve with a wide dynamic range (above two orders of magnitude) leads to substantial errors at low concentrations. In order to improve the accuracy of the determinations, the dynamic range was divided into two (low and high) operating scopes—0.001–0.05 µg/L and 0.05–10 µg/L—and validation of both scopes was performed. As can be seen in Table 3, the equations of the calibration curves for the low and high operating scopes differ, confirming the correctness of the approach used. Good linearity with coefficient of determination (r2) ranging from 0.990 to 0.999 for the high operating scope, and from 0.985 to 0.997 for the low operating scope, was obtained. Relative standard deviation (RSD) of the determination ranged from 6.7% to 16.8%, depending on the compound being analyzed. Analyte limits of quantification defined as a signal to noise ratio (S/N) equal to 10 ranged from 0.05 to 19.5 ng/L; the limits of detection, defined as S/N ratio equal to 3, were between 0.01 and 5.9 ng/L. Recovery obtained from groundwater samples spiked at concentration levels of 0.03 µg/L were between 93% and 123%, while for samples spiked at concentration 4 µg/L were between 90% and 112%. A comparison of parameters obtained through the utilization of the USAEME-SFOD/GC-MS method developed using 1-undecanol as an extractant, with those attained by applying the USAEME/GC-MS method using chloroform as an extractant [31], shows that the accuracy and precision of both methods are similar, while the sensitivity of the method developed in this work is much better, primarily resulting from the smaller volume of 1-undecanol (20 µL) used for extraction compared to chloroform (70 µL), lower water solubility of 1-undecanol (5.7 mg/L) than chloroform (0.8 g/L), and, most likely, a higher solubility of target compounds in 1-undecanol.

3.3. Groundwater Analysis

In order to complete the validation of the proposed procedure, it was applied for the determination of PP, BP, BPH, 3MBC, DEET, OP, NP, TRC, BPA, DIC, E1, E2, and DES in groundwater samples from deep wells and shallow wells used for individual water supply, as well as groundwater from monitoring wells located in municipal solid waste landfill sites. Analysis results are shown in Table 5. One hormone (E1) and nine other ECs (with the exception of 3MBC) were identified in the groundwater samples in concentrations higher than LoD. The most frequently detected compounds were BPA (detection frequency 78%), DEET (detection frequency 61%), and BPH (detection frequency 57%). Literature information from other studies shows that BPA and DEET were identified as the most commonly detected ECs in groundwater [32,33,34,35,36] with BPH being previously identified as one of the most widespread ECs in groundwater located under MSW landfills [31,37,38,39].
All ten compounds, in concentrations ranging from 0.2 to 3300 ng/L, were detected in groundwater samples from MSW monitoring wells, with BPH and BPA present in all samples. Insufficient insulation of fields on which waste is stored and lack of completely watertight installations used for collecting landfill leachate are, in this case, the main source of the above mentioned compounds. In shallow wells, five compounds (BPH, DEET, 4OP, 4NP, BPA), in concentrations from 0.1 to 689 ng/L, were detected. Water in shallow wells originate from the near-surface usable aquifer associated with the sandy fluvioglacial and glacial sediments of the Upper Pleistocene [40]. The presence of ECs in these waters results from it being fed directly by precipitation and meltwater. DEET and BPA, in concentrations ranging 0.1–98 ng/L, were both detected in two deep wells. Deep-well water comes from the first main usable deep water aquifer called the inter-renewable level. It occurs in fluvioglacial works of the oldest glaciation stages in Central Poland and in gravel and river sand interstadials [40]. The results indicate that the two deep wells in which ECs were detected are affected by seep water from shallow reservoirs coming in contact with surface waters.

4. Conclusions

  • New analytical methodology based on ultrasound-assisted emulsification microextraction with solidification of organic drop followed by GC-MS determination has been proposed for the determination of three hormones and ten other ECs having a high environmental impact. Scrutiny of the available literary sources showed that the present work is the first to describe the combination of the USAEME and SFOD methods for the extraction of target compounds from any matrix.
  • High sensitivity of the developed procedure and satisfactory precision and accuracy enabled its use for the determination of ECs in groundwater samples, which are usually characterized by low contamination by anthropogenic compounds.
  • Analyses of groundwater have shown that even their deep seams can be contaminated with compounds derived from industrial and everyday human activity. This is a particularly worrying phenomenon since these resources are utilized as sources of high-quality drinking water.

Supplementary Materials

The following are available online at https://www.mdpi.com/2073-4441/11/8/1638/s1, Figure S1: The MS spectra of target compounds registered after USAEME-SFOD with in-situ acetylation.

Author Contributions

Conceptualization, U.K.; methodology, U.K. and J.K.; investigation, U.K., J.K. and E.P.; writing—original draft preparation, U.K. and A.K.; writing—review and editing, U.K. and A.K.; visualization, A.K.

Funding

This research was funded by the Institute of Chemistry, University of Bialystok.

Conflicts of Interest

The authors declare no conflicts of interest.

References

  1. Website United States Geological Survey. Available online: http//:www.toxics.usgs.gov/regional/emc/ (accessed on 4 March 2019).
  2. Alphenaar, P.A.; van Houten, M. Insight in Emerging Contaminants in Europe; Witteveen Bos: Deventer, The Netherlands, 2016. [Google Scholar]
  3. Norman Network of Reference Laboratories. Research Centres and Related Organisations for Monitoring of Emerging Environmental Substances. Available online: https://www.norman-network.net (accessed on 4 March 2019).
  4. Richardson, S.D.; Kimura, S.Y. Water analysis: Emerging contaminants and current issues. Anal. Chem. 2016, 88, 546–582. [Google Scholar] [CrossRef] [PubMed]
  5. Barber, L.B.; Vajda, A.M.; Douville, C.H.; Norris, D.O.; Writer, J.H. Fish Endocrine disruption responses to a major wastewater treatment facility upgrade. Environ. Sci. Technol. 2012, 46, 2121–2131. [Google Scholar] [CrossRef] [PubMed]
  6. Laurenson, J.P.; Bloom, R.A.; Page, S.; Sadrieh, N. Ethinyl estradiol and other human pharmaceutical estrogens in the aquatic environment: A review of recent risk assessment data. AAPS J. 2014, 16, 299–310. [Google Scholar] [CrossRef] [PubMed]
  7. Zhu, L.; Xiao, L.; Xia, Y.; Zhou, K.; Wang, H.; Huang, M.; Ge, G.; Wu, Y.; Wu, G.; Yang, L. Diethylstilbestrol can effectively accelerate estradiol-17-O-glucuronidation, while potently inhibiting estradiol-3-O-glucuronidation. Toxicol. Appl. Pharmacol. 2015, 283, 109–116. [Google Scholar] [CrossRef] [PubMed]
  8. Hao, C.J.; Cheng, X.J.; Xia, H.F.; Ma, X. The endocrine disruptor diethylstilbestrol induces adipocyte differentiation and promotes obesity in mice. Toxicol. Appl. Pharmacol. 2012, 263, 102–110. [Google Scholar] [CrossRef]
  9. Routledge, J.E.; Parker, J.; Odum, J.; Ashby, J.; Sumpter, J.P. Some alkyl hydroxybenoate preservatives (parabens) are estrogenic. Toxicol. Appl. Pharmacol. 1998, 153, 12–19. [Google Scholar] [CrossRef] [PubMed]
  10. Gogoi, A.; Mazumder, P.; Tyagi, V.K.; Tushara Chaminda, G.G.; Kyoungjin Ane, A.; Kumar, M. Occurrence and fate of emerging contaminants in water environment: A review. Groundw. Sustain. Dev. 2018, 6, 169–180. [Google Scholar] [CrossRef]
  11. Watson, C.; Zoeller, T.; Belcher, S. In vitro molecular mechanisms of bisphenol A action. Reprod. Toxicol. 2007, 24, 178–198. [Google Scholar]
  12. Fenichel, P.; Chevalier, N.; Brucker-Davis, F. Bisphenol A: An endocrine and metabolic disruptor. Ann. Endocrinol. 2013, 74, 211–220. [Google Scholar] [CrossRef]
  13. Boas, M.; Feldt-Rasmussen, U.; Main, K.M. Thyroid effects of endocrine disrupting chemicals. Mol. Cell. Endocrinol. 2012, 355, 240–248. [Google Scholar] [CrossRef]
  14. Veiga-Lopez, A.; Pu, Y.; Gingrich, J.; Padmanabhan, V. Obesogenic endocrine disrupting chemicals: Identifying knowledge gaps. Trends Endocrinol. Metab. 2018, 29, 607–625. [Google Scholar] [CrossRef] [PubMed]
  15. Walley, S.N.; Roepke, T.A. Perinatal exposure to endocrine disrupting compounds and the control of feeding behavior—An overview. Horm. Behav. 2018, 101, 22–28. [Google Scholar] [CrossRef] [PubMed]
  16. Hashemi, B.; Zohrabi, P.; Kim, K.H.; Shamsipur, M.; Deep, A.; Hong, J. Recent advances in liquid-phase microextraction techniques for the analysis of environmental pollutants. Trends Anal. Chem. 2017, 97, 83–95. [Google Scholar] [CrossRef]
  17. Seidi, S.; Rezazadeh, M.; Yamini, Y. Pharmaceutical applications of liquid-phase microextraction. Trends Anal. Chem. 2018, 108, 296–305. [Google Scholar] [CrossRef]
  18. Rezaee, M.; Assadi, Y.; Hosseini, M.R.M.; Aghaee, E.; Ahmadi, F.; Berijani, S. Determination of organic compounds in water using dispersive liquid–liquid microextraction. J. Chromatogr. A 2006, 1116, 1–9. [Google Scholar] [CrossRef] [PubMed]
  19. Regueiro, J.; Llompart, M.; Garcia-Jares, C.; Garcia-Monteagudo, J.C.; Cela, R. Ultrasound-assisted emulsification–microextraction of emergent contaminants and pesticides in environmental waters. J. Chromatogr. A 2008, 1190, 27–38. [Google Scholar] [CrossRef]
  20. Khalili Zanjani, M.R.; Yamini, Y.; Shariati, S.; Jönsson, J.A. A new liquid-phase microextraction method based on solidification of floating organic drop. Anal. Chim. Acta. 2007, 585, 286–293. [Google Scholar] [CrossRef]
  21. Yang, D.; Yang, Y.; Li, Y.; Yin, S.; Chen, Y.; Wang, J.; Xiao, J.; Sun, C. Dispersive liquid–liquid microextraction based on solidification of floating organic drop combined with high performance liquid chromatography for analysis of 15 phthalates in water. J. AOAC Int. 2019, 102, 942–951. [Google Scholar] [CrossRef]
  22. Jafariyan, R.; Shabani, A.M.H.; Dadfarnia, S.; Tafti, E.N.; Shirani, M. Dispersive liquid–liquid microextraction based on solidification of floating organic drop as an efficient preconcentration method for spectrophotometric determination of aluminium. Anal. Bioanal. Chem. Res. 2019, 6, 289–299. [Google Scholar]
  23. Ezoddin, M.; Adlnasab, L.; Kaveh, A.A.; Karimi, M.A. Ultrasonically formation of supramolecular based ultrasound energy assisted solidification of floating organic drop microextraction for preconcentration of methadone in human plasma and saliva samples prior to gas chromatography–mass spectrometry. Ultrason. Sonochem. 2019, 50, 182–187. [Google Scholar] [CrossRef]
  24. Guiñez, M.; Bazan, C.; Martinez, L.D.; Cerutti, S. Determination of nitrated and oxygenated polycyclic aromatic hydrocarbons in water samples by a liquid–liquid phase microextraction procedure based on the solidification of a floating organic drop followed by solvent assisted back-extraction and liquid chromatography–tandem mass spectrometry. Microchem. J. 2018, 139, 164–173. [Google Scholar]
  25. Asadi, M. Determination of ochratoxin A in fruit juice by high-performance liquid chromatography after vortex-assisted emulsification microextraction based on solidification of floating organic drop. Mycotoxin Res. 2018, 34, 15–20. [Google Scholar] [CrossRef] [PubMed]
  26. Aydin, I.; Chormey, D.S.; Budak, T.; Firat, M.; Turak, F.; Bakirdere, S. Development of an accurate and sensitive analytical method for the determination of cadmium at trace levels using dispersive liquid–liquid microextraction based on the solidification of floating organic drops combined with slotted quartz tube flame atomic absorption spectrometry. J. AOAC Int. 2018, 101, 843–847. [Google Scholar] [PubMed]
  27. Coutts, R.T.; Hargesheimer, E.E.; Pasutto, F.M. Gas chromatographic analysis of trace phenols by direct acetylation in aqueous solution. J. Chromatogr. A 1979, 179, 291–299. [Google Scholar] [CrossRef]
  28. Faraji, H.; Tehrani, M.S.; Husain, S.W. Pre-concentration of phenolic compounds in water samples by novel liquid–liquid microextraction and determination by gas chromatography–mass spectrometry. J. Chromatogr. A 2009, 1216, 8569–8574. [Google Scholar] [CrossRef]
  29. Casado, J.; Nescatelli, R.; Rodríguez, I.; Ramil, M.; Marini, F.; Cela, R. Determination of benzotriazoles in water samples by concurrent derivatization–dispersive liquid–liquid microextraction followedby gas chromatography–mass spectrometry. J. Chromatogr. A 2014, 1336, 1–9. [Google Scholar] [CrossRef] [PubMed]
  30. Ma, J.J.; Du, X.; Zhang, J.W.; Li, J.C.; Wang, L.Z. Ultrasound-assisted emulsification-microextraction combined with flame atomic absorption spectrometry for determination of trace cadmium in water samples. Talanta 2009, 80, 980–984. [Google Scholar] [CrossRef]
  31. Kapelewska, J.; Kotowska, U.; Karpińska, J.; Kowalczuk, D.; Arciszewska, A.; Świrydo, A. Occurrence, removal, mass loading and environmental risk assessment of emerging organic contaminants in leachates, groundwaters and wastewaters. Microchem. J. 2018, 137, 292–301. [Google Scholar] [CrossRef]
  32. Lapworth, D.J.; Baran, N.; Stuart, M.E.; Ward, R.S. Emerging organic contaminants in groundwater: A review of sources, fate and occurrence. Environ. Pollut. 2012, 163, 287–303. [Google Scholar] [CrossRef] [Green Version]
  33. Bexfield, L.M.; Toccalino, P.L.; Belitz, K.; Foreman, W.T.; Furlong, E.T. Hormones and pharmaceuticals in groundwater used as a source of drinking water across the United States. Environ. Sci. Technol. 2019, 53, 2950–2960. [Google Scholar] [CrossRef]
  34. Schulze, S.; Zahn, D.; Montes, R.; Rodil, R.; Quintana, J.B.; Knepper, T.P.; Reemtsma, T.; Berger, U. Occurrence of emerging persistent and mobile organic contaminants in European water samples. Water Res. 2019, 153, 80–90. [Google Scholar] [CrossRef] [PubMed]
  35. Stuart, M.E.; Manamsa, K.; Talbot, J.C.; Crane, E.J. Emerging Contaminants in Groundwater; British Geological Survey Open Report; British Geological Survey: Nottingham, UK, 2011.
  36. Sorensen, J.P.R.; Lapworth, D.J.; Nkhuwa, D.C.W.; Stuart, M.E.; Gooddy, D.C.; Bell, R.A.; Chirwa, M.; Kabika, J.; Liemisa, M.; Chibesa, M.; et al. Emerging contaminants in urban groundwater sources in Africa. Water Res. 2015, 72, 51–63. [Google Scholar] [CrossRef] [PubMed]
  37. Lu, M.C.; Chen, Y.Y.; Chiou, M.R.; Chen, M.Y.; Fan, H.J. Occurrence and treatment efficiency of pharmaceuticals in landfill leachates. Waste Manag. 2016, 55, 257–264. [Google Scholar] [CrossRef] [PubMed]
  38. Buszka, P.M.; Yeskis, D.J.; Kolpin, D.W.; Furlong, E.T.; Zaugg, S.D.; Meyer, M.T. Waste-indicator and pharmaceutical compounds in landfill-leachate-affected ground water near Elkhart, Indiana, 2000–2002. Bull. Environ. Contam. Toxicol. 2009, 82, 653–659. [Google Scholar] [CrossRef] [PubMed]
  39. Kapelewska, J.; Kotowska, U.; Wiśniewska, K. Determination of personal care products and hormones in leachate and groundwater from Polish MSW landfills by ultrasound-assisted emulsification microextraction and GC-MS. Environ. Sci. Pollut. Res. 2016, 23, 1642–1652. [Google Scholar] [CrossRef] [PubMed]
  40. Nowicki, Z. Underground Waters of Provincial Cities of Poland; Państwowy Instytut Geologiczny: Warszawa, Poland, 2007. (In Polish) [Google Scholar]
Figure 1. Stages of ultrasound-assisted emulsification-microextraction with solidification of the floating organic drop (USAEME-SFOD): (a) Placing test solution in a test tube; (b) adding acetic anhydride; (c) adding 1-undecanol; (d) subjecting the sample to sonication; (e) sample after sonication; (f) placing the tube in a centrifuge; (g) cooling in an ice bath; (h) a solid drop of solvent; (i) transferring the drop into a chromatography vial; (j) sample ready for GC-MS analysis.
Water 11 01638 g001
Figure 2. Chromatogram obtained during the GC-MS analysis: (1) N,N-diethyltoluamide (DEET), (2) benzophenone (BPH), (3) propylparaben (PP), (4) butylparaben (BP), (5) 4-t-octylphenol (4OP),(6) 4-n-nonylphenol (4NP), (7) 3-(4-methylbenzylidene)camphor (3MBC), (8) diclofenac (DIC), (9) triclosan (TRC) (10) tricosane (internal standard), (11) bisphenol A (BPA), (12) diethylstilbestrol (DES), (13) estrone (E1), (14) β-estradiol (E2).
Water 11 01638 g002
Figure 3. The influence of the 1-undecanol volume on isolation efficiency.
Water 11 01638 g003
Figure 4. The influence of the volume of acetic anhydride on isolation efficiency.
Water 11 01638 g004
Figure 5. The influence of sodium hydrogen phosphate concentration on isolation efficiency.
Water 11 01638 g005
Figure 6. The influence of the extraction time on isolation efficiency.
Water 11 01638 g006
Table 1. Retention times, molecular weights of target compounds, together with quantification and identification ions.
AnalyteGroupFormulaMolar Weight (MW), (g/mol)Chemical Abstracts Service NumberRetention Time (min)Quantification and Identification Ion (m/z)
E2Natural steroid hormoneC18H24O227250-28-225.0543, 146, 272
E1Natural steroid hormoneC18H22O227053-16-724.81185, 270, 272
DESArtificial non-steroid hormoneC18H20O226856-53-121.87268, 310, 352
DICNon-steroidal anti-inflammatory drugC14H11Cl2NO229615,307-79-616.24214, 242, 277
PPPreservativeC10H12O318094-13-36.71121, 138, 180
BPPreservativeC11H14O319494-26-88.90121, 138, 194
BPHUV filterC13H10O182119-61-96.4177, 105, 182
3MBCUV filterC18H22O25436,861-47-914.47128, 171, 254
DEETRepellentC12H17NO191134-62-35.4691, 119, 190
4OPNonionic surfactantC14H22O2061806-26-410.9643, 107, 206
4NPNonionic surfactantC15H24O22084,852-15-312.8543, 107, 220
BPASubstrate in the production of plasticsC15H16O222880-05-719.53213, 228, 270
TRCAntisepticC12H7Cl3O2289.53380-34-516.39218, 288, 290
Table 2. Solvents tested for target compounds extraction by USAEME-SFOD.
SolventCASMolar Mass (g/mol)Melting Point (°C)Boiling Point (°C)Density (g/mL)
1-Undecanol112-42-5172.31132430.830
2-Dodecanol10,203-28-8186.34182500.829
1-Dodecanol112-53-8186.34242590.831
n-Hexadecane544-76-3226.4118286.80.773
Table 3. Overview of the method’s linearity studies.
AnalyteEquation of the Calibration Curve *Coefficient of Determination (r2) *
Range I (0.001–0.05 μg/L)Range II (0.05–10 μg/L)Range I (0.001–0.05 μg/L)Range II (0.05–10 μg/L)
E2-y = 1940.2x − 144.7-0.9982
E1y = 2835.0x + 254.5y = 5214.1x − 570.50.99700.9965
DESy = 7036.5x + 234.7y = 5105.1x − 861.90.99490.9974
DICy = 3102.3 + 292.2y = 1490.7x + 500.00.98940.9929
PPy = 6120.7x + 309.9y = 5807.8x + 799.40.98910.9993
BPy = 30,653.4x + 1269.4y = 9395.7x + 2330.70.98720.9960
BPHy = 191,925.7x + 7247.8y = 7793.9x + 16284.30.99440.9993
3MBCy = 4671.2x + 128.3y = 2580.6x + 113.70.99010.9978
DEETy = 8894.3x + 1231.8y = 3955.3x + 1761.60.98530.9988
4OPy = 31,697.4x + 658.1y = 18,968.0x − 298.70.99350.9962
4NPy = 10,575.9x + 236.2y = 8932.6x + 293.00.98900.9904
BPAy = 119,133.7x + 3285.2y = 10,428.7x + 6435.30.99160.9974
TRCy = 6070.4x + 215.5y = 4535.3x + 674.80.98690.9994
* Real groundwater was used as the sample matrix in method validation.
Table 4. Limits of detection and quantification, repeatability, and trueness of the developed method, and its comparison with values obtained when the solvent with a density higher than water (chloroform) is used.
AnalyteUSAEME-SFOD/GC-MS (This Work) *USAEME/GC-MS (From Literature [31]) *
Recovery (%)RSD (%)LoD (ng/L)LoQ (ng/L)Recovery (%)RSD (%)LoD (ng/L)LoQ (ng/L)
0.03 µg/L4.00 µg/L1 µg/L
E2121.390.215.55.919.510314.3130.73435.77
E1-111.516.71.545.1010310.38.9229.73
DES96.790.116.80.040.1210113.788.36294.54
DIC93.399.111.40.170.5611012.1149.55498.48
PP116.795.513.50.050.169712.423.6247.24
BP120.092.213.80.040.1512614.010.2134.03
BPH110.0103.78.90.030.1110516.22.979.90
3MBC120.793.711.00.040.1511611.23.0110.00
DEET113.899.510.40.020.0511717.31.504.99
4OP113.393.113.90.020.0710510.31.505.00
4NP112.997.76.70.010.0510114.72.949.80
BPA123.194.715.80.040.1210715.61.494.98
TRC123.396.110.20.040.1413415.82.488.26
RSD—relative standard deviation; LoD—limit of detection; LoQ—limit of quantification. * Real groundwater was used as the sample matrix in method validation.
Table 5. The ECs concentrations (ng/L; range and median) in groundwater samples from deep wells, shallow wells, and monitoring wells located in two municipal solid waste (MSW) landfill sites with detection frequencies.
AnalyteGroundwater Samples from Drilling Wells (NS = 6)Groundwater Samples from Shallow Wells (NS = 5)Groundwater Samples from MSW Monitoring Wells (NS = 12)
Range (ng/L)Median (ng/L)d.f.Range (ng/L)Median (ng/L)d.f.Range (ng/L)Median (ng/L)d.f.
E2n.d.-0n.d.-0n.d.-0
E1n.d.-0n.d.-0n.d.–3091072
DESn.d.-0n.d.-0n.d.-0
DIC n.d.-0n.d.-0n.d.–3122803
PPn.d.-0n.d.-0n.d.–0.5-1
BPn.d.-0n.d.-0n.d.–0.20.22
BPHn.d.-0n.d.–124-10.5–33003312
3MBCn.d.-0n.d.-0n.d.-0
DEETn.d.–222n.d.–2162n.d.–3210
4OPn.d.-0n.d.–17112n.d.–25103
4NPn.d.-0n.d.–8-1n.d.–972
BPAn.d.–98532n.d.–68912440.2–10507912
TRCn.d.-0n.d.-0n.d.–38283
NS = number of samples, d.f. = detection frequencies, number of samples with concentration higher than LoD; n.d—not detected.

