Article

Local Scour at Complex Bridge Piers in Close Proximity under Clear-Water and Live-Bed Flow Regime

Department of Civil and Environmental Engineering, The University of Auckland, Private Bag 92019, Auckland 1142, New Zealand
*
Author to whom correspondence should be addressed.
Water 2019, 11(8), 1530; https://doi.org/10.3390/w11081530
Submission received: 24 June 2019 / Revised: 15 July 2019 / Accepted: 19 July 2019 / Published: 24 July 2019
(This article belongs to the Special Issue Experimental, Numerical and Field Approaches to Scour Research)

Abstract

:
In this study, we investigated the characteristics of scour at complex bridge piers in close proximity. The experiments were performed under both clear-water and live-bed flow regimes. We compare our results with those for a single complex pier. Further, the performance of existing predictors is discussed. In this study, four typical pier arrangements were adopted, including side-by-side with aligned or 30° skewed flow, staggered, and tandem. The results show that the skew angle for a side-by-side arrangement significantly accelerates the clear-water scour development at all the vertical piles as well as between the piers, and the most scoured pile shifts from the upstream end to the downstream end of the upstream pier flank. The staggered and tandem pier arrangement show significant protection to the downstream pier for both the developing rate and the equilibrium scour depth. When the flow velocity exceeds the threshold for general bed motion, the clear-water scour pattern for all the pier arrangements may be altered significantly due to the upstream sediment supply, the weakened protection effect, and the enhanced flow contraction. The bed-forms migrate via the bridge opening and are damped gradually by the flow, and thus the response of the bed morphology under live-bed conditions is quite unsteady.

1. Introduction

Scour is one of the most common damages to bridges in fluvial environments. The approaching flow diverted by a pier leads to a series of large-scale turbulence coherent structures, e.g., horseshoe vortex, surface roller, and wave vortices, which consequently increase the kinetic energy and the eroding capacity of the flow. A scour hole forms around the pier when the surrounding erodible bed materials are significantly entrained and eroded away by flow features. At the same time, the pier itself is further exposed. The existence of a scour hole significantly alters the inherent frequency, stress, or bearing conditions of the pier and leads to either a settling, bending, or aggravated wobbling effect. The failure of a bridge foundation damages not only the engineering purposes of the bridge itself but also possibly the downstream ecological environment, e.g., spawning beds (Melville and Coleman [1]).
Bridge piers are usually built with complex geometry due to mechanical, geotechnical, and structural considerations. Thus, complex pier forms are more widely adopted around the world than the single pier form with uniform cross-sections. A typical complex bridge pier often consists of a wall-like column supporting the bridge deck and superstructures, a pile-cap under the column, and a group of piles supporting the pile-cap. Complex bridge piers are usually built in close proximity to each other for large bridges with multiple lanes, parallel companion bridges (especially highway-railway bridges combination), and bridges with continuous spans on flood plains. The remnants of previously existing bridges that have been demolished or destroyed may also influence adjacent newly built ones. Figure 1 show the typical cases of complex piers in close proximity. The flow field and sediment transport mechanism are significantly altered at a complex pier with another one nearby. Thus, the existing scour predictors may not be applied to such situations directly and need further adjustment with caution.
Previous studies have paid much attention to current-induced scour at multiple piles (Hannah [2]; Elliott and Baker [3]; Zhao and Sheppard [4]; Sumer et al. [5,6]; Ataie-Ashtiani and Beheshti [7]; Amini et al. [8]; Liang et al. [9]; Lança et al. [10]; Das and Maxumdar [11]; Wang et al. [12]; Khaple et al. [13]; and Kim et al. [14]) and scour at complex piers (Jones and Sheppard [15]; Coleman [16]; Sheppard and Glasser [17]; Ataie-Ashtiani et al. [18]; Grimaldi and Cardoso [19]; Beheshti & Ataie-Ashtiani [20,21]; Moreno et al. [22,23,24]; Ferraro et al. [25]; Amini et al. [26]; Baghbadorani et al. [27]; and Yang et al. [28]), respectively. However, there is still no solution for dealing with scenarios with multiple complex piers, indicating an obvious gap of the existing knowledge. This gap is the impetus of the present study. As a result of the insufficient knowledge, people usually tend to design with large safety redundancy when dealing with real engineering practices, leading to excessive cost and push the original budget much higher. In addition, it is also worth mentioning that the interaction between bridge piers and other bridge foundation components, e.g., the abutments, has also been studied by Oben-Nyarko and Ettema [29] and Sturm et al. [30,31]. They found that the extent and depth of the abutment’s scour hole is much greater than that of a nearby pier and thus the scour aggravation caused by pier proximity is usually negligible.
This paper is aimed at providing an insight into the scour pattern at complex bridge piers in close proximity and determining the quantitative and qualitative scour features under both clear-water and live-bed flow regime. The morphological response of the erodible bed at the adjacent piers may vary significantly with or without general sediment transport and bed-form migration, which are common fluvial factors that should not be neglected.

2. Experimental Setup

The experiments in the present study were performed in a 2.4-m wide, 0.6-m deep, and 25-m long sediment-recirculating flume in the Fluid Mechanics Laboratory at the University of Auckland. The flume slope is adjustable up to a 1% slope. The flume is equipped with two water pumps, allowing a maximum of 1100 liters per second discharge and one sand pump. A 4.0-m long, 0.6-m deep sediment recess box, i.e., the test section for scour experiments, is located 11-m downstream from the water outlet section. The sediment used in the present study was uniform quartz sand with median particle diameter d 50 = 0.84-mm and geometrical standard deviation σ g = 1.30. This sediment grain size is coarse enough to be considered as non-cohesive and non-ripple-forming.
The complex pier model used in the present study was made from solid materials and represents a form typical of the bridge piers that have failed in the past several decades in New Zealand, as described by Melville and Coleman [1]. These failures include the Bulls Road Bridge on SH1, the Blackmount Road Bridge, the Oreti River Road Bridge, and the Whakatane River Road Bridge. The model consists of a rectangular wall-like column (310-mm long and 30-mm wide), a rectangular pile-cap (362-mm long, 120-mm wide, and 60-mm thick) and a 2 × 4 pile group (25-mm in diameter for each vertical pile). The model has a geometric scale of 3:50 and is similar to the primary model used by Yang et al. [28]. Figure 2 shows the schematic drawings of the configuration of the complex pier model.
Depth-averaged velocities were measured by a Nortek Vectrino+ ADV made in Norway. A relationship was found between the measured flow velocity, the reading of the electromagnetic flow meter, and the working frequency of the pump controller. The scour depth was measured using a SeaTek multiple transducer array (MTA) made in USA; detailed specification can be referred in [32]. Each transducer has a cylindrical shape and is 12.7-mm in diameter and 25.4-mm in length. The transducers were fixed onto a transversal frame across the flume and in holes drilled in the pile cap, to measure instantaneous scour depth around the pier and at each pile throughout the duration of the tests. The transducers emit ultrasound pulses with a frequency up to 20-Hz and thereby measure the distance by analyzing the reflected signal.
Four different pier arrangements were used to represent typical scenarios of complex pier proximity in the field, including: (a) two adjacent side-by-side complex piers that are both aligned to the approaching flow; (b) two adjacent side-by-side complex piers are that are both skewed to the approaching flow with α = 30 ° ; (c) two aligned complex piers that are staggered with 30° angle between the flow direction and the line connecting the pier centres; and (d) two aligned complex piers with tandem arrangement. Besides the side-by-side arrangements, two adjacent complex piers can also support different bridge decks, which are common for companion bridges with multiple lanes. If so, the position relationship between two adjacent piers can be either staggered or tandem. The distance between two adjacent piers is based on typical real cases, while a closer distance is rarely adopted in engineering practices. Figure 3 shows the schematic drawings and photos of the experimental setups before filling the flume. The red circles mark the locations where the MTA transducers were placed to monitor real-time bed level data. Further transducers were also set upstream of the pier to monitor undisturbed bed-forms but are not located in the figure. Figure 4 provides more detailed setup information of the MTA transducers at one of the piers, as well as the numbering scheme for the transducers. Previous studies, including Zhao and Sheppard [4], Lança et al. [10], and Yang et al. [28] have shown that, for scour at a group of piles or a stand-alone skewed complex pier, the maximum scour depth usually occurs at the downstream end of the upstream pile column, i.e., A3 or A4.
The experimental design in the present study in shown in Table 1. The flow depth y 0 was fixed at 0.15 m. The pile-cap elevation was fixed at H c = 0.06 m and the base of the pile-cap was at the original bed level. This position is typical and leads to enlarged scour hole, as previous studies (Ataie-Ashtiani et al. [18], Moreno et al. [22], and Yang et al. [28]) have shown that the scour depth is maximized when the pile-cap is near the original bed level. For each pier arrangement, a wide range of flow intensity ratios ( U / U c ) were tested, from 0.9 to 4.0–5.2, to investigate scour features under both clear-water ( U / U c 1 ) and live-bed ( U / U c > 1 ) flow regimes. When U / U c > 1 , the sediment particles over the entire channel bed start to move downstream and lead to consecutive migrating dunes with wavy patterns.

3. Clear-Water Scour Experiments

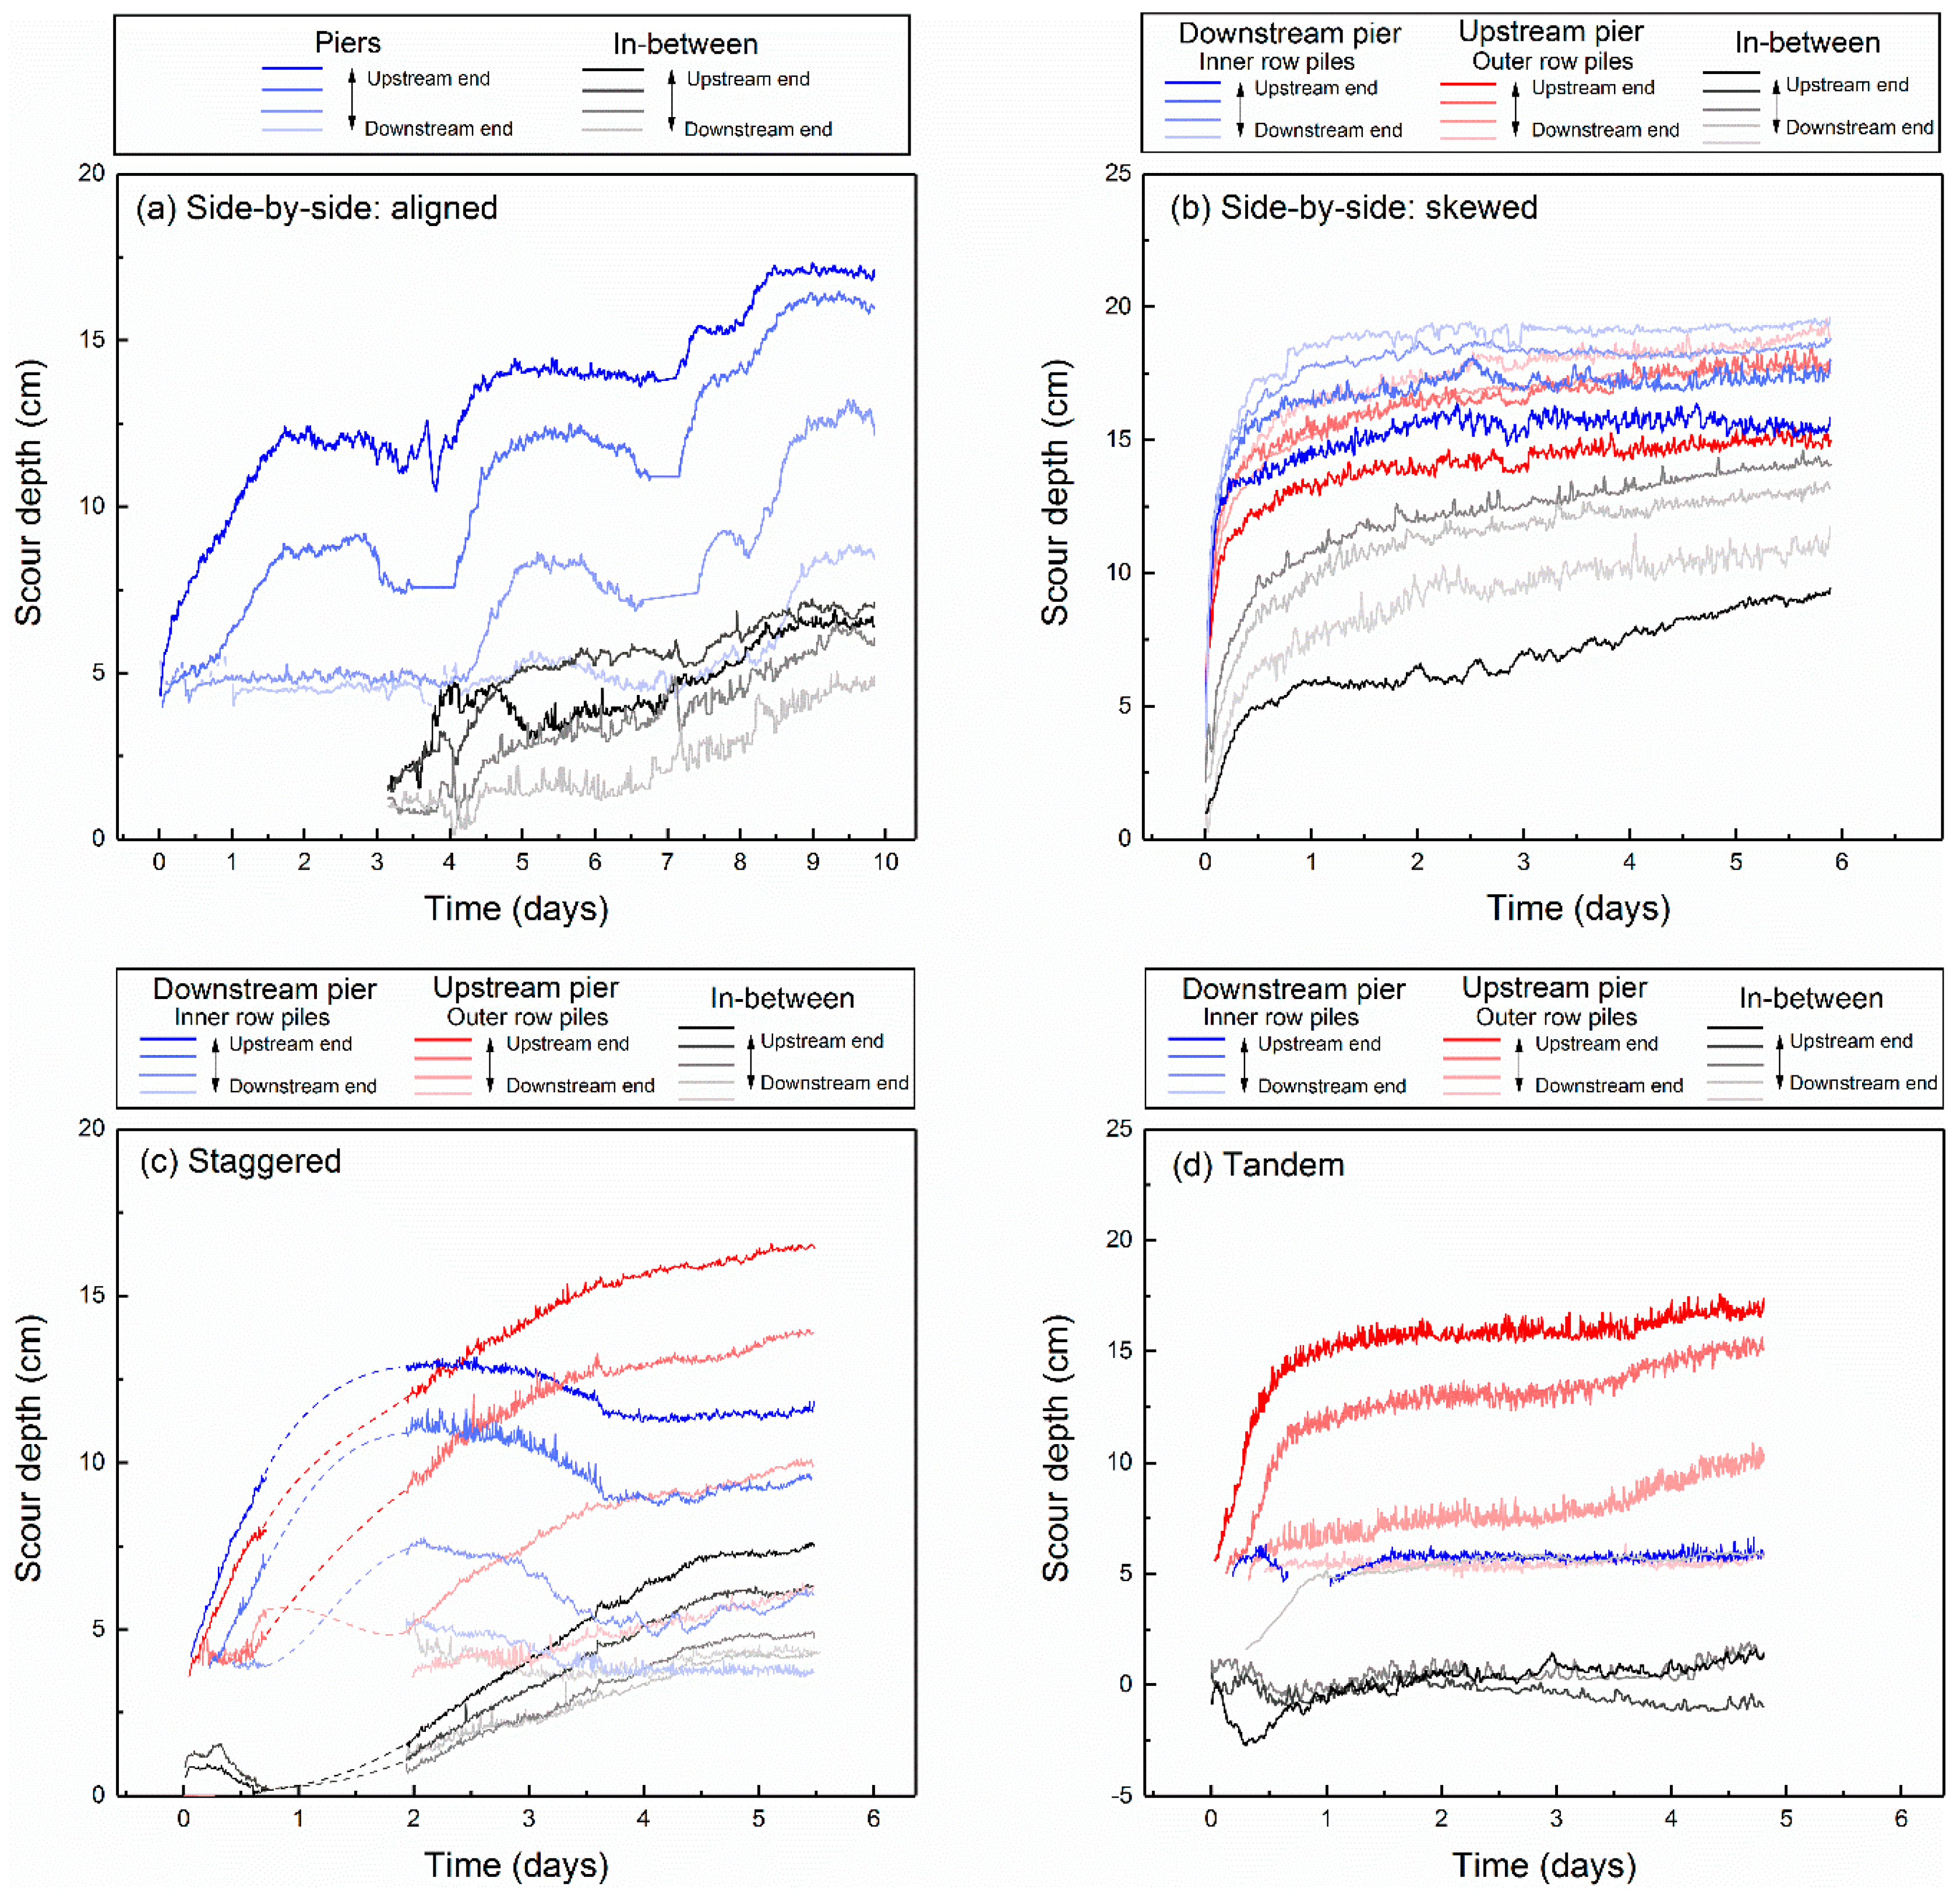
3.1. Temporal Evolution

The temporal evolutions of the experiments in the present study are shown in Figure 5, displaying the development with time of scour depth at the transducers. Due to the many measuring locations, the data are displayed with increased transparency towards downstream for a clearer distinction. To reduce the potential distraction caused by excessive lines, part of the data of minor significance are deleted from the graph, while the general trends can still be shown clearly. It should also be noted that the transducers are not functional when they are buried or the distance to the bed is smaller than 0.03-m. Thus, part of the scour data at the beginning stage are not available, such that some of the curves start at a non-zero value.
Figure 5a shows the scour temporal evolution for the side-by-side arrangement with aligned flow. Data from just one of the complex piers are displayed, as the scour patterns are symmetric. Scour at two pile columns of any one of the adjacent piers are very close, and the scour depth at each column decreases towards downstream. Scour between the two complex piers, where the flow is usually contracted and accelerated, is minor during the first 300,000 s ( 3.5 days), followed by comparatively rapid scour when the scour holes produced by the two piers expand and merge. It indicates that the current level of proximity for this arrangement will not lead to significant contraction scour between two piers under clear-water flow regime. The maximum in-between scour depth occurs at the upstream end of the space and decreases towards downstream, which is similar to the natural profile of the merged scour holes.
When there is a 30° skew angle (which is common for river bends or braided channels), as shown in Figure 5b, the scour temporal evolutions at all the measuring locations suggest consistent trends with rapid deepening during the first 100,000 s followed by comparatively slow development of the scour holes to reach equilibrium. Similar to the scour features at stand-alone skewed complex piers (Yang et al. [28]) and pile groups (Zhao and Sheppard [4]; Lança et al. [10]), the maximum scour depths at both of the adjacent piers occur at the downstream ends of the upstream pier flanks (pile A4). Thus, only the data of the pile column at the upstream pier flank (pile A1–A4) of each pier are shown. Generally, the scour depth at each pile column increases towards downstream, in contrast to the aligned arrangement. The scour between the two piers initiates rapidly at the beginning of the experiment without significant stagnation and the maximum equilibrium scour depth occurs at the middle section of the in-between space.
Figure 5c shows the scour temporal evolution at two staggered complex piers. The downstream pier shows an “ascend-descend-equilibrium” trend, which is conjectured to be due to the incoming sediment eroded from the upstream pier filling the downstream scour hole. A similar trend can also be observed for the bed-level data between the piers. The sediment particles entrained and eroded away from the scour hole at the upstream pier are transported towards downstream by wake vortices with a certain skew angle to the pier’s centerline; it is observed that the inner path of transport may partially overlap with the downstream pier. As a result, the scour depths at the downstream complex pier are significantly smaller than the upstream pier. The maximum scour depth at each pier still occurs at the first-row piles. However, for the downstream pier, the scour at the inner side (pile A1) is reduced by the upstream sediment supply.
For the tandem pier arrangement, as shown in Figure 5d, the temporal trend is much simpler than the staggered arrangement. The scour at the downstream pier is significantly mitigated by the upstream pier, which leads to strong vortex shedding observed and thereby the weakened scouring capacity in the lee-wake area.

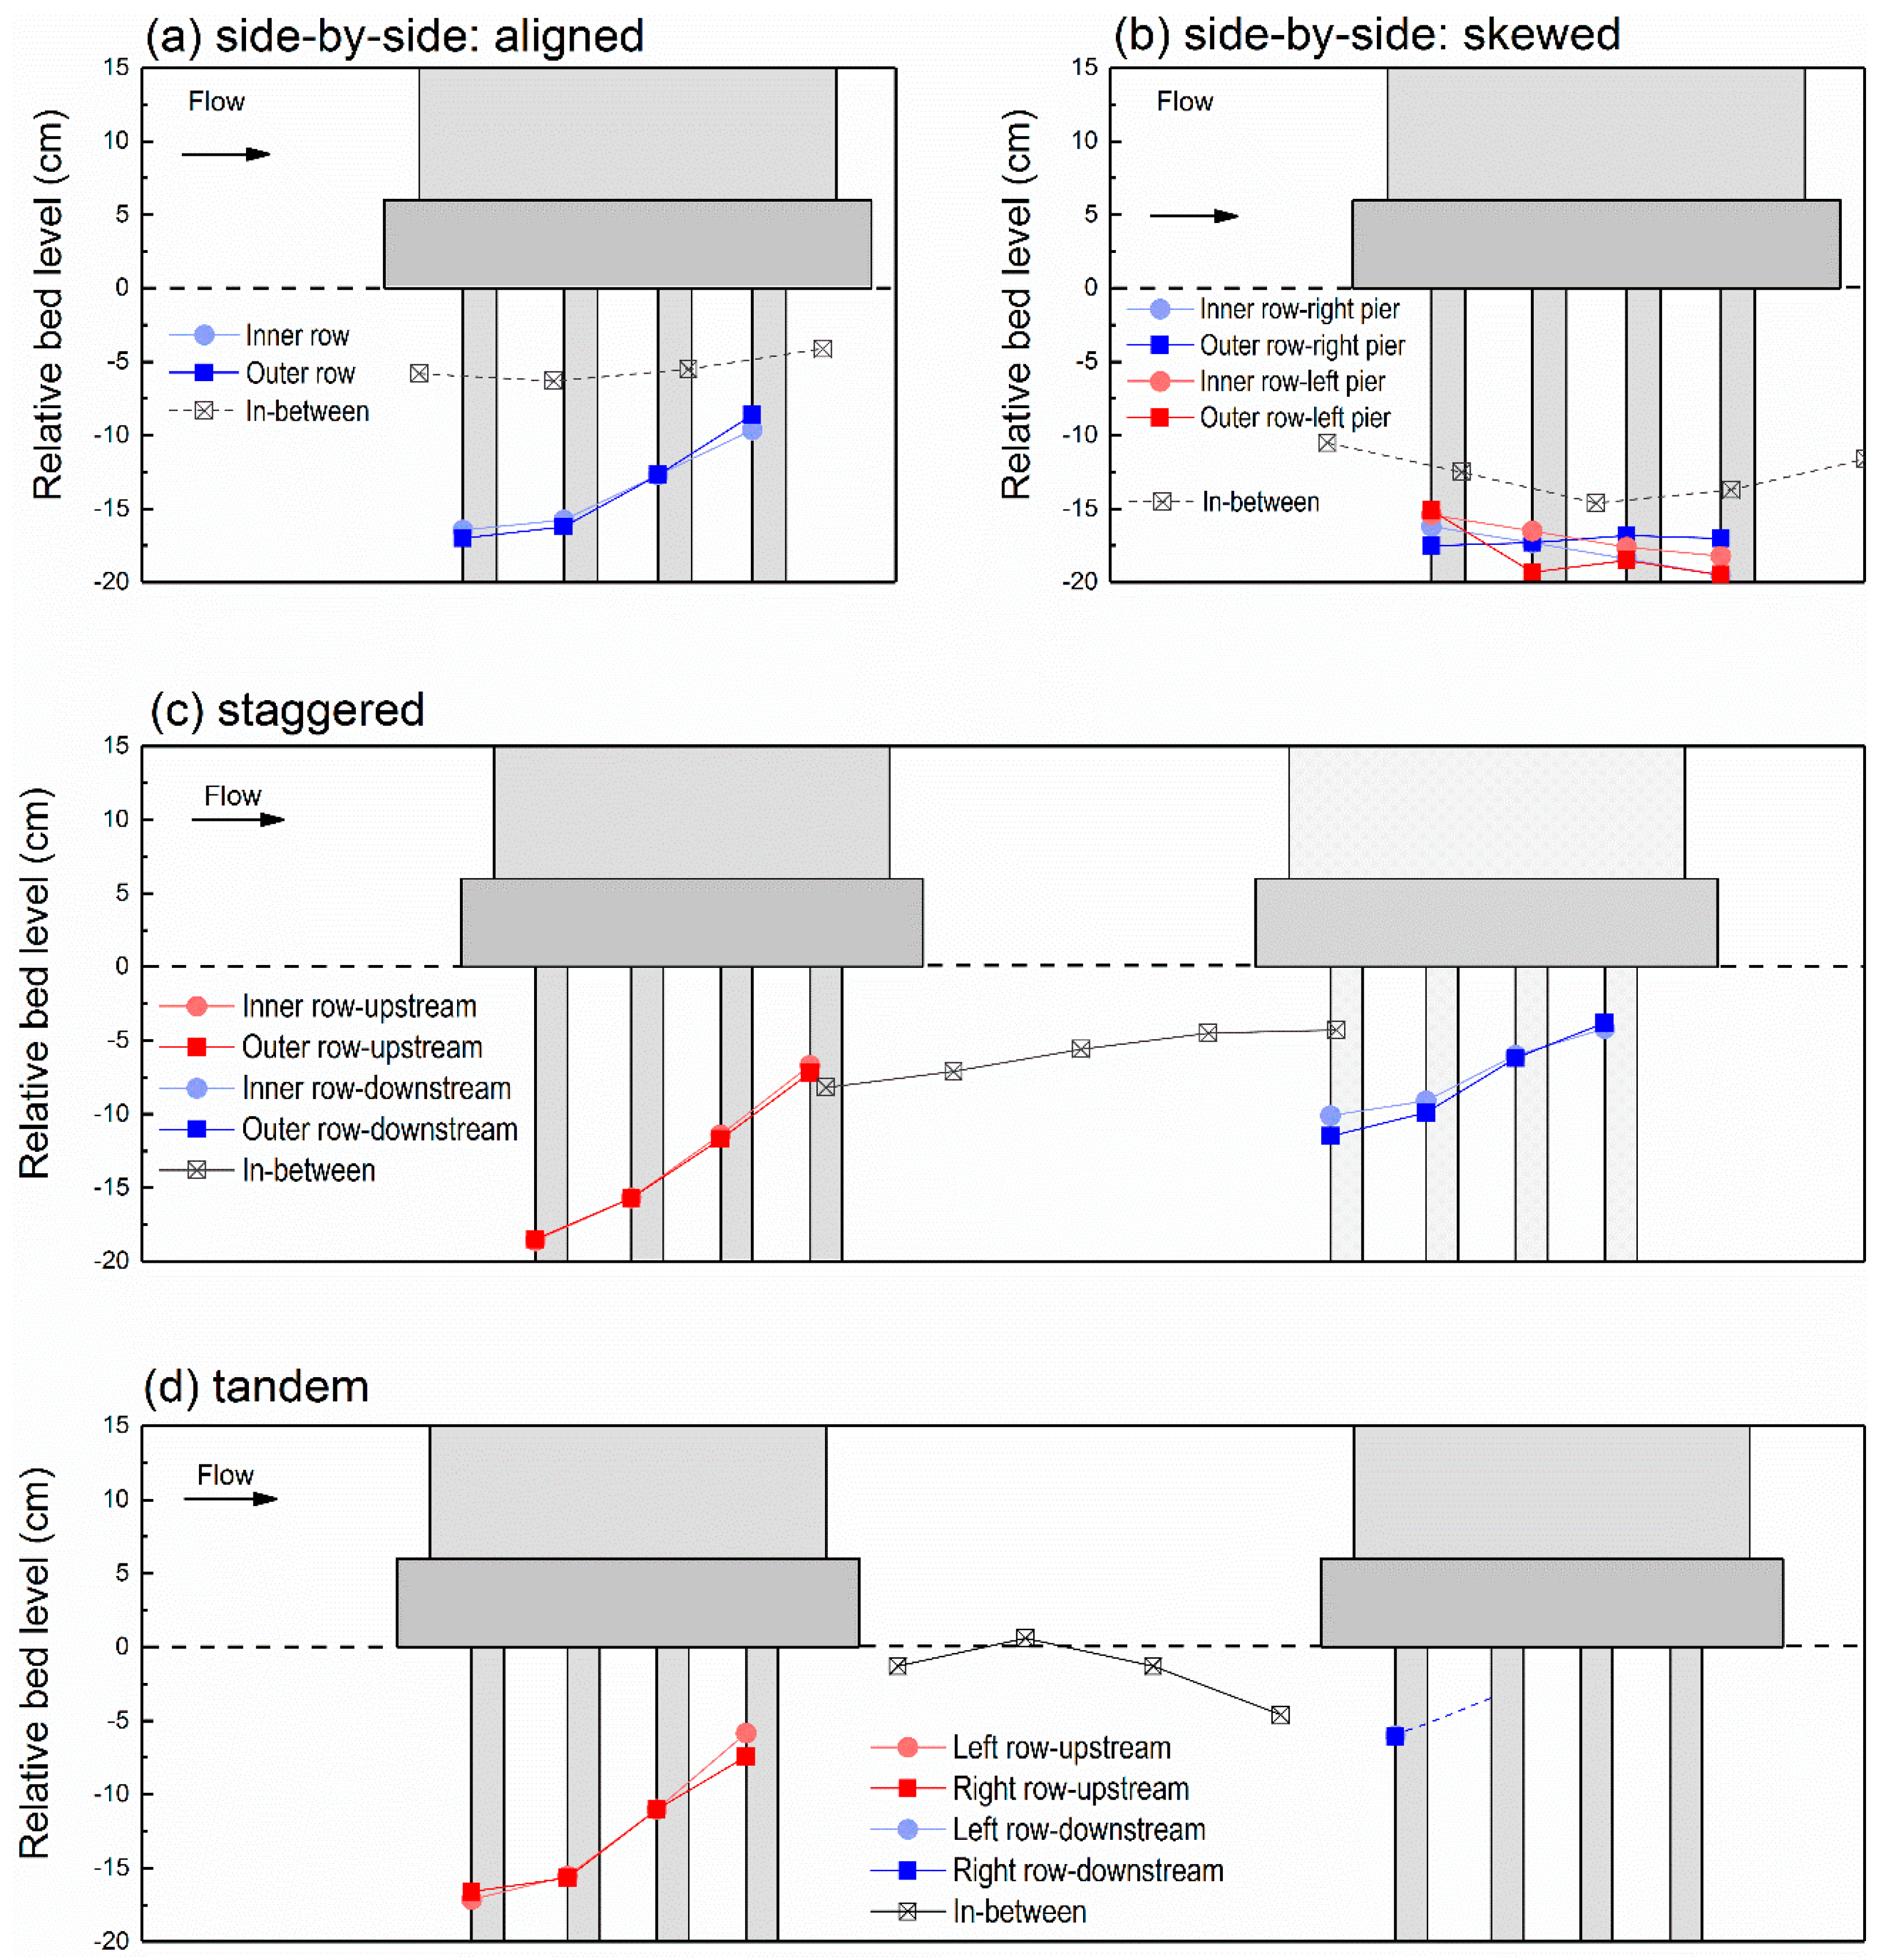
3.2. Equilibrium Bed Level

The equilibrium scour depths are calculated using the temporal evolution curves shown in Figure 5 and the extrapolation method validated by Yang et al. [28]. Figure 6 shows the equilibrium bed level for each pier arrangement in the present study with a viewing direction perpendicular to the approaching flow. This figure acts as a supplement to the temporal evolution data to clearly illustrate the maximum range of scouring excavation that can possible happen under clear-water flow regime. The scour at inner and outer pile columns are generally symmetric for aligned complex piers, while an oblique alignment leads to more complex scour patterns at and between the two piers. The scour between piers under clear-water flow regime is found to be caused by the expansion and merging of the scour holes rather than contraction scour due to the symmetric scour pattern observed in Figure 6a, and thus the spatial distribution of in-between scour generally follows the natural profile of the scour holes. For the staggered and tandem pier arrangement tested, the greatest scour occurred at the leading side (pile A1 and B1) of the upstream pier. The protection effect of the upstream pier is similar to the performance of sacrificial piles as stated by Melville and Hadfield [33]. This protection is due to the increased sediment supply for the downstream pier and, as also mentioned above and observed during the experiments, the lee-wake turbulence and the vortex shedding path caused by the upstream pier overlapped with the downstream pier.

4. Live-Bed Scour Experiments

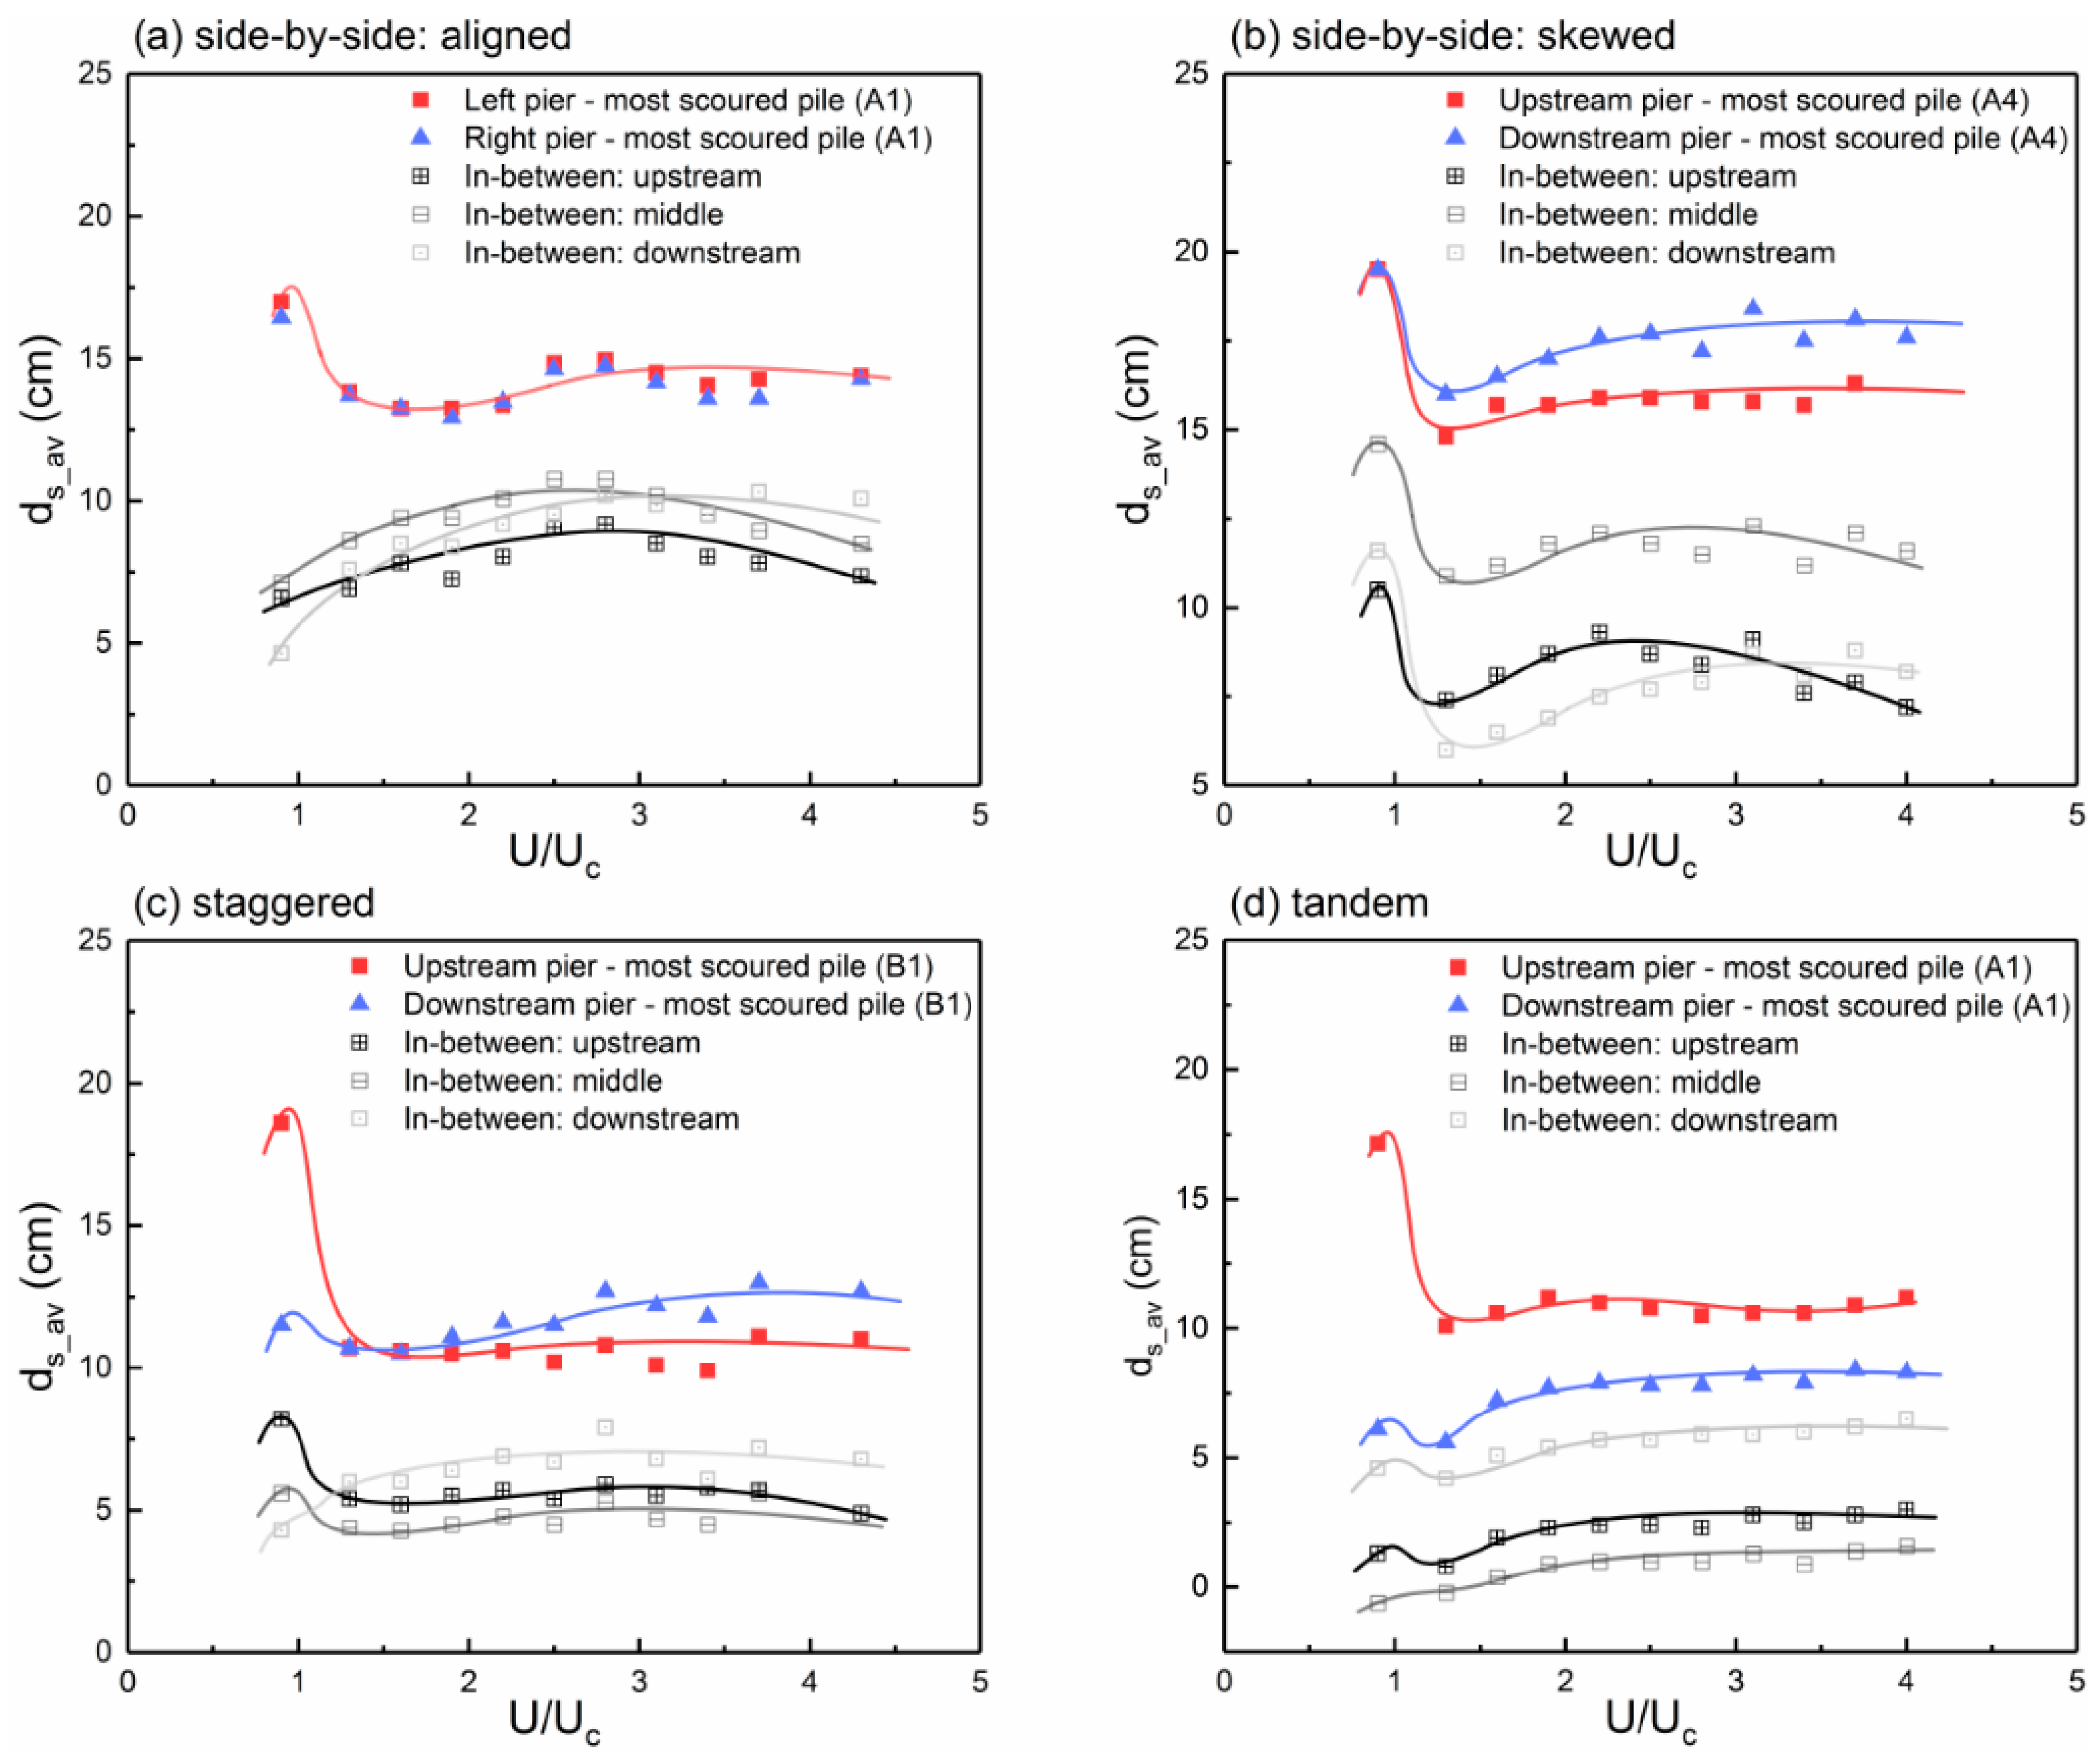
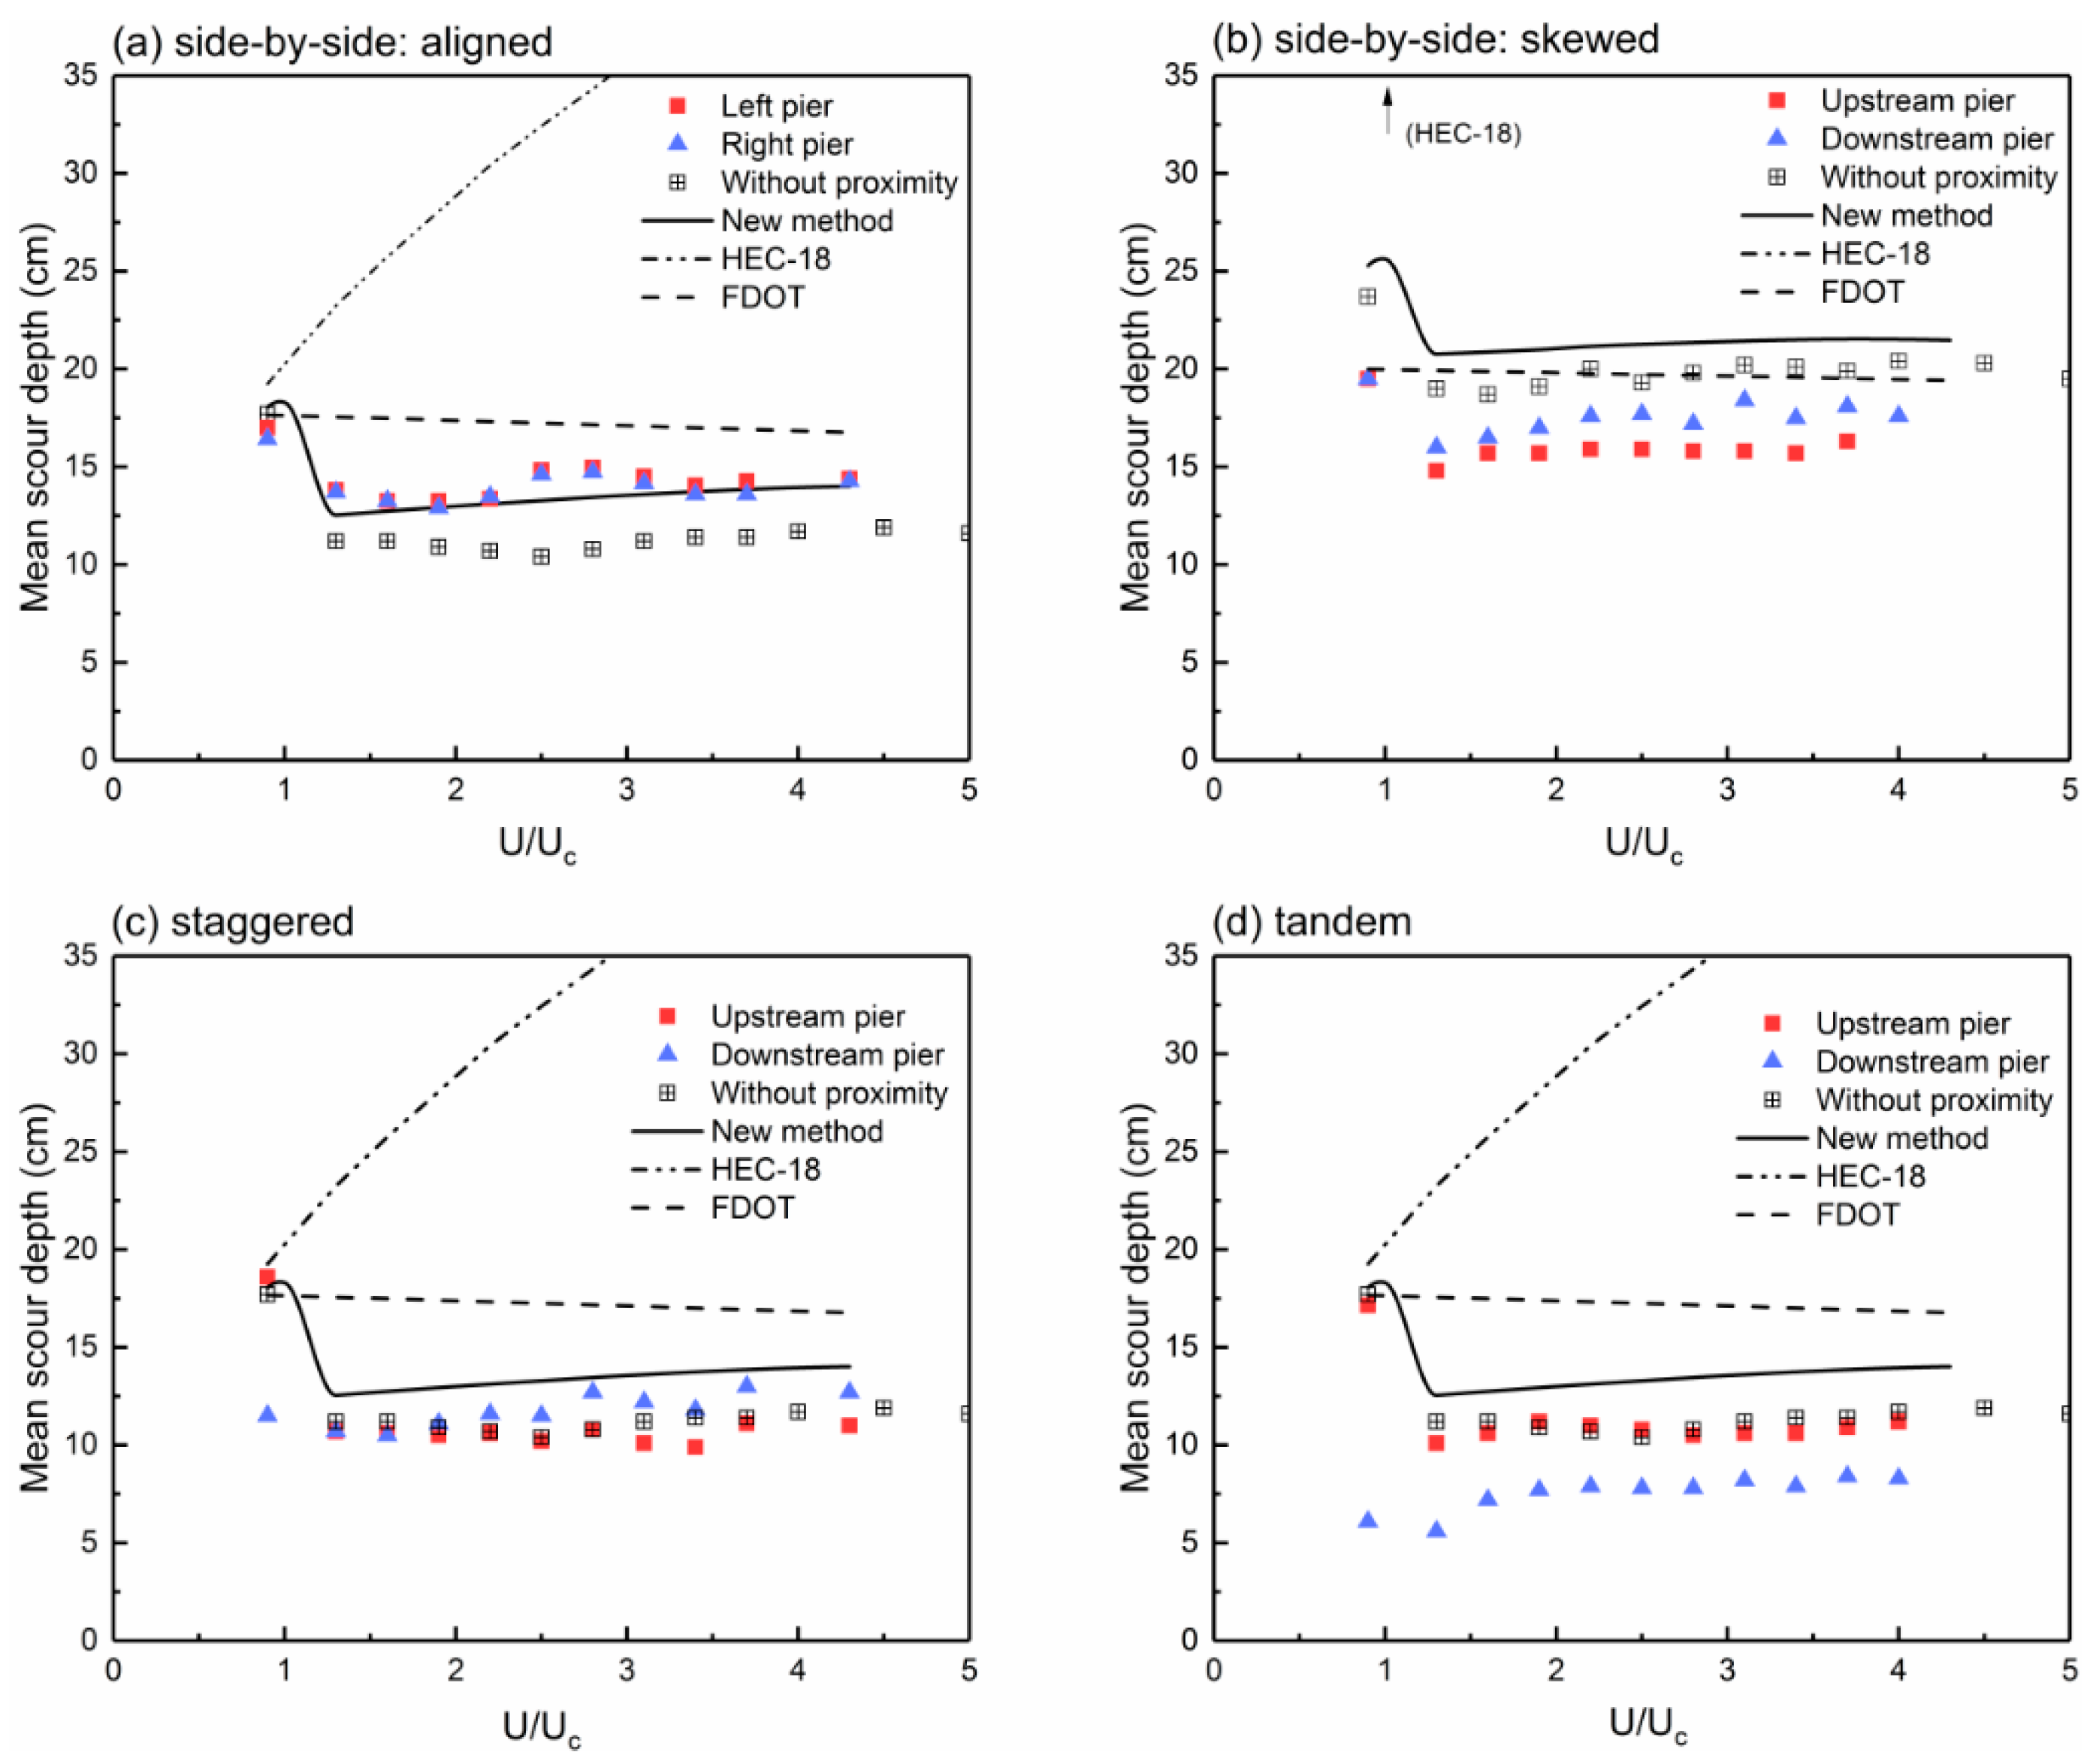
4.1. Mean Scour Depth at Complex Piers

A live-bed flow regime occurs when the mean flow velocity exceeds the threshold of sediment incipient motion. The general sediment motion on the bed surface leads to the formation of bed-forms and there is general transport of sediment downstream. Under a live-bed flow regime, the scouring process fluctuates due to the alternate arrival of the crests and troughs of the bed-forms and thus the instantaneous bed level data are time-averaged to obtain a mean scour depth. A dynamic equilibrium may be reached with mean scour depth constant over time. The equilibrium mean scour depth is dependent on the flow intensity ratio ( U / U c ) and may show a “descend-ascend” trend with increasing U / U c , as reported by Chee [34], Chiew [35], and Melville [36].
Figure 7 shows the mean scour depths as functions of flow intensity ratio U / U c at selected measuring locations, including the most scoured pile of each complex pier and the upstream, downstream, and middle sections of the space between piers. It should also be noted that the bed-forms observed in the present study were dunes or washed-out dunes (for large flow intensity) migrating towards downstream. Other bed-form patterns, including ripples and anti-dunes, were not observed due to the characteristics of non-ripple-forming coarse sand (usually with d 50 > 0.6-mm).
Figure 7a shows the scour variation of a side-by-side pier arrangement with aligned flow. The maximum scour depth at the two adjacent complex piers stays reasonably constant with increasing flow intensity, while the peak value at the transitional flat-bed stage ( U / U c = 4 ~ 5 ) is smaller than the peak at the clear-water threshold, which is in accord with the conclusions of Chee [34], Chiew [35], and Melville [36] for non-ripple-forming coarse sediment. The typical “descend-ascend” trend with flow intensity is absent for scour between the two piers, and the scour peak occurs for U / U c = 2 ~ 3 , when the approaching bed-form size is usually maximized. The location of maximum scour between the piers moves to the downstream section with flow intensity increasing above 3.5.
When there is a 30 ° skew angle between the piers and the flow direction, the mean live-bed scour depth at the downstream pier exceeds that at the upstream pier (Figure 7b). It is conjectured that the incoming sediment rapidly erodes away without further accumulation between the piers due to the strong wake vortices and the contracted flow. Thus, the scour at the inner side of the downstream pier (upstream pier flank) will be subjected to less influence of the approaching bed-forms, while, in contrast, a stronger filling effect exists at the outer side of the upstream pier. Furthermore, the “descend-ascend” trend is present for scour between the two piers, which indicates that, compared with Figure 7a, this scour more resembles that in a unified scour hole, i.e., the two scour holes have merged to form a single extensive scour hole.
The scour trend of the staggered pier arrangement is shown in Figure 7c. Under a clear-water flow regime, the scour at the downstream pier is significantly reduced by the lee effect and by the sediment supply from the upstream pier. However, the scour depth at the upstream pier drops sharply with increasing flow after entering the live-bed flow regime due to the approaching dunes, while, in contrast, the downstream pier is much less subjected to the influence of bed-forms with a live-bed peak larger than that at the clear-water threshold. The live-bed scour depths at the two piers are generally close but the downstream pier is slightly more scoured, which is in contrast to the trend with clear-water scour. A possible explanation is that with high flow intensity the lee protection of the upstream pier disappears while the diverted flow acting directly on the downstream pier with a certain skew angle actually strengthens the downstream scouring capacity. This is also in accordance with the observed diverted flow path behind the upstream pier. In addition, the attenuation effect of downstream vortex shedding becomes negligible due to the stronger flow.
In Figure 7d, the scour trend at the upstream pier in the tandem arrangement is similar to the staggered arrangement, which indicates that, for both arrangements, the upstream piers are not significantly affected by the downstream pier and still maintain the same scour features as a stand-alone pier. In contrast, the scour at the downstream pier is greatly attenuated. The downstream pier, as well as the measuring locations between the piers, suggest similar and uniform trends of slightly more scour with increased flow intensity and show a live-bed scour peak greater than that at the clear-water threshold. This feature is similar to the downstream pier in staggered arrangement and presumably tends to disappear with increasing distance between the two piers. Generally, for staggered or tandem arrangements with significant upstream/downstream distinction, the most hazardous scour overall may occur at the leading piles of the upstream pier under a clear-water flow regime.

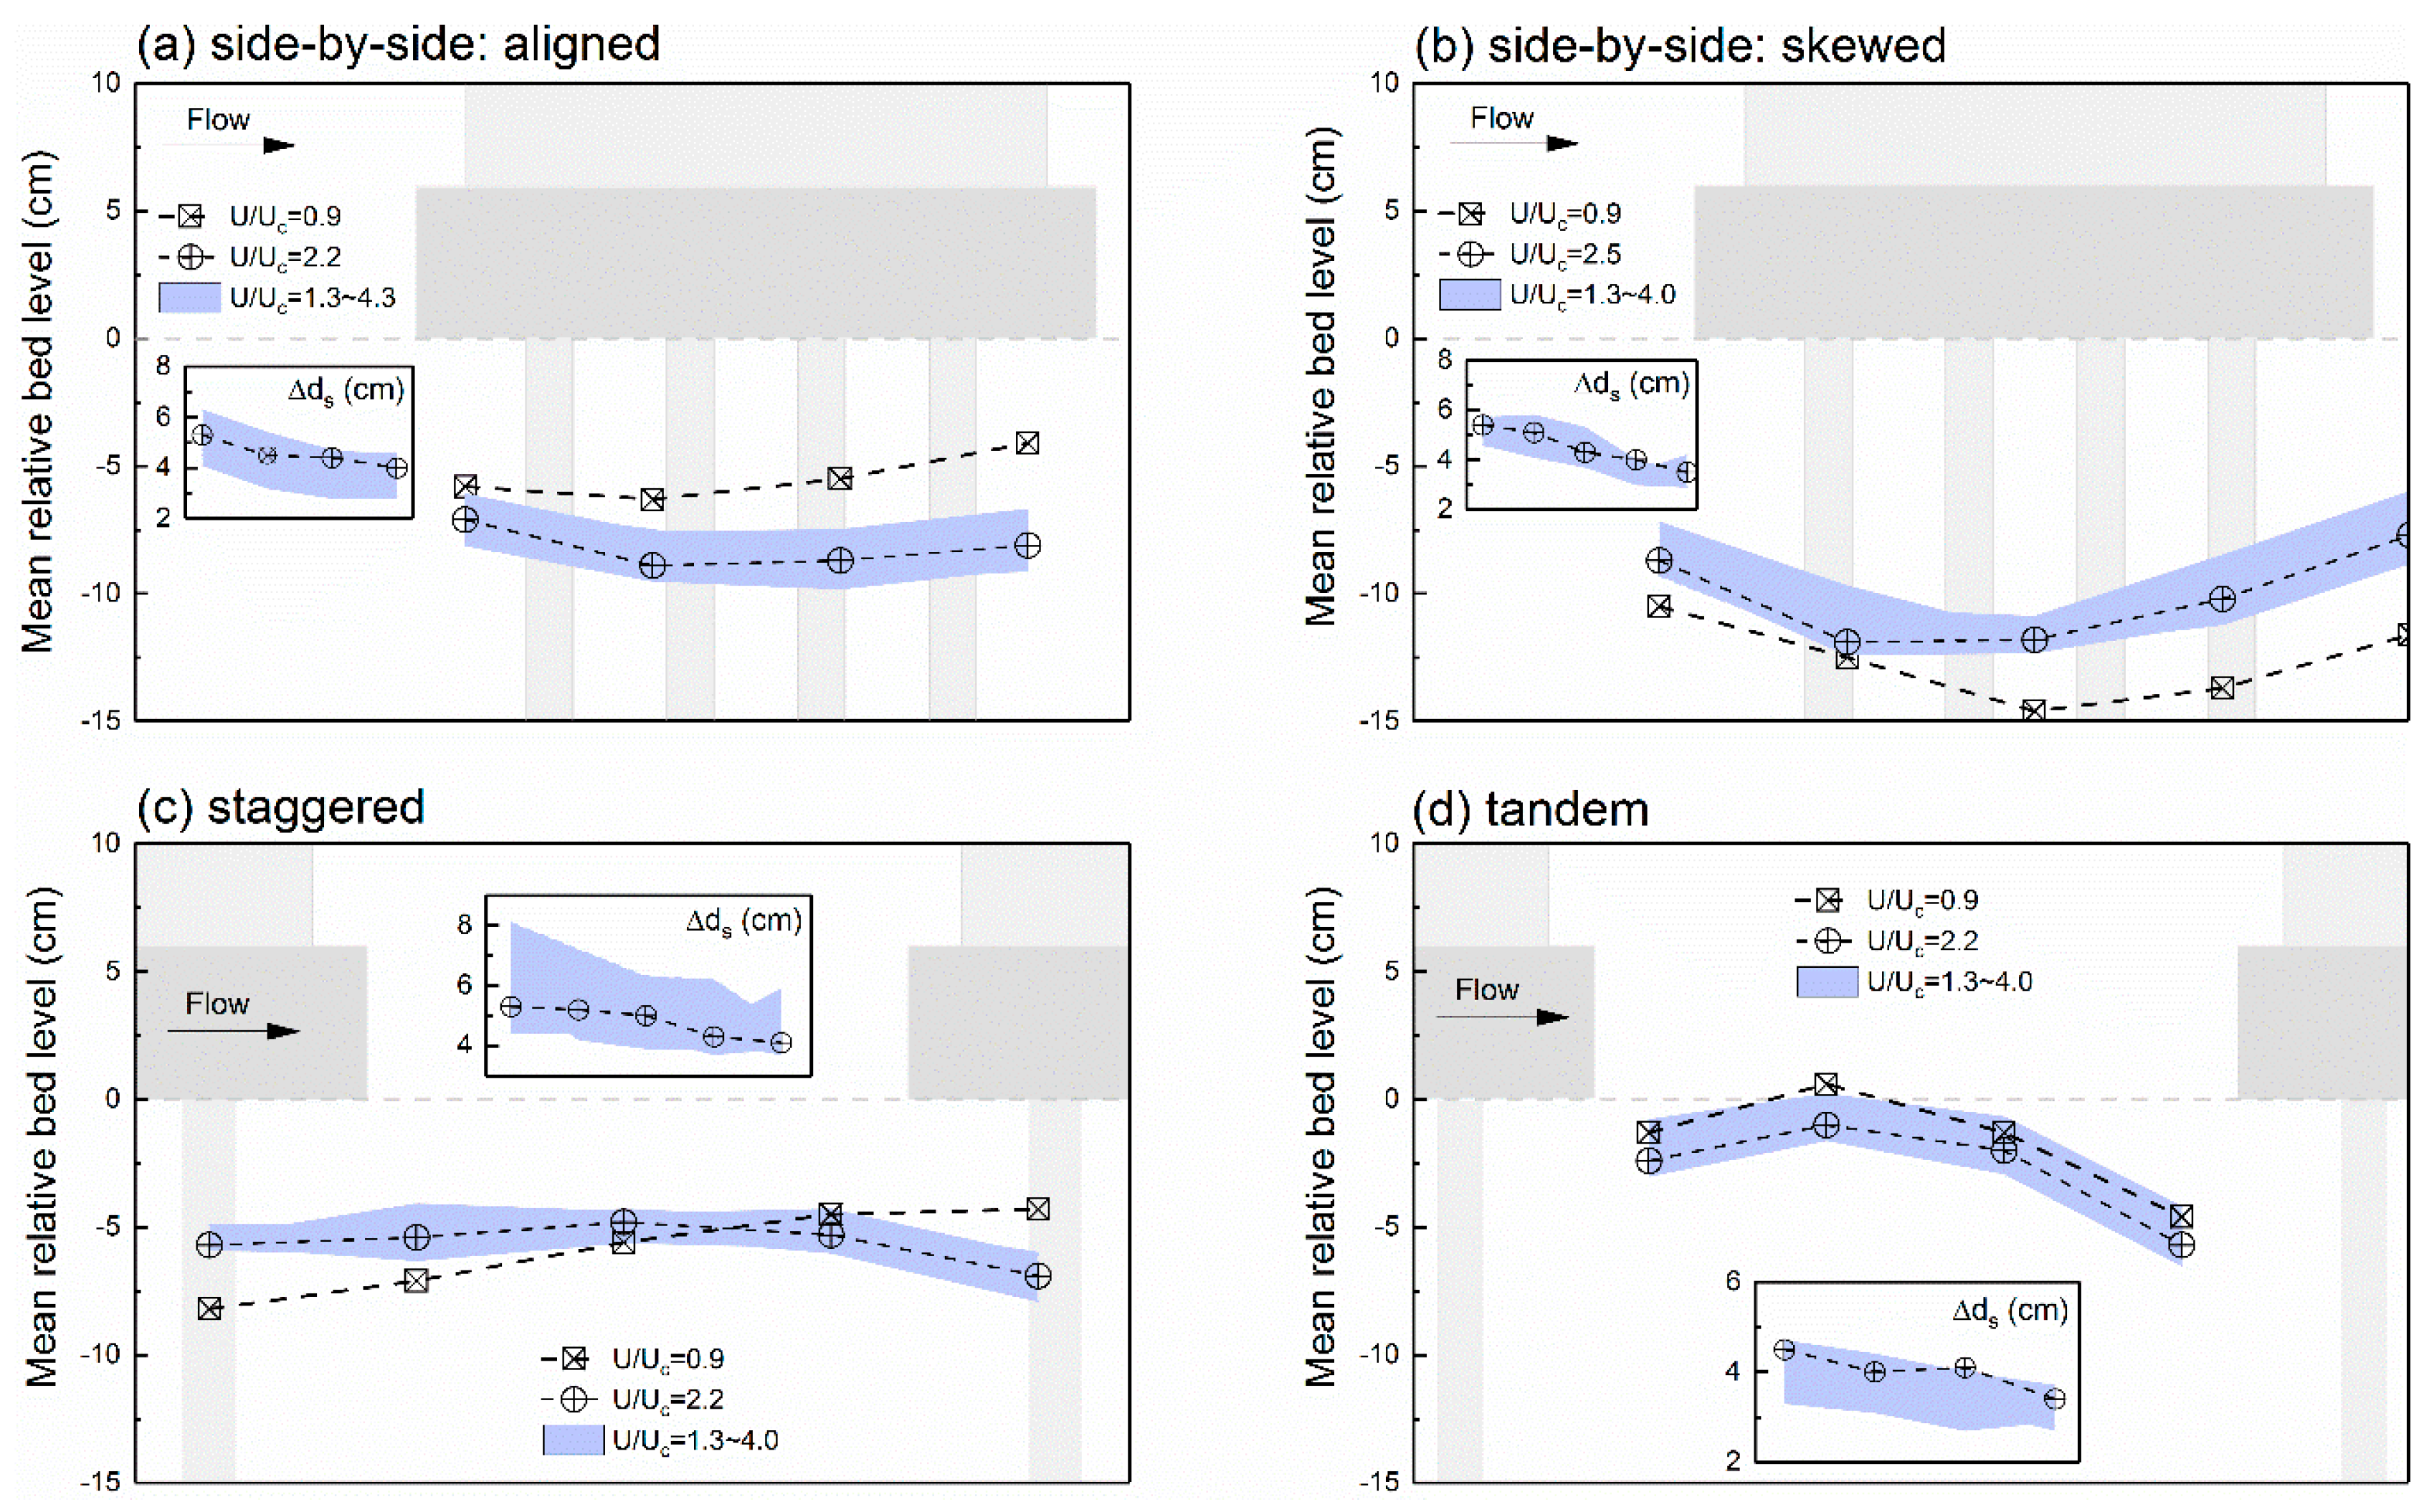
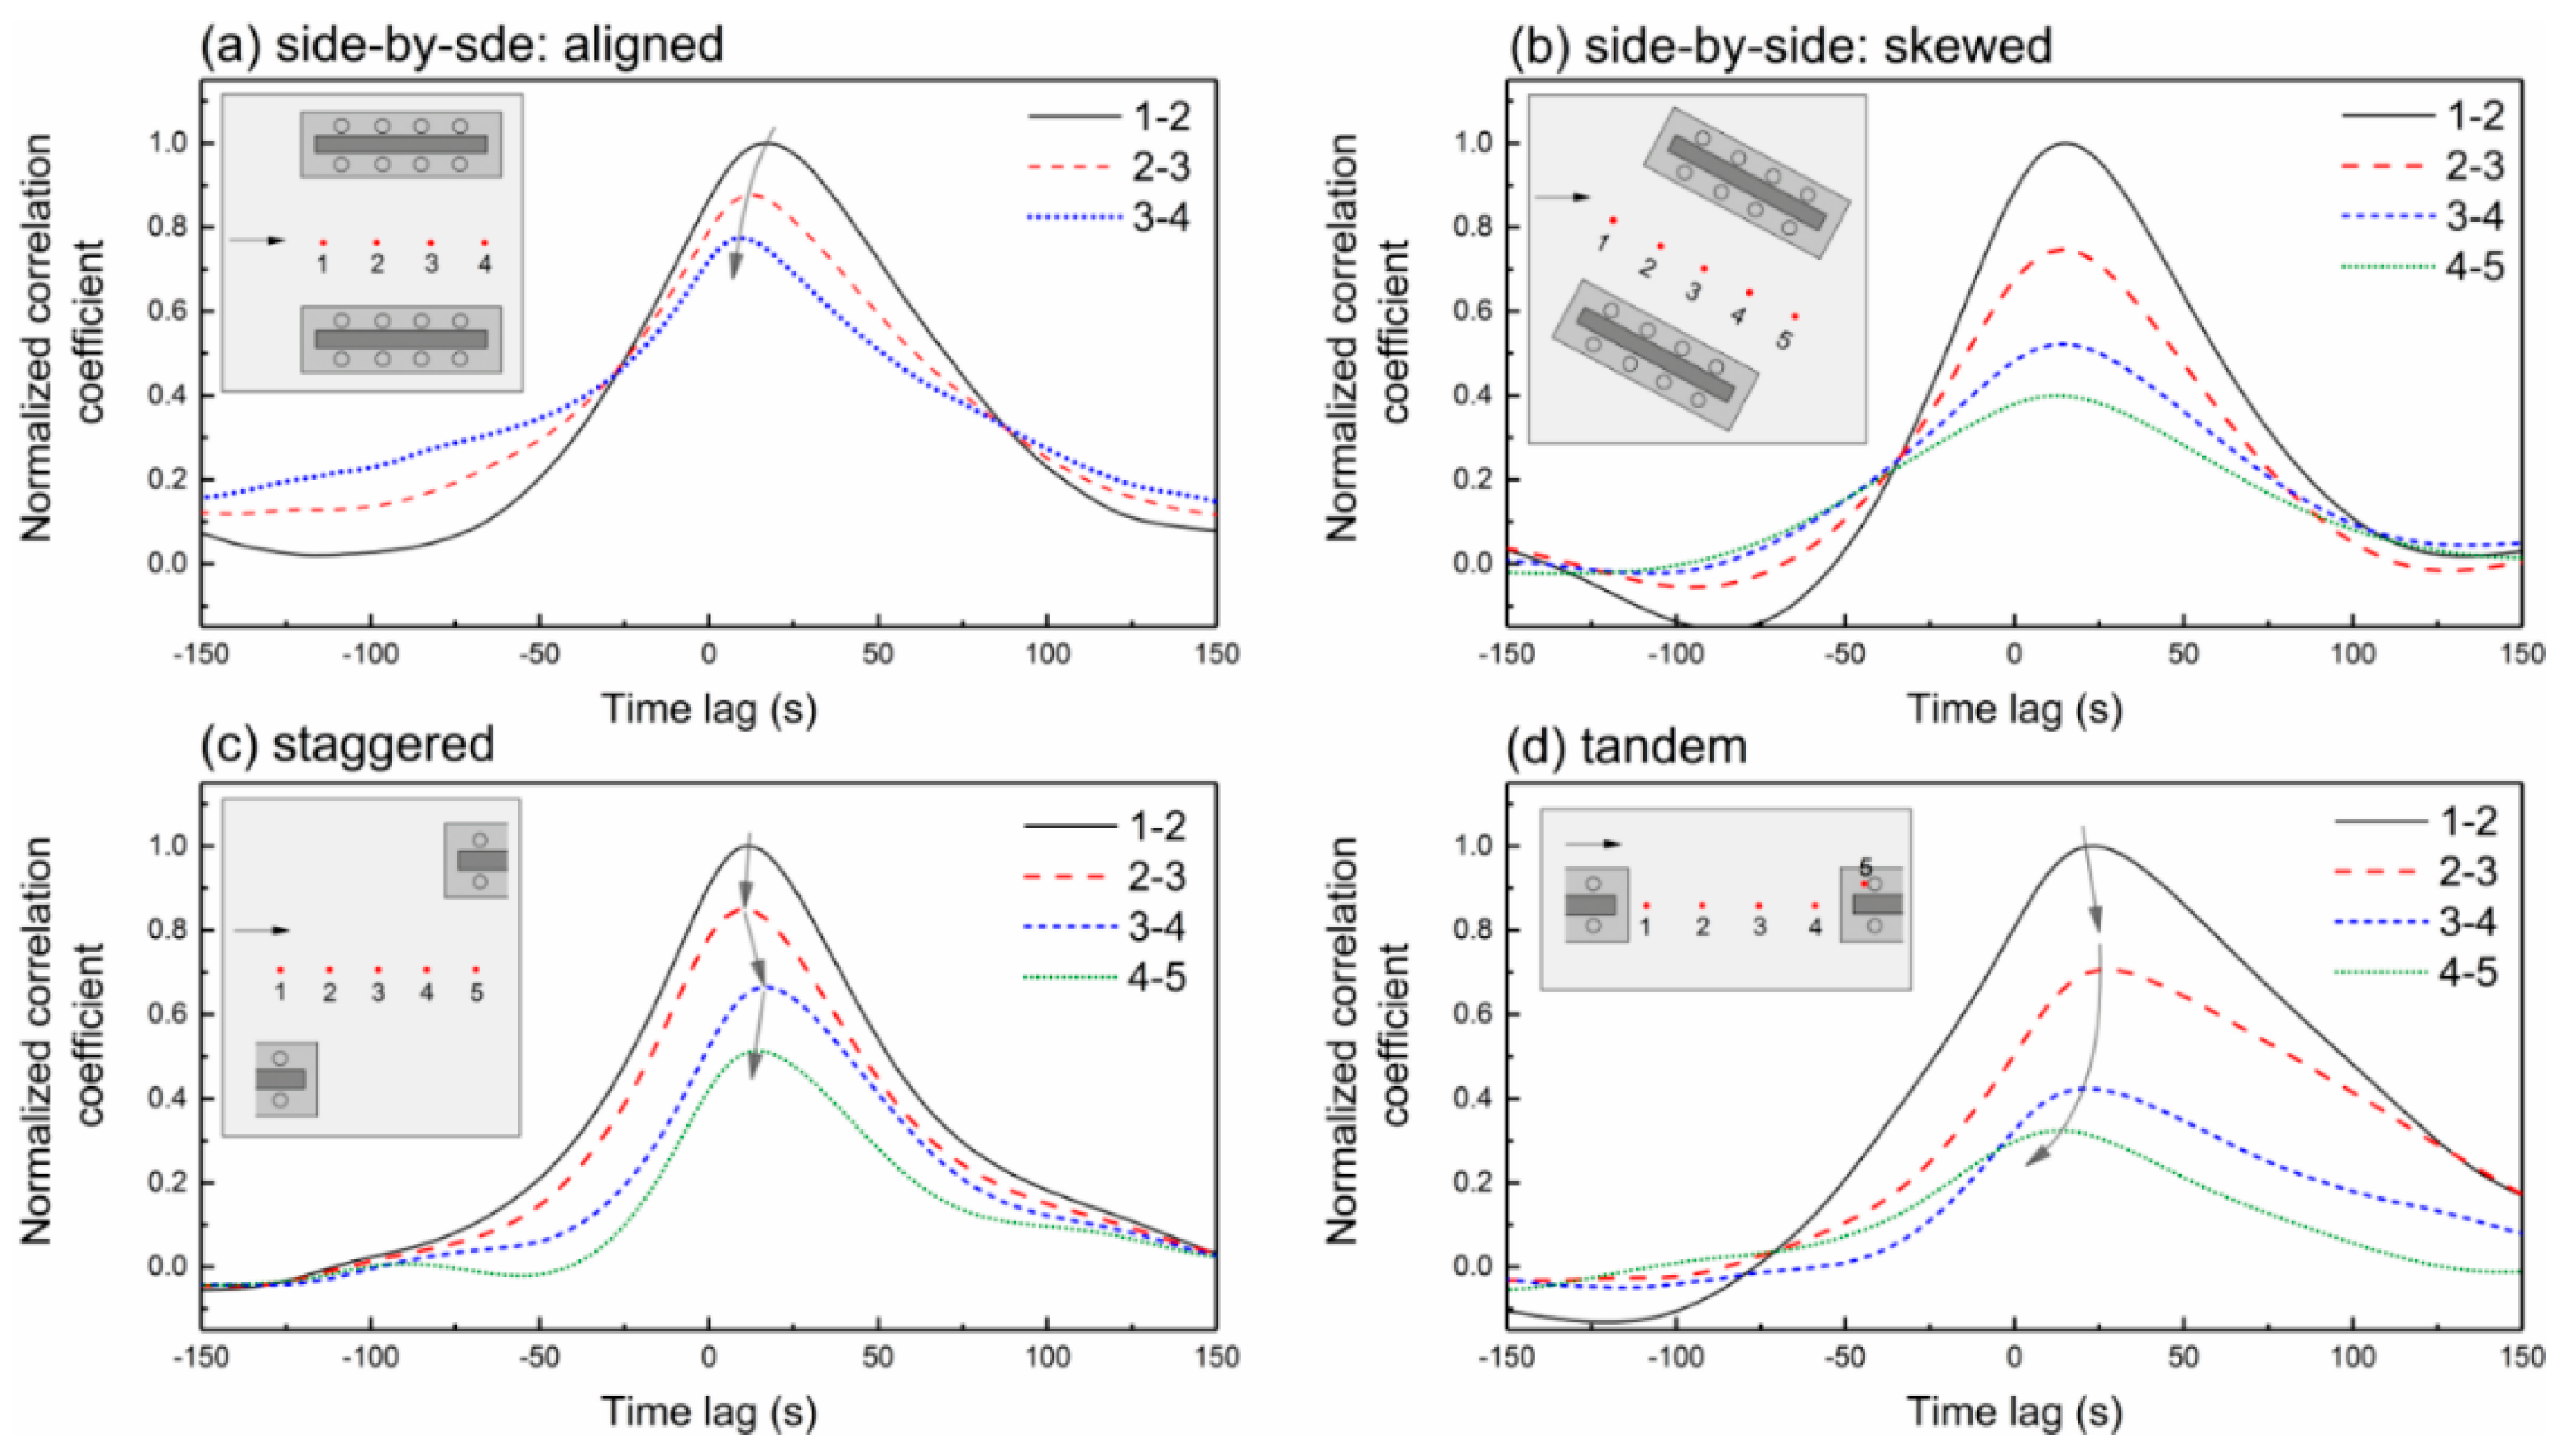
4.2. Bed-Form Migration between Adjacent Piers

Besides the live-bed scour at each complex pier, it is also important and useful to understand the scour pattern and the varying trend within the space between two bridges, where the altered hydrodynamic and morphological features may affect human activity or natural processes, e.g., debris drifting and accumulating, boating, etc. Figure 8 shows both the clear-water and live-bed scour features between two piers. The shaded areas represent the varying range of bed level under a live-bed flow regime, and the data with U U c = 2.2 are plotted specifically because the bed-form size is usually maximized at this flow intensity with a medium celerity, and thus the features are usually most typical. In addition, the mean magnitude of bed level fluctuation at each measuring location is also shown in the small embedded graphs within Figure 8.
In Figure 8a, for side-by-side arrangement with aligned approaching flow, the range of bed level between two piers under live-bed condition is always lower than that at the clear-water threshold and the most significant additional scour occurs at the downstream section.
An opposite relationship can be observed in Figure 8b when a 30° skew angle exists, where the scour depth at the clear-water threshold stays larger than live-bed scour for any flow intensity and the difference is also maximized at the downstream section. A feature shared by the side-by-side arrangements with or without pier skewness is that the maximum live-bed in-between scour between the piers tends to occur at the central measuring location.
In Figure 8c, for the staggered arrangement, the increased flow intensity, and the corresponding approaching bed-forms attenuate the scour at the upstream end (adjacent to the rear of the upstream pier) but, in contrast, aggravate the scour at the downstream end (adjacent to the face of the downstream pier). In accordance with the conjecture in the last section, this phenomenon is also the outcome of the weakened lee-wake protection to the downstream pier with large flow intensity.
In Figure 8d, the scour depths under clear-water and live-bed flow regimes are similar. Only very minor scour occurs between the piers except close to the face of the downstream pier as part of the natural profile of the downstream scour hole.
For all the pier arrangements in the present study, the mean magnitude of the bed level fluctuation between the piers always decreases from upstream to downstream, regardless of the varying trend of the mean bed level, as shown by all the embedded graphs in Figure 8. This indicates that the bed-forms are damped when migrating downstream between the two adjacent complex piers. This damping effect can be influenced by other factors besides the bed level profile. This effect is discussed further below.
Cross-correlation analysis is used to determine the level of similarity of two data series. With time series (such as instantaneous bed-level data in the present study) a time lag between two series can be identified by a cross-correlation analysis performed after displacing one series relative to the other. Guan et al. [37] used cross-correlation analysis to calculate the migrating celerity of bed-forms between two locations, which can be determined by dividing the known distance between the locations by the calculated time lag of the correlation peak. In the present study, correlation analysis has been performed on data from pairs of adjacent measuring locations between the piers. Data with U / U c = 2.2 (a typical value as mentioned above) are shown in Figure 9 and the trends with other flow intensity ratios are similar. In the figure, a higher correlation peak represents a greater similarity between the time series (i.e., less deformation of the bed-forms) and a smaller time lag represents a faster migrating celerity between the two adjacent measuring locations. The correlation coefficients are normalized by the largest peak value in each subplot.
In Figure 9a, for a side-by-side pier arrangement with aligned flow, bed-forms keep accelerating and are damped continuously when passing between the piers, although the bed level does not vary significantly as shown in Figure 8a. The acceleration is probably due to the flow contraction that is magnified with large flow intensity under a live-bed flow regime. In contrast, with a 30° skew angle (Figure 9b), bed-forms tend to pass between the piers with a constant celerity but are damped to a much greater extent than with the aligned arrangement. The enhanced damping effect can be attributed to the larger vertical (and also horizontal) extent of the scour hole, in which the approaching bed-forms may collapse and lose the original shape features. This is also in accord with the findings of our previous unpublished study on the relationship between mean scour fluctuation and scour depth.
In Figure 9c for the staggered pier arrangement, a process of repeated acceleration and deceleration can be observed. A possible explanation is that the migrating bed-forms firstly leave the region dominated by the upstream pier and then enter the region that is significantly affected by the downstream pier. The flow tends to be more contracted and accelerated in the region closer to either one of the piers and therefore the celerity of the migrating bed-forms also tends to behave in the same way.
For the tandem arrangement, as shown in Figure 9d, the bed-forms tend to decelerate behind the upstream pier due to the lee-wake protection and then accelerate after entering the downstream scour hole before collapsing to the bottom of the leading piles. Damping of the bedforms is marked.
Generally, the bed-forms tend to accelerate in contracted flow near the piers regardless of the pier arrangement, and deceleration may occur when the lee-wake protection effect prevails. Furthermore, the magnitude of the bed-forms will always be damped during migration downstream while being eroded by the turbulence in the scour hole, which is also in accord with the decreasing mean fluctuation magnitudes shown in Figure 8.

5. Discussion

Predicting scour depth at complex piers has always been a problem due to the difficulty of analyzing the complexity of flow field and pier geometry, as reviewed extensively by Ettema et al. [38]. As a result of the limitation of contemporary computing capability, numerical modelling has not been practical and efficient enough to provide reliable scour simulation. Thus, engineers still rely heavily on empirical or semi-empirical equations based on dimensional analysis to calculate the equilibrium scour depth at piers, although errors may be significant and modifications are usually needed for unusual conditions. To date, a few prediction methods have been well developed and widely adopted around the world for complex piers, including the Coleman method (Coleman [16]), the FDOT (Florida Department of Transportation) method (Sheppard and Renna [39]), HEC-18 method (Arneson et al. [40]), and the Sheppard-Melville (S-M) method (Sheppard et al. [41]). The S-M method is a meld of the equations of Sheppard and Miller [42] and Melville and Chiew [43]. Ettema et al. [38] has noted that the S-M method is more readily adapted than the other methods as further information becomes available. However, the S-M method was originally developed for single piers and does not deal with geometric complexity. Yang et al. [28] proposed a modification for clear-water scour at complex piers by replacing the pier diameter in the original S-M method with the equilibrium pier width calculated by other equations. Yang et al. [44] extended the modification mentioned above to the live-bed flow range. The newly extended method can be expressed as below.
When U / U c 1 :
d s e D e = 3.17 f 1 f 2 f 3
f 1 = t a n h [ ( y 0 D e ) 0.65 ]
f 2 = 1 1.2 [ l n ( U U c ) ] 2
f 3 =   D e / d 50 69.25 (   D e / d 50 ) 0.34 + 0.14 (   D e / d 50 ) 1.41
When 1 < U / U c U l p / U c :
d s e D e = f 1 { 2.3 [ 1 ( U U c U l p U c U l p U c 1 ) ] 1.1 + 3.17 f 3 ( U U c U l p U c U l p U c 1 ) 1.1 }
When U / U c > U l p / U c :
d s e D e = 2.3 f 1
U l p = m a x { 5 U c , 0.6 g y 0 }
Specifically, Ulp represents the flow velocity where the bed-forms are washed out, i.e., the transitional flat-bed stage. The equivalent pier width D e is calculated by the method of Coleman [16] for aligned complex piers and that of Sheppard and Renna [38] for skewed complex piers.
The performance of Equations (1)–(7) is compared with the HEC-18 and FDOT methods in Figure 10. Supplementary experiments were also performed to investigate the scour at stand-alone piers and the results are included in the figure for comparison. In Figure 10a, for the side-by-side arrangement with aligned flow the live-bed scour is aggravated by the proximity of another pier, while no significant difference exists under the clear-water flow regime. In contrast, in Figure 10b with a 30° skew angle, the scour depths at both the piers are reduced by the presence of another pier, although the horizontal extent of the merged scour hole is typically somewhat larger than the hole produced by any individual complex pier. It is counter-intuitive that a larger flow blockage usually leads to greater scour depth. A possible explanation is that the presence of a downstream pier causes a greater flow separation that starts from a longer distance upstream of the pier site, then the attacking angle of the flow is actually reduced due to enhanced flow diversion. More analysis, both physical and numerical, is needed to better describe the mechanism of scour attenuation in similar situations.
For staggered and tandem pier arrangements, in Figure 10c,d, the upstream pier is not significantly affected by the downstream pier. The modified and extended S-M method then provides an adequate but not excessive safety margin even if the scour depth is aggravated due to an adjacent pier, and the natural “descend-ascend” trend with increasing flow velocity in the live-bed regime can also be captured with good accuracy. In contrast, although the FDOT method and the HEC-18 method show fair accuracy for clear-water scour, they both tend to over-simplify the scour trend under the live-bed flow regime and may lead to significant errors. The HEC-18 method uses Froude number (rather than U / U c as used in other popular methods) to account for the influence of flow velocity and this may be the reason for the excessive overestimation that can be observed in Figure 10. Therefore, it is suggested, for engineers and researchers, to use the modified and extended S-M method expressed by Equations (1)–(7) to predict the scour depth at the upstream pier when aligned to the approaching flow. Attention should also be paid to special conditions that may lead to scour aggravation due to the skew angle as shown in Figure 10a. In the meantime, the information provided in Figure 8 can be used to evaluate the regional bed topography, the potential location for severe scour damage, or bed level stability during bed-form migration.
It should be noted that the scour pattern at bridge sites can also be significantly influenced by other artificial structures or natural topography, e.g., weirs, sluice gates or shoals, which may even be far enough away to be neglected in error sometimes. Wang et al. [45] studies the scour aggravation caused by an adjacent submerged weir set downstream of the pier under live-bed conditions. The scour pattern for a staggered or tandem pier arrangement will be more prone to be affected by the downstream weir. In addition, the existence of the weir leads to upstream bed aggradation and consequently changes the relative pile-cap elevation to the original bed level. The relative pile-cap elevation has been considered as a key factor affecting the scour development and equilibrium scour depth at complex piers (Coleman [16]; Ataie-Ashtiani et al. [18]; Moreno et al. [22]; Yang et al. [28]). Similar effects can also be caused by general bed degradation that usually occurs downstream of sluice gates. Furthermore, natural topography, e.g., shoals, bends, and sand bars, may cause oblique flow that much complicate the scenario for scour depth analysis.
Generally, the analysis of scour at complex bridge piers is complicated. A reliable prediction can be obtained only when the influence of pier proximity is accurately integrated with the influences of many other factors that are not addressed by this paper. The current study is still limited and only investigates the general scour pattern with typical pier arrangements and a fixed pile-cap elevation. More research needs in the future include testing extensively the influence of pier complexity, sediment type, gradation, large flow blockage due to consecutive piers, and unconventional pier arrangements, which may help creating an updated scour prediction framework that is not discussed by the current study.

6. Conclusions

The present study investigates the clear-water and live-bed scour characteristics at complex bridge piers in close proximity to each other with four different pier arrangements: side-by-side arrangement with aligned flow, side-by-side arrangement with 30° skew angle, a staggered arrangement, and a tandem arrangement. The main conclusions drawn from the paper include:
  • The pier arrangement has a significant effect on the temporal evolution of scour at individual vertical piles of each pier and also in between the two piers. Compared with the side-by-side pier arrangement with aligned flow, a flow skew angle leads to more rapid but asymmetric scour development. The extended scour holes merge between the piers and aggravate the scour development in this region. The staggered and tandem pier arrangements provide significant protection to the downstream pier by reducing the scour rate at the downstream scour hole and facilitating the filling process there.
  • The equilibrium clear-water scour pattern is also heavily dependent on the pier arrangement. For side-by-side, staggered. and tandem arrangements with aligned flow, the scour patterns at the upstream piers (or either one of the piers for side-by-side scheme) are similar to that at a stand-alone complex pier under the same conditions. The upstream-to-downstream protection effect is maximized for a tandem arrangement because the downstream pier is entirely in the lee-wake zone, and meanwhile the flow blockage is also the minimum.
  • With live-bed flow, the original scour patterns for all the pier arrangements under clear-water conditions may be altered significantly. The live-bed scour depths for side-by-side arrangements are much larger than the others due to the enhanced flow contraction between the two piers with large flow intensity. For staggered and tandem arrangements, the mean scour depth at the upstream pier drops markedly after entering the live-bed range. In contrast, at the downstream piers that are well protected under clear-water flow regime, the live-bed scour may significantly exceed the clear-water scour and even exceed scour at the upstream pier. It is conjectured that the lee-wake protection disappears with more intense flow and general sediment transport.
  • Under a live-bed flow regime, bed-forms migrate downstream via the bridge opening and are damped continuously. Thus, the bed profile and the morphological response at the erodible bed between the two piers are different to those under clear-water conditions. The relationship of the difference between the clear-water and live-bed scour depths also varies for different pier arrangements. Between two piers the mean bed level fluctuation decreases continuously with distance downstream, regardless of the bed profile. The flow near either one of the piers is diverted and accelerated, thereby increasing the bed-form celerity.
  • Compared with a single complex pier, the live-bed scour at side-by-side piers with aligned flow is greater. On the contrary, with a 30° flow skew angle, live-bed scour at both the adjacent piers is less than a stand-alone pier. For both the staggered and tandem arrangements, scour at the upstream pier is barely affected by the downstream pier. The modified and extended Sheppard-Melville method provides an adequate safety margin for most of the scenarios, while attention should still be paid to the side-by-side piers with aligned flow, for which there is a risk with high flow intensity of higher scour than the method predicts.
  • Due to the complexity of predicting scour depth at complex piers, the conclusions drawn in the present study should be integrated with other factors that may also influence the scour pattern, e.g., the proximity to other artificial structures or natural topography, general bed level variation and channel bends.

Author Contributions

Conceptualization, Y.Y. and B.W.M.; Formal analysis, Y.Y. and G.H.M.; Investigation, Y.Y.; Methodology, Y.Y.; Supervision, B.W.M.; Validation, Y.Y.; Visualization, Y.Y.; Writing–original draft, Y.Y.; Writing–review & editing, Y.Y., B.W.M., G.H.M., and A.Y.S.

Funding

This research was funded by China Scholarship Council (CSC).

Acknowledgments

The authors would like to thank the technical support provided by the Fluid Mechanics Laboratory of The University of Auckland as well as the staff, including Geoffrey Kirby, Dan Fray, and Oane Galama. In particular, the first author would like to thank Yu Huang for her precious help during the past years.

Conflicts of Interest

The authors declare no conflict of interest.

References

  1. Melville, B.W.; Coleman, S.E. Bridge Scour; Water Resources Publications: Highlands Ranch, CO, USA, 2000. [Google Scholar]
  2. Hannah, C. Scour at Pile Groups. Master’s Thesis, University of Canterbury, Christchurch, New Zealand, 1978. [Google Scholar]
  3. Elliott, K.R.; Baker, C.J. Effect of pier spacing on scour around bridge piers. J. Hydraul. Eng. 1985, 111, 1105–1109. [Google Scholar] [CrossRef]
  4. Zhao, G.; Sheppard, D.M. The effect of flow skew angle on sediment scour near pile groups. In Proceedings of the Stream Stability and Scour at Highway Bridges, Compilation of Conference Papers; American Society of Civil Engineers (ASCE): Reston, VA, USA, 1999; pp. 377–391. [Google Scholar]
  5. Sumner, D.; Price, S.J.; Paidoussis, M.P. Flow-pattern identification for two staggered circular cylinders in cross-flow. J. Fluid Mech. 2000, 411, 263–303. [Google Scholar] [CrossRef] [Green Version]
  6. Sumer, B.M.; Fredsøe, J.; Bundgaard, K. Global and local scour at pile groups. In Proceedings of the Fifteenth International Offshore and Polar Engineering Conference, Seoul, Korea, 19–24 June 2005. [Google Scholar]
  7. Ataie-Ashtiani, B.; Beheshti, A.A. Experimental investigation of clear-water local scour at pile groups. J. Hydraul. Eng. 2006, 132, 1100–1104. [Google Scholar] [CrossRef]
  8. Amini, A.; Melville, B.W.; Ali, T.M.; Ghazali, A.H. Clear-water local scour around pile groups in shallow-water flow. J. Hydraul. Eng. 2011, 138, 177–185. [Google Scholar] [CrossRef]
  9. Liang, D.; Gotoh, H.; Scott, N.; Tang, H. Experimental study of local scour around twin piles in oscillatory flows. J. Waterw. Port Coast. Ocean Eng. 2012, 139, 404–412. [Google Scholar] [CrossRef]
  10. Lança, R.; Fael, C.; Maia, R.; Pêgo, J.P.; Cardoso, A.H. Clear-water scour at pile groups. J. Hydraul. Eng. 2013, 139, 1089–1098. [Google Scholar] [CrossRef]
  11. Das, S.; Mazumdar, A. Turbulence flow field around two eccentric circular piers in scour hole. Int. J. River Basin Manag. 2015, 13, 343–361. [Google Scholar] [CrossRef]
  12. Wang, H.; Tang, H.; Liu, Q.; Wang, Y. Local scouring around twin bridge piers in open-channel flows. J. Hydraul. Eng. 2016, 142, 06016008. [Google Scholar] [CrossRef]
  13. Khaple, S.; Hanmaiahgari, P.R.; Gaudio, R.; Dey, S. Interference of an upstream pier on local scour at downstream piers. Acta Geophys. 2017, 65, 29–46. [Google Scholar] [CrossRef]
  14. Kim, H.S.; Roh, M.; Nabi, M. Computational Modeling of Flow and Scour around Two Cylinders in Staggered Array. Water 2017, 9, 654. [Google Scholar] [CrossRef]
  15. Jones, J.S.; Sheppard, D.M. Local scour at complex pier geometries. In Proceedings of the Building Partnerships—2000 Joint Conference on Water Resource Engineering and Water Resources Planning and Management, American Society of Civil Engineers (ASCE), Minneapolis, MN, USA, 30 July–2 August 2000. [Google Scholar]
  16. Coleman, S.E. Clearwater local scour at complex piers. J. Hydraul. Eng. 2005, 131, 330–334. [Google Scholar] [CrossRef]
  17. Sheppard, D.M.; Glasser, T. Local scour at bridge piers with complex geometries. In Contemporary Topics in Situ Testing, Analysis, and Reliability of Foundations; International Foundation Congress and Equipment Expo; American Society of Civil Engineers (ASCE): Orlando, FL, USA, 2009; pp. 506–513. [Google Scholar]
  18. Ataie-Ashtiani, B.; Baratian-Ghorghi, Z.; Beheshti, A.A. Experimental investigation of clear-water local scour of compound piers. J. Hydraul. Eng. 2010, 136, 343–351. [Google Scholar] [CrossRef]
  19. Grimaldi, C.; Cardoso, A.H. Methods for local scour depth estimation at complex bridge piers. In Proceedings of the 1st IAHR European Division Congress, Heriot-Watt University, Edinburgh, UK, 4–6 May 2010. [Google Scholar]
  20. Beheshti, A.A.; Ataie-Ashtiani, B. Experimental study of three-dimensional flow field around a complex bridge pier. J. Eng. Mech. 2010, 136, 143–154. [Google Scholar] [CrossRef]
  21. Beheshti, A.; Ataie-Ashtiani, B. Scour hole influence on turbulent flow field around complex bridge pier. Flow Turbul. Combust. 2016, 97, 451–474. [Google Scholar] [CrossRef]
  22. Moreno, M.; Maia, R.; Couto, L. Effects of relative column width and pile-cap elevation on local scour depth around complex piers. J. Hydraul. Eng. 2015, 142, 04015051. [Google Scholar] [CrossRef]
  23. Moreno, M.; Maia, R.; Couto, L. Prediction of equilibrium local scour depth at complex bridge piers. J. Hydraul. Eng. 2016, 142, 04016045. [Google Scholar] [CrossRef]
  24. Moreno, M.; Maia, R.; Couto, L.; Cardoso, A. Subtraction approach to experimentally assess the contribution of the complex pier components to the local scour depth. J. Hydraul. Eng. 2016, 143, 06016030. [Google Scholar] [CrossRef]
  25. Ferraro, D.; Tafarojnoruz, A.; Gaudio, R.; Cardoso, A.H. Effects of pile cap thickness on the maximum scour depth at a complex pier. J. Hydraul. Eng. 2013, 139, 482–491. [Google Scholar] [CrossRef]
  26. Amini, A.; Melville, B.W.; Ali, T.M. Local scour at piled bridge piers including an examination of the superposition method. Can. J. Civ. Eng. 2014, 41, 461–471. [Google Scholar] [CrossRef]
  27. Baghbadorani, D.A.; Ataie-Ashtiani, B.; Beheshti, A.; Hadjzaman, M.; Jamali, M. Prediction of current-induced local scour around complex piers: Review, revisit, and integration. Coast. Eng. 2018, 133, 43–58. [Google Scholar] [CrossRef]
  28. Yang, Y.; Melville, B.W.; Sheppard, D.M.; Shamseldin, A.Y. Clear-water local scour at skewed complex bridge piers. J. Hydraul. Eng. 2018, 144, 04108019. [Google Scholar] [CrossRef]
  29. Oben-Nyarko, K.; Ettema, R. Pier and abutment scour interaction. J. Hydraul. Eng. 2011, 137, 1598–1605. [Google Scholar] [CrossRef]
  30. Sturm, T.; Abid, I.; Melville, B.; Xiong, X.; Stoesser, T.; Bugallo, B.F.; Hong, S. Combining Individual Scour Components to Determine Total Scour; National Cooperative Highway Research Program Reports; Transportation Research Board: Washington, DC, USA, 2017; pp. 24–37. [Google Scholar]
  31. Sturm, T.W.; Ettema, R.; Melville, B.W. Evaluation of Bridge-Scour Research: Abutment and Contraction Scour Processes and Prediction; National Cooperative Highway Research Program Reports; Transportation Research Board: Washington, DC, USA, 2011; pp. 24–27. [Google Scholar]
  32. SeaTek Instrumentation. Available online: www.seatek.com (accessed on 23 July 2019).
  33. Melville, B.W.; Hadfield, A.C. Use of sacrificial piles as pier scour countermeasures. J. Hydraul. Eng. 1999, 125, 1221–1224. [Google Scholar] [CrossRef]
  34. Chee, R.K.W. Live-bed Scour at Bridge Piers. Master’s Thesis, University of Auckland, Auckland, New Zealand, 1982. [Google Scholar]
  35. Chiew, Y.M. Local scour at bridge piers. Ph.D. Thesis, University of Auckland, Auckland, New Zealand, 1984. [Google Scholar]
  36. Melville, B.W. Live-bed scour at bridge piers. J. Hydraul. Eng. 1984, 110, 1234–1247. [Google Scholar] [CrossRef]
  37. Guan, D.; Melville, B.W.; Friedrich, H. Live-bed scour at submerged weirs. J. Hydraul. Eng. 2015, 141, 04014071. [Google Scholar] [CrossRef]
  38. Ettema, R.; Constantinescu, G.; Melville, B. Flow-Field Complexity and Design Estimation of Pier-Scour Depth: Sixty Years since Laursen and Toch. J. Hydraul. Eng. 2017, 143, 03117006. [Google Scholar] [CrossRef]
  39. Sheppard, D.M.; Renna, R. Bridge Scour Manual; Florida Department of Transportation: Tallahassee, FL, USA, 2010.
  40. Arneson, L.A.; Zevenbergen, L.W.; Lagasse, P.F.; Clopper, P.E. Evaluating Scour at Bridges, 5th ed.; FHWA-HIF-12-003, Hydraulic Engineering Circular No. 18 (HEC-18); Federal Highway Administration: Washington, DC, USA, 2012.
  41. Sheppard, D.M.; Demir, H.; Melville, B. Scour at Wide Piers and Long Skewed Piers; National Cooperative Highway Research Program Reports 682; Transportation Research Board: Washington, DC, USA, 2011. [Google Scholar]
  42. Sheppard, D.M.; Miller, W. Live-bed local pier scour experiments. J. Hydraul. Eng. 2006, 132, 635–642. [Google Scholar] [CrossRef]
  43. Melville, B.W.; Chiew, Y.M. Time scale for local scour at bridge piers. J. Hydraul. Eng. 1999, 125, 59–65. [Google Scholar] [CrossRef]
  44. Yang, Y.; Melville, B.W.; Macky, G.H.; Shamseldin, A.Y. Experimental study on live-bed scour at complex bridge pier with bed-form migration. J. Hydraul. Res. manuscript submitted and under review.
  45. Wang, L.; Melville, B.W.; Guan, D. Effects of upstream weir slope on local scour at submerged weirs. J. Hydraul. Eng. 2018, 144, 04018002. [Google Scholar] [CrossRef]
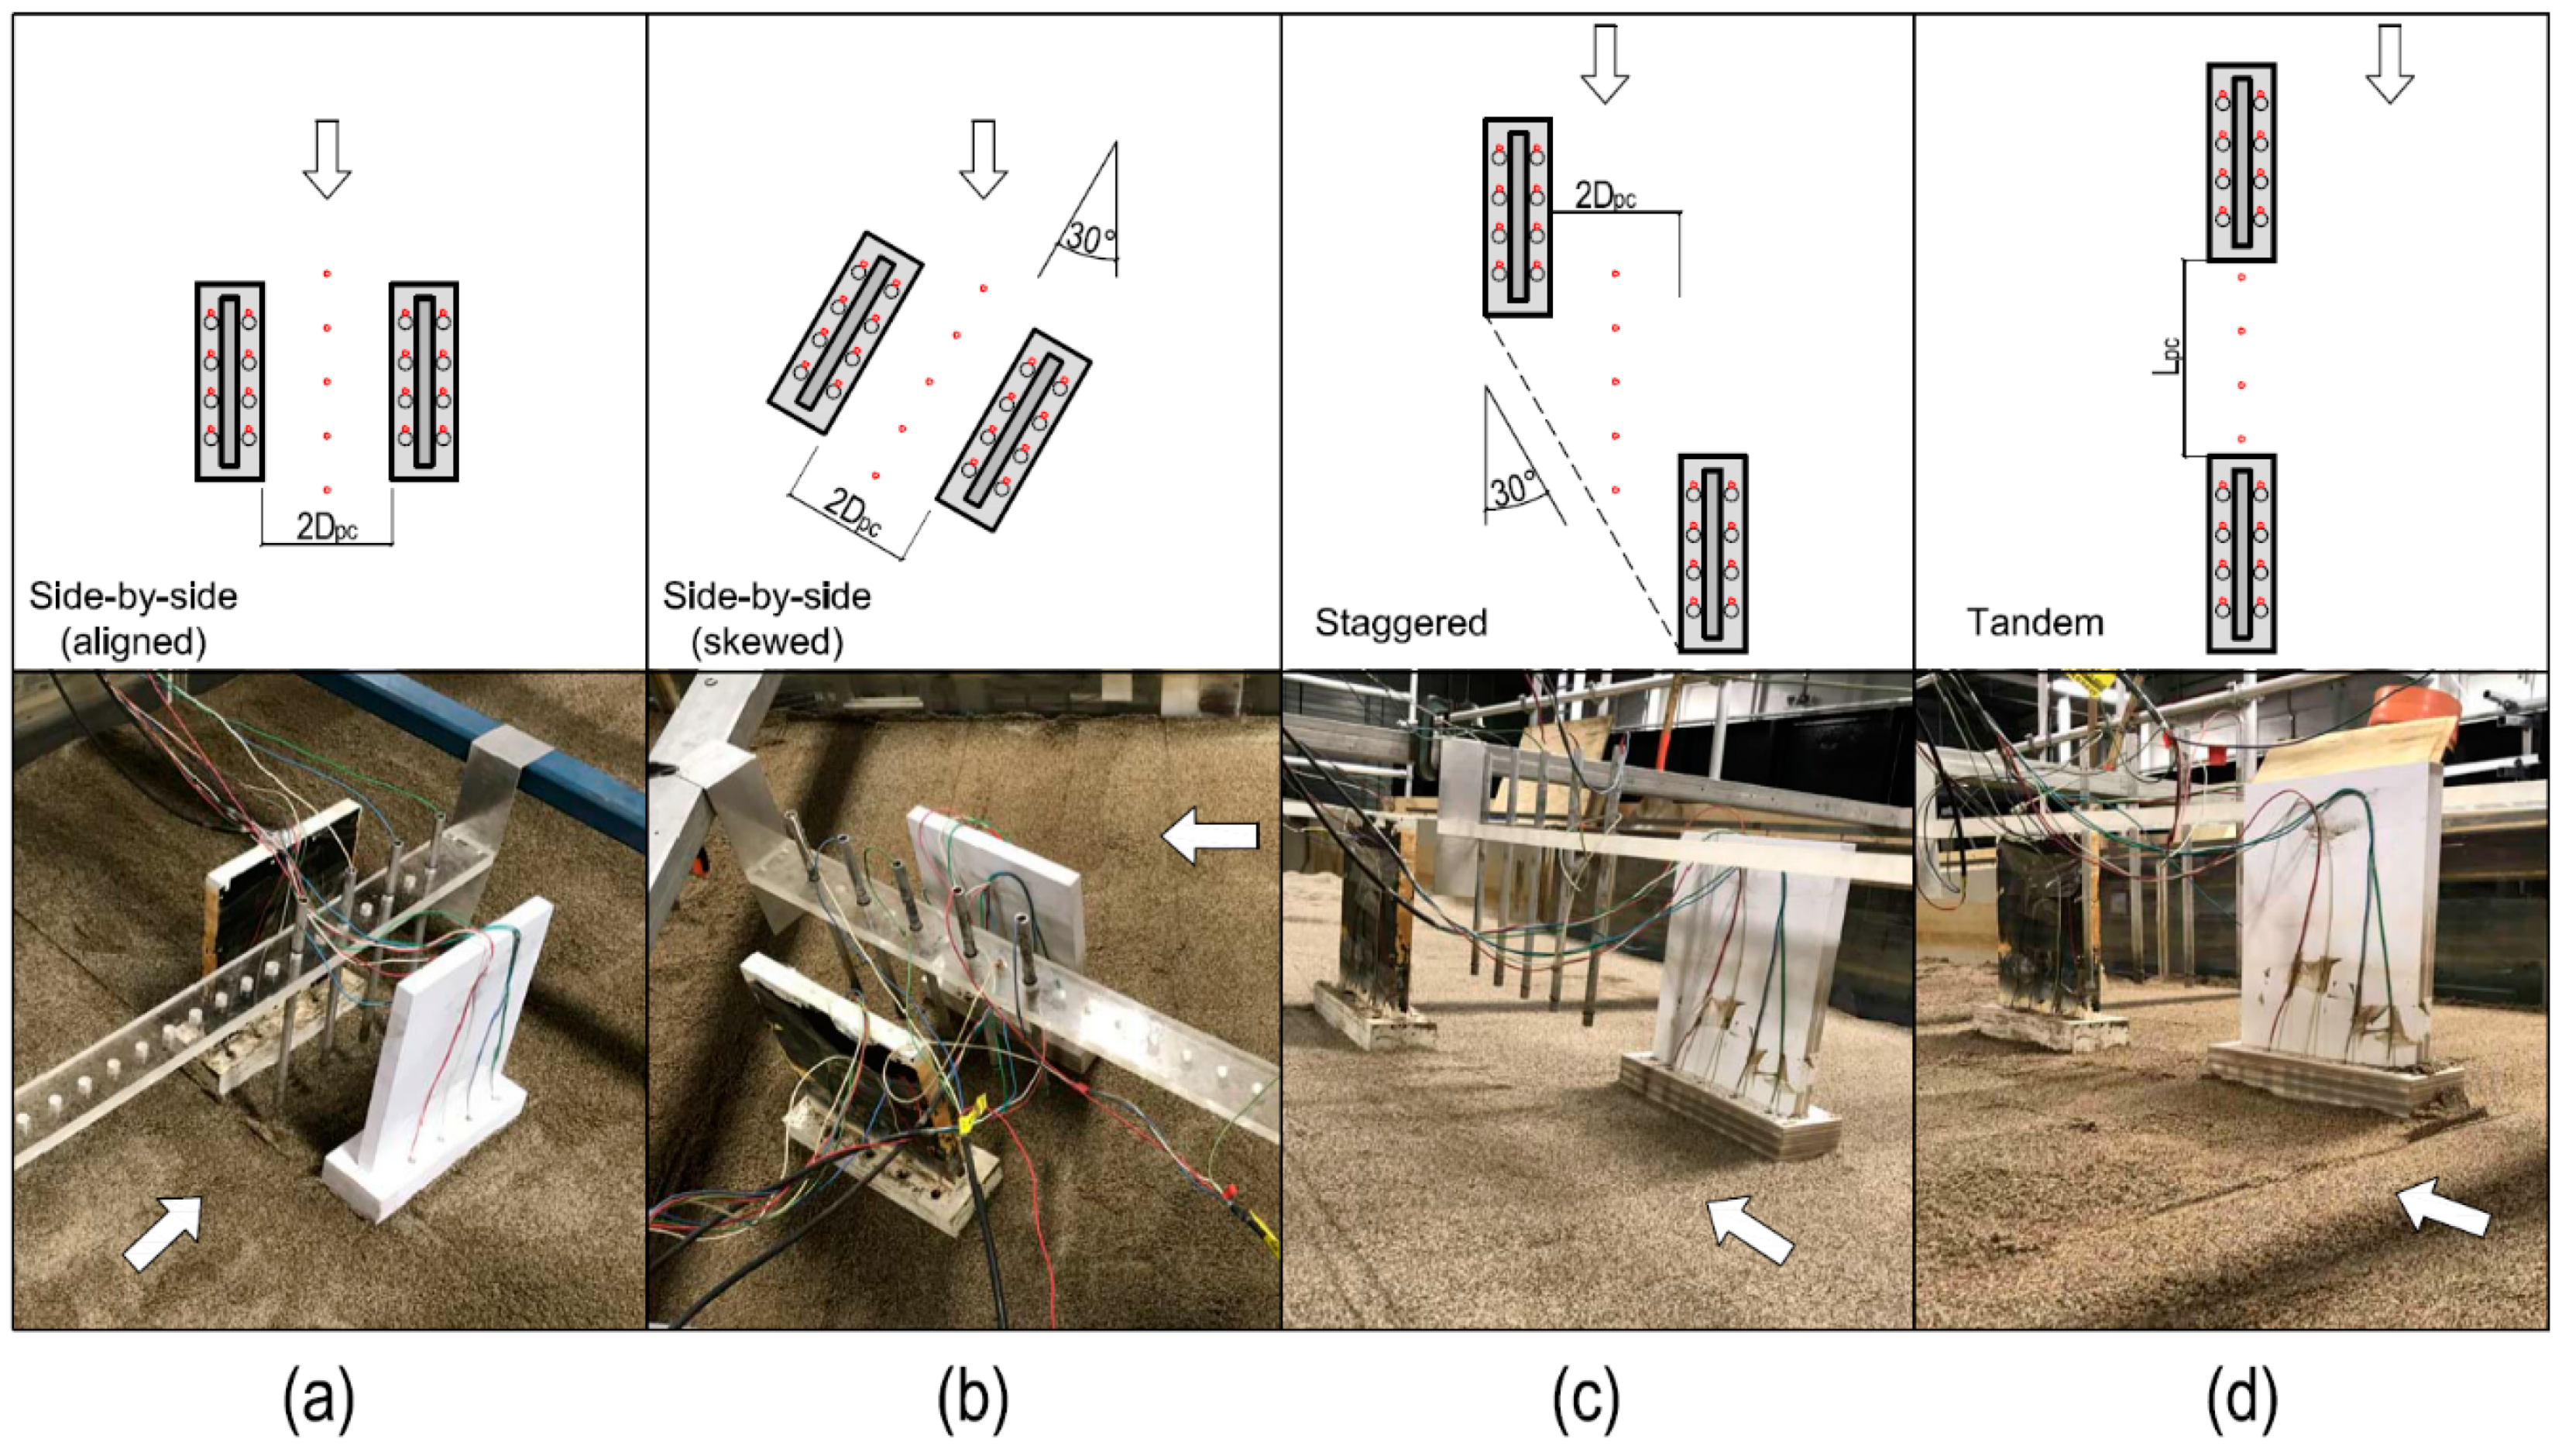
Figure 1. Typical cases of complex bridge piers in close proximity: (a) Maria Skłodowska-Curie Bridge in Warsaw, Poland; (b) Ryde Bridge in Sydney, Australia; (c) Unknown bridge under construction. (Photos from internet).
Water 11 01530 g001
Figure 2. Model shape and dimensions (unit: mm): (a) plan view; (b) front view; and (c) 3-D view.
Water 11 01530 g002
Figure 3. Setup of four different pier arrangement: (a) side-by-side arrangement with aligned flow; (b) side-by-side arrangement with 30 ° skew angle; (c) staggered arrangement; (d) tandem arrangement. The small red circles represent the locations where the multiple transducer array (MTA) transducers were set and real-time bed level data are available.
Water 11 01530 g003
Figure 4. Definition and numbering scheme of the MTA transducers.
Water 11 01530 g004
Figure 5. Temporal evolution of clear-water scour depths ( U / U c = 0.9) measured with: (a) side-by-side arrangement without skew angle; (b) side-by-side arrangement with 30° skew angle; (c) staggered arrangement; and (d) tandem arrangement.
Water 11 01530 g005
Figure 6. Equilibrium bed-levels: (a) side-by-side arrangement without skew angle; (b) side-by-side arrangement with 30° skew angle; (c) staggered arrangement; and (d) tandem arrangement. The measuring locations can also be referred in Figure 3 for more detailed information.
Water 11 01530 g006
Figure 7. Relationship between equilibrium mean scour depth and flow intensity ratio at various locations. (a) side-by-side: aligned; (b) side-by-side: skewed; (c) staggered; and (d) tandem.
Water 11 01530 g007
Figure 8. Live-bed scour range between adjacent piers. The embedded subplots show the trend of mean scour fluctuation at each measuring location. (a) side-by-side: aligned; (b) side-by-side: skewed; (c) staggered; and (d) tandem.
Water 11 01530 g008
Figure 9. Cross-correlation analysis for the four different pier arrangements in the present study ( U / U c = 2.2). (a) side-by-side: aligned; (b) side-by-side: skewed; (c) staggered; and (d) tandem.
Water 11 01530 g009
Figure 10. Scour comparison with single complex pier without proximity and performance of predictors. (a) side-by-side: aligned; (b) side-by-side: skewed; (c) staggered; and (d) tandem.
Water 11 01530 g010
Table 1. Experimental design ( D p c = pile-cap width, L p c = pile-cap length).
SeriesPier ArrangementPier AlignmentPier DistanceSupporting the Same Bridge Deck?
1Side-by-sideAligned2 D p c Yes
2Side-by-side30° skewed2 D p c Yes
3StaggeredAligned2 D p c No
4TandemAligned L p c No

